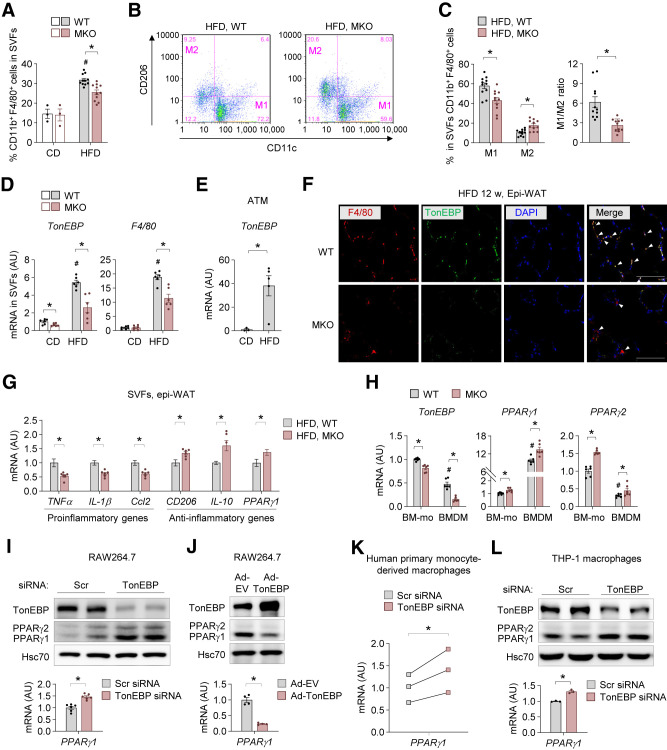
Figure 3.
TonEBP deficiency promotes macrophage polarization toward improvement of insulin sensitivity. A–C: Flow cytometry analysis of cells isolated from SVFs of epi-WAT from MKO and WT mice fed CD (n = 3) or HFD (n = 11) for 12 weeks. A: Percentage of total macrophages (CD11b+F4/80+) in SVFs. B: Representative flow cytometry plots showing the frequencies of M1 (CD11c+CD206−) and M2 (CD11c−CD206+) macrophages within the macrophage population in mice fed HFD. C: Quantification of M1 and M2 macrophages (left) and the M1-to-M2 ratio (right). D: mRNA levels of TonEBP and F4/80 in SVFs of epi-WAT from mice fed HFD (n = 6). E: ATMs were isolated from SVFs of epi-WAT from WT mice fed CD (n = 3) or HFD (n = 5) for 12 weeks with anti-CD11b antibody coupled to magnetic beads. mRNA levels of TonEBP. F: Representative images of immunofluorescence staining of F4/80 (red), TonEBP (green), and DAPI (blue) in epi-WAT from WT and MKO mice fed HFD for 12 weeks (n = 3). Colocalization of F4/80 and TonEBP is shown in yellow in the merged image (arrows). Scale bar, 50 μm. G: mRNA levels of metabolically activated pro- and anti-inflammatory genes in SVFs of epi-WAT from mice fed HFD (n = 6). H: mRNA levels of TonEBP, PPARγ1, and PPARγ2 in BM-Mo and BMDMs from WT and MKO mice (n = 6). I: Representative protein levels of TonEBP and PPARγ (top) and mRNA levels of PPARγ1 (bottom) in RAW264.7 cells transfected with Scr or TonEBP-targeted siRNA (n = 3). J: Representative protein levels of TonEBP and PPARγ (top) and mRNA levels of PPARγ1 (bottom) in RAW264.7 cells infected with adenovirus expressing TonEBP (Ad-TonEBP) or empty vector (Ad-EV) (n = 4). K: mRNA levels of PPARγ1 in primary human monocyte–derived macrophages transfected with Scr or TonEBP-targeted siRNA. Primary human mononuclear cells were isolated from blood, and monocytes were further purified using CD14 microbead positive selection. The macrophages were obtained from a 7-day culture with human M-CSF (20 ng/mL), and transfected with the indicated siRNA (n = 3). L: Representative protein levels of TonEBP and PPARγ (top) and mRNA levels of PPARγ1 (bottom) in THP-1–derived macrophages transfected with Scr or TonEBP-targeted siRNA (n = 6). n represents the number of biologically independent animals (or samples) (A–H and K) or independent experiments with at least two replicates (I, J, and L). All data are presented as mean ± SEM. (or SD). P values were determined with ANOVA with Tukey post hoc test. #P < 0.05 vs. CD or BM-Mo (H). *P < 0.05. mRNA levels were normalized to those of cyclophilin A (internal control). mRNA levels in SVFs were further normalized to those of F4/80 to correct for the amount of macrophages (G). AU, arbitrary units.

