Figure 6.
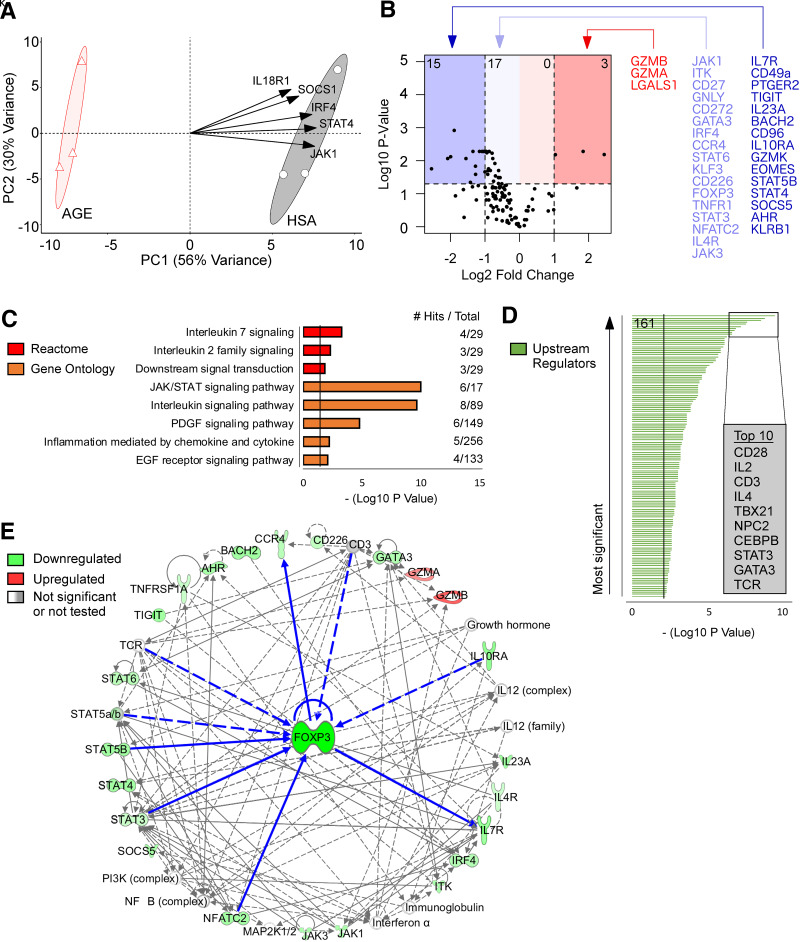
AGE treatment of human nTregs downregulates key genes for suppressive function and manipulates signaling cascades upstream and downstream of FOXP3. A: PCA with the top five variable loadings shown as arrows. B: Volcano plot visualization for changes in gene expression (number of differentially expressed genes shown in top corners). C: Pathway enrichment analysis with use of the Reactome and Gene Ontology databases. D: Upstream regulator predictions with use of Ingenuity Pathway Analysis (161 significant regulators were identified). E: Network analysis with FOXP3 as the focus node. Neighboring molecules are connected to FOXP3 with bolded blue lines. All other molecules are two to three nodes adjacent to FOXP3. Direct relationships are shown as solid lines, and indirect relationships are shown as dashed lines. n = 3/group. P values were corrected with false discovery rate or Bonferroni adjustment. PC1, principal component 1.

