Abstract
Multiple sclerosis (MS) is a chronic autoimmune inflammatory disease that affects the nervous system. Peripheral blood leukocyte telomere length (LTL) and mitochondrial DNA copy number (mtDNA-CN) are potential biomarkers of neurological disability and neural damage. Our objective was to assess the LTL and mtDNA-CN in relapsing-remitting MS (RRMS). We included 10 healthy controls, 75 patients with RRMS, 50 of whom had an Expanded Disability Status Scale (EDSS) from 0 to 3 (mild to moderate disability), and 25 had an EDSS of 3.5 to 7 (severe disability). We use the Real-Time Polymerase Chain Reaction (qPCR) technique to quantify absolute LTL and absolute mtDNA-CN. ANOVA test show differences between healthy control vs. severe disability RRMS and mild-moderate RRMS vs. severe disability RRMS (p = 0.0130). LTL and mtDNA-CN showed a linear correlation in mild-moderate disability RRMS (r = 0.378, p = 0.007). Furthermore, we analyzed LTL between RRMS groups with a ROC curve, and LTL can predict severe disability (AUC = 0.702, p = 0.0018, cut-off < 3.0875 Kb, sensitivity = 75%, specificity = 62%), whereas the prediction is improved with a logistic regression model including LTL plus age (AUC = 0.762, p = 0.0001, sensitivity = 79.17%, specificity = 80%). These results show that LTL is a biomarker of disability in RRMS and is correlated with mtDNA-CN in mild-moderate RRMS patients.
Keywords: leukocyte telomere length, mitochondrial DNA, relapsing-remittent multiple sclerosis, disability, aging
1. Introduction
Multiple sclerosis (MS) is a chronic autoimmune disease of multifactorial origin (genetic susceptibility and environmental factors) characterized by heterogeneous neurological dysfunction and clinical features secondary to damage to the central and peripheral nervous systems [1,2,3]. Globally, MS is the leading non-traumatic cause of neural disability in young adults, affecting approximately 2.8 million people [4]. Demyelination and axonal loss in the central nervous system (CNS), mediated by an inflammatory and a subsequent neurodegenerative phase, are crucial for the episodic and irreversible progression of MS [5]. Initially, MS patients may have mild psychological and cognitive impairments which progress over time to severe neurological and motor limitations [6,7]. These MS neurodegenerative changes are assessed using the Expanded Disability Status Scale (EDSS) based on well-defined clinical and imaging parameters. According to this scale, patients are graded from 0 (no signs, no symptoms) to 10 (death) [8,9,10,11]. MS patients can have different phenotypes: (1) primary progressive multiple sclerosis (PPMS), which manifests episodes of neurological dysfunction, is progressive, and without recovery; (2) relapsing-remitting multiple sclerosis (RRMS), characterized by episodes of neurological dysfunction with full or partial recovery, and (3) secondary progressive multiple sclerosis (SPMS), which results from RRMS and acquires a similar pattern of progressive dysfunction to PPMS without recovery [12]. The mechanisms of neuroinflammation in MS resemble those of aging, but in patients with MS, they appear to be activated earlier in life, exhibit greater intensity, and ultimately affect the course of the disease [13]. It has been described that the central molecular mechanisms that regulate aging are shared with the pathogenesis of most chronic-degenerative diseases, such as cellular inflammation, mitochondrial damage, and telomere size shortening, mediated mainly by oxidative stress generated by reactive oxygen species (ROS). Therefore, the study of these common pathways is of current interest in MS research [14].
The telomere implication with aging relies on the fact that telomeres are nucleoprotein structures that protect the ends of chromosomes, prevent detrimental structural changes such as intrachromosomal fusion, provide genomic stability, and regulate cellular senescence [15,16]. Telomere shortening has been associated with MS as independent of age and correlated with more significant disability, lower brain volume, higher recurrence rate, and shorter conversion time from relapsing to progressive MS [17,18,19]. There is strong evidence that telomere measurement in leukocytes is a useful tool to be considered as a biomarker in the future since leukocytes are a niche of hematopoietic cells that circulate throughout the body and are sensitive to pathophysiological changes that occur over time [20].
Another key factor associated with cellular aging and neurodegeneration in MS is mitochondrial deficiency [21,22]. Analyses of mitochondrial DNA (mtDNA) in MS showed a significant decrease in mitochondrial DNA copy number (mtDNA-CN) in cerebrospinal fluid and lymphocytes of MS patients compared with control subjects [22,23]. Also, the study by Al-Kafaji et al. (2020) showed a significant decrease in mtDNA-CN in RRMS patients with more than ten years of MS diagnosis compared with those patients with less than ten years of diagnosis [22].
In the present study, we aim to evaluate mtDNA-CN and leukocyte telomere length (LTL) as prognostic biomarkers of severe disability in RRMS patients. Research on the link between aging and neurodegeneration may help classify MS patients based on their current disease status or prognosis and may lead to better therapeutic strategies to prevent accelerated aging and deterioration of MS.
2. Results
2.1. Patients
All participants are Mexican mestizos with Mexican parents [24]. Patients were randomly selected from the local RRMS cohort. The sex distribution, mean age, and clinical phenotypes of patients are similar to that observed in western Mexico for RRMS [25]. Healthy controls were obtained from the general population. The age was 40.6 ± 8.73, and there was no statistical difference vs. RRMS patients. Demographic and treatment data of the 75 patients are presented in Table 1. In the RRMS patients, the age was 39.4 ± 11.5, the years since diagnosis was 8.60 ± 5.88, the progression rate was 0.67 ± 0.83, and the EDSS 2.9 ± 1.71. There was no significant difference in sex, age, or time since diagnosis between groups. There were significant differences regarding progression rate (progression rate = EDSS/year with the disease) * p = 0.00145 and EDSS * p = 0.00001. Most RRMS patients (50%) were treated with Glatiramer Acetate; the second drug was Interferon β with 25%.
Table 1.
Demographic characteristics of RRMS patients and their pharmacological treatments.
| Characteristic | Mild-Moderate Disability EDSS 0–3 (n = 50) |
Severe Disability EDSS 3.5–7 (n = 25) |
p-Value |
|---|---|---|---|
| Female | 33 (66%) | 17 (68%) | NS |
| Male | 17 (34%) | 8 (32%) | NS |
| Age | 37.7 ± 11.4 | 43.0 ± 11.1 | NS |
| Years since diagnosis | 7.78 ± 5.12 | 10.2 ± 6.99 | |
| EDSS ‡ | 1.91 ± 0.88 | 4.9 ± 1.11 | * 0.00001 |
| Progression rate | 0.51 ± 0.63 | 0.99 ± 1.09 | * 0.00145 |
| Treatment: | |||
| Glatiramer Acetate | 19 (38%) | 9 (36%) | NS |
| Rituximab | 4 (8%) | 3 (12%) | |
| Interferon β | 14 (28%) | 5 (2%) | |
| Fingolimod | 5 (10%) | 2 (8%) | |
| Azathioprine | 0 | 3 (12%) | |
| Natalizumab | 1 (2%) | 1 (4%) | |
| Dimethyl fumarate | 3 (6%) | 1 (4%) | |
| None | 4 (8%) | 1 (4%) |
‡ EDSS = Expanded Disability Status Scale. Progression rate = EDSS/years with the disease. Comparisons were performed with the t-test, Mann–Whitney test, or χ2, as appropriate. * significant, NS (Not Significant).
2.2. LTL and mtDNA-CN in Healthy Controls, Mild-Moderate Disability, and Severe Disability
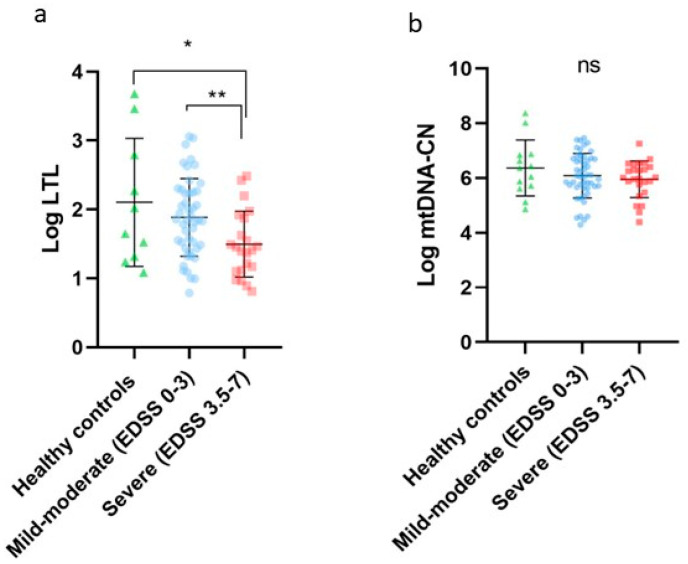
LTL in the healthy controls group was 5.26 Kb, the mild-moderate disability group (EDSS 0–3) was 3.98 Kb, and the severe disability group (EDSS 3.5–7) was 2.98 Kb. For comparisons of Log LTL (2.10 ± 0.92 vs. 1.88 ± 0.56 vs. 1.49 ± 0.47) and Log mtDNA-CN (6.36 ± 1.02 vs. 6.08 ± 0.81 vs. 5.95 ± 0.66) between healthy controls, mild-moderate disability (EDSS 0–3) and severe disability (EDSS 3.5–7), we performed one-way ANOVA (p = 0.0130) and obtained statistical significance between Log LTL healthy controls vs. severe disability (p = 0.0094) and mild-moderate disability vs. severe disability (p = 0.0140). See Figure 1. There was no significant difference in the frequency of treatments of both RRMS groups, and there was no association of drugs with LTL and mtDNA-CN (Kruskal–Wallis), p = 0.193 and 0.471, respectively.
Figure 1.
(a) Log LTL in RRMS patients; healthy controls (green), mild-moderate disability EDSS 0–3 (blue), and severe disability EDSS 3.5–7 (red). * p = 0.0094; ** p = 0.0140, and one-way ANOVA p = 0.0130. (b) Log mtDNA-CN in RRMS patients: healthy controls (green), mild-moderate disability (blue), and severe disability (red) p = 0.337. (ns) not significant.
2.3. LTL and mtDNA-CN Correlation
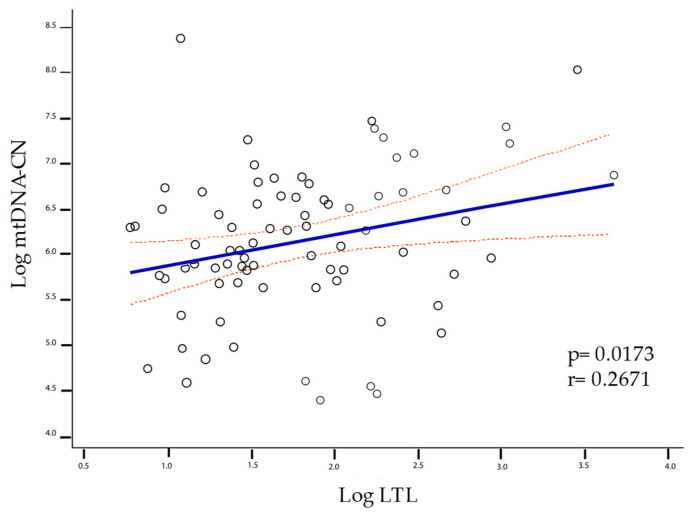
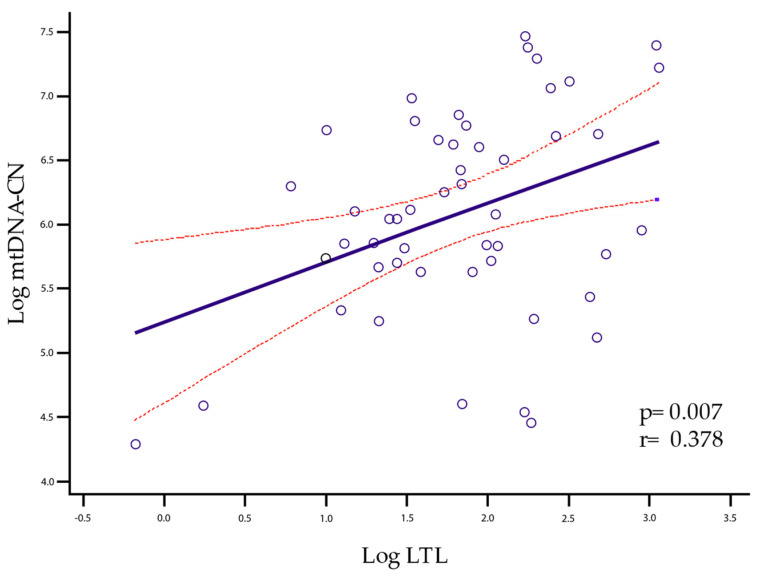
The correlation of LTL with mtDNA-CN is given when all individuals are grouped into a single cluster (healthy controls, mild-moderate disability, and severe disability) for which the Pearson test was performed, yielding a p = 0.0173, r = 0.2671 (Figure 2). However, when analyzing group by group, significance was only maintained in the mild-moderate group with p = 0.007 and r = 0.378 (Figure 3).
Figure 2.
Linear correlation between LTL and mtDNA-CN was significant for all groups (p = 0.0173, r = 0.2671). The solid line represents the regression line, and the dashed lines represent the confidence interval of 95%.
Figure 3.
Linear correlation between LTL and mtDNA-CN was significant for the mild-moderate group (p = 0.007, r = 0.378). The solid line represents the regression line, and the dashed lines represent the confidence interval of 95%.
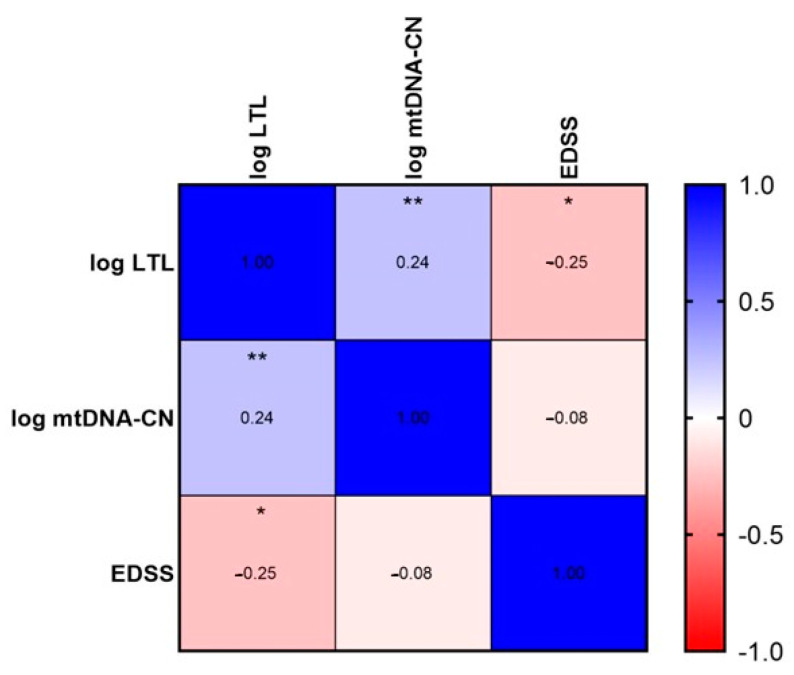
On the other hand, all patients with RRMS grouped together showed a significant correlation in LTL with EDSS and LTL with mtDNA-CN (Spearman’s test yielded a p = 0.034 for LTL and EDSS and a p = 0.038 for LTL and mtDNA-CN) (Figure 4); consistent with correlations found with Pearson’s test between LTL and mtDNA-CN.
Figure 4.
Spearman correlation test was performed with a * p = 0.034 for LTL and EDSS and a ** p = 0.038 for LTL and mtDNA-CN.
2.4. Prediction of Disability by LTL
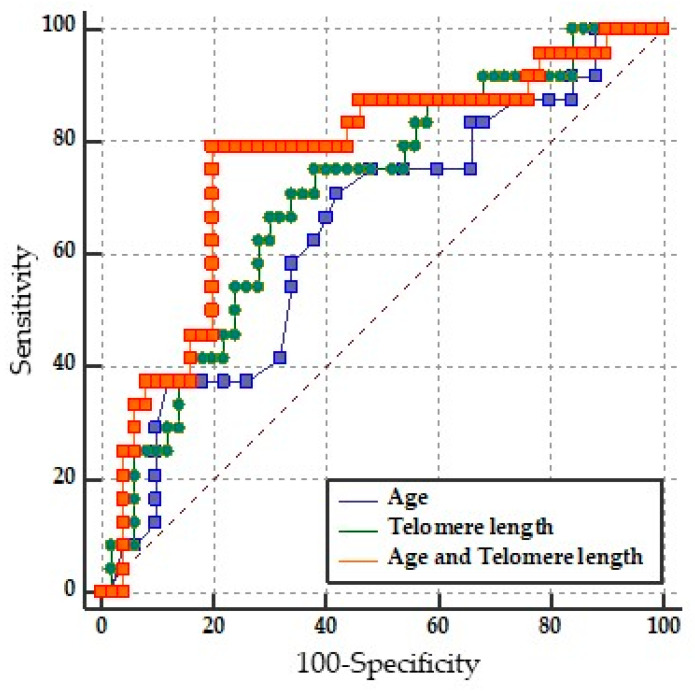
LTL performance in discriminating between mild-moderate disability vs. severe disability was assessed on a ROC curve. An area under the curve (AUC) of 0.702 and a p = 0.0018 were obtained. The cut-off point was ≤3.08 Kb, which showed a sensitivity of 75% and specificity of 62%, a PPV of 48.6%, and an NPV of 83.3%. This indicates that LTL alone in the RRMS group can acceptably discriminate between mild-moderately vs. severely disabled patients. See the green line (Figure 5).
Figure 5.
Pairwise comparison of ROC curves of LTL (raw data), age (raw data), and LTL and age (binary logistic regression).
2.5. Binary Logistic Regression Model of LTL and Age
In the multivariable logistic regression model, only LTL maintained statistical significance when controlling variables in the Wald test, as can be seen in Table 2. When analyzing age and LTL together in the model, discriminative performance improved, which did not occur with other variables (see Table 3).
Table 2.
The binary logistic regression model evaluated characteristics to predict severe disability in patients with RRMS.
| Variable | Odds Ratio | 95% CI | p-Value |
|---|---|---|---|
| LTL * | 0.3458 | 0.1384 to 0.8641 | * p = 0.0230 |
| mtDNA-CN | 1.0723 | 0.4792 to 2.3994 | p = 0.8651 |
| Age | 1.0205 | 0.9686 to 1.0753 | p = 0.4457 |
| Sex (female) | 1.0687 | 0.3369 to 3.3899 | p = 0.9102 |
| Years since diagnosis | 1.0702 | 0.9698 to 1.1810 | p = 0.1771 |
LTL: Leukocyte telomere length; mtDNA-CN: Mitochondrial DNA copy number. * p = 0.0230, Wald’s test. CI: Confidence interval.
Table 3.
Model comparison analysis.
| Variable | AUC | 95% CI | p-Value |
|---|---|---|---|
| Age | 0.635 | 0.516 to 0.743 | * p = 0.0488 |
| LTL | 0.702 | 0.584 to 0.803 | * p = 0.0018 |
| LTL and Age | 0.762 | 0.649 to 0.854 | * p = 0.0001 |
| Pairwise comparison of ROC curves | |||
| Age vs. Age + LTL | 0.0122 to 0.231 | * p = 0.0294 | |
| LTL vs. Age + LTL | −0.0210 to 0.143 | p = 0.1452 | |
| Age vs. LTL | −0.113 to 0.235 | p = 0.4925 |
LTL: Leukocyte Telomere Length; AUC: Area under the ROC curve. Age, LTL, and LTL and age with significance: * p = 0.0488, * p = 0.0018, and * p = 0.0001. Pairwise comparison of ROC curves was significant only in Age vs. Age + LTL * p = 0.0294.
LTL and age together had the highest precision and were the most appropriate for predicting disability according to the Akaike criteria (AUC = 0.762, p = 0.0001, sensitivity = 79.17%, specificity = 80.00%, PPV = 65.5 and NPV = 88.9%). See Table 3. The pairwise comparison of the ROC curves between LTL and age together versus LTL alone did not reach significance (p = 0.1452); therefore, the equivalence of the models LTL alone and age vs. LTL was not ruled out, as shown in Table 3. This means that the factor responsible for the predictive ability is LTL, not age.
3. Discussion
In recent years, MS has been approached from the perspective of biological senescence. As a trigger for cellular and immunological changes, aging is involved in the development of neuroinflammation and neurodegeneration, resulting in the disability of MS patients. Among the multiple factors that account for neurodegeneration, accelerated neurological aging occurs in MS, and telomeres play an important role in this process. Telomeres are found at the ends of chromosomes and are made up of repeats of the hexanucleotide, non-coding sequence, TTAGGG [15,16]. Changes in telomeres contribute to the pathogenesis of several multifactorial chronic diseases, like neurological disorders. It has been shown that loss of chromosomal integrity due to the shortening of telomere length facilitates fusions with other chromosomes, mutations, and other events that impair cell function, decrease cell division and lead to cell aging [26,27].
On the other hand, mitochondria are organelles that regulate intracellular calcium homeostasis, ATP generation, programmed cell death (apoptosis), ROS production, and aging processes, which together affect the structure and function of telomeres [28]. Additionally, numerical and structural alterations of the mitochondria are pathogenic, especially in tissues with high energy demand, such as muscle and the CNS [29]. Several studies have shown that age and accelerated aging are factors of neurological deterioration in patients with MS. Nevertheless, age is considered an independent factor in developing a progressive MS phenotype through complex and multidirectional interactions with aging and degenerative processes [30,31]. In this sense, telomeres and mitochondria are two of the most important cellular components in regulating aging and neurodegenerative diseases.
The patients included in this study have a mean age and a proportion of mild-moderate/severe disability similar to that observed in the general Mexican population. The wide variability of the LTL and the mtDNA-CN reflects the interactions of the organisms with environmental factors and the influence of endogenous factors like genes, hormones, and ROS, among others. In particular, up to 70% of the variance of the telomere length (TL) is explained by heritability [32,33]. Although the variability in TL is determined by multiple factors, in the group with a mild-moderate disability, we found a significant linear correlation between LTL and mtDNA-CN (p = 0.007, r = 0.378). This correlation was also found in the all-pooled participants (healthy controls, mild-moderate disability, and severe disability) (p = 0.0173, r = 0.2671). However, when we separated them into distinct groups and analyzed them one by one, only the mild-moderate disability group maintained a significant correlation. This effect could be enhanced or attenuated by other factors related to aging and neurodegeneration processes, such as increased immune activation, chronic inflammation, and age [13,34,35].
The bidirectional interaction between mitochondria and TL, involving different mechanisms related to mitochondrial function (oxidative stress, apoptosis, energy efficiency of the respiratory chain, chronic inflammation), can cause chronic damage leading to telomere shortening. This shortening leads to dysregulation of subtelomeric DNA gene expression [36,37]. As previously described, aging is essential for the progression of MS disability. In fact, senescent changes have been identified in multiple cell lineages of the nervous system that are affected during MS, such as neurons, microglia, oligodendrocytes, and astrocytes [38,39,40,41,42]. In the present study, we compared the absolute quantification of LTL and mtDNA-CN in patients with mild to moderate disability versus patients with severe disability and found significant differences for LTL but not for mtDNA-CN.
Telomere biology and aging play a crucial role in health and disease. In several studies, age has been reported to be one of the most critical factors in converting RRMS to SPMS [43,44,45]. This clinical distinction reflects the underlying neurological damage: in the RRMS phenotype, the damage is predominantly inflammatory, whereas, in the progressive phenotype, it is neurodegenerative [5,46]. Furthermore, LTL can serve as a biomarker of immunosenescence and has also been associated with the progression of neurological damage [44]; Therefore, LTL could be useful for evaluating and predicting disability in patients with MS [47]. In this work, we have found that LTL is an independent predictor of disability. After integrating possible predictors (LTL, mtDNA-CN, gender, age, and time with disease) into the binary logistic regression model, only age and LTL were useful for prediction. The ROC curve for direct LTL values alone has moderate predictive power. The high NPV (83.3%) of LTL identifies it as a relevant biomarker to assess disability status. Although LTL and age are risk factors related to disability, in this study, LTL shortening is the only one that remains an independent factor for MS disability after controlling variables in logistic regression. This is of great importance since age is considered the strongest prognostic factor for MS progression [48]. However, LTL may be as strong or even stronger than age as a predictor of disability status and/or disease progression in MS patients: in the best-performing model (LTL plus age), age may contribute to the cumulative effect of other environmental factors throughout life, even when age is not significant as an independent factor (Table 2).
4. Materials and Methods
4.1. Study Design and Patient Selection
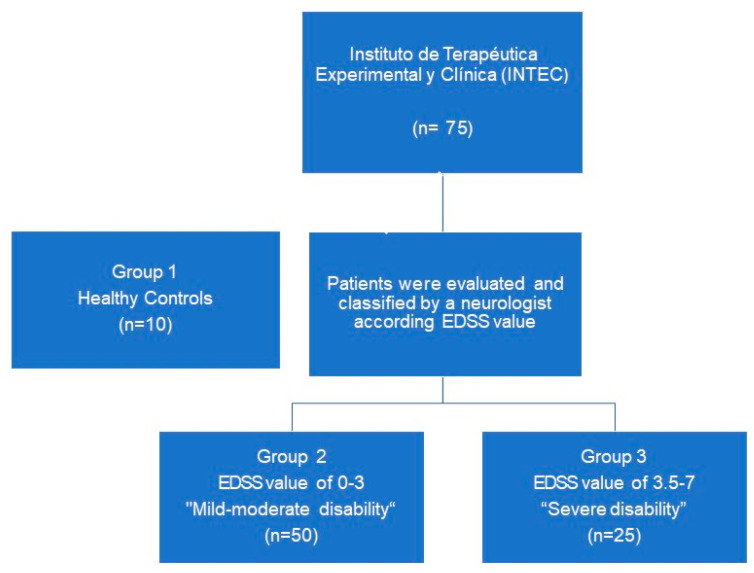
This research is a cross-sectional observational study. Seventy-five patients with RRMS were recruited from the MS cohort of the Instituto de Terapéutica Experimental y Clínica (INTEC), of the Centro Universitario de Ciencias de la Salud (CUCS) of the Universidad de Guadalajara from March to October 2021selected (50 women, 25 men, age range: 18–66 years) and 10 healthy controls, in total 85 patients. All patients with RRMS met McDonald’s diagnostic criteria [49], according to the evaluation and diagnosis by a clinical neurologist, and did not present any comorbidities such as cancer, diabetes, hypertension, or other immunological diseases. Patients were divided into three groups, one group as healthy controls, and the other groups were divided according to the RRMS disability: mild-moderate disability, n = 50 (EDSS from 0–3), and severe disability, n = 25 (EDSS 3.5–7) (Figure 6). In all groups, the parameters of age, time elapsed since disease onset, rate of disease progression, and type of treatment were obtained. This study was conducted in accordance with the Declaration of Helsinki and was approved by the Comité Institucional de ética of CUCS (Study No. CI-03519). Informed consent was obtained from all individual participants included in the study.
Figure 6.
Patient selection flowchart.
4.2. Absolute Quantification of Leukocyte Telomere Length (LTL) and Copy Number of mtDNA-CN
Total venous blood samples were collected to isolate leukocytes, and DNA was extracted by the Miller salting out method and stored at −20 °C until analysis [50]. Quantification of mtDNA-CN and measurement of LTL was evaluated by qPCR with the Absolute Human Telomere Length and Mitochondrial DNA Copy Number Dual Quantification qPCR kit (ScienCell Research Laboratories, Carlsbad, CA) according to the manufacturer’s protocol [51].
As mentioned above, LTL measurement and mtDNA-CN quantification were carried out by polymerase chain reaction (PCR). The PCR reaction (per sample) was composed of: 10 μL of 2XGoldNStart TaqGreen qPCR master mix, 2 μL of primer solution (Tel, mtDNA, or a single copy reference, SCR), 7 μL of nuclease-free water, and 1μL of test DNA (5 ng). The conditions of each thermal cycle were carried out as follows: denaturation at 95 °C for 10 min, followed by 32 cycles with denaturation at 95 °C for 20 s, hybridization at 52 °C for 20 s, and extension at 72 °C for 45 s. Finally, a region of 100 bp in length on chromosome 17 was recognized by the first set of SCR and reference DNA with a known concentration of telomere length 348 ± 11 kb per diploid cell and mtDNA-CN of 1.27 ± 0.03 × 10³ copies per diploid cell [52].
4.3. Statistical Analysis
Descriptive statistics represented the data of each group. Normality was evaluated using the D’Agostino-Pearson test. The outliners were identified using the Rout method. For comparisons between groups of healthy controls vs. mild-moderate disability vs. severe disability, an ANOVA test was applied for variables with normal distribution; for variables with non-normal distribution, the Mann–Whitney U test was used. The chi-square or Fisher’s exact test was used for qualitative data comparisons. The predictive performance (sensitivity, specificity, and positive and negative predictive value) was evaluated with ROC curves. Binary logistic regression models were developed, and the Akaike information criterion and the Z statistic were used to compare and select models. The cut-off point was obtained through the Youden index. Analyses were performed with GraphPad Prism version 9.02 for Windows (La Jolla, CA, USA; www.graphpad.com (accessed on 12 December 2022)) and MedCalc Statistical Software version 15.8 (Ostend, Belgium; www.medcalc.org (accessed on 12 December 2022)).
5. Conclusions
Our study is the first to correlate LTL and mtDNA-CN in RRMS patients with mild to moderate disability. These biomarkers may be useful to unravel the molecular mechanisms involved in the process of neuroinflammation, neurodegeneration, and aging, as well as their relationship with the structure and function of telomeres and mitochondria in MS. However, more studies are required. In particular, longitudinal studies with larger samples are needed to address the different MS phenotypes and thus establish the clinical utility of LTL and mtDNA-CN for assessing and predicting disability.
Acknowledgments
We are deeply grateful to Horacio Rivera Ramirez for properly revising this manuscript.
Author Contributions
The conceptualization and methodology of this research were created by J.A.C.-R.; G.d.C.L.-A. and M.E.R.-M.; A.Z.-M. supported validation of qPCR; formal analysis, J.A.C.-R.; investigation and sample collection by M.Á.M.-I. and A.M.S.-C.; data curation, J.A.C.-R. and F.S.-L.; writing—original draft preparation, J.A.C.-R.; G.d.C.L.-A. and M.E.R.-M.; writing—review and editing, J.A.C.-R.; G.d.C.L.-A., M.E.R.-M. and M.N.-M.; visualization by A.M.S.-C.; supervision, M.Á.M.-I.; funding acquisition, J.A.C.-R. All authors have read and agreed to the published version of the manuscript.
Institutional Review Board Statement
The study was conducted according to the guidelines of the Declaration of Helsinki and approved by the ethics committee of the CUCS with the number CI-03519.
Informed Consent Statement
Informed consent was obtained from all subjects involved in the study.
Data Availability Statement
https://figshare.com/articles/dataset/TLT_mtDNA_MS/17097470 (accessed on 12 December 2022).
Conflicts of Interest
The authors declare no conflict of interest.
Funding Statement
This research was supported by PROSNI 2021 with the number funding 237086 of the University of Guadalajara.
Footnotes
Disclaimer/Publisher’s Note: The statements, opinions and data contained in all publications are solely those of the individual author(s) and contributor(s) and not of MDPI and/or the editor(s). MDPI and/or the editor(s) disclaim responsibility for any injury to people or property resulting from any ideas, methods, instructions or products referred to in the content.
References
- 1.Goodin D.S. The causal cascade to multiple sclerosis: A model for MS pathogenesis. PLoS ONE. 2009;4:4565. doi: 10.1371/journal.pone.0004565. [DOI] [PMC free article] [PubMed] [Google Scholar]
- 2.Goodin D.S. Chapter 11—The epidemiology of multiple sclerosis: Insights to disease pathogenesis. In: Goodin D.S., editor. Multiple Sclerosis and Related Disorders. Vol. 122. Elsevier; Amsterdam, The Netherlands: 2014. pp. 231–266. [DOI] [PubMed] [Google Scholar]
- 3.Goodin D.S. The epidemiology of multiple sclerosis: Insights to a causal cascade. Handb. Clin. Neurol. 2016;138:173–206. doi: 10.1016/B978-0-12-802973-2.00011-2. [DOI] [PubMed] [Google Scholar]
- 4.Walton C., King R., Rechtman L., Kaye W., Leray E., Marrie R.A., Robertson N., Rocca N.L., Uitdehaag B., van der Mei I., et al. Rising prevalence of multiple sclerosis worldwide: Insights from the Atlas of MS, third edition. Mult. Scler. J. 2020;26:1816–1821. doi: 10.1177/1352458520970841. [DOI] [PMC free article] [PubMed] [Google Scholar]
- 5.Reich D.S., Lucchinetti C.F., Calabresi P.A. Multiple Sclerosis. N. Engl. J. Med. 2018;378:169–180. doi: 10.1056/NEJMra1401483. [DOI] [PMC free article] [PubMed] [Google Scholar]
- 6.Confavreux C., Vukusic S. Natural history of multiple sclerosis: A unifying concept. Brain. 2006;129:606–616. doi: 10.1093/brain/awl007. [DOI] [PubMed] [Google Scholar]
- 7.Macías Islas M.Á., Ciampi E. Assessment and Impact of Cognitive Impairment in Multiple Sclerosis: An Overview. Biomedicines. 2019;7:22. doi: 10.3390/biomedicines7010022. [DOI] [PMC free article] [PubMed] [Google Scholar]
- 8.Cadavid D., Tang Y., O’Neill G. Responsiveness of the Expanded Disability Status Scale (EDSS) to disease progression and therapeutic intervention in progressive forms of multiple sclerosis. Rev. Neurol. 2010;51:321–329. [PubMed] [Google Scholar]
- 9.Kurtzke J.F. Rating neurologic impairment in multiple sclerosis: An expanded disability status scale (EDSS) Neurology. 1983;33:1444–1452. doi: 10.1212/WNL.33.11.1444. [DOI] [PubMed] [Google Scholar]
- 10.Kurtzke J.F. On the origin of EDSS. Mult. Scler. Relat. Disord. 2015;4:95–103. doi: 10.1016/j.msard.2015.02.003. [DOI] [PubMed] [Google Scholar]
- 11.Şen S. Neurostatus and EDSS Calculation with Cases. Noro Psikiyatr. Ars. 2018;55:S80–S83. doi: 10.29399/npa.23412. [DOI] [PMC free article] [PubMed] [Google Scholar]
- 12.Lublin F.D., Reingold S.C., Cohen J.A., Cutter G.R., Sørensen P.S., Thompson A.J., Wolinsky J.S., Balcer L.J., Banwell B., Barkhof F., et al. Defining the clinical course of multiple sclerosis: The 2013 revisions. Neurology. 2014;83:278–286. doi: 10.1212/WNL.0000000000000560. [DOI] [PMC free article] [PubMed] [Google Scholar]
- 13.Musella A., Gentile A., Rizzo F.R., De Vito F., Fresegna D., Bullitta S., Vanni V., Guadalupi L., Bassi M.S., Buttari F., et al. Interplay between age and neuroinflammation in multiple sclerosis: Effects on motor and cognitive functions. Front. Aging Neurosci. 2018;10:238. doi: 10.3389/fnagi.2018.00238. [DOI] [PMC free article] [PubMed] [Google Scholar]
- 14.Patergnani S., Fossati V., Bonora M., Giorgi C., Marchi S., Missiroli S., Rusielewicz T., Wieckowski M.R., Pinton P. Mitochondria in Multiple Sclerosis: Molecular Mechanisms of Pathogenesis. Int. Rev. Cell Mol. Biol. 2017;328:49–103. doi: 10.1016/BS.IRCMB.2016.08.003. [DOI] [PubMed] [Google Scholar]
- 15.Saretzki G. Telomeres, Telomerase and Ageing. Subcell. Biochem. 2018;90:221–308. doi: 10.1007/978-981-13-2835-0_9. [DOI] [PubMed] [Google Scholar]
- 16.Moyzis R.K., Buckingham J.M., Cram L.S., Dani M., Deaven L.L., Jones M.D., Meyne J., Ratliff R.L., Wu J.R. A highly conserved repetitive DNA sequence, (TTAGGG)n, present at the telomeres of human chromosomes. Proc. Natl. Acad. Sci. USA. 1988;85:6622–6626. doi: 10.1073/pnas.85.18.6622. [DOI] [PMC free article] [PubMed] [Google Scholar]
- 17.Bühring J., Hecker M., Fitzner B., Zettl U.K. Systematic review of studies on telomere length in patients with multiple sclerosis. Aging Dis. 2021;12:1272–1286. doi: 10.14336/AD.2021.0106. [DOI] [PMC free article] [PubMed] [Google Scholar]
- 18.Ma Y., Wang M., Chen X., Ruan W., Yao J., Lian X. Telomere length and multiple sclerosis: A Mendelian randomization study. Int. J. Neurosci. 2022;13:1–5. doi: 10.1080/00207454.2022.2098737. [DOI] [PubMed] [Google Scholar]
- 19.Shu M.-J., Li J., Zhu Y.-C. Genetically predicted telomere length and multiple sclerosis. Mult. Scler. Relat. Disord. 2022;60:103731. doi: 10.1016/j.msard.2022.103731. [DOI] [PubMed] [Google Scholar]
- 20.Montpetit A., Alhareeri A., Montpetit M., Starkweather A., Elmore L., Filler K., Mohanraj L., Burton C., Menzies V., Lyon D., et al. Telomere Length A Review of Methods for Measurement. Nurs. Res. 2014;63:289–299. doi: 10.1097/NNR.0000000000000037. [DOI] [PMC free article] [PubMed] [Google Scholar]
- 21.Mao P., Reddy P.H. Is multiple sclerosis a mitochondrial disease? Biochim. Biophys. Acta. Mol. Basis Dis. 2010;1802:66. doi: 10.1016/j.bbadis.2009.07.002. [DOI] [PMC free article] [PubMed] [Google Scholar]
- 22.Al-Kafaji G., Bakheit H.F., Alharbi M.A., Farahat A.A., Jailani M., Ebrahin B.H., Bakhiet M. Mitochondrial DNA Copy Number in Peripheral Blood as a Potential Non-invasive Biomarker for Multiple Sclerosis. Neuromol. Med. 2020;22:304–313. doi: 10.1007/s12017-019-08588-w. [DOI] [PubMed] [Google Scholar]
- 23.Lowes H., Pyle A., Duddy M., Hudson G. Cell-free mitochondrial DNA in progressive multiple sclerosis. Mitochondrion. 2019;46:307–312. doi: 10.1016/j.mito.2018.07.008. [DOI] [PMC free article] [PubMed] [Google Scholar]
- 24.Silva-Zolezzi I., Hidalgo-Miranda A., Estrada-Gil J., Fernandez-Lopez J.C., Uribe-Figueroa L., Contreras A., Balam-Ortiz E., del Bosque-Plata L., Velazquez-Fernandez D., Lara C., et al. Analysis of genomic diversity in Mexican Mestizo populations to develop genomic medicine in Mexico. Proc. Natl. Acad. Sci. USA. 2009;106:8611–8616. doi: 10.1073/pnas.0903045106. [DOI] [PMC free article] [PubMed] [Google Scholar]
- 25.Velázquez-Quintana M., Macías-Islas M.A., Rivera-Olmos V.L.-Z.J. Esclerosis Múltiple en México. Un estudio Multicéntrico. Rev. Neurol. 2003;36:1019–1022. doi: 10.33588/rn.3611.2002610. [DOI] [PubMed] [Google Scholar]
- 26.Anitha A., Thanseem I., Vasu M.M., Viswambharan V., Poovathinal S.A. Telomeres in neurological disorders. Adv. Clin. Chem. 2019;90:81–132. doi: 10.1016/BS.ACC.2019.01.003. [DOI] [PubMed] [Google Scholar]
- 27.Wang S., Madu C.O., Lu Y. Telomere and Its Role in Diseases. Oncomedicine. 2019;4:1–9. doi: 10.7150/oncm.28210. [DOI] [Google Scholar]
- 28.Zheng Q., Huang J., Wang G. Mitochondria, Telomeres and Telomerase Subunits. Front. Cell Dev. Biol. 2019;7:274. doi: 10.3389/fcell.2019.00274. [DOI] [PMC free article] [PubMed] [Google Scholar]
- 29.Lezi E., Swerdlow R.H. Mitochondria in Neurodegeneration. Adv. Exp. Med. Biol. 2012;942:269. doi: 10.1007/978-94-007-2869-1_12. [DOI] [PMC free article] [PubMed] [Google Scholar]
- 30.Scalfari A., Neuhaus A., Daumer M., Ebers G.C., Muraro P.A. Age and disability accumulation in multiple sclerosis. Neurology. 2011;77:1246–1252. doi: 10.1212/WNL.0b013e318230a17d. [DOI] [PMC free article] [PubMed] [Google Scholar]
- 31.Sanai S.A., Saini V., Benedict R.H.B., Zivadinov R., Teter B.E., Ramanathan M., Weinstock-Guttman B. Aging and multiple sclerosis. Mult. Scler. 2016;22:717–725. doi: 10.1177/1352458516634871. [DOI] [PubMed] [Google Scholar]
- 32.Hjelmborg J.B., Dalgård C., Möller S., Steenstrup T., Kimura M., Christensen K., Kyvik K.O., Aviv A. The heritability of leucocyte telomere length dynamics. J. Med. Genet. 2015;52:297–302. doi: 10.1136/jmedgenet-2014-102736. [DOI] [PMC free article] [PubMed] [Google Scholar]
- 33.Broer L., Codd V., Nyholt D.R., Deelen J., Mangino M., Willemsen G., Albrecht E., Amin N., Beekman M., De Geus E.J.C., et al. Meta-analysis of telomere length in 19 713 subjects reveals high heritability, stronger maternal inheritance and a paternal age effect. Eur. J. Hum. Genet. 2013;21:1163. doi: 10.1038/ejhg.2012.303. [DOI] [PMC free article] [PubMed] [Google Scholar]
- 34.Kordinas V., Ioannidis A., Chatzipanagiotou S. The Telomere/Telomerase System in Chronic Inflammatory Diseases. Cause or Effect? Genes. 2016;7:60. doi: 10.3390/genes7090060. [DOI] [PMC free article] [PubMed] [Google Scholar]
- 35.Kim J.H., Kim H.K., Ko J.H., Bang H., Lee D.C. The Relationship between Leukocyte Mitochondrial DNA Copy Number and Telomere Length in Community-Dwelling Elderly Women. PLoS ONE. 2013;8:e67227. doi: 10.1371/journal.pone.0067227. [DOI] [PMC free article] [PubMed] [Google Scholar]
- 36.Passos J.F., Saretzki G., Ahmed S., Nelson G., Richter T., Peters H., Wappler I., Birket M.J., Harold G., Schaeuble K., et al. Mitochondrial dysfunction accounts for the stochastic heterogeneity in telomere-dependent senescence. PLoS Biol. 2007;5:1138–1151. doi: 10.1371/journal.pbio.0050110. [DOI] [PMC free article] [PubMed] [Google Scholar]
- 37.Kwapisz M., Morillon A. Subtelomeric Transcription and its Regulation. J. Mol. Biol. 2020;432:4199–4219. doi: 10.1016/j.jmb.2020.01.026. [DOI] [PMC free article] [PubMed] [Google Scholar]
- 38.Pertusa M., García-Matas S., Rodríguez-Farré E., Sanfeliu C., Cristòfol R. Astrocytes aged in vitro show a decreased neuroprotective capacity. J. Neurochem. 2007;101:794–805. doi: 10.1111/j.1471-4159.2006.04369.x. [DOI] [PubMed] [Google Scholar]
- 39.Mansour H., Chamberlain C.G., Weible M.W., Hughes S., Chu Y., Chan-Ling T. Aging-related changes in astrocytes in the rat retina: Imbalance between cell proliferation and cell death reduces astrocyte availability. Aging Cell. 2008;7:526–540. doi: 10.1111/j.1474-9726.2008.00402.x. [DOI] [PubMed] [Google Scholar]
- 40.Al-Mashhadi S., Simpson J.E., Heath P.R., Dickman M., Forster G., Matthews F.E., Brayne C., Ince P.G., Wharton S.B. Oxidative Glial Cell Damage Associated with White Matter Lesions in the Aging Human Brain. Brain Pathol. 2015;25:565–574. doi: 10.1111/bpa.12216. [DOI] [PMC free article] [PubMed] [Google Scholar]
- 41.Jurk D., Wang C., Miwa S., Maddick M., Korolchuk V., Tsolou A., Gonos E.S., Thrasivoulou C., Jill Saffrey M., Cameron K., et al. Postmitotic neurons develop a p21-dependent senescence-like phenotype driven by a DNA damage response. Aging Cell. 2012;11:996–1004. doi: 10.1111/j.1474-9726.2012.00870.x. [DOI] [PMC free article] [PubMed] [Google Scholar]
- 42.Martínez-Cué C., Rueda N. Cellular Senescence in Neurodegenerative Diseases. Front. Cell. Neurosci. 2020;14:16. doi: 10.3389/fncel.2020.00016. [DOI] [PMC free article] [PubMed] [Google Scholar]
- 43.Gray V., Arnett P. Aging with multiple sclerosis: Cognitive, emotional and neuropathological considerations. Neurodegener. Dis. Manag. 2014;4:187–194. doi: 10.2217/nmt.14.12. [DOI] [PubMed] [Google Scholar]
- 44.Miner A.E., Graves J.S. What telomeres teach us about MS. Mult. Scler. Relat. Disord. 2021;54:103084. doi: 10.1016/j.msard.2021.103084. [DOI] [PubMed] [Google Scholar]
- 45.Leray E., Yaouanq J., Le Page E., Coustans M., Laplaud D., Oger J., Edan G. Evidence for a two-stage disability progression in multiple sclerosis. Brain. 2010;133:1900–1913. doi: 10.1093/brain/awq076. [DOI] [PMC free article] [PubMed] [Google Scholar]
- 46.Cree B.A.C., Reich D.E., Khan O., De Jager P.L., Nakashima I., Takahashi T., Bar-Or A., Tong C., Hauser S.L., Oksenberg J.R. Modification of Multiple Sclerosis Phenotypes by African Ancestry at HLA. Arch. Neurol. 2009;66:226–233. doi: 10.1001/archneurol.2008.541. [DOI] [PMC free article] [PubMed] [Google Scholar]
- 47.Krysko K.M., Henry R.G., Cree B.A.C., Lin J., University of California S.F.M.-E.T., Caillier S., Santaniello A., Zhao C., Gomez R., Bevan C., et al. Telomere Length Is Associated with Disability Progression in Multiple Sclerosis. Ann. Neurol. 2019;86:671–682. doi: 10.1002/ana.25592. [DOI] [PMC free article] [PubMed] [Google Scholar]
- 48.Ghione E., Bergsland N., Dwyer M.G., Hagemeier J., Jakimovski D., Paunkoski I., Ramasamy D.P., Carl E., Hojnacki D., Kolb C., et al. Aging and Brain Atrophy in Multiple Sclerosis. J. Neuroimaging. 2019;29:527–535. doi: 10.1111/jon.12625. [DOI] [PubMed] [Google Scholar]
- 49.Thompson A.J., Banwell B.L., Barkhof F., Carroll W.M., Coetzee T., Comi G., Correale J., Fazekas F., Filippi M., Freedman M.S., et al. Diagnosis of multiple sclerosis: 2017 revisions of the McDonald criteria. Lancet Neurol. 2018;17:162–173. doi: 10.1016/S1474-4422(17)30470-2. [DOI] [PubMed] [Google Scholar]
- 50.Miller S.A., Dykes D.D., Polesky H.F. A simple salting out procedure for extracting DNA from human nucleated cells. Nucleic Acids Res. 1988;16:1215. doi: 10.1093/nar/16.3.1215. [DOI] [PMC free article] [PubMed] [Google Scholar]
- 51.O’Callaghan N.J., Fenech M. A quantitative PCR method for measuring absolute telomere length. Biol. Proced. Online. 2011;13:3. doi: 10.1186/1480-9222-13-3. [DOI] [PMC free article] [PubMed] [Google Scholar]
- 52.Hagman M., Fristrup B., Michelin R., Krustrup P., Asghar M. Football and team handball training postpone cellular aging in women. Sci. Rep. 2021;11:11733. doi: 10.1038/s41598-021-91255-7. [DOI] [PMC free article] [PubMed] [Google Scholar]
Associated Data
This section collects any data citations, data availability statements, or supplementary materials included in this article.
Data Availability Statement
https://figshare.com/articles/dataset/TLT_mtDNA_MS/17097470 (accessed on 12 December 2022).


