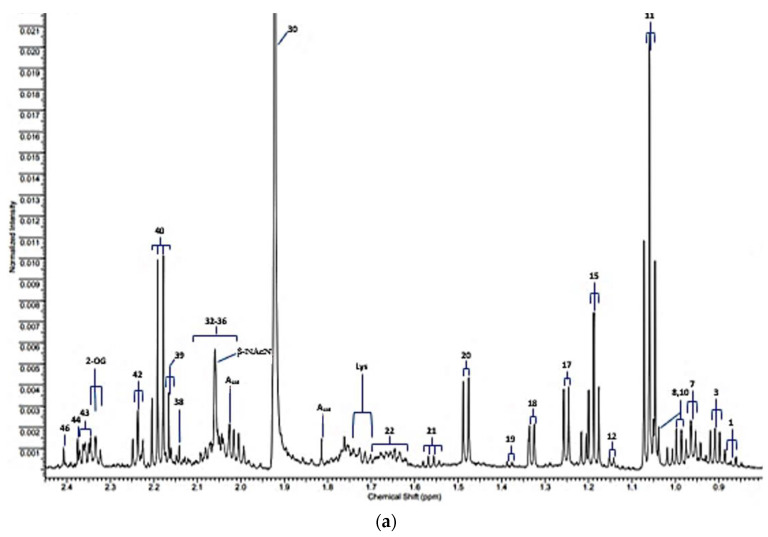
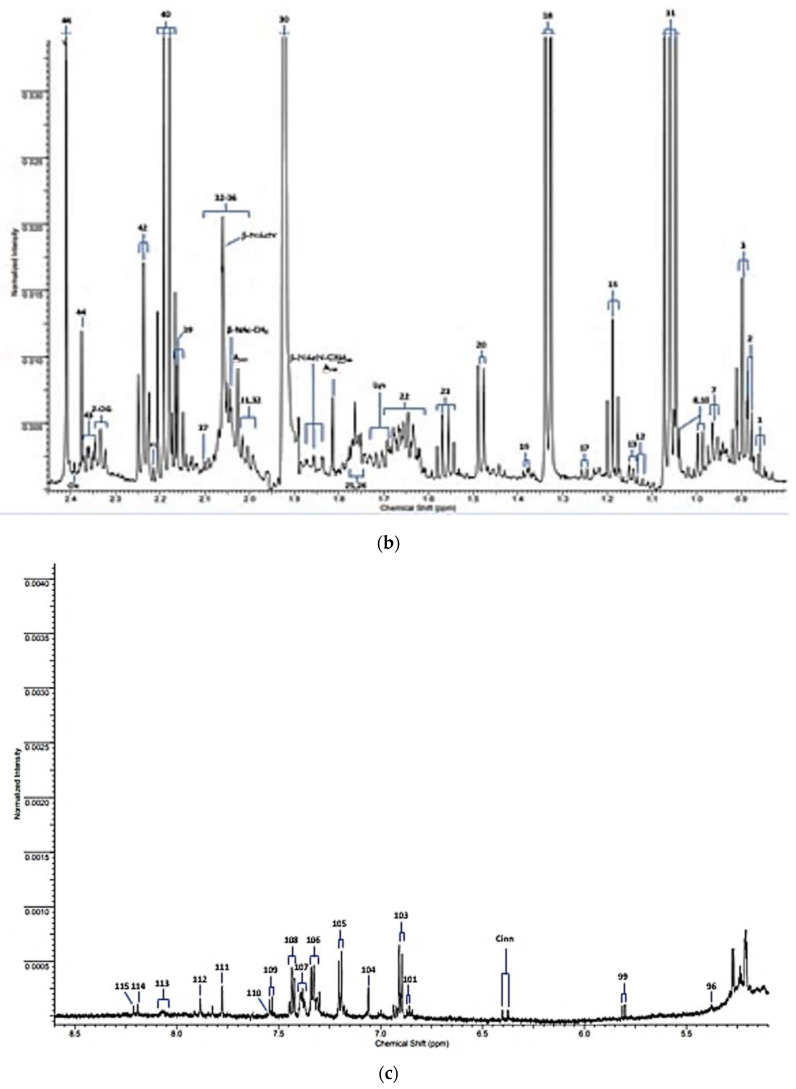
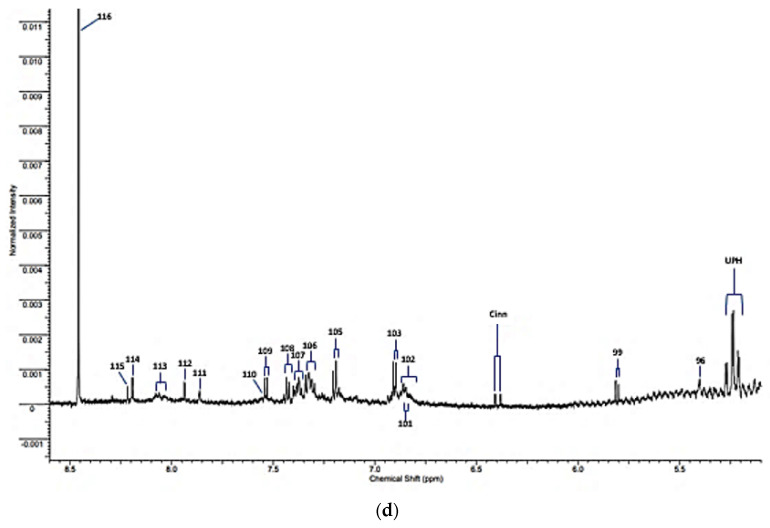
Figure 4.
(a,b) 0.80–2.45 ppm regions of the 600 MHz single-pulse noesy-presat 1H NMR profiles of WMS supernatant samples donated by healthy and acute sore throat disease human participants, respectively. (c,d) Corresponding 5.10–8.60 ppm regions of these spectra, respectively. Typical spectra are shown. Abbreviations: Assignment codes correspond to those listed in Table 1, along with a small number of tentative assignments. Spectra were acquired as described in Section 5.3 above.


