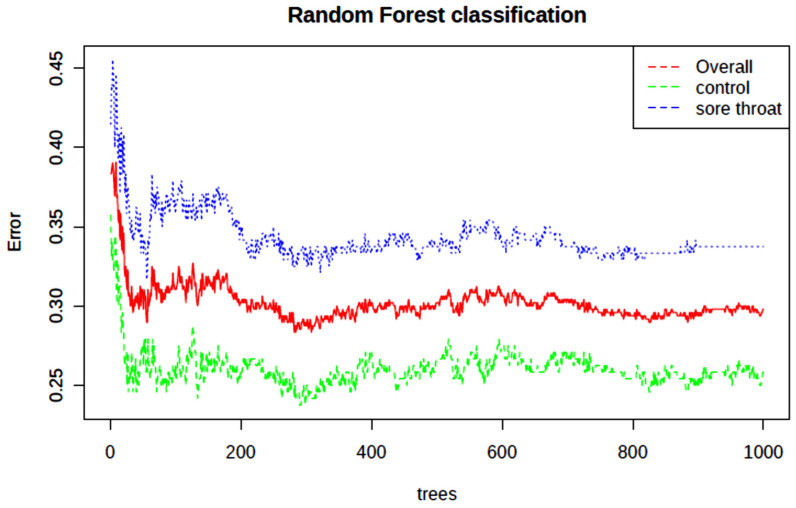
Figure 5.
Random Forest plot of classification error versus number of trees incorporated into the analysis (Model 1) which was performed on all 31 named, assigned metabolites available. This dataset underwent TSP-normalisation, glog-transformation and Pareto-scaling prior to analysis, but without any further row-wise normalisation applied.

