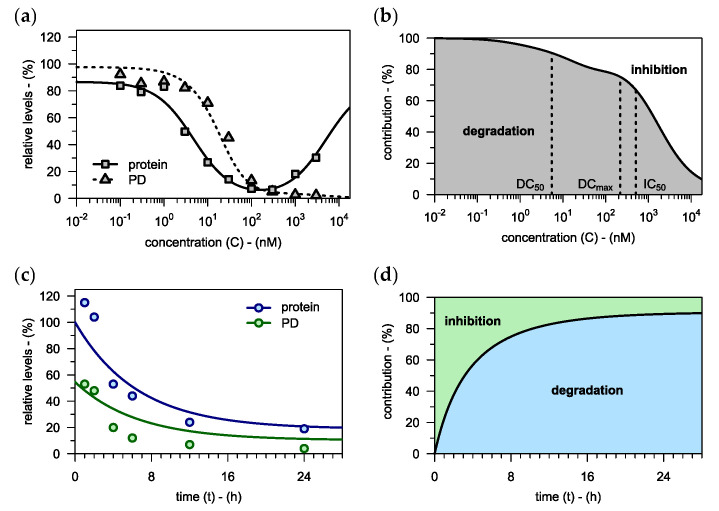
Figure 6.
(a) Target protein levels and the downstream pharmacodynamic response are plotted against drug concentration for an in-house PROTAC (see Figure S3 for two more examples). The hook model is used to assess degradation, which is then used to fit the model (fitted to all three compounds simultaneously). As predicted by the model (see Appendix D for derivation), there is no hook effect present on the level of the downstream pharmacodynamic response. (b) The relative contributions of target degradation and target inhibition to the overall pharmacodynamic effect are plotted against PROTAC concentration. At higher drug concentrations, inhibition becomes the dominant driver of pharmacodynamic effects, thus compensating for the hook effect in protein levels. (c) Target protein levels and the downstream pharmacodynamic response are plotted against incubation time for an in-house PROTAC which was applied at a constant concentration of . The time-course of degradation is predicted using the extended hook model (Equation (14)). Based on this prediction and considering the compound’s inhibitory potency, the model is used to also predict the time-course of the pharmacodynamic response. Both predictions are in good agreement with the observed data. (d) The relative contributions of target degradation and target inhibition to the overall pharmacodynamic effect are plotted against incubation time. Initially, the downstream pharmacodynamic effect is dominated by inhibition, but over time, degradation becomes more important.

