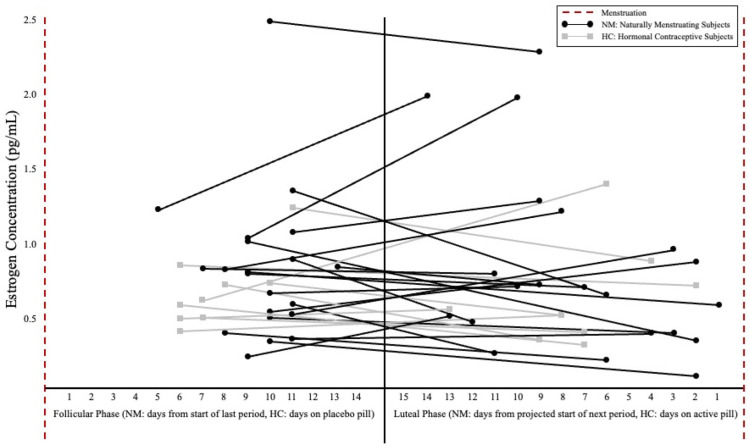
Figure 3.
Estrogen concentration (pg/mL) and post-supplementation day of cycle between hormonal phases. Note: Follicular phase days were counted from the start of the subject’s last period or as days on a placebo pill for HC users. Luteal phase days were determined by number of days until the next projected period or days on the active pill for HC users. Black circles represent naturally menstruating subjects and gray boxes represent subjects using hormonal contraceptives. Connected dots indicate the spread of post-supplementation testing for individual subjects. There were no significant differences in estrogen concentration between NM and HC subjects or between hormonal phases (significance level set at ≤0.05).

