Abstract
Simple Summary
Phoracantha semipunctata is the worst forestry pest worldwide. It has spread to more than 30 countries or regions where eucalyptus species have been planted, damaging the eucalyptus species, thereby causing huge economic losses. It was also the quarantine pest for the European Plant Protection Organization and China. In our study, based on 865 global occurrence records of P. semipunctata and 10 environmental variables, the potential global geographical distributions of P. semipunctata were predicted by the ensemble model. Our findings showed that the potential global geographical distributions of P. semipunctata under the current climate are distributed in the six continents except for Antarctica worldwide. Future climate changes will decrease the suitable area for P. semipunctata in the 2030s and 2050s. Phoracantha semipunctata has largely conserved its niche in the invasive areas. More attention should be paid to early warning signs and monitoring of P. semipunctata in potentially invasive areas.
Abstract
Phoracantha semipunctata is a destructive invasive alien forest pest worldwide. It primarily damages the eucalyptus via adults, affecting almost all parts of the eucalyptus. Its larvae develop in almost all major tissues of the plant. Phoracantha semipunctata spreads both via the migration of adults and global trade in intercontinental translocation. Currently, this pest has spread to six continents worldwide, except Antarctica, resulting in substantial economic losses. Based on global occurrence data and environmental variables, the potential global geographical distribution of P. semipunctata was predicted using an ensemble model. The centroid shift, overlap, unfilling, and expansion scheme were selected to assess niche dynamics during the global invasion process. Our results indicated that the AUC and TSS values of the ensemble model were 0.993 and 0.917, respectively, indicating the high prediction accuracy of the model. The distribution pattern of P. semipunctata is primarily attributed to the temperature seasonality (bio4), mean temperature of the warmest quarter (bio10), and human influence index variables. The potential geographical distribution of P. semipunctata is primarily in western and southwestern Asia, western Europe, western and southern North America, southern South America, southern Africa, and eastern and southern Oceania. The potential geographical distribution of P. semipunctata showed a downward trend in the 2030s and the 2050s. The distribution centroid showed a general tendency to shift southward from the near-current to future climate. Phoracantha semipunctata has largely conserved its niche during the global invasion process. More attention should be paid to the early warning, prevention, and control of P. semipunctata in the countries and regions where it has not yet become invasive.
Keywords: invasive alien forest pest, Phoracantha semipunctata, potential geographical distribution, niche dynamic, distribution centroid
1. Introduction
Biological invasions by invasive alien forest pests (IAFPs) pose a significant threat to forests by damaging or killing trees, resulting in global-scale ecological and economic impacts [1,2,3]. For example, IAFPs damage plantations and certain valuable trees and reduce their regeneration, such as in pine, elm, and eucalyptus [1,4,5]. IAFPs destroy approximately 4000 km2 of forest per year in Canada and approximately 28,000 km2 in China [6,7]. The economic impact of IAFPs in terms of lost timber value is likely to be $150 million in the United States [8]. Rapid climate warming has altered the distribution pattern of IAFPs and hosts in the Anthropocene, which might facilitate their global invasion [9,10]. Climate suitability has an important impact on the degree of invasion and spread risk posed by IAFPs [5]. Based on the “climate match hypothesis,” the establishment of species populations is more likely to succeed in areas with environmental conditions that are similar to those in native areas [11]. Nevertheless, a few previous studies have revealed that some species might occupy new environmental conditions in invasive areas by shifting their native niche, which might significantly affect invasion and spread risk [12]. Human-mediated global trade and long-distance transportation networks have resulted in the intercontinental translocation of IAFPs over the last few decades, exacerbating global invasion and spreading risk [4,13]. Consequently, the management planning of IAFPs that considers the impact of environmental suitability, human influence, and niche dynamics is pivotal for mitigating the negative impacts in the Anthropocene.
Phoracantha semipunctata (Fabricius) 1775 (Coleoptera: Cerambycidae), known as the eucalyptus longhorned borer, is native to Australia and has spread to more than 30 countries or regions where eucalyptus species have been planted [14,15]. The movement and dispersal of P. semipunctata primarily occurred via adult migration in the local zones and human-mediated transport of eucalyptus wood in intercontinental translocation [16,17]. Phoracantha semipunctata was first reported in South Africa as an introduced insect in 1906 [18]. When eucalyptus species were used to establish plantations in countries with Mediterranean climates until the late 20th century, the IAFP widely spread via the transport of eucalyptus species [18]. Phoracantha semipunctata poses a great threat to the eucalyptus plantation industry and the local economy in the invasive zone. The eucalyptus species that was attacked by P. semipunctata showed some dead branches with yellowing and wilting leaves, and the larval tunnels were filled with compressed frass, producing characteristically long, narrow lesions with dark exudation [18].
The pest caused an estimated loss of 2 million trees, representing approximately 1700 km2 of eucalyptus plantations in 1981 in Morocco [19]. The average tree mortality due to P. semipunctata was estimated at 2.23% to 3.88% during 1981–1983 in the Spanish province of Huelva, corresponding to a loss of 62.07 km2 [20]. Phoracantha semipunctata is an A2 quarantine pest for the European Plant Protection Organization (EPPO) [21] and is a quarantine pest in China. Nevertheless, there are currently no findings on the potential geographical distribution and niche dynamics of P. semipunctata under global climate change. These findings can help in management planning and establishing sustainable prevention networks.
Species distribution models (SDMs) are becoming increasingly powerful tools. SDMs primarily include (1) correlative models, such as artificial neural networks (ANN), categorical regression tree analysis (CTA), gradient boosting model (GBM), generalized linear model (GLM), maximum entropy model (MaxEnt), random forest (RF), surface range envelope (SRE), and flexible discriminant analysis (FDA), which are based on the statistical relationships between known species occurrence data and environmental variables [22], and (2) mechanistic models, such as the CLIMEX and insect life cycle model (ILCM), which are based on eco-physiological information [23]. SDMs are widely used to assess the risk of invasive alien species [24]. Nevertheless, single models might carry some uncertainties in the occurrence, environmental data, and model structure [25]. The ensemble model (EM) has shown superior predictive performance to single models in many cases, based on the combination of units of single models [26,27]. Consequently, using EM to model the potential geographical distribution of invasive alien species has become a significant measure for management planning.
In the present study, we are the first to estimate the distribution pattern of P. semipunctata using EM and to assess niche dynamics worldwide. Specifically, we aim to address three issues. First, we predicted the potential geographical distribution of P. semipunctata under current and future climates and assessed their changes. Second, we expected that established populations of P. semipunctata would occupy similar environmental niches in the invasive area to those of the native area, which should be consistently supported by the consensus of multiple tests performed with different metrics. Finally, we identified the significant environmental variables affecting the distribution of P. semipunctata worldwide.
2. Materials and Methods
2.1. Species Occurrence Data
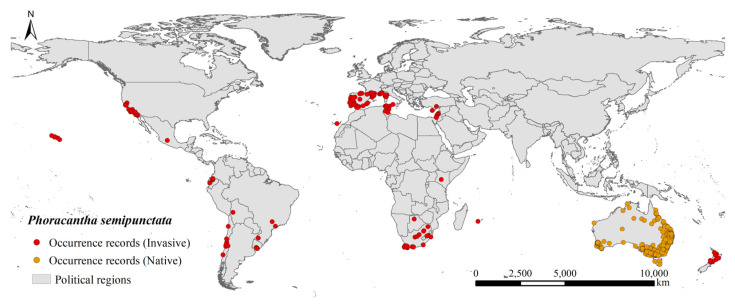
In the present study, 1650 occurrence records were collected for P. semipunctata from 4 sources. A total of 1041 occurrence records were downloaded from the Global Biodiversity Information Facility [28]; 11 occurrence records were downloaded from the Barcode of Life Data Systems (BOLD, http://www.boldsystems.org/, accessed on 22 November 2022); 551 occurrence records were downloaded from Atlas of Living Australia (ALA, https://www.ala.org.au/, accessed 22 November 2022); and 47 occurrence records were obtained from publications in the Web of Science [29,30,31]. To avoid the effects of occurrence record bias and spatial autocorrelation on the accuracy of the results of model prediction [32], duplicate records and the occurrence records assigned to capital cities based on the centroids of the provinces were removed. Second, we selected ENMTools to ensure that only one occurrence record was present in each 5 km2 raster [33]. Ultimately, 865 global occurrence records were retained (Figure 1).
Figure 1.
Invasive and native occurrence records of Phoracantha semipunctata worldwide.
2.2. Environmental Data
Environmental data were obtained from publicly available online databases. The near-current climate (1970–2000) and altitude data at a spatial resolution of 2.5 arc min were sourced from WorldClim v. 2.1 [34]. The future climate data for the 2030s (2020–2040) and 2050s (2041–2060) at a spatial resolution of 2.5 arc min were from WorldClim v. 2.1, including three shared socioeconomic pathways (SSP1-2.6, SSP2-4.5, and SSP5-8.5), which were based on the BCC-CSM2-MR climate system model. The near-current and future climate data include 19 bioclimatic variables (Table S1). The human influence index (HII) was downloaded from the Global Human Influence Index (Geographic) v2 (1995–2004), at a spatial resolution of 30 s. Finally, ArcGIS (version 10.8) was used to unify the spatial resolution of all environmental variables at 2.5 arc min.
The high multivariate collinearity of the environmental data can negatively influence the accuracy of SDM predictions. Consequently, ENMTools was used to eliminate the multivariate collinearity of environmental data (Figure S1) [33]. Finally, for any two highly correlated environmental variables (|r| > 0.8), the important bioclimatic variable was retained. Finally, we retained eight bioclimatic variables, altitude, and HII for modeling (Table S2).
2.3. Modeling Approach
Eight SDMs and an EM were used to model the potential global geographical distribution of P. semipunctata. The eight single SDMs included ANN, CTA, FDA, GBM, GLM, MaxEnt, RF, and SRE. In the modeling process, we selected 75% of the occurrence records of P. semipunctata as the training dataset and the remaining 25% as the testing dataset. 1000 pseudo-absence samples were randomly generated. Default settings were used for the other modeling parameters. We repeated the modeling process 10 times to eliminate the uncertainty of the SDMs. Ultimately, 80 single SDMs were constructed. The area under the receiver operating characteristic (ROC) curve (AUC) and true skill statistic (TSS) values were used as evaluation indices for the accuracy of the SDMs [35,36]. The values of AUC and TSS ranged from 0 to 1, and values of AUC and TSS closer to 1 indicated a better-performing SDM. The top three SDMs with the highest mean values of AUC and TSS were used to construct an EM.
Based on the maximizing TSS value, which was used to transform the continuous values into binary in the EM results, the potential geographical distribution of P. semipunctata was classified into four types: highly suitable (600 ≤ p ≤ 1,000), moderately suitable (400 ≤ p < 600), lowly suitable (194 ≤ p < 400), and unsuitable (0 ≤ p < 194). The maximizing TSS value was also used to divide the potential geographical distribution of P. semipunctata into the suitable area (≥194) and unsuitable area (<194), thereby the species distribution model tool in ArcGIS (version 10.8) was used to analyze the shift of suitable area centroids of P. semipunctata under near-current and future climates.
2.4. Niche Measurement
The ecological niches of P. semipunctata between native (Australia) and invasive areas were compared using the ecospat package in R version 4.2 [37](Di Cola et al., 2017). Ten available environmental variables (altitude, HII, bio2, bio4, bio10, bio12, bio15, bio17, bio18, and bio19) were used to perform PCA-env and generate the predicted niche occupancy profiles. Niche overlap was calculated using Schoener’s D [38], which ranges from 0 (no overlap) to 1 (complete overlap). The ecospat package divides the niches of native and invasive areas into three components, including the centroid shift, overlap, unfilling, and expansion (COUE) [37].
The niche equivalency test was selected to calculate whether the niche overlap between the native and invasive areas was constant and was repeated 100 times. If the observed D value is not within 95% of the simulated values (p < 0.05), the null hypothesis of niche equivalency can be rejected, indicating that the niche in the invasive area is not equivalent to that in the native area [39]. Niche similarity tests were run in both directions (Australia → China) with 100 repetitions, which were selected to address the similarity between native and invasive areas. The significant niche similarity test results (p < 0.05) indicated that the observed niche overlap was more similar to each other than expected by chance [39].
3. Results
3.1. Model Performance
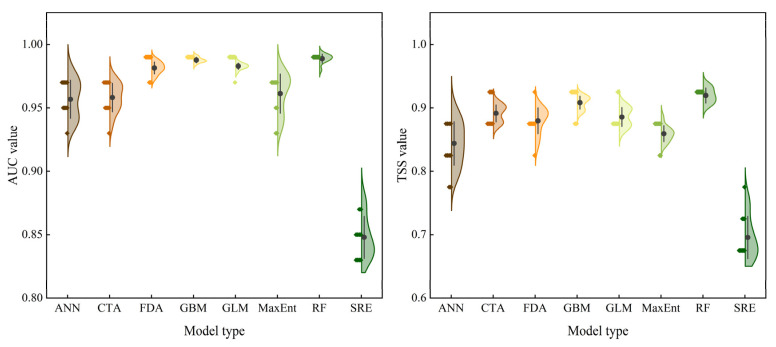
The mean AUC values for ANN, CTA, FDA, GBM, GLM, MaxEnt, RF, and SRE were 0.957, 0.958, 0.982, 0.988, 0.983, 0.961, 0.989, and 0.848, respectively (Figure 2). The mean TSS values for ANN, CTA, FDA, GBM, GLM, MaxEnt, RF, and SRE were 0.844, 0.891, 0.880, 0.908, 0.886, 0.859, 0.920, and 0.696, respectively (Figure 2). Based on the mean values of the AUC and TSS of the eight SDMs, we selected RF, GLM, and GBM to construct an EM. The mean AUC and TSS values for EM were 0.993 and 0.917, respectively. Consequently, our results showed that the prediction of the potential geographical distribution of P. semipunctata using EM was more reliable than that of using single SDMs.
Figure 2.
Evaluation indices of species distribution models (ROC: receiver operating characteristic, TSS: true skill statistic, ANN: artificial neural network, CTA: categorical regression tree analysis, GBM: gradient boosting model, GLM: generalized linear model, MaxEnt: maximum entropy model, RF: random forest, SRE: surface range envelope, and FDA: flexible discriminant analysis).
3.2. Potential Geographical Distribution under Near-Current and Future Climates
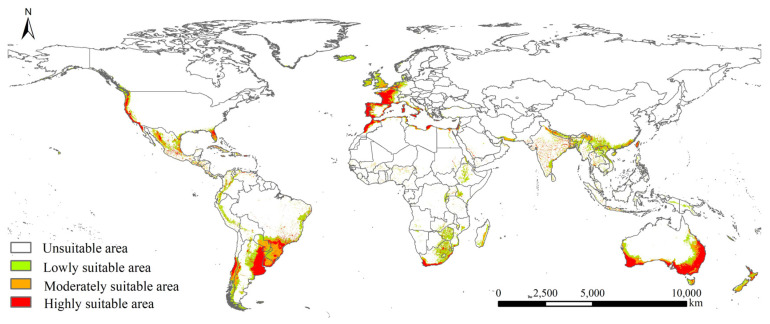
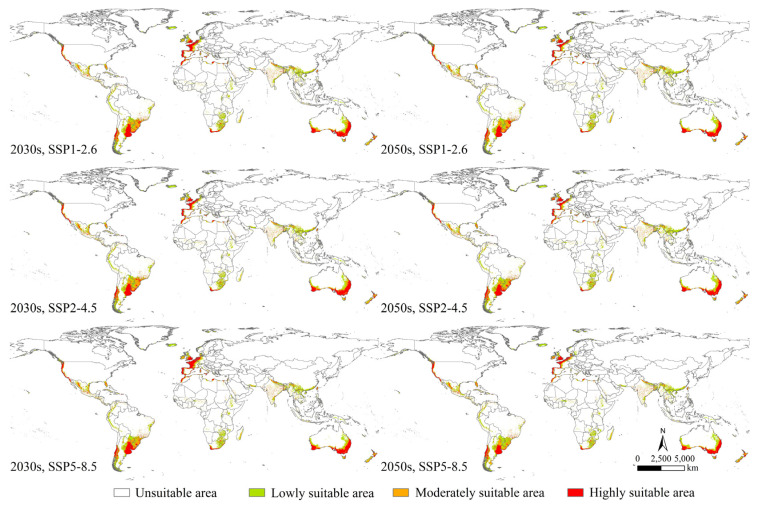
The potential geographical distribution of P. semipunctata under near-current and future climate covered Asia (China, Laos, Myanmar, Thailand, Cambodia, Vietnam, Malaysia, Indonesia, India, Iran, Pakistan, Israel, Saudi Arabia, United Arab Emirates, and Turkey), Europe (Greece, Italy, Germany, Denmark, the United Kingdom, Belgium, France, Andorra, Spain, Portugal, and Gibraltar), North and Central Americas (the United States, Mexico, Cuba, Panama, Costa Rica, Nicaragua, and Honduras), South America (Colombia, Trinidad and Tobago, Venezuela, Ecuador, Peru, Brazil, Bolivia, Paraguay, Uruguay, Chile, and Argentina), Africa (Morocco, Algeria, Tunisia, Libya, Egypt, Sudan, Kenya, Zambia, Mozambique, Zimbabwe, Botswana, Swaziland, South Africa, Lesotho, and Madagascar), and Oceania (Australia and New Zealand) (Figure 3 and Figure 4).
Figure 3.
Potential geographical distribution of Phoracantha semipunctata under near current climate.
Figure 4.
Potential geographical distribution of Phoracantha semipunctata under future climate (2030s and 2050s).
In the near-current (1970–2000) climate, the total, highly, moderately, and lowly suitable areas of P. semipunctata were 1417.35 ×104, 427.18 × 10⁴, 332.28 × 10⁴, and 657.89 × 10⁴ km2, respectively (Figure S2). In the 2030s and 2050s, the suitable areas for P. semipunctata showed a decreasing trend.
In the 2030s, under the SSP1-2.6, SSP2-4.5, and SSP5-8.5, the total suitable areas of P. semipunctata were 1338.97 × 104, 1327.24 × 104, and 1350.57 × 104 km2; the highly suitable areas were 388.42 × 10⁴, 382.05 × 10⁴, and 411.81 × 10⁴ km2; the moderately suitable areas were 312.90 × 10⁴, 309.91 × 10⁴, and 297.15 × 10⁴ km2; and the lowly suitable areas were 637.65 × 10⁴, 635.28 × 10⁴, and 641.61 × 10⁴ km2 (Figure S2), respectively.
In the 2050s, under the SSP1-2.6, SSP2-4.5, and SSP5-8.5 scenarios, the total suitable areas of P. semipunctata were 1322.74 × 104, 1301.28 × 104, and 1267.78 × 104 km2; highly suitable areas were 376.24 × 10⁴, 374.25 × 10⁴, and 332.55 × 10⁴ km2; moderately suitable areas were 306.92 × 10⁴, 289.06 × 10⁴, and 276.47 × 10⁴ km2; and low suitable areas were 639.58 × 10⁴, 637.97 × 10⁴, and 658.76 × 10⁴ km2 (Figure S2), respectively.
3.3. Changes in the Potential Geographical Distribution
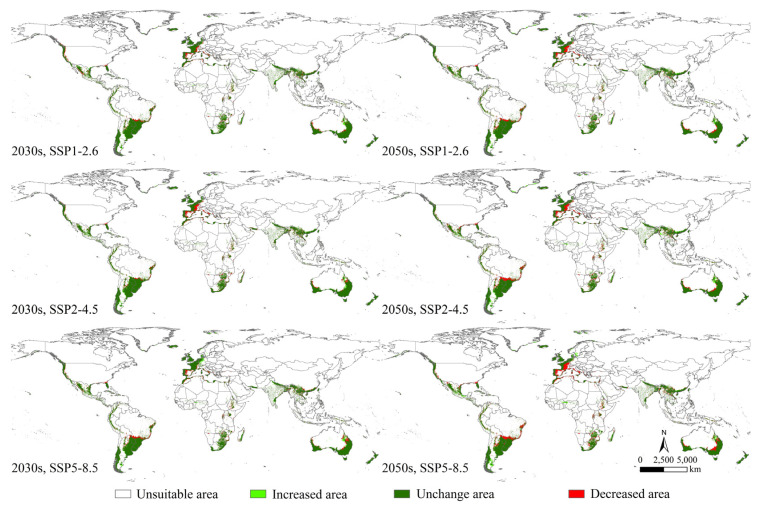
Changes in the potential geographical distribution of P. semipunctata between the near-current and future climates indicated that the decreased and increased areas of P. semipunctata under the SSP5-8.5 scenario of the 2050s were the largest (Figure S2). The areas of increase were primarily located in Europe (France, Italy, Andorra, and Spain), North America (The United States and Mexico), South America (Brazil), Africa (Morocco, Algeria, Tunisia, Ethiopia, and South Africa), and Oceania (Australia) (Figure 5). The areas of decrease were primarily located in Europe (Sweden and Norway), North America (Mexico), South America (Argentina), and Oceania (Australia) (Figure 5).
Figure 5.
Changes in the potential geographical distribution of Phoracantha semipunctata between the near-current and future climates.
In the 2030s, under SSP1-2.6, SSP2-4.5, and SSP5-8.5, the increased areas of P. semipunctata were 56.62 × 10⁴, 59.97 × 10⁴, and 78.40 × 10⁴ km2, respectively. In 2050s, under SSP1-2.6, SSP2-4.5, and SSP5-8.5 scenarios, the increased areas of P. semipunctata were 73.21 × 10⁴, 85.25 × 10⁴, and 102.29 × 10⁴ km2, respectively (Figure S2).
In the 2030s, under SSP1-2.6, SSP2-4.5, and SSP5-8.5, the decreased areas of P. semipunctata were 131.28 × 10⁴, 145.70 × 10⁴, and 141.13 × 10⁴ km2, respectively. In the 2050s, under SSP1-2.6, SSP2-4.5, and SSP5-8.5, the decreased areas of P. semipunctata were 164.32 × 10⁴, 197.47 × 10⁴, and 248.09 × 10⁴ km2, respectively (Figure S2).
3.4. Distribution Centroids under Near-Current and Future Climates
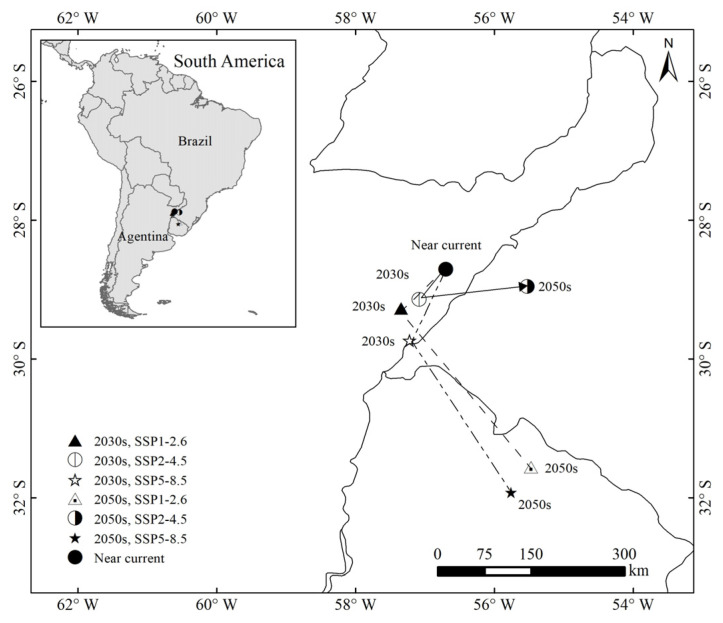
From the current time to the 2030s and 2050s, the distribution centroids of P. semipunctata were located in Argentina and Brazil and showed a general tendency to shift southward under the three scenarios (SSP1-2.6, SSP2-4.5, and SSP5-8.5) (Figure 6). Under the near-current scenario, the distribution centroid of P. semipunctata was located at a particular point (56.68° W, 28.67° S).
Figure 6.
Distribution centroids of Phoracantha semipunctata under the near current and future climate scenarios.
In the 2030s and 2050s, under SSP1-2.6, the distribution centroid shifted from its current position to the points (57.34° W, 29.30° S) and (55.50° W, 31.56° S), respectively. Under SSP2-4.5, the distribution centroid shifted from its current position to the points (57.08° W, 29.15° S) and (55.54° W, 28.98° S), respectively; and under SSP5-8.5, it shifted from its current position to the points (57.20° W, 29.74° S) and (51.79° W, 31.89° S), respectively.
3.5. Environmental Variables Importance and Response Curve
The temperature and human influence variables were more significant than the others. The top three environmental variables with the highest mean contribution values were the temperature seasonality (bio4, 0.42), human influence index (HII, 0.11), and mean temperature of the warmest quarter (bio10, 0.07).
The response curves of the significant environmental variables for P. semipunctata in the GBM, GLM, and RF models are shown in Figure S3. The suitable range threshold of the environmental variables was classified as a highly suitable area threshold (0.6). With increasing bio4, the presence probability of P. semipunctata showed a general downward trend. The suitable range of bio4 for P. semipunctata was 0–621, and with an increase in HII, the presence probability of P. semipunctata showed an upward trend. The suitable range of the HII for P. semipunctata was from 0 to 60. With an increase in bio10, the presence probability of P. semipunctata first decreased and then increased. The suitable range of bio10 for P. semipunctata was between 7–33 °C.
3.6. Environmental Variables Importance and Response Curve
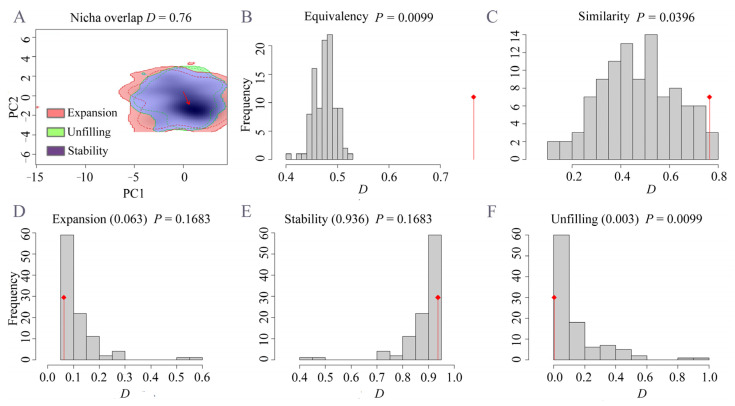
Niche comparison tests a high degree of niche overlap (Schoener’s D = 0.78) (Figure 7A). The equivalency and similarity tests indicated that the two niches were not equivalent but were more similar than would be expected by chance (equivalency test, p = 0.0099, similarity test, p = 0.0396) (Figure 7B,C). The expansion, stability, and unfilling indices and tests revealed that most of the simulated environments were occupied by the stability area (0.936), and a small part of the simulated environments was occupied by the small expansion (0.063) and unfilling (0.003) areas (Figure 7A,D–F). Consequently, the niche of P. semipunctata was conservative and stable during the invasion process.
Figure 7.
Niche comparison for Phoracantha semipunctata between native (Australia) and invasive areas. (A): niche overlap on two principal component axes (PC1 and PC2). (B,C): equivalency and similarity tests. (D–F): niche expansion, stability, and unfilling tests. Red lines in the plots indicate the observed value of niche overlap, and gray bars indicate the distribution of D values for 100 simulated comparisons.
3.7. Environmental Variables Importance and Response Curve
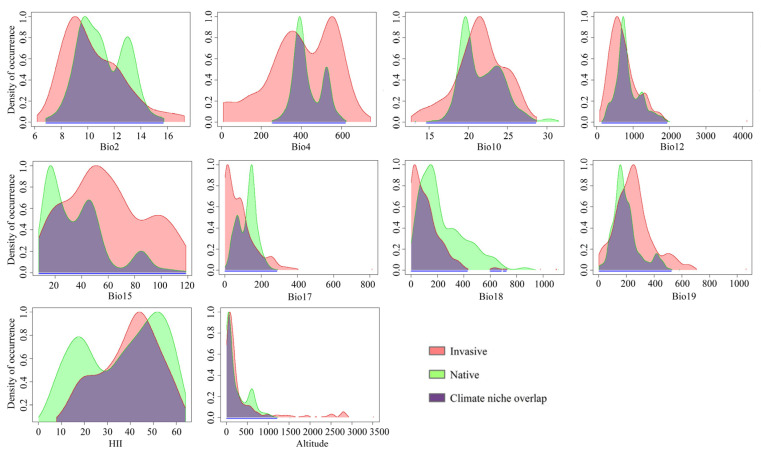
Our predicted niche occupancy profiles revealed heterogeneity in the environmental requirements of P. semipunctata populations in native and invasive areas (Figure 8). Regarding temperature requirements, including the mean diurnal range (bio2), temperature seasonality (bio4), and mean temperature of the warmest quarter (bio10), invasive populations of P. semipunctata were more suitable than native populations for wider temperature ranges. Regarding precipitation, human influence, and topography requirements, including annual precipitation (bio12), precipitation seasonality (bio15), precipitation of driest quarter (bio17), precipitation of warmest quarter (bio18), precipitation of coldest quarter (bio19), human influence index (HII), and altitude, the invasive and native populations were not significantly different. Consequently, if records of P. semipunctata are observed in those environments in the native area, they are also likely to be observed in the invasive areas.
Figure 8.
Predicted niche occupancy profiles. Bio2: mean diurnal range. Bio4: temperature seasonality. Bio10: mean temperature of the warmest quarter. Bio12: annual precipitation. Bio15: precipitation seasonality. Bio17: precipitation of driest quarter. Bio18: precipitation of warmest quarter. Bio19: precipitation of coldest quarter. HII: human influence index.
4. Discussion
4.1. Model Prediction Significance
Phoracantha semipunctata has spread and established populations on six continents in which eucalypts have been planted [18]. Consequently, estimating its global distribution pattern is the basis for early warning, prevention, control, and management. To our knowledge, the present study is the first to select an EM to predict the potential global geographical distribution of P. semipunctata. SDMs have been frequently selected to predict the potential geographical distribution of invasive alien insects. Previous studies have revealed the superior predictive performance of EM over a single SDM, and single model uncertainty can be avoided or reduced by EM [40,41]. For instance, some studies on the prediction of the distribution pattern of Vespa velutina in the Mediterranean island regions [42], estimating the global invasion risk for Hemiculter leucisculus [43] and predicting the habitat suitability for the invasive bee in Hawai’i [44], indicated that the predictions using an EM were more reliable than those using a single SDM. We also assessed niche dynamics during the global invasion process and significant variables affecting the global distribution pattern of P. semipunctata. Our results provide a reference for the early warning, prevention, and control of P. semipunctata.
4.2. Suitable Environmental Conditions
Temperature is an important factor that affects both the developmental time and fecundity of insects [45,46]. Our findings indicated that temperature seasonality and the mean temperature of the warmest quarter were significant temperature variables affecting the global distribution pattern of P. semipunctata. The egg masses of P. semipunctata were typically found during the warm quarter, while the developmental period of P. semipunctata pupae averaged 32–40 days during early spring to late summer, with an average of approximately 110 days in autumn [18]. The thermic integral of P. semipunctata needed to complete one generation as 1510 degree-days with the minimum threshold temperature (11.5 °C) [47]. These studies indicate that warm climatic conditions favor the development of P. semipunctata populations, and that the temperature of the warmest quarter may have a great impact on the distribution and survival of P. semipunctata. Mediterranean climate (dry and hot summer) allows more generations of P. semipunctata per year than in other climates [47]. Our results showed that suitable areas for P. semipunctata were located in the Mediterranean and coastal ranges worldwide. Consequently, the above-mentioned findings indicate that the environmental conditions of the Mediterranean and coastal ranges are more suitable for P. semipunctata. Human activities have facilitated the global biological invasion process, from disrupting ecosystems to transporting invasive alien species [48,49,50]. Our results show that with an increase in the HII, the presence probability of P. semipunctata showed an upward trend. The host plants of P. semipunctata are primarily Eucalyptus species, which are one of the most economically important trees and are widely planted worldwide [51]. The main spread pathways are human-mediated transport of Eucalyptus wood worldwide [16]. Consequently, human influences play a key role in the distribution and survival of P. semipunctata worldwide.
4.3. Niche Dynamic and Prospective Distribution Changes
Niche conservatism of the IAS is considered common in different geographical locations [52,53]. Species arriving in zones with environmental conditions similar to those of their native zones are more likely to successfully establish populations [11]. In the present study, we assessed niche dynamics during the global invasion of P. semipunctata. The degree of niche overlap between the native and invasive areas was high, further indicating that P. semipunctata occupies environmental niches in invasive areas that are similar to their native areas. Previous studies have compiled ample evidence of niche conservatism of the IAS during the invasion process at biogeographic scales. For instance, most of the 434 IAS largely conserved their climatic niche between native and invasive ranges [54]. Collectively, our results support the niche conservatism hypothesis.
To date, P. semipunctata is primarily found in Asia (Israel), Europe (Italy, Spain, Portugal, France, and the Netherlands), North America (the United States and Mexico), South America (Argentina, Chile, Peru, Uruguay, Brazil, and Bolivia), Africa (South Africa, Tunisia, Algeria, Zambia, Egypt, Mauritius, Swaziland, Morocco, Mozambique, Malawi, Lesotho, Zimbabwe, and Ethiopia), and Oceania (Australia and New Zealand). Our results indicated that the potentially invasive areas were primarily located in Asia (China, India, Laos, Myanmar, Thailand, Cambodia, Vietnam, Malaysia, Indonesia, Iran, Pakistan, Saudi Arabia, United Arab Emirates, and Turkey) and Europe (Greece, Germany, Denmark, the United Kingdom, Belgium, Andorra, and Gibraltar), where wild populations of P. semipunctata have not yet been found. The above countries were planting eucalyptus or have industries based on eucalyptus wood that would be affected by P. semipunctata. More attention should be paid to early warning and monitoring of P. semipunctata in potentially invasive areas. For the early warning and monitoring measure of P. semipunctata, the freshly cut trap logs that are treated with pesticide can be placed in woodlots to attract adult beetles [18]. Suitable environmental conditions play a key role in the degree of risk posed by P. semipunctata, which may influence eucalyptus trees. The main global spread pathways are via the human-mediated transport of eucalyptus wood [16]. Consequently, on a global scale, for the areas where wild populations of P. semipunctata have not yet been found, more attention is required concerning the eucalyptus wood trade with other countries, especially where P. semipunctata has established naturalized populations. Once the wild population of P. semipunctata is found, it should be rapidly eradicated with cultural and biological control measures. For instance, silvicultural measures are the most effective control measures in Spain and Morocco, primarily through the selection of appropriate trees for each zone [55]. Parasitoids, including Platystasius transversus and Avetianella longoi, are the most effective natural enemies of P. semipunctata [56,57].
Climate change and human activities have altered the distribution pattern of species, including the shrinking and expansion of their geographical distribution [58,59]. A previous study showed that losses to unmanaged pests may decrease when climate change causes less favorable environmental conditions for the establishment of pest populations [60]. Some case studies have shown that climate change decreases the geographical distribution of IAFPs. For instance, climate warming has globally resulted in a decrease in suitable areas for Dalbulus maidis [61]. The geographical distribution of the vine mealybug (Planococcus ficus) is expected to decrease in future climates [58]. Climate change has shifted the distribution centroid of species poleward. In our study, the distribution centroid of P. semipunctata showed a general tendency to shift southward under climate change conditions. Our results support the hypothesis that climate-warming-driven species shift poleward and decrease in areas where climate warming causes less suitable environmental conditions for species establishment.
In summary, we are the first attempt to present a novel framework for integrating the SDMs and niche dynamic into the estimation of potentially suitable areas for P. semipunctata worldwide and niche comparison between the native and invasive areas. Our results can guide the worldwide selection of planted areas for eucalyptus species without the potential invasion risk of P. semipunctata, and provide insights into the effects of climate change on the global distribution pattern of P. semipunctata. Finally, the results can also serve as a reference for the early warning, prevention, control, and management of P. semipunctata during future invasions.
5. Conclusions
Based on the global occurrence records of P. semipunctata and related environmental variables, we constructed an EM using the three most accurate single SDMs to predict the potential geographical distribution worldwide. We also simulated the niche dynamics of P. semipunctata during the global invasion process to assess invasion risk in the future. First, the potential global geographical distribution of P. semipunctata is primarily located in western and southwestern Asia, western Europe, western and southern North America, southern South America, southern Africa, and eastern and southern Oceania. The potential invasive zones (wild populations of P. semipunctata have not yet been found) were primarily located in eastern Asia and eastern Europe. Second, P. semipunctata largely conserves its niche during the invasion process. Finally, the distribution pattern was primarily attributed to temperature and human influence variables. The early warning of biological invasions is commonly considered the most effective measure for the management of invasive alien species. Consequently, countries should strictly implement plant quarantine regulations for imported eucalyptus logs to prevent the invasion of P. semipunctata. In the future, we will focus on the modeling integration for SDMs, evolutionary analysis, and phylodynamic inference for P. semipunctata so as to better reconstruct its distribution, origin, and spread.
Supplementary Materials
The following information is available online at https://www.mdpi.com/article/10.3390/insects14010084/s1, Figure S1: Pearson correlation coefficients of 19 bioclimatic variables for four study species; Figure S2: The areas of potential geographical distribution and changes of Phoracantha semipunctata under near-current and future climate (the 2030s and 2050s); Figure S3: The areas of potential geographical distribution and changes of Phoracantha semipunctata under near-current and future climate (the 2030s and 2050s); Table S1: All environmental variables; Table S2: Environmental variables related to the distribution of Phoracantha semipunctata.
Author Contributions
Conceptualization, H.Z., J.S. and W.L.; methodology, H.Z.; software, H.Z.; validation, H.Z.; formal analysis, H.Z.; investigation, H.Z.; resources, T.L.; data curation, H.Z.; writing—original draft preparation, H.Z.; writing—review and editing, H.Z. visualization, H.Z. and X.X.; supervision, F.W. and X.X.; project administration, J.S. and W.L.; funding acquisition, J.S. and W.L. All authors have read and agreed to the published version of the manuscript.
Institutional Review Board Statement
Not applicable.
Informed Consent Statement
Not applicable.
Data Availability Statement
The data presented in this study are available in this article.
Conflicts of Interest
The authors declare no conflict of interest.
Funding Statement
This research was funded by “the National Key R&D Program of China, grant number 2021YFC2600400”, “the National Natural Science Foundation of China, grant number 32171794”, and “the International Science and Technology Innovation Program of Chinese Academy of Agriculture Science, grant number caas-zdrw202108”.
Footnotes
Disclaimer/Publisher’s Note: The statements, opinions and data contained in all publications are solely those of the individual author(s) and contributor(s) and not of MDPI and/or the editor(s). MDPI and/or the editor(s) disclaim responsibility for any injury to people or property resulting from any ideas, methods, instructions or products referred to in the content.
References
- 1.Boyd I.L., Freer-Smith P.H., Gilligan C.A., Godfray H.C.J. The consequence of tree pests and diseases for ecosystem services. Science. 2013;342:1235773. doi: 10.1126/science.1235773. [DOI] [PubMed] [Google Scholar]
- 2.Morin R.S., Liebhold A.M. Invasions by two non-native insects alter regional forest species composition and successional trajectories. For. Ecol. Manag. 2015;341:67–74. doi: 10.1016/j.foreco.2014.12.018. [DOI] [Google Scholar]
- 3.Lovett G.M., Weiss M., Liebhold A.M., Holmes T.P., Leung B., Lambert K.F., Orwig D.A., Campbell F.T., Rosenthal J., McCullough D.G., et al. Nonnative forest insects and pathogens in the United States: Impacts and policy options. Ecol. Appl. 2016;26:1437–1455. doi: 10.1890/15-1176. [DOI] [PMC free article] [PubMed] [Google Scholar]
- 4.Brockerhoff E.G., Liebhold A.M. Ecology of forest insect invasions. Biol. Invasions. 2017;19:3141–3159. doi: 10.1007/s10530-017-1514-1. [DOI] [Google Scholar]
- 5.Venette R.C. Climate analyses to assess risks from invasive forest insects: Simple matching to advanced models. Curr. For. Rep. 2017;3:255–268. doi: 10.1007/s40725-017-0061-4. [DOI] [Google Scholar]
- 6.Natural Resources Canada About Forest Invasive Alien Species (FIAS) 2015. [(accessed on 22 November 2022)]. Available online: https://www.exoticpests.gc.ca/definition.
- 7.Song Y., Wang C., Pan X., Cao C. List and analysis of forestry invasive alien insects in China. Plant Quar. 2022;36:1–12. [Google Scholar]
- 8.Aukema J.E., Leung B., Kovacs K., Chivers C., Britton K.O., Englin J., Frankel S.J., Haight R.G., Holmes T.P., Liebhold A.M., et al. Economic Impacts of Non-Native Forest Insects in the Continental United States. PLoS ONE. 2011;6:e24587. doi: 10.1371/journal.pone.0024587. [DOI] [PMC free article] [PubMed] [Google Scholar]
- 9.Baker R., Eyre D., Brunel S., Dupin M., Reynaud P., Jarosik V. Mapping endangered areas for pest risk analysis. In: Venette R.C., editor. Pest Risk Modelling and Mapping for Invasive Alien Species. CABI Publishing; Wallingford, CT, USA: 2015. pp. 18–34. [Google Scholar]
- 10.Barzman M., Lamichhane J.R., Booij K., Boonekamp P., Desneux N., Huber L., Kudsk P., Langrell S.R.H., Ratnadass A., Ricci P., et al. Sustainable Agriculture Reviews. Volume 17. Springer; Cham, Switzerland: 2015. Research and development priorities in the face of climate change and rapidly evolving pests; pp. 1–27. [Google Scholar]
- 11.Abellán P., Tella J.L., Carrete M., Cardador L., Anadón J.D. Climate matching drives spread rate but not establishment success in recent unintentional bird introductions. Proc. Natl. Acad. Sci. USA. 2017;114:9385–9390. doi: 10.1073/pnas.1704815114. [DOI] [PMC free article] [PubMed] [Google Scholar]
- 12.Atwater D.Z., Ervine C., Barney J.N. Climatic niche shifts are common in introduced plants. Nat. Ecol. Evol. 2018;2:34–43. doi: 10.1038/s41559-017-0396-z. [DOI] [PubMed] [Google Scholar]
- 13.Blackburn T.M., Pyšek P., Bacher S., Carlton J.T., Duncan R.P., Jarošík V., Wilson J.R.U., Richardson D.M. A proposed unified framework for biological invasions. Trends Ecol. Evol. 2011;26:333–339. doi: 10.1016/j.tree.2011.03.023. [DOI] [PubMed] [Google Scholar]
- 14.Duffy E.A.J. In: Monograph of the Immature Stages of Australasian Timber Beetles (Cerambycidae) Trustees of the British Museum, editor. British Museum (Natural History); London, UK: 1963. p. 235. [Google Scholar]
- 15.Hanks L.M., Paine T.D., Millar J.G., Campbell C.D., Schuch U.K. Water relations of host trees and resistance to the phloem-boring beetle Phoracantha semipunctata F. (Coleoptera: Cerambycidae) Oecologia. 1999;119:400–407. doi: 10.1007/s004420050801. [DOI] [PubMed] [Google Scholar]
- 16.Cadahia D. The importance of insect pests of eucalyptus in the Mediterranean Region. Bull. OEPP. 1986;16:265–283. doi: 10.1111/j.1365-2338.1986.tb00277.x. [DOI] [Google Scholar]
- 17.Hanks L.M., Millar J.G., Paine T.D. Dispersal of the eucalyptus longhorned borer (Coleoptera: Cerambycidae) in urban landscapes. Environ. Entomol. 1998;27:1418–1424. doi: 10.1093/ee/27.6.1418. [DOI] [Google Scholar]
- 18.CABI . Phoracantha semipunctata (eucalyptus longhorned borer) CABI Compendium; Wallingford, UK: 2022. [DOI] [Google Scholar]
- 19.El-Yousfi M. Phoracantha semipunctata au Maroc. Ecologie et Méthodes de Lutte. Note Technique de la Division de Recherches et d’Experimentation Forestières. Dir. Eaux Forêts Rabat Moroc. 1982;12:167–170. [Google Scholar]
- 20.Tirado L.G. Phoracantha semipunctata in south-western Spain: Control and damage. Bull. OEPP. 1986;16:289–292. doi: 10.1111/j.1365-2338.1986.tb00279.x. [DOI] [Google Scholar]
- 21.EPPO Data sheets on quarantine organisms. EPPO Bull. 1983;13:1–14. doi: 10.1111/j.1365-2338.1983.tb01712.x. [DOI] [Google Scholar]
- 22.Elith J., Leathwick J.R. Species distribution models: Ecological explanation and prediction across space and time. Annu. Rev. Ecol. Evol. Syst. 2009;40:677–697. doi: 10.1146/annurev.ecolsys.110308.120159. [DOI] [Google Scholar]
- 23.Kearney M., Porter W. Mechanistic niche modelling: Combining physiological and spatial data to predict species’ ranges. Ecol. Lett. 2009;12:334–350. doi: 10.1111/j.1461-0248.2008.01277.x. [DOI] [PubMed] [Google Scholar]
- 24.Lantschner M.V., Vega G., Corley J.C. Predicting the distribution of harmful species and their natural enemies in agricultural, livestock and forestry systems: An overview. Int. J. Pest Manag. 2019;65:190–206. doi: 10.1080/09670874.2018.1533664. [DOI] [Google Scholar]
- 25.Hao T., Elith J., Guillera-Arroita G., Lahoz-Monfort J.J. A review of evidence about use and performance of species distribution modelling ensembles like BIOMOD. Divers. Distrib. 2019;25:839–852. doi: 10.1111/ddi.12892. [DOI] [Google Scholar]
- 26.Araújo M.B., New M. Ensemble forecasting of species distributions. Trends Ecol. Evol. 2007;22:42–47. doi: 10.1016/j.tree.2006.09.010. [DOI] [PubMed] [Google Scholar]
- 27.Dormann C.F., Calabrese J.M., Guillera-Arroita G., Matechou E., Bahn V., Bartoń F., Hartig F. Model averaging in ecology: A review of Bayesian, information-theoretic and tactical approaches. Ecol. Monogr. 2018;88:485–504. doi: 10.1002/ecm.1309. [DOI] [Google Scholar]
- 28.GBIF.org, GBIF Occurrence Download. [(accessed on 15 November 2022)]. Available online: https://www.gbif.org/occurrence/download/0166104-220831081235567.
- 29.Mendel Z. Seasonal development of the eucalypt borer, Phoracantha semipunctata, In Israel. Phytoparasitica. 1985;13:85–93. doi: 10.1007/BF02980885. [DOI] [Google Scholar]
- 30.Paine T., Millar J., Hanks L. Integrated program protects trees from eucalyptus longhorned borer. Hilgardia. 1995;49:34–37. doi: 10.3733/ca.v049n01p34. [DOI] [Google Scholar]
- 31.Dhahri S., Lieutier F., Charfi F.C., Mohamed L.B.J. Distribution, preference and performance of Phoracantha recurva and Phoracantha semipunctata (Coleoptera: Cerambycidae) on various Eucalyptus species in Tunisia. J. Zool. 2016;XCIX:83–95. [Google Scholar]
- 32.Wisz M.S., Hijmans R.J., Li J., Peterson A.T., Graham C.H., Guisan A., NCEAS Predicting Species Distributions Working Group Effects of sample size on the performance of species distribution models. Divers. Distrib. 2008;14:763–773. doi: 10.1111/j.1472-4642.2008.00482.x. [DOI] [Google Scholar]
- 33.Warren D.L., Glor R.E., Turelli M. ENMTools: A toolbox for comparative studies of environmental niche models. Ecography. 2010;33:607–611. doi: 10.1111/j.1600-0587.2009.06142.x. [DOI] [Google Scholar]
- 34.Fick S.E., Hijmans R.J. WorldClim 2: New 1km spatial resolution climate surfaces for global land areas. Int. J. Climatol. 2017;37:4302–4315. doi: 10.1002/joc.5086. [DOI] [Google Scholar]
- 35.Allouche O., Tsoar A., Kadmon R. Assessing the accuracy of species distribution models: Prevalence, kappa and the true skill statistic (TSS) J. Appl. Ecol. 2006;43:1223–1232. doi: 10.1111/j.1365-2664.2006.01214.x. [DOI] [Google Scholar]
- 36.Peterson A.T., Papeş M., Soberón J. Rethinking receiver operating characteristic analysis applications in ecological niche modeling. Ecol. Model. 2008;213:63–72. doi: 10.1016/j.ecolmodel.2007.11.008. [DOI] [Google Scholar]
- 37.Di Cola V., Broennimann O., Petitpierre B., Breiner F.T., D’Amen M., Randin C., Engler R., Pottier J., Pio D., Dubuis A., et al. ecospat: An R package to support spatial analyses and modeling of species niches and distributions. Ecography. 2017;40:774–787. doi: 10.1111/ecog.02671. [DOI] [Google Scholar]
- 38.Schoener T.W. Nonsynchronous spatial overlap of lizards in patchy habitats. Ecology. 1970;51:408–418. doi: 10.2307/1935376. [DOI] [Google Scholar]
- 39.Warren D.L., Glor R.E., Turelli M. Environmental niche equivalency versus conservatism: Quantitative approaches to niche evolution. Evolution. 2008;62:2868–2883. doi: 10.1111/j.1558-5646.2008.00482.x. [DOI] [PubMed] [Google Scholar]
- 40.Aalto J., Luoto M. Integrating climate and local factors for geomorphological distribution models. Earth Surf. Process. Landf. 2014;39:1729–1740. doi: 10.1002/esp.3554. [DOI] [Google Scholar]
- 41.Fang Y., Zhang X., Wei H., Wang D., Chen R., Wang L., Gu W. Predicting the invasive trend of exotic plants in China based on the ensemble model under climate change: A case for three invasive plants of Asteraceae. Sci. Total Environ. 2021;756:143841. doi: 10.1016/j.scitotenv.2020.143841. [DOI] [PubMed] [Google Scholar]
- 42.Herrera C., Jurado-Rivera J.A., Leza M. Ensemble of small models as a tool for alien invasive species management planning: Evaluation of Vespa Velutina (Hymenoptera: Vespidae) under Mediterranean island conditions. J. Pest Sci. 2022:1–13. doi: 10.1007/s10340-022-01491-7. [DOI] [Google Scholar]
- 43.Dong X.H., Ju T., Grenouillet G., Laffaille P., Lek S., Liu J. Spatial pattern and determinants of global invasion risk of an invasive species, sharpbelly Hemiculter leucisculus (Basilesky, 1855) Sci. Total Environ. 2020;711:134661. doi: 10.1016/j.scitotenv.2019.134661. [DOI] [PubMed] [Google Scholar]
- 44.Tabor J.A., Koch J.B. Ensemble models predict invasive bee habitat suitability will expand under future climate scenarios in Hawai’i. Insects. 2021;12:443. doi: 10.3390/insects12050443. [DOI] [PMC free article] [PubMed] [Google Scholar]
- 45.Mech A.M., Tobin P.C., Teskey R.O., Rhea J.R., Gand H.I. Increases in summer temperatures decrease the survival of an invasive forest insect. Biol. Invasions. 2018;20:365–374. doi: 10.1007/s10530-017-1537-7. [DOI] [Google Scholar]
- 46.Pureswaran D.S., Roques A., Battisti A. Forest Insects and Climate Change. Curr. For. Rep. 2018;4:35–50. doi: 10.1007/s40725-018-0075-6. [DOI] [Google Scholar]
- 47.Tirado L.G. Life table for Phoracantha semipunctata Fab. (Coleoptera, Cerambycidae). Perforator of eucalyptus in the south-east of Spain. Bol. Sanid. Veg. Plagas. 1987;13:283–301. [Google Scholar]
- 48.González-Moreno P., Diez J.M., Ibáñez I., Font X., Vilà M. Plant invasions are context-dependent: Multiscale effects of climate, human activity and habitat. Divers. Distrib. 2014;20:720–731. doi: 10.1111/ddi.12206. [DOI] [Google Scholar]
- 49.Chapman D.S., Gunn I.D.M., Pringle H.E.K., Siriwardena G.M., Taylor P., Thackeray S.J., Willby N.J., Carvalho L. Invasion of freshwater ecosystems is promoted by network connectivity to hotspots of human activity. Glob. Ecol. Biogeogr. 2020;29:645–655. doi: 10.1111/geb.13051. [DOI] [Google Scholar]
- 50.Luo Z., Mowery M.A., Cheng X., Yang Q., Hu J., Andrade M.C.B. Realized niche shift of an invasive widow spider: Drivers and impacts of human activities. Front. Zool. 2022;19:25. doi: 10.1186/s12983-022-00470-z. [DOI] [PMC free article] [PubMed] [Google Scholar]
- 51.Turnbull J.W. Eucalypt plantations. New For. 1999;17:37–52. doi: 10.1023/A:1006524911242. [DOI] [Google Scholar]
- 52.Peterson A.T., Soberón J., Sánchez-Cordero V. Conservatism of ecological niches in evolutionary time. Science. 1999;285:1265–1267. doi: 10.1126/science.285.5431.1265. [DOI] [PubMed] [Google Scholar]
- 53.Sales L.P., Ribeiro B.R., Hayward M.W., Paglia A., Passamani M., Loyola R. Niche conservatism and the invasive potential of the wild boar. J. Anim. Ecol. 2017;86:1214–1223. doi: 10.1111/1365-2656.12721. [DOI] [PubMed] [Google Scholar]
- 54.Liu C., Wolter C., Xian W., Jeschke J.M. Most invasive species largely conserve their climatic niche. Proc. Natl. Acad. Sci. USA. 2020;117:23643–23651. doi: 10.1073/pnas.2004289117. [DOI] [PMC free article] [PubMed] [Google Scholar]
- 55.El-Yousfi M. The principles of control of Phoracantha semipunctata Fabr. Bol. Sanid. Veg. Plagas. 1989;15:129–137. [Google Scholar]
- 56.Fraval A., Haddan M. Platystasius transversus (Hym: Platygasteridae) egg parasitoid of Phoracantha semipunctata (Col.: Cerambycidae), in Morocco. Entomophaga. 1988;33:381–382. doi: 10.1007/BF02372629. [DOI] [Google Scholar]
- 57.Paine T.D., Millar J.G. Insect pests of eucalypts in California: Implications of managing invasive species. Bull. Entomol. Res. 2002;92:147–152. doi: 10.1079/BER2002151. [DOI] [PubMed] [Google Scholar]
- 58.Ji W., Han K., Lu Y., Wei J. Predicting the potential distribution of the vine mealybug, Planococcus ficus under climate change by MaxEnt. Crop Prot. 2020;137:105268. doi: 10.1016/j.cropro.2020.105268. [DOI] [Google Scholar]
- 59.Ramasamy M., Das B., Ramesh R. Predicting climate change impacts on potential worldwide distribution of fall armyworm based on CMIP6 projections. J. Pest Sci. 2021;95:841–854. doi: 10.1007/s10340-021-01411-1. [DOI] [Google Scholar]
- 60.Garrett K.A. Big data insights into pest spread. Nat. Clim. Chang. 2013;3:955–957. doi: 10.1038/nclimate2041. [DOI] [Google Scholar]
- 61.Santana P.A., Jr., Kumar L., Da Silva R.S., Pereira J.L., Picanço M.C. Assessing the impact of climate change on the worldwide distribution of Dalbulus maidis (DeLong) using MaxEnt. Pest Manag. Sci. 2019;75:2706–2715. doi: 10.1002/ps.5379. [DOI] [PubMed] [Google Scholar]
Associated Data
This section collects any data citations, data availability statements, or supplementary materials included in this article.
Supplementary Materials
Data Availability Statement
The data presented in this study are available in this article.


