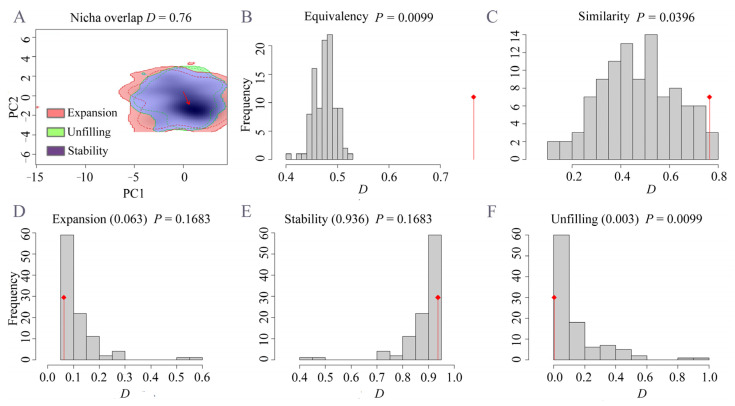
Figure 7.
Niche comparison for Phoracantha semipunctata between native (Australia) and invasive areas. (A): niche overlap on two principal component axes (PC1 and PC2). (B,C): equivalency and similarity tests. (D–F): niche expansion, stability, and unfilling tests. Red lines in the plots indicate the observed value of niche overlap, and gray bars indicate the distribution of D values for 100 simulated comparisons.

