

Abstract
Effects of indoor temperature (T∞) and relative humidity (RH∞) on the airborne transmission of sneeze droplets in a confined space were studied over the T∞ range of 15–30 °C and RH∞ of 22–62%. In addition, a theoretical evaporation model was used to estimate the droplet lifetime based on experimental data. The results showed that the body mass index (BMI) of the participants played an important role in the sneezing jet velocity, while the impact of the BMI and gender of participants was insignificant on the size distribution of droplets. At a critical relative humidity RH∞,crit of 46%, the sneezing jet velocity and droplet lifetime were roughly independent of T∞. At RH∞ < RH∞,crit, the sneezing jet velocity decreased by increasing T∞ from 15 to 30 °C, while its trend was reversed at RH∞ > RH∞,crit. The maximum spreading distance of aerosols increased by decreasing the RH∞ and increasing T∞, while the droplet lifetime increased by decreasing T∞ at RH∞ > RH∞,crit. The mean diameter of aerosolized droplets was less affected by T∞ than the large droplets at RH∞ < RH∞,crit, while the mean diameter and number fraction of aerosols were more influenced by RH∞ than the T∞ in the range of 46% ≤ RH∞ ≤ 62%. In summary, this study suggests suitable indoor environmental conditions by considering the transmission rate and lifetime of respiratory droplets to reduce the spread of COVID-19.
Graphical abstract
Supplementary Information
The online version contains supplementary material available at 10.1007/s11356-023-25421-x.
Keywords: Indoor environment, Sneeze droplets, Airborne transmission, Droplet lifetime, COVID-19 spread
Introduction
The COVID-19 pandemic caused by the novel coronavirus (SARS-CoV-2) has provided an excellent demand for a better understanding of the spread of the virus in indoor environments. Based on the requirements, the World Health Organization (WHO 2020) continuously reviewed available data to update guidelines for identifying the transmission routes and preventing SARS-CoV-2 virus transmission (Chen et al. 2021). It has been well approved that the pathogenic agent can transmit by the dispersion of virus-containing aerosols in the air or through contact of a healthy person with the infected person (Balachandar et al. 2020; Burke et al. 2020; Chan 2020; Huang et al. 2021). Huang et al. (2020) reported that the virus was predominately transferred through the airborne transmission of droplets exiting the respiratory system of the susceptible person. According to the classification presented by the WHO, respiratory droplets smaller than 5 μm are known as droplet nuclei or aerosol. The droplets in the diameter range of 5–100 μm are known as medium droplets, while those larger than 100 μm are known as large droplets. Liu et al. (2020) indicated that the aerosols containing the SARS-CoV-2 virus are mainly categorized into two diameter ranges, including 0.25–1.0 μm and > 2.5 μm. However, the ultimate limit on the diameter of the droplet nuclei is the diameter of the SARS-CoV-2 virus in the range of ~ 0.1–0.14 μm (Ziegler 2020; Huang et al. 2021). However, the high impact of aerosolized droplets on the airborne transmission of the SARS-CoV-2 virus has been well reviewed in the literature (Li et al. 2020; Burke et al. 2020; Shang et al. 2021; Ghaffari et al. 2021; Liu et al. 2022; Kumar et al. 2021).
The transmission of COVID-19 is influenced by various factors including social distancing guidelines, indoor and outdoor environmental conditions, ventilation rate in an indoor environment, and the use of various kinds of masks (Katre et al. 2021). Mittal et al. (2020) reported that the airborne transmission of aerosolized droplets over long distances is mainly driven by ambient flows, while indoor environments pose a particular challenge to disease transmission. There are extensive studies on the effect of evaporation rate on the airborne transmission of respiratory droplets (Tatsuno and Nagao 1986; Chaudhuri et al. 2020; Wang et al. 2020). It has been approved that the viruses persist in the dry residue as droplet nuclei upon complete evaporation of respiratory droplets, which continue to pose infection risks over extended distances (Li et al. 2020). Earlier studies have confirmed that the evaporation rate of respiratory droplets can affect SARS-CoV-2 survivability on airborne or surfaces under different relative humidity and temperature conditions (Ismail et al. 2022; Yin et al. 2022).
Respiratory droplets with a diameter between 100 and 200 μm are mostly dried, caused by evaporation or settling by gravity or the breakage into aerosolized droplets at distance intervals of more than 1.5 m (De Cao et al. 2014). In contrast, aerosols can stay in the air for long times and transfer the virus over long distances (Xie et al. 2007). Li et al. (2020) reported that the evaporation time of droplets depends significantly on their diameters, so the evaporation time of a 50-μm droplet is reported to be 4.5 s for pure water and 12.5 s for the salt mass fraction of 6.5% at 30 °C and RH∞ of 84%. They found that the maximum life expectancy of a 100-μm droplet is ~ 8.5 s with a maximum spreading distance of 6.6 m, while the maximum spreading distance of a 1000 μm droplet is 1.3 m (Li et al. 2020).
The airborne transmission of aerosols and droplets (ranging from ~ 10 μm to several tens of micrometers in diameter) mainly depended on the type of respiratory activities such as breathing (Deng et al. 2021), speaking (Asadi et al. 2019), coughing (Dhand and Li 2020; Katre et al. 2021), and sneezing (Bourouiba 2020; Liu et al. 2021a). Both parameters of airborne transmission and lifetime are strongly influenced by the physical properties of droplets such as diameter, density, viscosity, and content of non-volatile (NaCl, carbohydrate, protein, lipids, and DNA) (Tatsuno and Nagao 1986; De Cao et al. 2014; Bake et al. 2019). The environmental conditions including ambient temperature T∞ and relative humidity RH∞ can significantly affect the airborne transmission of droplets (Asadi et al. 2019; Balusamy et al. 2021). Duguid (1946) studied 12,000 droplets and 21,000 droplet nuclei by microscopic measurements to obtain the size distribution of the respiratory droplets. Based on their results, the droplet size diameters were estimated in the range of 1–2000 μm, while most droplets (up to 95%) lay in the diameter range between 2 and 100 μm.
Experimental measurements by the aerodynamic particle sizer system showed that the size distribution of droplets was described by three parameters of geometric mean diameter, geometric standard deviation, and the total number of particles or mass concentration. Chen et al. (2020) represented that the impact of the aerosols is significantly higher than the large droplets in the airborne transmission of infectious agents. According to health instructions, the transmission of the virus indoors can be controlled by reducing the number of dust particles, hygiene and disinfection of surfaces, wearing a relevant mask, and using personal protective equipment (Bake et al. 2019; Noorimotlagh et al. 2021; Liu et al. 2022). The presence of external flows such as wind, fans, air conditioners, and ventilators plays an influential role in reducing the viral load of indoor environments (Xie et al. 2007; Ai and Melikov 2018; Maggiore et al. 2021). Air conditioners can significantly reduce the concentration of contaminants by exchanging indoor air with the outside air or circulating indoor air by internal type equipped with an HEPA filter (Li et al. 2007; Bahramian et al. 2023).
The stability of the virus in the air is highly dependent on the temperature and humidity of the environment (van Doremalen et al. 2020). The virus stability analysis showed that the SARS-CoV-2 virus could remain active in the air for about 3 h and up to 72 h on the surface under ambient conditions in the laboratory (Asadi et al. 2019; van Doremalen et al. 2020). The virus can survive in the refrigerator for up to two weeks, while at 50 °C, it becomes inactive in less than 30 min and at 90 °C in less than one minute (Dhand and Li 2020). van Doremalen et al. (2020) reported that the SARS-CoV-2 remained viable in aerosols throughout 3 h and reduced infectious titer from 103.5 to 102.7 TCID50 (defined as median tissue culture infectious dose) per liter of air.
The optical measurement techniques for determining the diameter of spreading droplets can be divided into light extinction and light scattering methods (Yang et al. 2007; Morawska et al. 2009; Lommel et al. 2021; Kirar et al. 2022). The light extinction technique is based on the extinction of light beams due to various reflection and absorption phenomena in high concentrations of droplets, such as thick fog (Tatsuno and Nagao 1986). In contrast, the light scattering method is based on the refraction and reflection of light caused by collisions with individual droplets, mainly used for flow streams with low droplet numbers, such as sneezing and coughing (Dhand and Li 2020; Maggiore et al. 2021). Scharfman et al. (2013) used a light scattering technique using a high-speed video with an imaging rate of 1000 to 8000 femtoseconds to study the spread of droplets from a person’s mouth during sneezing and coughing. They used two monochromic cameras to photograph through light settings and a dark background to sharpen the resulting image.
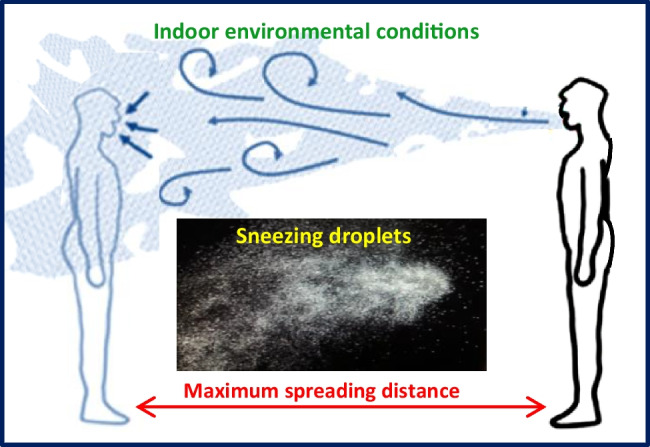
The spreading distance of droplets coming out from the mouth of a sick person during sneezing or coughing depends on the velocity, size distribution and diameter of the respiratory droplets, and the height of the people. A review of previous studies has shown that teenagers and short adults should keep a social distance of at least 2 m from taller people (Feng et al. 2020; Katre et al. 2021). According to Feng et al. (2020), 2-m social distance is insufficient to prevent COVID-19 airborne transmission due to the complexity of environmental conditions. Aydin et al. (2020) reported that the droplet velocity of people with a height of 0.5–2.6 m, while sneezing is in the range of 20–50 m/s, while the normal breathing velocity changed in the range of 0.70–7.4 m/s by considering the age and gender of participants. In the case of a person 1.7 m tall, they reported that the virus could transmit horizontally up to 0.88 m during breathing or talking, while the same person could transmit the virus up to 2.94 m during sneezing or coughing (Aydin et al. 2020). Bourouiba (2020) reported that the sneeze droplets could transmit up to 7–8 m. Rábano-Suárez et al. (2020) reported that the droplets containing coronavirus with a diameter range of 400–900 μm are transmitted in an indoor environment with a velocity of 50 m/s and a spreading distance of 1.8 m. The data obtained from the literature has been mainly used to control the social distancing of individuals and create executive instructions.
There are contradictions in the experimental results in determining the size distribution and propagation behavior of droplets and the spreading distance of droplets exhaled from the person’s mouth to the falling to the ground in the sneezing so far. In parallel with the studies that focused on evaluating virus survival in various environments, further studies are also needed to update the healthcare instructions based on the role of indoor environmental conditions on the maximum spreading distance and lifetime of droplets. Therefore, the impact of indoor environmental factors on the airborne transmission of respiratory droplets becomes important.
In this study, the effect of environmental conditions on the airborne transmission of sneeze droplets in a confined space was studied experimentally and theoretically. The effect of T∞ (in the range of 15–30 °C) and RH∞ (in the range of 22–62%) was studied in the case of 20 male and female students. The shadowgraph imaging technique was used to obtain the maximum spreading distance of droplets, while the number fraction of droplets was examined by a laser particle sizer. The main goals of this study are to (a) characterize the dispersion modes of sneeze droplets in different indoor environmental conditions, (b) determine the number fraction, size distribution, and velocity of sneezing jet and ejected droplets, (c) study the relationship between the BMI of male and female participants and the maximum spreading distance of droplets, (d) study the combined effect of RH∞ and T∞ on the transmission modes of droplets and determine a critical environmental condition to estimate the maximum spreading distance of droplets; and (e) estimate the droplets lifetime at different environmental conditions using the simple theoretical model based on the experimental data. The results of this study can help to update the social distancing guidelines to control virus-carrying droplets in indoor environments.
Experiments and methods
Human participants and their condition
Twenty healthy students, including ten boys and girls, in a limited age range of 22–23 years old without chronic respiratory disease, were recruited for the experiments. The characteristics of all participants are given in Supplementary Table S1. All participants completed the written consent and ethics statement before the tests. They agreed to participate in the tests of their own free will and follow all hygiene instructions during the experiments. Before testing, all participants presented a negative PCR test result. The average height of male and female participants was 1.73 m and 1.67 m, respectively. The body mass index (BMI) of male participants was in the range of 23.1–26.0, while in the case of female participants, it was in the range of 22.3–24.8. The use of pepper stimulants helped the participants to sneeze more easily. All tests were performed in the morning and 2 h after breakfast to minimize the effect of the food on the density and viscosity of the saliva droplets. Participants were not allowed to drink water or other drinks before the tests. To prevent overcrowding of participants, the experiments were performed on one person individually in one day to avoid the transmission of the virus from person to person. The experiments were performed in 30 working days during October 2021 AD. All participants underwent fever thermography tests at the beginning and end of the experiments. At the end of each test, the air conditioning system was activated to allow clean air to enter the room. Then, all imaging equipment and the floor were disinfected with an alcoholic solution. The participants in the experiments were immediately transferred from the dark room to the outdoor to minimize the person stay indoors.
Experimental procedure
Imaging setup
An equipped shadowgraph imaging system was used to study the airborne transmission and spreading distance of sneeze droplets in the air. Figure 1 shows the schematic diagram of the shadowgraph imaging system. The system includes an anemometer, a white light-emitting diode (LED), a spherical concave mirror with a radius of 40 cm and a focal length of 20 cm, adjusting the base of the mirror according to the height of participants, a high-speed digital camera (CCD), and a computer system to record and analyze the resulting images. The CCD camera (Ophir-Spiricon Inc. Model: BA 150, shooting rate: 250–500 fps, resolution: 640 pixels × 480 pixels) was positioned at 60° to the direction of the LED light. The position of the participant concerning the reflected light was set to 90°. A minimum shooting time of 1000 femtoseconds was used to achieve images with a good resolution based on the literature (Scharfman et al. 2013).
Fig. 1.

The schematic diagram of the shadowgraph imaging system
An LED white light source was supplied by the halolux device (halolux LED-15, STREPPEL). The LED light has two advantages: (1) it converts about 30–50% of the energy into light. Thus, suitable indoor conditions were created for imaging droplets without a significant effect on temperature and (2) the absence of infrared and ultraviolet rays in the environment. During the imaging, the concave mirror attached to the support base refracted the LED light in the desired direction. The vertical position of the mirror was adjusted between 1.63 and 1.73 m based on the average size of students. The velocity of the sneeze flow exhaled from the participant’s mouth was determined by an anemometer (MC 4.0 Multiprobe anemometer). The probe of the anemometer (MiniAir20 Macro vane type anemometer) was used to determine the maximum airflow velocity in the range of 0.2–20 m/s with an accuracy of ± 1% of full scale and ± 1.5% of reading. The mean airflow velocity was determined by repeating sneezing at least three times. Anemometer accessories including temperature and humidity sensors (HygroAir 20) were sensitive to changes of the T∞ in the range of − 20–70 °C (± 0.3 °C) and RH∞ in percentage (%) of 10–90% (± 1.8%).
Vocalization experiments
The imaging operation was carried out in a dark room based on the radiation and reflection of the LED light. The surface area of the room was 24 m2 with a width of 4 m and a length of 6 m, which was equipped with an adjustable air conditioner system. T∞ was adjusted in the four levels of 15 °C, 20 °C, 25 °C, and 30 °C. A thermal cooling/heating system was used to regulate the internal temperature. RH∞ was set at 22%, 30%, 38%, 46%, 54%, and 62%. The suggested temperatures were selected based on ASHRAE (2017) regulations for different indoor spaces. The standard room temperatures of some buildings and spaces are represented in Supplementary Table S2. In addition, RH∞ values were selected based on the building design regulations that are reported in the US standard (RH∞ < 65% as per ASHRAE 2013b (ANSI/ASHRAE 2013) and Europe (20 < RH∞ < 70% as per EN 16,798–1 (CEN, EN 16798, 2019).
To provide a desired RH∞ in the laboratory, a water container was heated on a heater for a certain period. The LED light hits on the surface of the concave mirror from the front. At first, the reflected light from the mirror hits the airflow caused by sneezing under the set conditions. Then, the light passed through the sharp edge of the metal piece in the light reflection path to remove marginal images. The participants started to sneeze at 15 cm near the concave mirror. This distance is selected based on previous results in achieving appropriate quality images (Scharfman et al. 2013). The experiments were repeated three times for each person in front of the concave mirror.
Analysis and processing of images
The obtained images were analyzed using a 17″ flat LCD monitor at up to 200% magnification. During imaging, the CCD camera was stepped backward and forward between each frame to ensure the continuity of the airflow from the single sneeze. This method helps to digitize the airflow of sneezing in the boundaries as accurately as possible. The quality of the obtained images from the experiments depends on the temperature and humidity of the dark room. Based on experience, higher contrast and better sharpness of the images were created in the hot airflow due to the exhalation of participants (Tex ~ 37 °C) colliding with a cooler temperature of the laboratory (T∞ = 15–30 °C). As T∞ got closer to the individuals’ exhalation temperature (Tex ≤ 30 °C), the lower contrast images were produced, leading to difficulty in processing and analyzing images. The repeating imaging showed that the difference of 7 °C between the exhalation temperatures of participants with the environment temperature is desirable to achieve high-quality black-and-white shadowgraph images.
There are considerations in a designed imaging system that can pose severe challenges in choosing the calibration method. Applying an appropriate calibration method can reduce errors during imaging. Accordingly, the expected errors in the shadowgraph imaging experiments were as follows: (1) The change in the position of the person’s head while sneezing affects the airborne transmission and size distribution of respiratory droplets in the dark room. Thus, it is expected that an error will occur at the droplet imaging position, which is called a “position error.” (2) The “droplet size error” is related to the incorrect estimate of the initial droplet diameter dispersed in the dark room. This error can be significant during the formation of large droplets from small droplets or the breakage of large droplets into small droplets due to droplet–droplet collisions. The t-test was used to analyze the difference in average diameter of sneeze droplets for male and female participants with different BMIs and also the airborne transmission of droplets at different T∞ and RH∞. Previous studies had shown that the t-test yielded relevant results when the sample numbers were lower than 30 (Yang et al. 2007).
Droplet size distribution analysis
A laser particle sizer (Malvern Instruments Ltd, UK) was applied to determine the size distribution of sneeze droplets in the range of 0.1–1000 μm at different indoor environmental conditions. It should be noted that the possible biases in the estimation of droplet size due to the evaporation across the distance between the Malvern particle analyzer and the volunteer’s mouth were estimated by repeating experiments at different times. The schematic diagram of the laser system is shown in Supplementary Fig. S1. The laser beam with a diameter of 0.012 m was produced by a helium–neon laser transmitter and passed through the measurement zone. Forty-two optical sensors were installed in the receive module to analyze the light diffraction pattern. Also, the light diffraction pattern was examined by a scattering model. The size distribution ranging from 0.1 to 1000 μm was recorded immediately while sneezing. The sampling frequency was set as 2.5 kHz to ensure that the measurement was a real-time data acquisition process. This means that the size distribution of the sneeze droplets was recorded at every 0.4 ms. During the experiments, T∞ was fixed at 15 °C, 20 °C, 25 °C, and 30 °C, and RH∞ was adjusted at 22%, 30%, 38%, 46%, 54%, and 62%.
Assuming that all of the droplets exhaled by sneeze are spherical, and the number size distribution, which is the ratio of the number of total droplets with diameters in the range of 0.1–1000 μm, the total number of all the sneeze droplets with any diameter can be calculated as follows:
| 1 |
where Pn,i is the droplet number fraction of sneeze droplets, Ni is the total number of droplets in diameter class i, where i = 1, 2, …, n. N is the total number of droplets, V is the total volume of all droplets (m3), and Di is the geometric mean diameter of droplets (μm). PV,i is the ratio of the volume of all droplets with diameters in diameter class i and the total volume of all droplets with any diameter. The total number of sneeze droplets for male and female participants are determined to be 5535 ± 43 and 5715 ± 44, respectively, corresponding to 5.535 ± 0.043 #/cm3 and 5.715 ± 0.044 #/cm3, respectively. The results were determined by averaging the data obtained from sneezing experiments through three repeated sneezes of each of the 20 male and female participants (sneezing 30 times for male and 30 times for female participants), which are given in Supplementary Tables S3 and S4. The obtained result was in good agreement with the data reported by Duguid (1946) for a single-simulated weak sneeze.
Theoretical model of evaporating droplets
The evaporation rate of sneeze droplets is governed by the transport of water vapor from the droplet’s surface into the air. In the theoretical model, it is assumed that the droplets evaporate in a quiescent environment at a fixed temperature and relative humidity. Bhardwaj and Agrawal (2020) remarked that the quasi-steady assumption used in the diffusion-based model is valid when the heat equilibrium time is much smaller than the lifetime of the droplet. By assuming the quasi-steady state condition, one-dimensional transport in the r-direction, the spherical symmetry of droplets, and an ideal gas mixture of the gas phase, the evaporation mass flux, (kg/s), at the droplet surface can be written as
| 2 |
where ρs is the density at the droplet surface (kg/m3), Ds is the binary diffusivity coefficient at the droplet surface (m2/s), and rs is the droplet radius (μm). BM is the Spalding mass transfer number, which is defined as
| 3 |
where Yw,s and Yw,∞ are the mole fraction of vapor at the droplet surface and at the far-field (dry air), respectively. The above parameters can be given by the following:
| 4 |
| 5 |
where Xw,s is the mole fraction of water vapor, and subscript da denotes the dry air. Mw and Mda (g/mol) denote the molecular weight of water and dry air, respectively. The impact of non-volatile content diluted in the droplet was implemented by simply limiting the evaporation of droplets to reach “droplet nuclei” containing the solute composition. The salt with a concentration of 6 mg/ml is the most important non-volatile component in respiratory droplets, which helps to encapsulate the virus float in the air (Robinson et al. 2021). Wells (1934) and Xie et al. (2007) showed that the assumption of pure water droplets led to a good result because male human saliva mainly consists of water. Recent studies have shown that saliva droplets can reduce ~ 20–30% of their initial diameter before forming the droplet nuclei due to evaporation (Liu et al. 2017; Lieber et al. 2021). Katre et al. (2021) showed that the evaporation process decreases the volume of aerosolized droplets with time until a non-evaporating core of non-volatile organic liquid and salt is left. They found that the evaporation time of larger droplets is more affected by the addition of salt water than by small-sized droplets.
In the case of sneeze droplets, it can be assumed well that the liquid composition is considered to be pure water. Liu et al. (2021a) showed that the effect of non-volatile content immediately after the ejection of sneeze droplets is quite small, so the droplet diameter closely follows the D2-law: , where Ds,0 is the initial droplet diameter (μm), and is the effective evaporation coefficient (m2/s). At , it is assumed that the droplet is cooled from its initial value, while at , the heat is transferred from the T∞ to the droplet surface after reaching the wet-bulb limit for evaporating of droplets. At a certain point, known as an equilibrium diameter, the evaporation process is stopped. The droplet lifetime, introduced as a parameter that droplets are no longer being airborne they settle to the floor or deposit on walls, is estimated by solving the mass balance equation of droplet (Chaudhuri et al. 2020):
| 6 |
where subscript f represents the water droplet property. Assuming constant water density, the droplet lifetime (τ) is determined by solving Eq. (6) with the initial boundary condition, Df (0) = Ds,0.
| 7 |
where is determined by:
| 8 |
is essentially the time where two curves, evaporation time tevap and tevap as a function of Ds,0, intersect with each other to represent the maximum time of a droplet can remain in the air before it is removed either by evaporation or settled due to gravity (Sirignano 2010; Chaudhuri et al. 2020). At low T∞ and high RH∞, small droplets cannot evaporate quickly, resulting in in Eq. (8). When Yw,∞ approximates to Yw,s, BM approaches zero, and (Eq. (7)) becomes infinity. Ds,0 corresponding to is defined as Dcrit, dependent on the different indoor environments (T∞, RH∞) under atmospheric pressure. Ds,0 was set based on the mean value of droplet size distribution that was obtained from the Malvern particle analyzer for the sneezing of the male and female participants. T∞ and RH∞ were set according to the environmental conditions of the laboratory. Table 1 shows the thermodynamic and transport property values used in the droplet lifetime computations.
Table 1.
The thermodynamic and transport property values used in the droplet lifetime computations
| T∞ (°C) | ρf (kg/m3) | ρw (kg/m3) | Pw,sat (atm) | Dv (m2/s) | Mw | Mda |
|---|---|---|---|---|---|---|
| 15 | 9.982 × 10² | 1.730 × 10⁻² | 1.217 × 10⁻² | 2.420 × 10⁻² | 18.01 | 28.97 |
| 20 | 9.982 × 10² | 1.730 × 10⁻² | 1.953 × 10⁻² | 2.420 × 10⁻² | 18.01 | 28.97 |
| 25 | 9.982 × 10² | 1.730 × 10⁻² | 2.687 × 10⁻² | 2.420 × 10⁻² | 18.01 | 28.97 |
| 30 | 9.982 × 10² | 1.730 × 10⁻² | 3.419 × 10⁻² | 2.420 × 10⁻² | 18.01 | 28.97 |
Results and discussion
Maximum velocity of sneezing jet
Figure 2 shows the maximum velocity of the sneezing jet coming out from the participants’ mouths in the case of the male (cases 1–10) and female participants (cases 11–20). T∞ and RH∞ were set to 20 °C and 30%, respectively. Error bars denote the standard deviation corresponding to at least three experiments. The results showed that the sneezing jet velocity was ~ 25.0–38.3 m/s, which was in good agreement with the reported data for the velocity of sneeze droplets (Zhou et al. 2018). The maximum velocity of the sneezing jet was increased gradually by increasing the BMI of participants, where the BMI of the male was ~ 5.1% higher than the female participants (Supplementary Table S1). The sneezing jet velocity in the case of the male participants was ~ 15.3% higher than the female participants. As the male participants were on average taller and heavier than the female participants in the current study, it can be concluded that the sneezing jet velocity is a function of the BMI of the participants.
Fig. 2.

The maximum velocity of the sneezing jet in the case of (a) male participants and (b) female participants at T∞ = 20 °C and RH∞ = 30%
By comparing the sneezing jet velocity of participants 3 (male) and 17 (female) with the same BMI of 24, it can be concluded that the sneezing jet velocity of the male participant (31.2 ± 0.4 m/s) was slightly higher than the female participant (31.0 ± 0.4 m/s). An important reason for this difference can be attributed to the large size of the laryngeal cartilage and the length of the thyroid cartilage in the male as compared to the female participants (Ajmani et al. 1980; Chang et al. 2021). Another reason can be attributed to the emission rate of droplets exhaled from the participants during expiratory activities (Han et al. 2013; Bourouiba 2020), where the higher possibility of droplet–droplet interactions led to the lower sneezing jet velocity. Asadi et al. (2019) reported that the droplet emission rate of the female was relatively higher than the male participants during the speech, and this trend increased by increasing the age of the participants. However, they reported there is no clear correlation between the results of the droplet emission rate with the BMI of participants during the reading of participants at a voice amplitude of 85 dB (Asadi et al. 2019). Based on the statistical analysis, the rise in the sneezing jet velocity caused by an increase in the BMI follows the same trend that indicated that the effect of the BMI on the sneezing jet velocity was more dominant than the gender of participants, which was in good agreement with the previous results (Asadi et al. 2019). By considering the mean mouth opening of participants while sneezing (~ 4.0 ± 0.95 cm2), a large volume of droplets was ejected quickly. Thus, the Reynolds number is estimated at 104, which was in good agreement with the ones found by Bourouiba (2020).
Figure 3 shows the effect of temperature and relative humidity of the indoor environment on the maximum velocity of the sneezing jet in the case of participants 3 (a) and 17 (b). Error bars denote the standard deviation corresponding to at least three experiments. A reason for choosing cases 3 and 17 was the negligible value of “position error” during the experiments because of the same BMI and age of the two participants to minimize their effects on the results. The results showed that the maximum velocity of the sneezing jet decreased by increasing RH∞ in the male and female participants. The effect of T∞ on the sneezing jet velocity becomes ignored at the critical relative humidity RH∞,crit value of 46%. In other words, an increase in the T∞ does not necessarily lead to the reduction of the sneezing jet velocity. At RH∞ < RH∞,crit, the sneezing jet velocity decreased by increasing T∞ from 15 to 30 °C, while the reverse trend was found at RH∞ > RH∞,crit. In addition, the gradient of changes in the sneeze velocity profile significantly increases by decreasing RH∞ at RH∞ < RH∞,crit. At RH∞ = RH∞,crit, the sneezing jet velocity was roughly independent of the indoor temperature. An analysis of the results indicated that differences in the sneezing jet velocity at RH∞ = RH∞,crit were 0.12 m/s and 0.25 m/s in the case of participants 3 and 17, respectively. In contrast, maximum differences in the results at different room temperatures were obtained at RH∞ = 22%. The effect of T∞ on the velocity gradient of the sneezing jet was gradually reduced by increasing RH∞ from 22 to 30% and then abruptly reduced in the range of 30% ≤ RH∞ ≤ 46%. In contrast, the effect of T∞ on the velocity gradient of the sneezing jet was gradually increased by increasing RH∞ in the range of RH∞ > RH∞,crit.
Fig. 3.

The effect of temperature and relative humidity of indoor environment on the maximum velocity of sneezing jet in the case of participants 3 (a) and 17 (b)
As T∞ increases, the equilibrium diameter of the suspended droplets reduces and the droplet lifetime reduces due to the evaporation of droplets (Wang et al. 2020; Liu et al. 2021a, b). The equilibrium diameter of sneeze droplets under the evaporation process is dependent on the T∞ and RH∞ of the indoor environment. The airborne transmission of droplets decelerates at the high values of RH∞ and low values of T∞, which is consistent with the reported results in the literature (Chen 2020; Liu et al. 2021b). However, temperature changes are usually accompanied by changes in relative humidity, and the overall effect of environmental conditions on transmission rates has been difficult to ascertain (Mittal et al. 2020). Lin and Marr (2020) found that the risk of SARS-CoV-2 virus transmission was inversely proportional to the RH∞ and directly proportional to the daily temperature, where the virus viability was considerably reduced at RH∞ of more than ~ 55% due to control of the evaporation kinetics of virus-laden droplets.
Propagation mode of droplets
Figure 4 shows the propagation mode of droplets in the air while sneezing of participant 3 during the periods of 0.08 s (a), 0.15 s (b), 0.28 s (c), 0.44 s (d), 0.53 s (e), 0.67 s (f), 0.79 s (g), and 0.86 s (h). T∞ and RH∞ were set to 20 °C and 30%, respectively. At 0.08 s, the exhaled droplets form a complex elliptical mass (Fig. 4a), defined as “puff,” strongly influenced by size distribution, volume fraction, and velocity of exhaled sneezing jet. The volume fraction of droplets within the puff at the ejection zone was lower than 10−4 (Liu et al. 2021a). The puff mainly remains coherent, except for a portion that separates as a vortex ring and travels faster than the main part (Fig. 4a). The existence of the fast-moving vortex ring in the head of the puff has been attributed to the formation of turbulent eddies of droplets (Burke et al. 2020; Liu et al. 2021a, b). Katre et al. (2021) found that the smaller droplets tend to remain within the puff, with their velocities decelerating in conjunction with the exhaled puff. In contrast, the larger droplets are affected by gravity and tend to settle quickly on the ground.
Fig. 4.

The propagation mode of the droplets in the air while sneezing of participant 3 at periods of 0.08 s (a), 0.15 s (b), 0.28 s (c), 0.44 s (d), 0.53 (e), 0.67 s (f), 0.79 s (g), and 0.86 s (h) [T∞ = 20 °C and RH∞ = 30%]
The volume fraction of droplets in the puff gradually decreases over time because of the rapid evaporation and settlement of large droplets on the ground (Liu et al. 2021b). A high initial puff velocity led to the form of Brownian motion and a strong collision of droplets, which led to the form of chaotic nature of the puff. Liu et al. (2021a) suggested that the classical recommendation of 2 m may need to be re-evaluated because of the chaotic nature of puff dynamics. A high number fraction of larger droplets preferentially accumulates in strain-dominated zones as they are spun out by a turbulent flow regime. However, smaller droplets can remain suspended in the air for long times, called the “droplet cloud” (Fig. 4b). At 0.15 s, the maximum spreading distance of droplets increased, while the tendency of the droplets to move downward gradually intensified, leading the path of the droplets to become near to a conical shape.
A high momentum flux of the airflow expulsion during the sneezing of participants led to the creation of a sneezing jet, which had a throw area even longer than the visible area by the CCD camera. The image processing results showed that the maximum spreading distance of droplets at 0.08 s and 0.15 s was 0.34 0.03 m and 1.22 0.05 m, respectively. This result indicates a rise of approximately seven times in the maximum spreading distance of the droplets in the mentioned time interval, representing the turbulent flow regime of the sneezing jet. A significant difference in the spreading distance of the sneezing jet in the time interval of 0.08–0.15 s can be attributed to the change in the conical shape of the sneezing jet and the sudden expansion of the dense mass of the droplets. In the x-direction, only the drag force is present, whereas the z-direction comprises the gravitational and buoyancy forces. The larger droplets fall at a short distance due to the gravitational acceleration effect, while the smaller droplets fall to the ground at further distances. The ballistic trajectories of large droplets, which can almost be seen in the case of the droplets transported by the fast-moving vortex ring, create a turbulent flow regime, while the aerosols have a varying degree of buoyancy in the turbulent airflow (Liu et al. 2021a). The motion angle of the droplets relative to the horizontal direction was variable in the range of 25 3° (Fig. 4b), depending on the repetition of the experiments, which agreed with the data reported in the literature (Arumuru et al. 2020). However, it has previously been reported that human subjects can even shake their head in the range of ± 30° while sneezing (Ahmed et al. 2021).
The obtained images at 0.28 s and 0.44 s showed that the suspended droplets traveled horizontally with a maximum spreading distance of 1.94 0.04 m and 2.82 0.03 m, respectively (Fig. 4c, d). At 0.28 s, the conical shape of the suspended droplets almost disappeared, while the vertical expansion of the droplets cloud can be seen in the air (Fig. 4c). The total volume of the droplets cloud reaches ~ 3–4 times its initial value at 0.28 s by repeating the sneeze experiments depending on the evaporation rate or leaving of large droplets from droplets cloud. However, the total volume of suspended droplets was reduced over time depending on indoor environmental conditions. Katre et al. (2021) reported that the droplet cough cloud loses mass steadily over its traverse time through evaporation and droplet breakup effects, whereas the droplet cloud loses over 60% of its initial liquid mass during 5 s after the cough event begins. The maximum spreading distance of sneeze droplets was achieved after 0.44 s. The propagation mode of the droplets was well detectable with the presence of new large droplets caused by the droplet–droplet collisions (Fig. 4d). At 0.53 s (Fig. 4e), the maximum spreading distance traveled by the droplets was 2.91 0.02 m, which indicates minor change compared with the 0.44 s. At 0.53 s, the direction of droplets was mainly inclined downwards. The formation of initial circulation of droplets was seen on the upper part of the droplets cloud, which can be attributed to the effect of the gravity and buoyancy forces.
At 0.67 s, the downward motion of larger droplets and upward motion of the smaller droplets leads to the form of vortex flow, which is formed by the circulation of the droplets (Fig. 4f). Therefore, an equilibrium state would be expected between the drag, gravity, and buoyancy forces in the suspended droplets. Katre et al. (2021) found that the drag force is insignificant for large droplets, while the drag and the gravity forces are of the same order of magnitude for intermediate-sized droplets. The magnitude of the mentioned forces can affect the durability and suspension of the droplets and aerosols in the air. At 0.79 s (Fig. 4g), a low fraction of large droplets and a high fraction of small droplets are still suspended in the air because of the evaporation process. A significant decrease in the volume fraction of suspended droplets near participants’ mouth can be found at times over 0.79 s, which can be attributed to the evaporation of small droplets. At 0.86 s (Fig. 4h), the Brownian motion and weak collision of aerosols led to the formation of new large droplets or breakage into a smaller droplet, which was confirmed by the previous results (Robinson et al. 2021).
Figure 5 shows the propagation mode of suspended droplets while sneezing of participants 1 (a), 10 (b), 11 (c), and 20 (d) at a time of 0.27 ± 0.04 s. T∞ and RH∞ were set at 20 °C and 30%, respectively. It should be noted that the cases of 1 and 10 had the highest and lowest BMI among the male participants, while the cases of 11 and 20 had the highest and lowest BMI value among the female participants. The images’ analysis indicated that the highest and lowest values of the maximum spreading distance of the droplets were obtained for participants with high and low BMI, respectively. In the case of participants of the same age, the maximum spreading distance of sneeze droplets in the case of the male participants was 20.1% higher than the female participants. An important reason for this result can be attributed to the higher mean sneezing jet velocity of male participants (~ 33.4 m/s) compared to the female participants (~ 29.7 m/s) because of the higher BMI of male participants as compared to the female participants. Another reason was ascribed to the difference in lung function of the male as compared to the female participants. Chang et al. (2021) experiments using a pulmonary function test showed that male participants had a faster decrease in forced vital capacity and forced expiratory volume in 1 s than female participants. In the case of male participants (cases 1 and 10), their maximum detectable spreading distances of the droplets varied between 2.86 and 3.37 m, while for the female participants (cases 11 and 20) were 2.37–2.68 m. The maximum detectable 2-D area for droplet propagation while sneezing of the male and female participants was 0.58–0.73 m2 and 0.44–0.61 m2, respectively. In addition, the maximum detectable 2-D projected area for the male and female participants was 2.82–5.83 and 2.13–5.67 m2/s, respectively. The results showed that the maximum area of the droplets occupied by the sneezing jet in males was 24.5% higher than in the female participants.
Fig. 5.

The propagation mode of suspended droplets during the time of 0.27 0.04 s after sneezing of cases 1 (a), 10 (b), 11 (c), and 20 (d) [T∞ = 20 °C and RH∞ = 30%]
Figure 6 shows the maximum spreading distance of sneeze droplets that were detectable by the CCD camera in the case of male (a) and female participants (b). T∞ and RH∞ were set at 20 °C and 30%, respectively. Error bars denote the standard deviation corresponding to at least three experiments. The results showed that the maximum spreading distance of traveled droplets in the male participants was, on average, 18.7% higher than the female participants. Therefore, it can be concluded that the BMI of participants is adequate for the maximum spreading distance of the droplets. It is worth mentioning that the large size of the laryngeal cartilage and the length of the thyroid cartilage in the males are higher than in the female participants (Ajmani et al. 1980; Chang et al. 2021).
Fig. 6.

The maximum spreading distance of sneeze droplets in male (a) and female (b) participants [T∞ = 20 °C and RH∞ = 30%]
Size distribution of the droplets
Figure 7 shows the size distribution of the droplets at different periods of 0.08 s, 0.28 s, and 0.79 s after sneezing of participant 3 when T∞ = 30 °C and RH∞ = 22% (dry indoor air). At 0.08 s, which corresponds to the puff, it can be seen a bimodal distribution curve includes a weak peak in the diameter range of 2–20 µm and a strong peak in the 35–950 µm with a mean droplet diameter of ~ 125 µm. The obtained bimodal distribution curve was consistent with Han et al. (2013) results, which reported that sneezing generates a wide range of droplets with a diameter range of 40–1000 µm. At 0.28 s, which represents the droplets cloud, a bimodal distribution curve is seen, while the height of the stronger peak in the range of ~ 0.5–11 µm was ~ 45% higher than the weaker peak in the range of 25–550 µm with a mean droplet diameter of ~ 34 µm. At 0.79 s, representing the fully dispersed nature of the droplets, a unimodal distribution curve with a sharp peak in the diameter range of ~ 0.5–20.0 μm was observed with a mean droplet diameter of ~ 5 µm. The results indicated that most of the large and even medium droplets had fallen on the ground due to the gravity force. The data analysis showed that the mean diameters of the droplets in the puff, droplets cloud, and the fully dispersed nature of the droplets were 285 µm, 123 µm, and 45 µm, respectively. This result indicated that the size distribution of the droplets mainly decreases over time because of the gravitational deposition (large droplets) or shrinkage of small and medium droplets by the evaporation process. A temporary increase in the size distribution of the droplets was ascribed to the hygroscopic growth or coagulation of suspended droplets with each other.
Fig. 7.
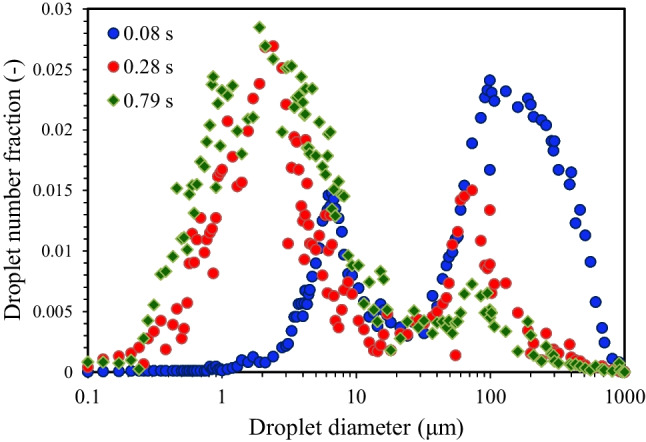
Size distribution of initial droplets at different periods of 0.08 s, 0.28 s, and 0.79 s after sneezing of participant 3 [T∞ = 30 °C and RH∞ = 22%]
Figure 8 shows the size distribution of suspended droplets in the case of participants 3 (a) and 17 (b) under T∞ of 15 °C, 20 °C, 25 °C, and 30 °C at RH∞ = 22%. The measuring time of 0.55 s was selected in the experiments based on the data reported by Morawska et al. (2009) in calculating water droplet evaporation time. It was found from imaging experiments that the local droplet circulation occurred at times more than 0.5 s after sneezing, which led to considerable change in the size of suspended droplets because of evaporation (Fig. 4e). Regardless of the gender of the participants, it can be seen that the droplet size distribution due to sneezing roughly follows the logarithmic distribution. The data analysis showed that the mean diameter of aerosols decreased from ~ 2.4 to 1.9 μm, while the mean diameter of medium droplets decreased from ~ 59.6 to 45.8 μm by increasing the T∞ from 15 to 30 °C. The number fraction of aerosolized, medium, and large droplets at 0.55 s after sneezing is shown in Supplementary Table S5. In the case of the male participant, the number fraction of aerosols increased from 64.8 to 73.1% by increasing the T∞ from 15 to 30 °C, while the number of medium droplets decreased from ~ 30.2 to 24.4% and large droplets decreased from 5.0 to 2.5%. The aerosolized droplets had a higher number fraction than the medium and large droplets. Therefore, the effect of T∞ on the aerodynamic diameter of the aerosolized droplets and their size distribution with a high number fraction was notably higher than the large droplets. The aerosolized droplets can stay in the air for a long time, while the large droplets quickly settle on the ground by gravity force (Lieber et al. 2021; Liu et al. 2021b; Katre et al. 2021).
Fig. 8.

Size distribution of droplets in the case of participants 3 (a) and 17 (b) under T∞ of 15 °C, 20 °C, 25 °C, and 30 °C at RH∞ = 22% [The results were obtained at 0.55 s after sneezing]
By comparison of data (Fig. 8a, b), the gender of the participants did not significantly affect the size distribution of the droplets. De Cao et al. (2014) suggested that the size distribution of droplets was a function of their geometric mean diameter, geometric standard deviation, and total number fraction or mass concentration. T-test analysis showed no significant difference between the participants’ BMI and the size distribution of sneeze droplets (p > 0.1). This finding was in good agreement with previous results (Yang et al. 2007; Asadi et al. 2019). The “droplet size error” is a major drawback of droplet size distribution experiments, caused by the shrinkage of the droplets along with the origin source (participants’ mouth) and the sampling position by evaporation. At RH∞ = 22% and T∞ = 30 °C, due to a high evaporation rate, the droplet diameter at the sampling position was smaller than the ones coming out from the participants’ mouth, while the evaporation rate decelerates at T∞ = 15 °C. Thus, the droplet diameter at the sampling position was near than the ones coming out from the participants’ mouth at a low T∞. Lieber et al. (2021) reported that the droplet reaches an equilibrium diameter after evaporation of the water content, which correlates well to 20% of the initial diameter for the RH∞ between 6 and 65%.
Figure 9 shows the size distribution of suspended droplets at 0.55 s after sneezing in the case of participants 3 (a) and 17 (b) at T∞ = 30 °C under RH∞ of 22%, 30%, 38%, 46%, 54%, and 62%. The results showed that the mean diameter of the droplets increased significantly by increasing RH∞ in the male and female participants. Also, the possibility of aerosols was decreased by increasing RH∞. In the case of participant 3, the mean diameter of the droplets increases from 1.9 to 12.1 μm (~ 6.37 times increase) by increasing the RH∞ from 22 to 62% (Fig. 9a). The number fraction of aerosolized, medium, and large droplets at 0.55 s after sneezing is shown in Supplementary Table S6. The continuous changes in the aerodynamic diameter of the droplets are known as an important reason for the inaccuracy of the results, especially at a high RH∞ (see Supplementary Table S6), which has been confirmed previously in the literature (Lieber et al. 2021; Liu et al. 2021a, b). In the case of participant 3, the number fraction of aerosols decreased from 76.7 to 10.4% by increasing the RH∞ from 22 to 62%, while the number fraction of medium droplets increased from 21.1 to 69.1%, and large droplets increased from 2.3 to 20.5% at the same RH∞ (Fig. 9a). By comparison of the results, it can be found that the effect of RH∞ on the change in the size and number fraction of aerosols and droplets is significantly higher than the effect of T∞. In the case of participant 17, similar results were found based on the analysis of the droplet size, which indicates that RH∞ cannot be affected by the gender of participants.
Fig. 9.
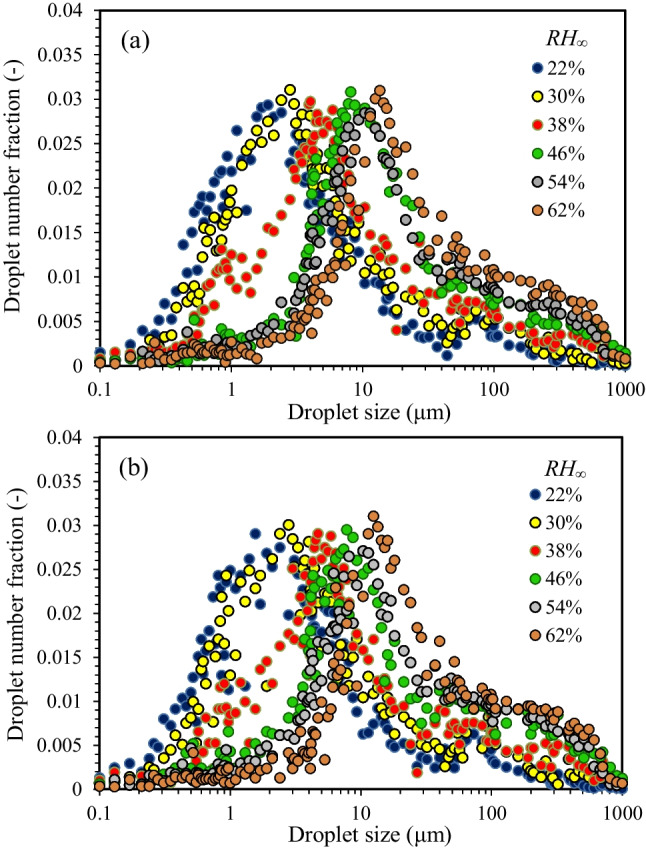
Size distribution of suspended droplets in the case of participants 3 (a) and 17 (b) under RH∞ of 22%, 30%, 38%, 46%, 54%, and 62% at T∞ = 30 °C [The results were obtained at 0.55 s after sneezing]
The data analysis showed that the T∞ has the highest negative effect on the number fraction of large droplets, while the RH∞ has the highest negative effect on the number fraction of aerosols. The results also indicated that increasing the mean diameter of the droplets by increasing the RH∞ almost follows a similar trend for male and female participants. The position of the peaks in the size distribution curve moves toward a larger droplet diameter by increasing RH∞. The highest mean diameter of droplets was obtained at RH∞ > RH∞,crit, where the hygroscopic growth of the droplets was most influenced by RH∞ (Morawska et al. 2009; Liu et al. 2021a, b). Therefore, the effect of the RH∞ on the diameter of the droplets was more significant than the T∞ at RH∞ ≥ RH∞,crit. This finding was confirmed by previous results, which indicated a high RH∞ is suitable for the survival of the aerosols containing airborne human coronavirus 2293 (Ijaz et al. 1985). The lowest mean diameter of droplets was obtained over the range of RH∞ < RH∞,crit, where the shrinkage of droplets by evaporation was more influenced by T∞ than the RH∞.
The t-test analysis showed that the difference between the mean diameter of the droplets in the male and female participants was insignificant (p > 0.15). However, the mean diameter of the droplets in the female participants was ~ 1.6% larger than the male participants, which was in good agreement with Asadi et al. (2019) findings. Minor differences in droplet size distribution might be interfered with by the difference in droplet generation mechanism while sneezing of participants (Morawska et al. 2009). The possibility of large droplets is increased by increasing RH∞. Thus, the relative humidity parameter can lead to an increase in the mean diameter of droplets. Previous results showed that the droplet lifetime increased with decreasing their diameter, which was in good agreement with the reported results in the literature (Morawska et al. 2009; Chen 2020). Morawska et al. (2009) found that the droplets with diameters of 1 μm evaporate within a few milliseconds, even under the high RH∞, while droplets with diameters of 10 μm and 100 μm remain suspended in the air for up to a few tens of seconds, and almost few minutes, respectively. Therefore, the persistence of the virus agent in the air can significantly affect the infection agents controlling strategy. The density of the respiratory droplets containing the SARS-CoV-2 virus is higher than the density of pure water because the density of the SARS-CoV-2 virus was estimated to be 1350 kg/m3 (van Doremalen et al. 2020; Ziegler 2020). As the droplet’s diameter decreases, the density of the remaining droplet increases, which in turn decelerates the transmission rate of infectious droplets.
Calculation of droplets lifetime
Figure 10 shows the distribution of Dcrit (a) and (b) over indoor environmental conditions according to experiments. According to Fig. 10a, at a fixed T∞, Dcrit decreased by increasing the RH∞, while at a fixed RH∞, Dcrit increased by increasing the T∞. At maximum T∞ (30 °C) and minimum RH∞ (22%), where the evaporation rate is higher than the other conditions, the suspended droplets quickly evaporate and shrinkage before they settle. The diameter of suspended droplets reduces to its equilibrium diameter (the minimum diameter of dry remains from the droplet). In contrast, at the minimum value of T∞ (15 °C) and maximum value of RH∞ (62%), where the evaporation rate is slow, the low number fraction of aerosols can easily remain suspended in the indoor air (Fig. 10a).
Fig. 10.

The distribution of Dcrit (a) and (b) over the studied conditions
Obviously, increasing the droplet’s diameter reduces the lifetime of the suspended droplets. As a result, the aerosols can remain suspended in dry indoor conditions for longer times than the medium droplets, while the medium droplets can only remain suspended in humid indoor conditions. Li et al. (2020) found that the small droplets having a size of less than 50 μm remain in the air for a longer period and their dispersion distance is insensitive to relative humidity at the same temperature. Despite the different initial diameters of the droplets, reaches its maximum value at low T∞ and high RH∞ (Fig. 10b). This allows the droplet cloud to travel a longer spreading distance than other indoor environmental conditions, while attains its minimum value at high T∞ and low RH∞. Morawska et al. (2009) found that smaller droplets settle very slowly and therefore evaporate before settling, while larger droplets settle rapidly and do not evaporate much during this time. They reported the equilibrium evaporation of expiratory droplets with diameters between 0.5 and 20 μm occurred within a few seconds, which is consistent with the results of the present study.
At Ds,0 > Dcrit, the droplets settled under gravity, while at Ds,0 ≤ Dcrit evaporate. The contour lines nearly straighten over the range of 46% ≤ RH∞ ≤ 62% and 15 ○C ≤ T∞ ≤ 20 ○C, indicating that a cool and humid indoor environment did not necessarily lead to a decrease in the lifetime of droplets so that the large droplets remained suspended in indoor air. In the range of 22% ≤ RH∞ ≤ 38% and 25 ○C ≤ T∞ ≤ 30 ○C, the contour lines tend to bend, which means that the lifetime of the droplets considerably decreased in the moderate and dry indoor environment due to the shrinkage of the droplets by evaporation (Fig. 10b). Katre et al. (2021) showed that the travel distance and lifetime of the large droplets may increase due to the reduction of volume in the evaporation. Our results clearly indicated that the effect of RH∞ is much higher than the T∞ in the change of droplet lifetime. Chen et al. (2020) showed that the droplet lifetime can decrease at high ambient temperatures and low relative humidity, but it depends on the relative humidity of the outdoor environment. They reported that the droplet lifetime decreases only for RH∞ < 40%. Balusamy et al. (2021) reported that the lifetime of droplets is strongly dependent on humidity when RH > 90%. As a result, the control of the indoor environment plays a more effective role than the temperature in the survival of virus-laden droplets in a confined space.
Figure 11 shows the calculated droplet lifetime (τ) versus RH∞ (%) at T∞ levels of 15 °C, 20 °C, 25 °C, and 30 °C while sneezing in the case of participant 3 (a) and participant 17 (b). The results indicated that the lifetime of the droplets increased by increasing their initial diameter, e. g., (Eq. (6)), and it also significantly increased by increasing RH∞. A higher T∞ associated with a lower RH∞ can decrease the droplet lifetime, reducing the possibility of virus survival. Balusamy et al. (2021) found that the longest lifetime of droplets was observed with the combination of low T and high RH, while the droplet’s lifetime progressively reduces as the humidity falls and the temperature rises for both sets of parameters considered in the diffusion-based theoretical model. Lieber et al. (2021) found that the lifetime of the droplets smaller than 50 μm was mainly determined by the equilibrium droplet size, while in the case of the droplets between 50 and 150 μm, the droplet lifetime was dominated by the evaporation process, where the droplet lifetime increases with the lower RH∞ and higher T∞. At RH∞ > RH∞,crit, where the shrinkage rate of the droplets lies at its minimum value, the droplet lifetime increases sharply; thus, the impact of T∞ comes to its maximum value. In contrast, a maximum droplet lifetime in an indoor environment was achieved at low T∞, where the impact of T∞ reaches its minimum value.
Fig. 11.

The calculated droplet lifetime (τ) versus RH∞ (%) at T∞ levels of 15 °C, 20 °C, 25 °C, and 30 °C while sneezing of cases 3 (a) and 17 (b)
The theoretical results were confirmed by the experimental data reported in the literature (Xie et al. 2007; Morawska et al. 2009). Xie et al. (2007) experimentally found a good correlation between the initial and equilibrium droplet diameter by considering the evaporation theory for an aqueous solution with a specific amount of non-volatile components. Morawska et al. (2009) reported that expiratory droplets of the order of 1 to 10 μm exist for up to a few milliseconds to a few tens of a second, while large droplets survive for up to almost a minute. Scharfman et al. (2013) showed that the lifetime of the droplets containing the SARS-Cov-2 virus at 25 °C was ~ 6 s and its value increased up to 27 s with increasing the droplet diameter. However, the present results provide information about the lifetime of the droplets; the limiting in the ultimate diameter and non-volatile content of droplets in real conditions necessitates future studies in this regard.
The calculated droplet lifetime ranges from ~ 5.6 s (at RH∞ = 22%) to ~ 28.2 s (at RH∞ = 62%) when T∞ is set to 15 °C, while the droplet lifetime varied from ~ 7.8 s (at RH∞ = 22%) to ~ 19.5 s (at RH∞ = 62%) when T∞ is set to 30 °C. These results indicated that the influence of RH∞ was significantly higher than the T∞ on the droplet lifetime examined in the mentioned indoor environmental conditions. The high sensitivity of the droplet lifetime to the relative humidity in the ambient conditions was confirmed previously by Balusamy et al. (2021). In addition, the predicted values of the droplet lifetime by considering pure water led to an under-predicted real lifetime of saliva droplets (Balusamy et al. 2021).
The results also showed that an increase in droplet diameter from 6.3 to 12.3 μm led to an increase in the droplet lifetime from ~ 5.6 s (at T∞ = 15 °C) to ~ 7.8 s (at T∞ = 30 °C) when RH∞ is set to 22%. Aydin et al. (2020) calculated that the falling time of respiratory droplets containing the SARS-CoV-2 virus was according to Newton’s law of motion by considering the gravitational and drag forces. They reported that the falling time of coronavirus is a function of respiratory droplet diameter and human height. In the case of 1.7-m human height, the falling time of aerosols with diameters of 4.4 µm and 1.0 µm was 9.42 s and 18.13 s, respectively. The assumptions and the properties that are considered in the analysis of the related mass balance equation, i.e., spherical symmetry, ideal gas mixture, binary diffusion system, no re-condensation on droplet surface, and constant properties of droplet led to an uncertainty in the estimation of the droplet lifetime (Chaudhuri et al. 2020).
Conclusion
In summary, the effect of indoor environmental conditions including temperature (T∞) and relative humidity (RH∞) was studied on the airborne transmission and lifetime of sneeze droplets in the T∞ range of 15–30 °C and RH∞ of 22–62%. A theoretical droplet evaporation model based on a mass balance equation with simplified assumptions, i.e., the ideal gas mixture, spherical symmetry, constant properties, and no re-condensation of the droplets, was suggested to estimate the droplet lifetime based on the experimental data. The main conclusions and prospects are as follows.
The maximum velocity of the sneezing jet in the case of the male participants was ~ 15.3% higher than the female participants, which was attributed to the higher BMI of the male as compared with the female participants. A similar trend of increasing sneezing jet velocity by increasing BMI of the male and female participants indicated that the gender effect was insignificant on the maximum velocity of the sneezing jet and the size distribution of the droplets under different indoor environmental conditions. However, the effect of the height of the participants cannot be ignored on the axial airborne transmission of droplets.
The monitoring of indoor environmental conditions can help in assessing the propagation of coronavirus infection. An increase in the RH∞ led to a decrease in the evaporation rate of the droplets and the maximum spreading distance of the droplets. However, the effect of RH∞ on the airborne transmission of aerosols (< 5 μm) with chaotic motions was more dominant than the large droplets (> 100 μm) with ballistic trajectories. An increase in the T∞ does not necessarily lead to the decelerating trend of the sneezing jet velocity. A critical relative humidity RH∞,crit of 46% was obtained, which is above that, the droplet lifetime increased exponentially. In addition, at RH∞ = RH∞,crit, the sneezing jet velocity and droplet lifetime of the droplets were roughly independent of the T∞. At RH∞ < RH∞,crit, the sneezing jet velocity decreased by increasing T∞ from 15 to 30 °C, while the reverse trend was found at RH∞ > RH∞,crit. The effect of RH∞ on the diameter and number fraction of aerosols was higher than the T∞ at RH∞ ≥ RH∞,crit. The transmission rate of aerosols decelerated by increasing the RH∞ and decreasing T∞, while at RH∞ > RH∞,crit, the droplet lifetime increased by decreasing T∞ from 30 to 15 °C. At RH∞ < RH∞,crit, the mean diameter and size distribution of aerosols were less affected by T∞ than the large droplets, while the mean diameter and size distribution of droplets were more influenced by T∞ than the RH∞ in the range of 46% ≤ RH∞ ≤ 62%.
The effect of RH∞ on the reduction of droplet lifetime was much higher than the T∞. However, it cannot be ignored the effects of the non-volatile content of the droplets and participants’ height on the lifetime of the droplets. The effect of RH∞ on the size and number fraction of aerosols and droplets was considerably higher than the T∞, while the influence of T∞ on the change in the diameter of large droplets was considerably higher than the aerosols. The number fraction of aerosols increased in high T∞ and low RH∞ environments. Based on the results, decreasing the temperature and increasing the humidity of the environment were more suitable for the virus-containing droplets to remain airborne. Inversely, moderate and dry environments provide better conditions to travel longer spreading distances for droplet clouds than the other indoor environmental conditions.
Of course, the results of the present study cannot guarantee the elimination of the risk of COVID-19 spread, but the obtained data can offer recommendations for further prevention to reduce the survival potential of COVID-19 virus outbreaks in indoor environmental conditions. However, the safe distance cannot be defined for an indoor environment without sufficient ventilation.
Limitations of the study
The existing limitations in scientific knowledge of infection spread are related to the following.
The infected people, whose sneezing is likely to differ from that of healthy people, were not included in the experiments due to compliance with health guidelines.
The effect of the non-volatile compounds, such as salt and proteins, on droplets’ size change during the sneeze due to evaporation was ignored in the theoretical model. Thus, the impact of virus-laden respiratory droplets or non-volatile organic compounds on the evaporation of droplets requires further analysis.
The relationship between the initial size and droplet velocity of the sneeze droplets and their change due to evaporation/condensation effects under different environmental conditions, especially in the turbulent puff, is necessary to study in further work.
The effects of fragmentation, growth, and shrinkage on the number and size of respiratory droplets were not considered in the theoretical model. In addition, discrepancies between experimental data obtained by different instruments and sampling procedures are still significant limitations in this kind of research.
The resultant inhalation, transmission, and deposition of SARS-CoV-2-laden droplets and the relationship between the transmission mechanisms of respiratory droplets in COVID-19 spread were not studied, so further studies should be made on this aspect.
Supplementary Information
Below is the link to the electronic supplementary material.
Acknowledgements
The author would like to thank the Hamedan University of Technology for their experimental support.
Author contribution
Alireza Bahramian: conceptualization, methodology, and writing.
Funding
This work was supported by the Iran National Science Foundation (INSF) organization (Grant No. 99022422).
Data availability
The data that support the findings of this study are available upon request from the corresponding author Alireza Bahramian. The data are not publicly available due to containing information that could compromise research participant privacy/consent.
Declarations
Ethics approval and consent to participate
Not applicable.
Consent for publication
Not applicable.
Competing interests
The author declares no competing interests.
Footnotes
Publisher's note
Springer Nature remains neutral with regard to jurisdictional claims in published maps and institutional affiliations.
References
- Ahmed T, Wendling HE, Mofakham AA, Ahmadi G, Helenbrook BT, Ferro AR, Brown DM, Erath BD. Variability in expiratory trajectory angles during consonant production by one human subject and from a physical mouth model: application to respiratory emission. Indoor Air. 2021;31:1896–1912. doi: 10.1111/ina.12908. [DOI] [PMC free article] [PubMed] [Google Scholar]
- Ai ZT, Melikov AK. Airborne spread of expiratory droplet nuclei between the occupants of indoor environments: a review. Indoor Air. 2018;28:500–524. doi: 10.1111/ina.12465. [DOI] [PubMed] [Google Scholar]
- Ajmani ML, Jain SP, Saxena SK (1980) A metrical study of laryngeal cartilages and their ossification. Anat Anz 148:42–48. https://www.ncbi.nlm.nih.gov/pmc/articles/PMC1257140 [PubMed]
- ANSI/ASHRAE (2013) ANSI/ASHRAE standard 169–2013, in: Climatic Data for Building Design Standards, 8400, p. 104. 10.1038/s41598-020-78110-x
- Arumuru V, Pasa J, Samantaray SS. Experimental visualization of sneezing and efficacy of face masks and shields. Phys Fluids. 2020;32:1–11. doi: 10.1063/5.0030101. [DOI] [PMC free article] [PubMed] [Google Scholar]
- Asadi S, Wexler AS, Cappa CD, Barreda S, Bouvier NM, Ristenpart WD. Aerosol emission and superemission during human speech increase with voice loudness. Sci Rep. 2019;9:1–10. doi: 10.1038/s41598-019-38808-z. [DOI] [PMC free article] [PubMed] [Google Scholar]
- ASHRAE (2017) ANSI/ASHRAE standard 55-2017 for thermal environmental conditions for human occupancy. American Society of Heating, Refrigerating and Air-Conditioning Engineers
- Aydin M, Evrendilek F, Aydin Savas S, Erkan Aydin I, Eren Evrendilek D. Falling dynamics of SARS-CoV2 as a function of respiratory droplet size and human height. J Med Biol Eng. 2020;1:1–7. doi: 10.1007/s40846-020-00575-y. [DOI] [PMC free article] [PubMed] [Google Scholar]
- Bahramian A, Mohammadi M, Ahmadi G (2023) Effect of indoor temperature on the velocity fields and airborne transmission of sneeze droplets: an experimental study and transient CFD modeling. Sci Total Environ 858:159444. 10.1016/j.scitotenv.2022.159444 [DOI] [PMC free article] [PubMed]
- Bake B, Larsson P, Ljungkvist G, Ljungström E, Olin A. Exhaled particles and small airways. Respir Res. 2019;20:1–8. doi: 10.1186/s12931-019-0970-9. [DOI] [PMC free article] [PubMed] [Google Scholar]
- Balachandar S, Zaleski S, Soldati A, Ahmadi G, Bourouiba L. Host-to-host airborne transmission as a multiphase flow problem for science-based social distance guidelines. Int J Multiph Flow. 2020;132:103439. doi: 10.1016/j.ijmultiphaseflow.2020.103439. [DOI] [Google Scholar]
- Balusamy S, Banerjee S, Sahu KC. Lifetime of sessile saliva droplets in the context of SARS-CoV-2. Int Commun Heat Mass Transfer. 2021;123:105178. doi: 10.1016/j.icheatmasstransfer.2021.105178. [DOI] [Google Scholar]
- Bhardwaj R, Agrawal A. Likelihood of survival of coronavirus in a respiratory droplet deposited on a solid surface. Phys Fluids. 2020;32:061704. doi: 10.1063/5.0012009. [DOI] [PMC free article] [PubMed] [Google Scholar]
- Bourouiba L. Turbulent gas clouds and respiratory pathogen emissions: potential implications for reducing transmission of COVID-19. Clinic Rev Educ. 2020;18:1837–1838. doi: 10.1001/jama.2020.4756. [DOI] [PubMed] [Google Scholar]
- Burke RM, Midgley CM, Dratch A, Fenstersheib M, Haupt Th, Holshue M, Ghinai I, Claire Jarashow M, Lo J, McPherson TD, Rudman S, Scott S, Hall AJ, Fry AM, Rolfes MA (2020) Active monitoring of persons exposed to patients with confirmed COVID-19 United States, January-February 2020. Morbidity and mortality weekly report (MMWR) 69:245. 10.15585/mmwr.mm6909e1 [DOI] [PMC free article] [PubMed]
- Chan JFW. A familial cluster of pneumonia associated with the 2019 novel coronavirus indicating person-to-person transmission: a study of a family cluster. Lancet. 2020;395:514–523. doi: 10.1016/S0140-6736(20)30154-9. [DOI] [PMC free article] [PubMed] [Google Scholar]
- Chang C-H, Chen S-C, Geng J-H, Wu D-W, Huang J-C, Wu P-Y. Determinants of longitudinal change of lung function in different gender in a large Taiwanese population follow-up study categories: original investigation. J Pers Med. 2021;11:1033. doi: 10.3390/jpm11101033. [DOI] [PMC free article] [PubMed] [Google Scholar]
- Chaudhuri S, Basu S, Kabi P, Unni VR, Saha A. Modeling the role of respiratory droplets in COVID-19 type pandemics. Phys Fluids. 2020;32:063309. doi: 10.1063/5.0015984. [DOI] [PMC free article] [PubMed] [Google Scholar]
- Chen LD. Effect of ambient temperature and humidity on droplet lifetime – a perspective of exhalation sneeze droplets with COVID-19 virus transmission. Int J Hygiene Environ Health. 2020;229:113568. doi: 10.1016/j.ijheh.2020.113568. [DOI] [PMC free article] [PubMed] [Google Scholar]
- Chen W, Zhang N, Wei J, Yen HL, Li Y (2020) Short-range airborne route dominates exposure of respiratory infection during close contact. Build Environ 176:106859. 10.1101/2020.03.16.20037291
- Chen L, Ban G, Long E, Kalonji G, Cheng Zh, Zhang L, Guo Sh. Estimation of the SARS-CoV-2 transmission probability in confined traffic space and evaluation of the mitigation strategies. Environ Sci Pollut Res. 2021;28:42204–42216. doi: 10.1007/s11356-021-13617-y. [DOI] [PMC free article] [PubMed] [Google Scholar]
- De Cao E, Zagheni E, Manfredi P, Melegaro A. The relative importance of frequency of contacts and duration of exposure for the spread of directly transmitted infections. Biost. 2014;15:470–483. doi: 10.1093/biostatistics/kxu008. [DOI] [PubMed] [Google Scholar]
- Deng X, Gong G, He X, Shi X, Mo L. Control of exhaled SARS-CoV-2-laden aerosols in the interpersonal breathing microenvironment in a ventilated room with limited space air stability. J Environ Sci Stud. 2021;108:175–187. doi: 10.1016/j.jes.2021.01.025. [DOI] [PMC free article] [PubMed] [Google Scholar]
- Dhand R, Li J. Coughs and sneezes: their role in transmission of respiratory viral, infections, including SARS-CoV-2, pulmonary perspective. Am J Respir Crit. 2020;121:651–659. doi: 10.1164/rccm.202004-1263PP. [DOI] [PMC free article] [PubMed] [Google Scholar]
- Duguid JP. The size and the duration of air-carriage of respiratory droplets and droplet-nuclei. J Hygiene. 1946;44:471–479. doi: 10.1164/rccm.202004-1263PP. [DOI] [PMC free article] [PubMed] [Google Scholar]
- Feng Y, Marchal T, Sperry T, Yi H. Influence of wind and relative humidity on the social distancing effectiveness to prevent COVID-19 airborne transmission: a numerical study. J Aerosol Sci. 2020;147:105585. doi: 10.1016/j.jaerosci.2020.105585. [DOI] [PMC free article] [PubMed] [Google Scholar]
- Ghaffari HR, Farshidi H, Alipour V, Dindarloo K, Hassani Azad M, Jamalidoust M, Madani A, Aghamolaei T, Hashemi Y, Fazlzadeh M, Fakhri Y. Detection of SARS-CoV-2 in the indoor air of intensive care unit (ICU) for severe COVID-19 patients and its surroundings: considering the role of environmental conditions. Environ Sci Pollut Res. 2021 doi: 10.1007/s11356-021-16010-x. [DOI] [PMC free article] [PubMed] [Google Scholar]
- Han ZY, Weng WG, Huang QY. Characterizations of particle size distribution of the droplets exhaled by sneeze. J R Soc Interface. 2013;10:20130560. doi: 10.1098/rsif.2013.0560. [DOI] [PMC free article] [PubMed] [Google Scholar]
- Huang C, Wang Y, Li X, Ren L, Zhao J, Hu Y, Zhang L, Fan G, Xu J, Gu X. Clinical features of patients infected with 2019 novel coronavirus in Wuhan, China. Lancet. 2020;395:497–506. doi: 10.1016/S0140-6736(20)30183-5. [DOI] [PMC free article] [PubMed] [Google Scholar]
- Huang N, Pérez P, Kato T, Mikami Y, Okuda KI, Gilmore RC, Domínguez C. The COVID-GRAM tool for patients hospitalized with COVID-19 in Europe. JAMA Intern Med. 2021;1:892–903. doi: 10.1001/jamainternmed.2021.0491. [DOI] [PMC free article] [PubMed] [Google Scholar]
- Ijaz MK, Brunner AH, Sattar SA, Nair RC, Johnson-Lussenburg CM. Survival characteristics of airborne human coronavirus 229E. Gen Virol. 1985;12:2743–2748. doi: 10.1099/0022-1317-66-12-2743. [DOI] [PubMed] [Google Scholar]
- Ismail IMI, Rashid I, Ali M, Saeed Altaf BA, Munir M. Temperature, humidity and outdoor air quality indicators influence COVID-19 spread rate and mortality in major cities of Saudi Arabia. Environ Res. 2022;204:112071. doi: 10.1016/j.envres.2021.112071. [DOI] [PMC free article] [PubMed] [Google Scholar]
- Katre P, Banerjee S, Balusamy S, Sahu KC. Fluid dynamics of respiratory droplets in the context of COVID-19: airborne and surfaceborne transmissions. Phys Fluids. 2021;33:081302. doi: 10.1063/5.0063475. [DOI] [PMC free article] [PubMed] [Google Scholar]
- Kirar PK, Soni SK, Kolhe PS, Sahu KC (2022) An experimental investigation of droplet morphology in swirl flow. J Fluid Mech 938:A6. 10.1017/jfm.2022.146
- Kumar S, Singh R, Kumari N, Karmakar S, Behera M, Siddiqui AJ, Rajput VD, Minkina T, Bauddh K, Kumar N. Current understanding of the influence of environmental factors on SARS-CoV-2 transmission, persistence, and infectivity. Environ Sci Pollut Res. 2021;28:6267–6288. doi: 10.1007/s11356-020-12165-1. [DOI] [PMC free article] [PubMed] [Google Scholar]
- Li Y, Leung GM, Tang JW, Yang X, Chao CY, Lin JZ, Lu JW, Nielsen PV, Niu J, Qian H. Role of ventilation in airborne transmission of infectious agents in the built environment – a multidisciplinary systematic review. Indoor Air. 2007;17:2–18. doi: 10.1111/j.1600-0668.2006.00445.x. [DOI] [PubMed] [Google Scholar]
- Li H, Leong FY, Xu G, Ge Zh, Kang ChW, Lim KH. Dispersion of evaporating cough droplets in tropical outdoor environment. Phys Fluids. 2020;32:113301. doi: 10.1063/5.0026360. [DOI] [PMC free article] [PubMed] [Google Scholar]
- Lieber Ch, Melekidis S, Koch R, Bauer H-J (2021) Insights into the evaporation characteristics of saliva droplets and aerosols: levitation experiments and numerical modeling. Aerosol Sci Technol 154:105760. 10.1016/j.jaerosci.2021.105760 [DOI] [PMC free article] [PubMed]
- Lin K, Marr LC. Humidity-dependent decay of viruses, but not bacteria, in aerosols and droplets follows disinfection kinetics. Environ Sci Technol. 2020;54:1024–1032. doi: 10.1021/acs.est.9b04959. [DOI] [PubMed] [Google Scholar]
- Liu L, Wei J, Li Y, Ooi A. Evaporation and dispersion of respiratory droplets from coughing. Indoor Air. 2017;27:179–190. doi: 10.1111/ina.12297. [DOI] [PubMed] [Google Scholar]
- Liu J, Liao X, Qian S, Yuan J, Wang F, Liu Y, Wang Z, Wang FS, Liu L, Zhang Z. Community transmission of severe acute respiratory syndrome Coronavirus 2, Shenzhen, China. Emerg Infect Dis. 2020;26:1320–1323. doi: 10.3201/eid2606.200239. [DOI] [PMC free article] [PubMed] [Google Scholar]
- Liu K, Allahyari M, Salinas JS, Zgheib N, Balachandar S. Peering inside a cough or sneeze to explain enhanced airborne transmission under dry weather. Sci Rep. 2021;11:9826. doi: 10.1038/s41598-021-89078-7. [DOI] [PMC free article] [PubMed] [Google Scholar]
- Liu K, Allahyari M, Salinas JS, Zgheib N, Balachandar S. Investigation of theoretical scaling laws using large eddy simulations for airborne spreading of viral contagion from sneezing and coughing. Phys Fluids. 2021;33:063318. doi: 10.1063/5.0054651. [DOI] [PMC free article] [PubMed] [Google Scholar]
- Liu J, Hao M, Chen S, Yang Y, Li J, Mei Q, Bian X, Liu K. Numerical evaluation of face masks for prevention of COVID-19 airborne transmission. Environ Sci Pollution Res. 2022 doi: 10.1007/s11356-022-18587-3. [DOI] [PMC free article] [PubMed] [Google Scholar]
- Lommel M, Froese V, Sieber M, Jentzsch M, Bierewirtz T, Hasirci Ü, Rese T, Seefeldt J, Schimek S, Kertzcher U, Paschereit ChO. Novel measurement system for respiratory aerosols and droplets in indoor environments. Indoor Air. 2021;31:1860–1873. doi: 10.1111/ina.12860. [DOI] [PMC free article] [PubMed] [Google Scholar]
- Maggiore E, Tommasini M, Ossi PM. Propagation in outdoor environments of aerosol droplets produced by breath and light cough. Aerosol Sci Technol. 2021;55:340–351. doi: 10.1080/02786826.2020.1847247. [DOI] [Google Scholar]
- Mittal R, Ni R, Seo J-H (2020) The flow physics of COVID-19. J Fluid Mech 894(F2). 10.1017/jfm.2020.330
- Morawska L, Johnson GR, Ristovski ZD, Hargreaves M, Mengersen K, Corbett S, Chao CYH, Li Y, Katoshevski D. Size distribution and sites of origin of droplets expelled from the human respiratory tract during expiratory activities. J Aerosol Sci. 2009;40:256–269. doi: 10.1016/j.jaerosci.2008.11.002. [DOI] [PMC free article] [PubMed] [Google Scholar]
- Noorimotlagh Z, Jaafarzadeh NT, Martínez SS, Mirzaee SA. A systematic review of possible airborne transmission of the COVID-19 virus (SARS-CoV-2) in the indoor air environment. Environ Res. 2021;193:110612. doi: 10.1016/j.envres.2020.110612. [DOI] [PMC free article] [PubMed] [Google Scholar]
- Rábano-Suárez P, Bermejo-Guerrero L, Méndez-Guerrero A, Parra-Serrano J, Toledo-Alfocea D, Sánchez-Tejerina D, Santos-Fernández T, Folgueira-López MD, Gutiérrez-Gutiérrez J, Ayuso-García B, de la Aleja JG, Benito-León J. Generalized myoclonus in COVID-19. Neurology. 2020;11:767–772. doi: 10.1212/WNL.0000000000009829. [DOI] [PMC free article] [PubMed] [Google Scholar]
- Robinson JF, de Anda IR, Moore FJ, Reid JP, Sear RP, Royall CP. Efficacy of face coverings in reducing transmission of COVID-19: calculations based on models of droplet capture. Phys Fluids. 2021;33:1–14. doi: 10.1063/5.0047622. [DOI] [PMC free article] [PubMed] [Google Scholar]
- Scharfman BE, Bush JWM, Techet A (2013) Hydrodynamic instabilities in round liquid jets in gaseous crossflow. In: Proceedings of 25th annual conferences of Institute for Liquid Atomozation and Spray Systems. Pittsburgh. 2013
- Shang Y, Tao Y, Dong J, He F, Tu J. Deposition features of inhaled viral droplets may lead to rapid secondary transmission of COVID-19. J Aerosol Sci. 2021;154:105745. doi: 10.1016/j.jaerosci.2021.105745. [DOI] [PMC free article] [PubMed] [Google Scholar]
- Sirignano WA. Fluid dynamics and transport of droplet and sprays. UK: Cambridge University Press; 2010. [Google Scholar]
- Tatsuno K, Nagao S. Water droplet size measurements in an experimental steam turbine using an optical fiber droplet sizer. J Heat Trans. 1986;108:939–945. doi: 10.1115/1.3247038. [DOI] [Google Scholar]
- van Doremalen N, Bushmaker T, Morris DH, Holbrook MG, Gamble A, Tamin WBN, A, Harcourt J L. Natalie Thornburg J, Gerber SI, Lloyd-Smith JO, de Wit E, Munster VJ, Aerosol and surface stability of SARS-CoV-2 as compared with SARS-Cov-1. N Engl J Med. 2020;382:1564–1567. doi: 10.1056/NEJMc2004973. [DOI] [PMC free article] [PubMed] [Google Scholar]
- Wang B, Wu H, and Wan XF (2020) Transport and fate of human expiratory droplets – a modeling approach. Phys Fluids 32:083307(1–13). 10.1063/5.0021280. [DOI] [PMC free article] [PubMed]
- Wells WF (1934) On air-borne infection: study II. Droplets and droplet nuclei. Am J Epidemiol 20:611–618. 10.1093/oxfordjournals.aje.a118097
- World Health Organization (2020) Modes of transmission of virus causing COVID-19: implications for IPC precaution recommendations, scientific brief, https://apps.who.int/iris/handle/10665/331616/. 29 March 2020c. Geneva: WHO. 2020
- Xie X, Li Y, Chwang ATY, Ho PL, Seto WH. How far droplets can move in indoor environments: revisiting the wells evaporation-falling curve. Indoor Air. 2007;17:211–225. doi: 10.1111/j.1600-0668.2007.00469.x. [DOI] [PubMed] [Google Scholar]
- Yang S, Lee GWM, Chen CM, Wu CC, Yu KP. The size and concentration of droplets generated by coughing in human subjects. J Aerosol Med. 2007;20:484–494. doi: 10.1089/jam.2007.0610. [DOI] [PubMed] [Google Scholar]
- Yin J, Norvihoho LK, Zhou ZhF, Chen B, Wu WT. Investigation on the evaporation and dispersion of human respiratory droplets with COVID-19 virus. Int J Multiph Flow. 2022;147:103904. doi: 10.1016/j.ijmultiphaseflow.2021.103904. [DOI] [Google Scholar]
- Zhou SS, Lukula S, Chiossone C, Nims RW, Suchmann DB, Ijaz MK. Assessment of a respiratory face mask for capturing air pollutants and pathogens including human influenza and rhinoviruses. J Thorac Dis. 2018;10:2059–2069. doi: 10.21037/jtd.2018.03.103. [DOI] [PMC free article] [PubMed] [Google Scholar]
- Ziegler C. SARS-CoV-2 receptor ACE2 is an interferon-stimulated gene in human airway epithelial cells and is enriched in specific cell subsets across tissues. Cell. 2020;1:1016–1035. doi: 10.1016/j.cell.2020.04.035. [DOI] [PMC free article] [PubMed] [Google Scholar]
Associated Data
This section collects any data citations, data availability statements, or supplementary materials included in this article.
Supplementary Materials
Data Availability Statement
The data that support the findings of this study are available upon request from the corresponding author Alireza Bahramian. The data are not publicly available due to containing information that could compromise research participant privacy/consent.