

Abstract
Objective:
Previous studies have shown that the effect of adiposity on blood pressure (BP) intensifies as children become increasingly obese. Black children tend to have greater body mass index (BM1) and higher BP than age-matched white children. It is unclear whether the BP effects of BMI are race-specific among black and white children, and data on obese Hispanic children are sparse. We compared the BP effect of BMI in obese white, black, and Hispanic children.
Methods:
We examined the medical records of children enrolled in a pediatric obesity clinic. Height, weight, BP, and fasting insulin were assessed as part of routine clinical care. The concurrent effects of age and BMI on BP percentile values were examined using semiparametric regression, which allows the accommodation of nonlinear effects.
Results:
The study included 873 children (338 male; 354 black, 447 white, 72 Hispanic; 11.7±3.5 years, BMI 36.2±8.5 kg/m2). While BMI Z-scores were similar among the groups, systolic BP (SBP) was higher in black children and Hispanic children (white: 107 mm Hg; black: 112 mm Hg; Hispanic: 112 mm Hg; p=0.0001). Age, sex, and height-adjusted SBP percentiles were significantly different among the three groups (white: 50; black: 59; Hispanic: 59; p=0.0006). In children of the same age, BP was higher at any given BMI in black children and Hispanic children.
Conclusions:
Among children referred for treatment of obesity, black children and Hispanic children are at a greater risk for having elevated BP when compared to white children of similar age and BMI.
Keywords: black race, ethnicity, Hispanic, hypertension, insulin, pediatric, white race
Introduction
The increase in blood pressure (BP) of children associated with the pediatric obesity epidemic has significant public health implications. Adverse effects of even mild elevations in childhood BP on adult cardiovascular outcomes are now well recognized (1–5). This is especially relevant in populations where racial/ethnic disparities exist in the frequency of obesity, hypertension, and related cardiovascular treatment outcomes (6–10). Previous studies have suggested that race effects on BP in black and white youth are accounted for primarily by race disparities in adiposity (11, 12). Others have reported race differences in BP that are independent of body mass index (BMI) (13,14). Blood pressure data from Hispanic pediatric populations are more limited and are conflicting. Some studies have found BP to be higher in Hispanic children than white children, while others report no race differences (15–17).
The objective of this study was to examine the influence of race and ethnicity on age- and BMI-adjusted BP. White, black, and Hispanic children were studied by utilizing a novel semiparametric regression model analytic technique. There are race-related differences in insulin and lipid profiles in black and white youth and this may influence BP (18–21). Thus, we also comparatively evaluated fasting lipids and insulin sensitivity [homeostatic model assessment of insulin resistance (HOMA-IR)] by race/ethnicity while controlling for age, BMI, and BP. We hypothesized the adiposity effect on BP would be greater in black children and Hispanic children than in white children. Furthermore, we hypothesized that black children would have lower fasting insulin sensitivity and the relationship between fasting insulin and BP would vary by race.
Methods
This study utilized clinical data from patients who presented for evaluation of obesity at the Pediatric Overweight Education and Research (POWER) Program at Riley Hospital for Children at Indiana University Health between January 2009 and November 2011 (n=873). This referral clinic served patients from the entire state of Indiana and surrounding areas, treating obese (BMI >95% for age and sex) or overweight (BMI >85%) children aged 2–18 years. Race was self-reported on clinic forms as American Indian or Alaska Native, Asian, Black, Pacific Islander, or White. The clinic did not serve sufficient patients who reported American Indian or Alaska Native, Asian, or Pacific Islander race for inclusion in this retrospective study. Ethnicity was reported as Hispanic or not Hispanic. Clinic patients and their guardians self-selected the racial and ethnic categories that they identified with.
Routine assessment at the initial visit included measurement of weight on a calibrated scale, height by stadiometer, and BP. BP was measured with the patient resting and seated. BP was manually measured by trained medical assistants using a calibrated sphygmomanometer device and a cuff appropriate for arm size. When either systolic BP (SBP) or diastolic BP (DBP) was greater than the 90th percentile for age, height, and sex, a second blood pressure was obtained after at least 10 min of rest. The lower measurements were recorded. Routine laboratory evaluation included fasting lipids, liver transaminases, glucose, insulin, and hemoglobin Ale (HbA1c).
Laboratory measures were performed in the Indiana University Health clinical pathology lab as part of clinical care. Plasma glucose was measured by the Beckman Coulter DXC 800 (Beckman Coulter, Inc., Brea, CA, USA) using the glucose hexokinase method [coefficient of variation (CV) 2%]. Plasma insulin was measured directly (i.e., was not stored and measured later) by the Beckman Coulter DXI 800 using a chemiluminescent sandwich assay (CV 6%). Fasting lipid profile was measured using the Beckman Coulter DXC 800. Liver transaminases were assessed via spectrophotometry. HbA1c was quantified by the Tosoh G7 ion exchange column (Tosoh Corp., Tokyo, Japan) using the high-performance liquid chromatography method (CV 0.3%). The HOMA-IR was calculated to express fasting insulin resistance (22).
Age, gender, self-reported race/ethnicity, height, weight, BP, and laboratory data were obtained from the medical record for the initial clinic visit. Patients who reported current treatment with an antihypertensive medication (n=14) and/or had a diagnosis of diabetes (n=8) were excluded from the analysis (the total number excluded was 20). The study was approved by the Indiana University Institutional Review Board. A waiver of informed consent was obtained due to the retrospective nature of the study.
Data analysis
Measured SBP and DBP values (mm Hg) were converted to percentile values based on age, height, and sex using the criteria described by the Fourth Report on the Diagnosis, Evaluation, and Treatment of High Blood Pressure in Children and Adolescents by the National High Blood Pressure Education Program Working Group on High Blood Pressure in Children and Adolescents (23).
Patient characteristics were summarized using sample mean and standard deviation (SD) for continuous variables; sample proportions were used for discrete variables. Summary statistics were reported for samples stratified by race/ethnicity. Spearman correlation coefficients were calculated to explore associations between BP, HOMA-IR, BMI, and age. To explore the relationships between BMI and BP percentile values, we used a novel semiparametric regression model (24), which is able to capture potentially nonlinear relationships, as previous research has suggested the BP effect of BMI is intensified in a nonlinear fashion in overweight and obese children (25). Additionally, because BP increases with age in children, we examined the BMI effect on BP percentile values at different ages using a bivariate semiparametric regression model, where the mean BP percentiles at different age-BMI combinations were estimated and presented as a smooth functional surface. We depicted the estimated surface with a colored contour plot with warm colors indicating increased BP percentiles. Similar analyses were performed to examine the BMI and fasting insulin or HOMA-IR effects on BP percentile. The interaction effects between BMI and race were tested using linear regression models. R software was used to perform all statistical analyses; p-values <0.05 were considered statistically significant.
Results
Study subject characteristics are summarized in Table 1. The study included 873 overweight and obese children (38.6% male, 51.2% white, 40.5% black, and 8.2% Hispanic; age range 2.3–17.9 years). The mean age was 11.6±3.5 years, the mean BMI was 35.818.3 kg/m2, and the mean SBP and DBP were 110±15 and 70±10 mm Hg, respectively. Black children and white children were similar in age (11.9 vs. 11.5 years; p=0.197), while Hispanic children were a bit younger (10.3 years, p=0.0043). BMI Z-scores were similar among the groups, SBP was higher in black children and Hispanic children (white: 107 mm Hg; black: 112 mm Hg; Hispanic: 112 mm Hg; p=0.0001). The numbers and percent of youth with hypertensive and prehypertensive BP values are shown in Table 2. Age, sex, and height-adjusted SBP percentiles were also different among the three groups (white: 50; black: 59; Hispanic: 59; p=0.0006). DBP values were similarly higher in black children as compared with white children; however, DBP tended to be lower in Hispanic children (p=0.0229).
Table 1.
Patient characteristics (n=873).
| White (n=447) |
Black (n=354) |
Hispanic (n=72) |
p-Value | |
|---|---|---|---|---|
|
| ||||
| Gender, n (%) | 0.0015 | |||
| Female | 286 (64%) | 219 (62%) | 30 (42%) | |
| Male | 161 (36%) | 135 (38%) | 42 (58%) | |
| Age, years | 11.5 (3.6) | 11.9 (3.3) | 10.3 (3.8) | 0.0043 |
| Height, cm | 151.8 (18.4) | 154.8 (26.3) | 146.4 (18.0) | 0.0083 |
| BMI, kg/m2 | 35.1 (7.8) | 37.2 (8.8) | 33.3 (7.9) | 0.0001 |
| BMI Z-score | 2.59 (0.47) | 2.61 (0.34) | 2.61 (0.44) | 0.8492 |
| Blood pressure, mm Hg | ||||
| Systolic | 107 (14) | 112 (16) | 112 (15) | 0.0001 |
| Diastolic | 69 (9) | 71 (11) | 67 (11) | 0.0229 |
| Blood pressure, percentile | ||||
| Systolic | 50 (32) | 59 (30) | 59 (30) | 0.0006 |
| Diastolic | 67 (23) | 69 (23) | 64 (24) | 0.2785 |
| Cholesterol, mg/dL | 159 (31) | 155 (32) | 157 (32) | 0.2259 |
| HDL cholesterol, mg/dL | 38 (9) | 40 (10) | 38 (9) | 0.0019 |
| LDL cholesterol, mg/dL | 96 (26) | 99 (28) | 93 (24) | 0.1940 |
| Non-HDL cholesterol, mg/dL | 123 (31) | 115 (31) | 119 (32) | 0.0166 |
| Triglycerides, mg/dL | 132 (82) | 79 (43) | 131 (86) | <0.0001 |
| HbA1c,% | 5.48 (0.29) | 5.74 (0.48) | 5.57 (0.41) | <0.0001 |
| Fasting glucose, mg/dL | 94 (9) | 95 (13) | 95 (13) | 0.1231 |
| Fasting insulin, μU/mL | 25.4 (28.5) | 26.3 (23.1) | 30.1 (34.8) | 0.4256 |
| HOMA-IR | 6.02 (7.68) | 6.39 (7.14) | 7.36 (9.24) | 0.4067 |
| ALT, U/L | 29 (18) | 21 (9) | 39 (27) | <0.0001 |
| AST, U/L | 27 (10) | 25 (13) | 34 (18) | <0.0001 |
| GGT, U/L | 21 (12) | 21 (10) | 22 (11) | 0.5031 |
BMI, body mass index; HDL, high-density lipoprotein; LDL, low-density lipoprotein; HbA1c, hemoglobin A1c; HOMA-IR, homeostatic model assessment for insulin resistance; ALT, alanine aminotransferase; AST, aspartate transaminase; GGT, gamma-glutamyl transpeptidase. Data are means (standard deviation or %).
Table 2.
The numbers and percent of youth with hypertensive and prehypertensive blood pressure (BP) values.
| White | Black | Hispanic | |
|---|---|---|---|
|
| |||
| BP ≥90th percentile | 71 (18) | 73 (24) | 14 (24) |
| and <95th percentile | |||
| BP ≥95th percentile | 69 (17) | 62 (20) | 13 (22) |
Data are numbers (percent).
While the total cholesterol levels were similar among the three groups, high-density lipoprotein (HDL) and non-HDL cholesterol were significantly different among the groups, with black children having the highest HDL and lowest non-HDL cholesterol measures (p=0.0019 and p=0.0166, respectively). Black children also had significantly lower triglyceride levels (p<0.0001). Black children and Hispanic children had higher HbAlc levels than white children (p<0.0001), although fasting glucose, fasting insulin, and HOMA-IR values were not significantly different among the groups. Liver transaminase concentrations [alanine aminotransferase (ALT) and aspartate transaminase (AST)] were significantly greater among Hispanic children (p<0.0001 for ALT and AST values).
Spearman correlation coefficients between SBP, age, BMI, and HOMA-IR are shown in Table 3. SBP was significantly associated with age, BMI, and HOMA-IR values (p=0.001 for all correlations). Semiparametric analysis indicated that at any given age and BMI, black children and Hispanic children tended to have higher SBP percentile values (Figure 1). Linear regression analysis further confirmed that age and BMI were significantly associated with SBP percentile in all race groups (p=0.049 and p=0.001, respectively). Black children and Hispanic children had higher SBP percentiles as compared with white children of the same age and BMI (p=0.001 and p=0.037, respectively). Figure 1B shows that although BP percentiles have taken into account the effect of age, there continued to be an age-related change in BP percentile in black children. At any given age, the BMI effect on SBP percentile was stronger in black children compared to white children (i.e., there was greater increase in SBP percentile associated with the same amount of increase in BMI in black children). Figure 1C shows that SBP decreased as BMI increased; but the relationship was not significant (p=0.743). The uncertainty of the estimated relationship may be due to the relative small number of Hispanic youth in the study and perhaps referral bias favoring youth with higher blood pressures at lower BMIs.
Table 3.
Spearman correlation coefficients for associations between systolic blood pressure (SBP), age, body mass index (BMI), and homeostatic model assessment for insulin resistance (HOMA-IR).
| Age | BMI | HOMA-IR | |
|---|---|---|---|
|
| |||
| SBP | 0.381 | 0.358 | 0.219 |
| Age | 0.658 | 0.304 | |
| BMI | 0.441 | ||
All p-values are <0.0001.
Figure 1.
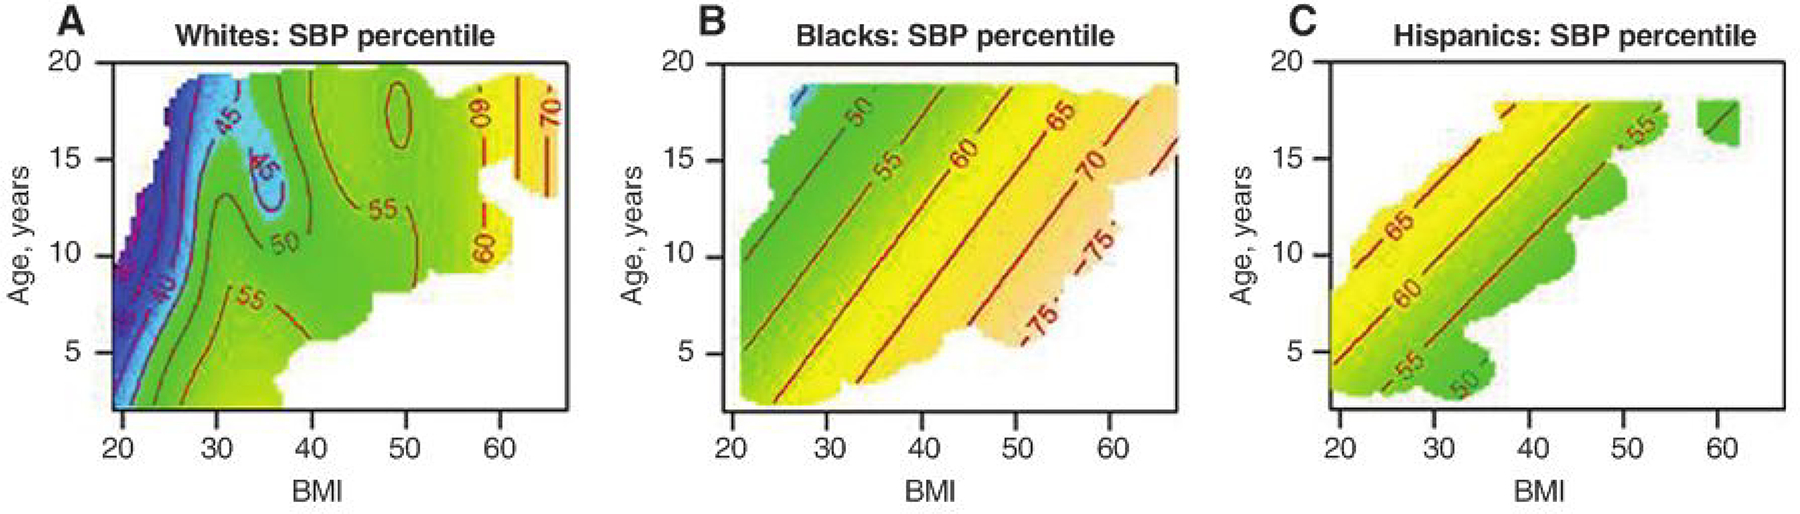
Blood pressure percentile variation according to age and body mass index among the study population groups.
We used a similar semiparametric analysis to examine the concurrent effects of BMI and HOMA-IR on SBP percentile in the three race/ethnicity groups (Figure 2). The contour plots show the joint effects of BMI and HOMA-IR on SBP percentile in the three race groups, with p-values=0.0649 in whites, 0.273 in blacks, and 0.877 in Hispanics. SBP was primarily driven by BMI, and HOMA-IR had no apparent additional effect on SBP.
Figure 2.
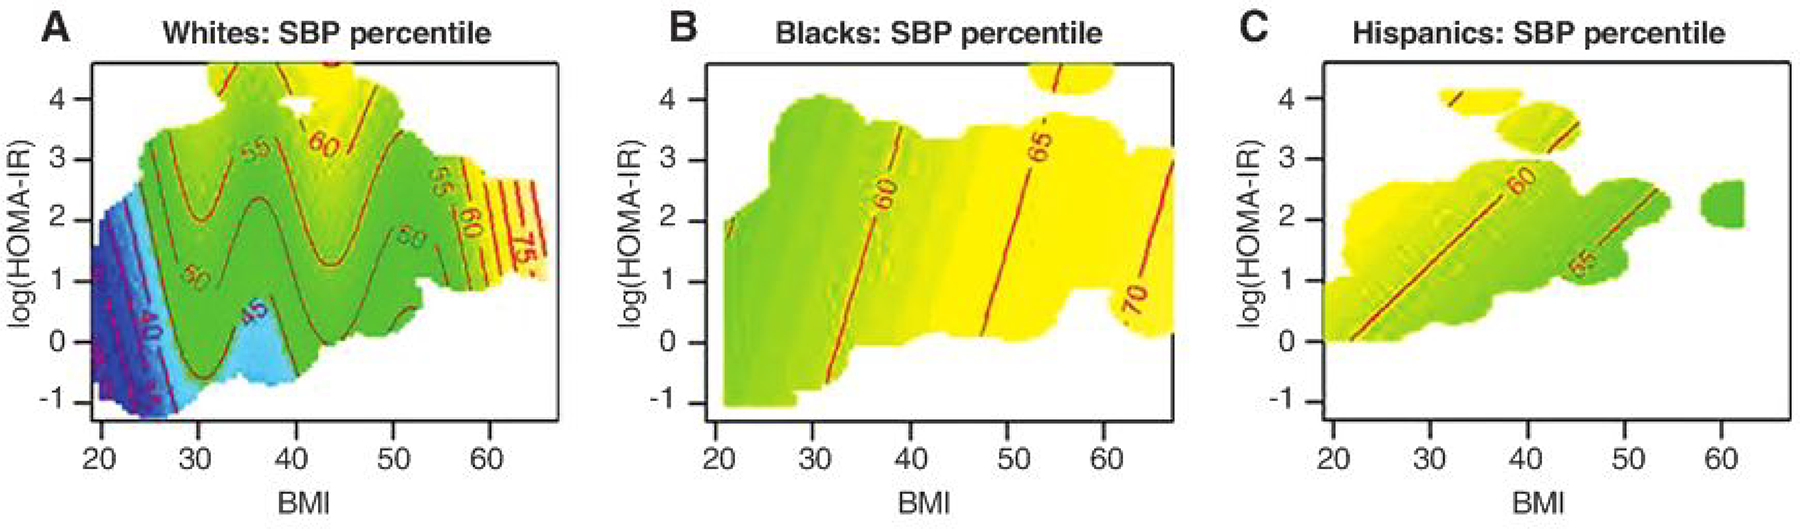
Blood pressure percentile variation according to homeostatic model assessment for insulin resistance and body mass index among the study population groups.
Discussion
In this study, we compared the BP effect of BMI in overweight black, white, and Hispanic youth seeking treatment for obesity. We hypothesized that, in children with equivalent BMIs, there were race-related differential effects of BMI on BP. Specifically, we found that (i) SBP was significantly higher in black children and Hispanic children; (ii) DBP was also higher in black children; and (iii) in children of the same age, BP was higher at any given BMI in black children and Hispanic children. This is the only study to utilize semiparametric analysis to examine the concurrent influences of age, BMI, and race/ethnicity on BP in a diverse pediatric population that included Hispanic children. Our results are consistent with studies showing that black children tend to have greater BMI and higher BP than age-matched white children, and that there is an independent race effect (13, 25–27). We found the influence of age and BMI on BP to be similar in Hispanic children and black children.
The majority of data comparing BP in different race/ ethnic populations comes from epidemiologic studies. A meta-analysis of eight studies in children published between 1978 and 1991 found the odds of elevated BP were greater with increasing BMI, and black children had higher BPs at lower BMIs than white children (28). The same study also found white children with the highest BMIs had more hypertension than black children with equivalent BMIs (28). The Pediatric Task Force shows black-white race differences in BMI-adjusted rates of BP elevation in normal weight populations only (15). This suggests that at some point, the obesity effect on BP may overshadow the race effect on BP. Consistent with our data, the Pediatric Task Force also shows BMI-adjusted differences in rates of BP elevation in Hispanic versus white boys (15).
We also examined BP variation according to fasting insulin, HOMA-IR, and BMI among the three groups because insulin resistance is often associated with hypertension (18, 20, 21, 29). Moreover, a study in Hispanic families indicated that genes determining fasting hyper-insulinemia and BP are linked to chromosome 7q (30). We found fasting insulin concentrations were positively associated with SBP, independent of BMI, in Hispanic children only. In black and white children, SBP was primarily driven by BMI and fasting insulin had no apparent additional effect on SBP. We speculate that the association between fasting insulin and SBP, independent of BMI, was only seen in Hispanic children because the prevalence of metabolic syndrome, or insulin resistance syndrome, is known to be highest among Hispanic adolescents and lowest among black adolescents (17). While fasting insulin or HOMA-IR were not related to BP in the study, black children had higher fasting insulin and HOMA-IR values at any given BMI. Relative hyperinsulinemia in black adolescents compared with white adolescents with comparable insulin sensitivity and body composition has been previously reported, but few studies included Hispanic children (31). Whether differences in insulin sensitivity and secretion are related to race/ethnicity-related differences in BMI-adjusted BP measures is not yet understood.
There were limitations associated with this study. First, it was a retrospective analysis of a clinic population referred for treatment of obesity. BP measurements were obtained at clinic visits and do not represent repeated ambulatory BPs. Given the low prevalence of hypertension overall, this was not likely to incorrectly bias the results. Second, this was a hospital-based referral clinic, most patients were insured, and results are not necessarily generalizable to a broader population. Finally, there is possibility of referral bias. Black children and Hispanic children are known to have higher rates of obesity-related comorbidities and Hispanic children are known to have higher rates of nonalcoholic fatty liver disease (32). This may explain why the Hispanic patients tended to be younger, as they may have been referred earlier upon finding elevated liver transaminases on routine evaluation prior to referral.
We conclude that there are race/ethnicity-dependent differences in the effect of BMI on blood pressure among children. Black children and Hispanic children presenting for evaluation of obesity may be at a significantly greater risk for having elevated BP as compared with their white peers of similar age and severity of obesity. This has significant implications for clinical care and treatment of hypertension in children. Further research is needed to better understand the mechanisms underlying this population-specific intensification of the adiposity effect on BP.
Acknowledgments:
The study was supported by Indiana University Purdue University Signature Center Grant Initiative funds (TH, WT, AC), the Riley Children’s Foundation (TH, AC), and IU Health (SG through the POWER Program). The funding agencies did not have a role in (i) study design; (ii) the collection, analysis, and interpretation of data; (iii) the writing of the report; or (iv) the decision to submit the paper for publication. The authors have no conflicts of interest to disclose. Tamara Hannon wrote the manuscript and no payment of any form was given to produce the manuscript.
Contributor Information
Tamara S. Hannon, Department of Pediatrics, Indiana University School of Medicine, Indianapolis, IN, USA.
Sandeep Gupta, Department of Pediatrics, Indiana University School of Medicine, Indianapolis, IN, USA.
Zhuokai Li, Department of Biostatistics, Indiana University School of Medicine, Indianapolis, IN, USA.
George Eckert, Department of Biostatistics, Indiana University School of Medicine, Indianapolis, IN, USA.
Aaron E. Carroll, Department of Pediatrics, Indiana University School of Medicine, Indianapolis, IN, USA
J. Howard Pratt, Department of Medicine, Indiana University School of Medicine, Indianapolis, IN, USA.
Wanzhu Tu, Department of Biostatistics, Indiana University School of Medicine, Indianapolis, IN, USA.
References
- 1.Freedman DS, Dietz WH, Srinivasan SR, Berenson GS. The relation of overweight to cardiovascular risk factors among children and adolescents: the Bogalusa Heart Study. Pediatrics 1999;103:1175–82. [DOI] [PubMed] [Google Scholar]
- 2.Voors AW, Webber LS, Frerichs RR, Berenson GS. Body height and body mass as determinants of basal blood pressure in children – The Bogalusa Heart Study. Am J Epidemiol 1977;106:101–8. [DOI] [PubMed] [Google Scholar]
- 3.Ogden CL, Carroll MD, Kit BK, Flegal KM. Prevalence of obesity and trends in body mass index among US children and adolescents, 1999–2010. J Am Med Assoc 2012;307:483–90. [DOI] [PMC free article] [PubMed] [Google Scholar]
- 4.Chen W, Srinivasan SR, Ruan L, Mei H, Berenson GS. Adult hypertension is associated with blood pressure variability in childhood in blacks and whites: the bogalusa heart study. Am J Hypertens 2011;24:77–82. [DOI] [PMC free article] [PubMed] [Google Scholar]
- 5.Toprak A, Wang H, Chen W, Paul T, Srinivasan S, et al. Relation of childhood risk factors to left ventricular hypertrophy (eccentric or concentric) in relatively young adulthood (from the Bogalusa Heart Study). Am J Cardiol 2008;101:1621–5. [DOI] [PubMed] [Google Scholar]
- 6.Zhang H, Rodriguez-Monguio R. Racial disparities in the risk of developing obesity-related diseases: a cross-sectional study. Ethn Dis 2012;22:308–16. [PubMed] [Google Scholar]
- 7.Kurian AK, Cardarelli KM. Racial and ethnic differences in cardiovascular disease risk factors: a systematic review. Ethn Dis 2007;17:143–52. [PubMed] [Google Scholar]
- 8.Smith SC jr, Clark LT, Cooper RS, Daniels SR, Kumanyika SK, et al. Discovering the full spectrum of cardiovascular disease: Minority Health Summit 2003: report of the Obesity, Metabolic Syndrome, and Hypertension Writing Group. Circulation 2005;lll:el34–9. [DOI] [PubMed] [Google Scholar]
- 9.Bibbins-Domingo K, Pletcher Mj, Lin F, Vittinghoff E, Gardin JM, et al. Racial differences in incident heart failure among young adults. N Engl j Med 2009;360:1179–90. [DOI] [PMC free article] [PubMed] [Google Scholar]
- 10.Muntner P, Arshad A, Morse SA, Patel DA, Manapatra PD, et al. End-stage renal disease in young black males in a black-white population: longitudinal analysis of the Bogalusa Heart Study. BMC Nephrol 2009;10:40. [DOI] [PMC free article] [PubMed] [Google Scholar]
- 11.Chen W, Bao W, Begum S, Elkasabany A, Srinivasan SR, et al. Age-related patterns of the clustering of cardiovascular risk variables of syndrome X from childhood to young adulthood in a population made up of black and white subjects: the Bogalusa Heart Study. Diabetes 2000;49:1042–8. [DOI] [PubMed] [Google Scholar]
- 12.Srinivasan SR, Myers L, Berenson GS. Rate of change in adiposity and its relationship to concomitant changes in cardiovascular risk variables among biracial (black-white) children and young adults: The Bogalusa Heart Study. Metabolism 2001;50:299–305. [DOI] [PubMed] [Google Scholar]
- 13.Harding S, Whitrow M, Lenguerrand E, Maynard M, Teyhan A, et al. Emergence of ethnic differences in blood pressure in adolescence: the determinants of adolescent social well-being and health study. Hypertension 2010;55:1063–9. [DOI] [PubMed] [Google Scholar]
- 14.Profant J, Dimsdale JE. Race and diurnal blood pressure patterns. A review and meta-analysis. Hypertension 1999;33: 1099–104. [DOI] [PubMed] [Google Scholar]
- 15.Rosner B, Cook N, Portman R, Daniels S, Falkner B. Blood pressure differences by ethnic group among United States children and adolescents. Hypertension 2009;54:502–8. [DOI] [PMC free article] [PubMed] [Google Scholar]
- 16.Webber LS, Harsha DW, Phillips GT, Srinivasan SR, Simpson JW, et al. Cardiovascular risk factors in Hispanic, white, and black children: the Brooks County and Bogalusa Heart studies. Am J Epidemiol 1991;133:704–14. [DOI] [PubMed] [Google Scholar]
- 17.Johnson WD, Kroon JJ, Greenway FL, Bouchard C, Ryan D, et al. Prevalence of risk factors for metabolic syndrome in adolescents: National Health and Nutrition Examination Survey (NHANES), 2001–2006. Arch Pediatr Adolesc Med 2009;163: 371–7. [DOI] [PubMed] [Google Scholar]
- 18.Williams DE, Cadwell BL, Cheng YJ, Cowie CC, Gregg EW, et al. Prevalence of impaired fasting glucose and its relationship with cardiovascular disease risk factors in US adolescents, 1999–2000. Pediatrics 2005;116:1122–6. [DOI] [PubMed] [Google Scholar]
- 19.Jiang X, Srinivasan SR, Urbina E, Berenson GS. Hyperdynamic circulation and cardiovascular risk in children and adolescents. The Bogalusa Heart Study. Circulation 1995;91:1101–6. [DOI] [PubMed] [Google Scholar]
- 20.Jiang X, Srinivasan SR, Bao W, Berenson GS. Association of fasting insulin with longitudinal changes in blood pressure in children and adolescents. The Bogalusa Heart Study. Am J Hypertens 1993;6:564–9. [DOI] [PubMed] [Google Scholar]
- 21.Burke GL, Webber LS, Srinivasan SR, Radhakrishnamurthy B, Freedman DS, et al. Fasting plasma glucose and insulin levels and their relationship to cardiovascular risk factors in children: Bogalusa Heart Study. Metabolism 1986;35:441–6. [DOI] [PubMed] [Google Scholar]
- 22.Yeckel CW, Weiss R, Dziura J, Taksali SE, Dufour S, et al. Validation of insulin sensitivity indices from oral glucose tolerance test parameters in obese children and adolescents. J Clin Endocrinol Metab 2004;89:1096–101. [DOI] [PubMed] [Google Scholar]
- 23.National High Blood Pressure Education Program Working Group on High Blood Pressure in Children and Adolescents. The fourth report on the diagnosis, evaluation, and treatment of high blood pressure in children and adolescents. Pediatrics 2004;114:555–76. [PubMed] [Google Scholar]
- 24.Lui H, Tu W. A semiparametric regression model for paired longitudinal outcomes with application in childhood blood pressure development. Ann Appl Stat 2012;6:1861–82. [Google Scholar]
- 25.Tu W, Eckert GJ, DiMeglio LA, Yu Z, Jung J, et al. Intensified effect of adiposity on blood pressure in overweight and obese children. Hypertension 2011;58:818–24. [DOI] [PMC free article] [PubMed] [Google Scholar]
- 26.Manatunga AK, Jones JJ, Pratt JH. Longitudinal assessment of blood pressures in black and white children. Hypertension 1993;22:84–9. [DOI] [PubMed] [Google Scholar]
- 27.Lo JC, Sinaiko A, Chandra M, Daley MF, Greenspan LC, et al. Prehypertension and hypertension in community-based pediatric practice. Pediatrics 2013;131:e415–24. [DOI] [PMC free article] [PubMed] [Google Scholar]
- 28.Rosner B, Prineas R, Daniels SR, Loggie J. Blood pressure differences between blacks and whites in relation to body size among US children and adolescents. Am J Epidemiol 2000;151:1007–19. [DOI] [PubMed] [Google Scholar]
- 29.Sinaiko AR, Steinberger J, Moran A, Hong CP, Prineas RJ, et al. Influence of insulin resistance and body mass index at age 13 on systolic blood pressure, triglycerides, and high-density lipoprotein cholesterol at age 19. Hypertension 2006;48:730–6. [DOI] [PubMed] [Google Scholar]
- 30.Cheng LS, Davis RC, Raffel LJ, Xiang AH, Wang N, et al. Coincident linkage of fasting plasma insulin and blood pressure to chromosome 7q in hypertensive hispanic families. Circulation 2001;104:1255–60. [DOI] [PubMed] [Google Scholar]
- 31.Hannon TS, Bacha F, Lin Y, Arslanian SA. Hyperinsulinemia in African-American adolescents compared with their American white peers despite similar insulin sensitivity: a reflection of upregulated beta-cell function? Diabetes Care 2008;31:1445–7. [DOI] [PMC free article] [PubMed] [Google Scholar]
- 32.Lavine JE, Schwimmer JB. Nonalcoholic fatty liver disease in the pediatric population. Clin Liver Dis 2004;8:549–58, viii-ix. [DOI] [PubMed] [Google Scholar]