

Abstract
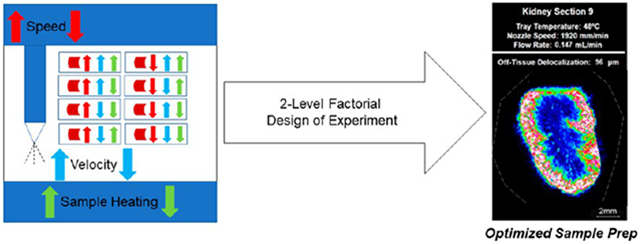
Matrix deposition is a critical step in obtaining reproducible and spatially representative matrix-assisted laser desorption/ionization (MALDI) mass spectrometry imaging data. To date, few limited studies have examined the optimization of matrix spraying parameters for maximizing analyte extraction while minimizing analyte delocalization. Herein, we present a study using automated pneumatic spraying with a heated sample-holder tray to determine an optimized model for mouse whole kidney lipid imaging using a 2,5-dihydroxybenzoic acid matrix in which the solvent flow rate, nozzle velocity, and sample heating were optimized using a two-level factorial experimental design. Parameters examined to determine the optimum model include the number of analytes, the matrix crystal size, off tissue delocalization, the signal intensity, and spray time. Our results show that sample heating using a heated tray while spraying improves the MALDI imaging performance. This improvement is possible because higher solvent flow rates can be used in the pneumatic sprayer, allowing for better sample extraction, while sample delocalization is minimized due to sample heating.
Keywords: MALDI imaging, sample preparation, mass spectrometry, design of experiment, lipid, kidney
Graphical Abstract
INTRODUCTION
Matrix-assisted laser desorption/ionization (MALDI) mass spectrometry imaging (MSI) is the predominant method of MSI currently in use. MALDI is particularly well suited for imaging biological samples due to its soft ionization approach, which allows for the analysis of large biomolecules with minimal fragmentation.1 While many factors influence MALDI imaging results, matrix deposition is a key to obtaining reproducible and spatially representative results.2 The introduction of automated pneumatic sprayers has positively impacted the reproducibility of MALDI imaging results as the automation of matrix deposition leads to the uniform coverage of the sample.3,4 In recent years, significant progress has been made toward cellular and subcellular spatial resolution in MALDI imaging, which has been achieved by improvements in instrumentation.5 However, sample preparation is also critical for achieving a high spatial resolution by minimizing analyte delocalization while maintaining sufficient analyte extraction.2,4,6,7
Multiple state-of-the-art approaches are currently used for applying the MALDI matrix, including spraying with a robotic sprayer and sublimation.8-10 While sublimation offers a smaller crystal size and prevents delocalization as no solvent interacts with the tissue sample, analyte extraction is frequently compromised.4,8 Post-sublimation hydration or recrystallization has been shown to increase extraction, particularly for protein and peptide signals; however, it increases the time and steps required for sample preparation.11 Even so, fewer analytes may be observed overall with matrix sublimation, which is problematic for untargeted discovery imaging and “-omics” type approaches. In some cases, analytes may be observed with significantly diminished intensity.4,8 Pneumatic spraying, which was initially performed with airbrushes, has been used successfully for MALDI imaging matrix applications since its inception.12 The flow rate and speed of the airbrushes are controlled manually, frequently leading to inconsistent and uneven matrix coating. The introduction of robotic sprayers has vastly improved the reproducibility of spraying and provides independent control of various different experimental factors of the spraying protocol, including nozzle speed, nozzle temperature, solvent flow rate, and more recently sample temperature.9,10 All these factors would ideally be optimized for each experiment to maximize the number of detected analytes and the signal intensity as well as minimize analyte delocalization.
Analyte delocalization has been observed in all classes of biomolecules; however, it is most commonly observed in metabolites and lipids.4,13-15 Maintaining the localization of molecules in imaging workflows is an ongoing challenge, particularly as routine MALDI MSI is approaching cellular to subcellular spatial resolutions.5 Optimized MALDI matrix spraying protocols are typically developed on a project-specific basis through a lengthy iterative process, creating inefficiencies in the MALDI imaging workflow. Recently, Veličković et al. introduced a response-surface methodology to optimize spraying parameters to limit analyte delocalization and maximize the number of detected analytes in human kidney biopsy samples.10 Using this approach, they optimized a series of spraying parameters, including nozzle temperature, solvent flow rate, nozzle speed, number of passes, and solvent composition. While this study demonstrated an optimized protocol for fresh-frozen human kidney biopsy samples, MALDI MSI is also commonplace in the preclinical space, where fresh-frozen whole mouse organs are frequently utilized. Herein, we have selected mouse kidney, which has been well studied by MALDI MSI, as a representative tissue for our study to allow for the evaluation of the entire organ.
While analyte delocalization is one metric by which we can evaluate sample preparation, there are many other important metrics to be assessed. Commonly, the signal intensity and the number of analytes are also evaluated.9,10 Additionally, we have examined crystal size both on- and off-tissue. For high-resolution MALDI imaging, the matrix crystal size limits the spatial resolution at which analysis can be performed.5-7 2,5-Dihydroxybenzoic acid (DHB) is a commonly used, well-established, and water-soluble MALDI matrix for the detection of lipids and small molecules, which is also known to form large crystals.16 We have selected this matrix for our study as crystal size is often larger with DHB than other organic matrices, which can limit the spatial resolution as previously demonstrated.9,10 While high-resolution imaging is possible with DHB, an optimized application is required to minimize the crystal size. To simultaneously evaluate the effects of our three chosen spraying parameters of solvent flow rate, nozzle speed, and tray temperature, we used a two-level factorial design of experiment (DOE). DOE is a powerful statistical tool that can be used when more than one experimental factor likely contributes to the experimental outcome.17 In addition, DOE allows for the investigation of potential interactions between experimental factors, which cannot be detected in a standard experimental approach when each experimental factor is tested one at a time.17 In this study, we have evaluated the effects of nozzle speed, solvent flow rate, and tray temperature on six response variables, i.e., on-tissue crystal size, off-tissue crystal size, analyte delocalization, signal intensity, number of analytes detected, and spraying time.
MATERIALS AND METHODS
Experimental Design.
DOE approaches were previously demonstrated to significantly improve laboratory efficiency and data quality in analytical chemistry process optimization as they allow for several experimental factors to be optimized in parallel, in contrast to the standard “one at a time” approach.18 In this study, we have applied a two-level factorial DOE to MALDI MSI sample preparation using an automated robotic sprayer. In Design-Expert Stat-Ease software (ver. 13.0),19,20 we assigned low and high levels to three primary factors: nozzle speed, solvent flow rate, and tray temperature. This DOE generated eight combinations of spraying parameters that exhaustively evaluated the effects of each experimental factor individually and in combination with the other two factors on outcome variables in only eight experiments. We investigated the effects of solvent flow rate, nozzle speed, and tray temperature on six outcome variables: on-tissue crystal size, off-tissue crystal size, analyte delocalization, signal intensity, number of analytes, and spraying time. To isolate the effects of the experimental factors of interest, the same amount of matrix was deposited on each kidney section by varying the number of passes for each experiment.
Materials.
Solvents and the matrix were purchased from Sigma-Aldrich (St. Louis, MO) and used without further purification. All solvents were HPLC-grade unless otherwise noted. Indium tin oxide (ITO)-coated slides were obtained from Delta Technologies (Loveland, CO) and washed prior to use. Conductivity was verified prior to sectioning.
Sample Preparation.
ITO slides (Delta Technologies) were washed with hexanes for 10 min and then ethanol for 10 min, both in a sonication bath. Slides were left to dry overnight in a desiccator prior to sectioning. Adult athymic nu/nu nude mice (Taconic Biosciences, Rensselaer, NY) were sacrificed by CO2 asphyxia according to Johns Hopkins University Institutional Animal Care and Use Committee (IACUC) protocols. Animals were necropsied immediately, and all organs were frozen in liquid nitrogen. Organs were maintained at −80 °C for long-term storage. The kidney was equilibrated to −20 °C prior to sectioning, while ITO slides were cooled to −20 °C. All sectioning was done on a Leica 1860 UV cryostat (Wetzlar, Germany), and the tissue was mounted with Shandon M-1 embedding media (Fisher Scientific, Waltham, MA). Kidney sections (10 μm thickness) were cut and thaw-mounted onto washed and dried ITO slides using localized heating for each section. Prior to spraying, kidney sections were warmed to room temperature in a vacuum desiccator for approximately 10 min.
All nine kidney sections were sprayed, in triplicate, using the HTX M5 Sprayer with a 30 W powered heated tray (HTX Technologies, LLC, Chapel Hill, NC) with DHB (40 mg/mL in 70:30 v:v MeOH/H2O) in a criss-cross spraying pattern with a nozzle temperature of 75 °C, a track spacing of 2 mm, and a nitrogen pressure of 10 psi. Each section was sprayed with a different combination of the three spraying parameters tested. The other spray conditions were varied according to experimental conditions outlined in Table 1. For the purpose of this manuscript, the tray temperature is equivalent to the sample temperature because the heated tray on the HTX M5 sprayer holds the sample at the set temperature for the duration of the spraying method.
Table 1.
Spraying Parameters for All Eight Spraying Conditions Evaluated
| kidney section |
matrix | solvent | matrix concentration (mg/mL) |
solvent flow rate (mL/min) |
number of passes |
nozzle speed (mm/min) |
nozzle temperature (°C) |
spraying pattern |
nitrogen pressure (PSI) |
tray temperature (°C) |
density of matrix deposited (mg/mm2) |
linear flow rate (mL/mm) |
|---|---|---|---|---|---|---|---|---|---|---|---|---|
| 1 | DHB | 70% MeOH/30% H2O | 40 | 0.100 | 13 | 1920 | 75 | CC | 10 | 48 | 0.0135 | 5.21 × 10⁻⁵ |
| 2 | DHB | 70% MeOH/30% H2O | 40 | 0.100 | 13 | 1920 | 75 | CC | 10 | ambient | 0.0135 | 5.21 × 10⁻⁵ |
| 3 | DHB | 70% MeOH/30% H2O | 40 | 0.100 | 8 | 1200 | 75 | CC | 10 | ambient | 0.0133 | 8.33 × 10⁻⁵ |
| 4 | DHB | 70% MeOH/30% H2O | 40 | 0.160 | 8 | 1920 | 75 | CC | 10 | 48 | 0.0133 | 8.33 × 10⁻⁵ |
| 5 | DHB | 70% MeOH/30% H2O | 40 | 0.160 | 5 | 1200 | 75 | CC | 10 | ambient | 0.0133 | 1.33 × 10⁻⁵ |
| 6 | DHB | 70% MeOH/30% H2O | 40 | 0.160 | 5 | 1200 | 75 | CC | 10 | 48 | 0.0133 | 1.33 × 10⁻⁵ |
| 7 | DHB | 70% MeOH/30% H2O | 40 | 0.160 | 8 | 1920 | 75 | CC | 10 | ambient | 0.0133 | 8.33 × 10⁻⁵ |
| 8 | DHB | 70% MeOH/30% H2O | 40 | 0.100 | 8 | 1200 | 75 | CC | 10 | 48 | 0.0133 | 8.33 × 10⁻⁵ |
Matrix Crystal Size Measurements.
The matrix crystal size was measured prior to MALDI imaging using a Nikon Eclipse TS100 microscope with a Nikon DS-Fi3 digital camera. NIS-Elements software (Nikon Instruments, Inc., Melville, NY) was used to measure five individual crystals on-tissue and five individual crystals off-tissue. These individual crystal size measurements were averaged so that one value each for the on- and off-tissue crystal size was included in the DOE.
MALDI Imaging and Data Processing.
MALDI lipid imaging was performed on a Bruker MALDI TOF/TOF rapifleX instrument (Bruker Daltonik, Bremen, Germany) in the Johns Hopkins Applied Imaging Mass Spectrometry (AIMS) Core. Images were acquired in the reflectron positive ion mode with a 50 μm raster size, a 50 μm imaging laser, and 100 laser shots per pixel in the mass range of m/z 400–1200. All images were generated using flexImaging (ver. 5.0). Data were normalized using the total ion current (TIC). Skyline spectra for each experiment are shown in the Supporting Information (Figures S1-S9).
Peak Identification.
Four peaks in the lipid range that were detected in all experiments, i.e., m/z 725.7, 741.6, 758.8, and 772.6, were used for evaluation. These peaks were identified by on-tissue MS/MS analysis. Briefly, precursor ions were isolated with a ±2 Da isolation window with 2000 laser shots. Argon was used as a collision gas for collision-induced dissociation (CID). Fragmentation was done using CID and 4000 laser shots. Peak lists with intensities from fragmentation spectra were imported into the METLIN database to determine their identity. The on-tissue MS/MS acquisition of m/z 725.7, 741.6, 758.8, and 772.6, followed by a METLIN database search, identified them as N-palmitoyl-d-erythro-sphingosylphosphorylcholine and palmitoyl thio-phosphatidylcholine, both of which were detected as sodiated and potassiated ions (Figures S23-S24). These peaks were previously identified in mouse tissues, including mouse kidney.21,22
Delocalization Measurements.
A lipid ion at m/z 772.6, which was identified as the potassium adduct of palmitoyl thio-phosphatidylcholine (PC) (Figure S24), was selected for delocalization analysis as it showed a spatial specificity to the renal cortex, thus allowing its delocalization off-tissue to be evaluated. Laser spots were displayed on the image using the “Display Laser Spot Diameter” setting in flexImaging (ver. 5.0). Since imaging was performed at a 50 μm step size, the center-to-center distance to each nearest pixel in a straight line was used to evaluate the delocalization distance for m/z 772.6. The mass filter was set to m/z 772.6 ± 0.5 Da and adjusted from 0% to 40% intensity. Four points were identified on the tissue edge (scanned image) at the cardinal points (north, east, south, and west). Measurements were taken from the tissue edge in a straight line perpendicular to the tissue into the space surrounding the tissue for all pixels with a signal (Figure S11). This analysis led to a total of four delocalization measurements per kidney section, one for each direction. These measurements were averaged to obtain a single delocalization measurement representative of the entire kidney section.
Signal Intensity Measurements.
One region of interest (ROI) was defined for each kidney section to encompass the entirety of the renal cortex and renal pyramids but to exclude the renal vein and artery and areas off-tissue. Peak picking was then performed on these ROIs using mMass with a signal-to-noise threshold of 3.23,24 The four lipid peaks in our analysis were selected by the mMass PeakPicker within a tolerance of 0.5 Da in at least seven out of the eight kidney sections. These four lipid peaks were used in our analysis as markers to compare the relative intensity across the eight spraying conditions. Specifically, these were m/z 725.7, 741.6, 758.8, and 772.6, which were identified as sodiated and potassiated forms of N-palmitoyl-d-erythro-sphingosylphosphorylcholine and palmitoyl thio-phosphatidylcholine (Figures S23 and S24). The relative intensities across the eight spraying conditions were ranked from one to eight for each lipid peak separately and then the ranks from the four lipid peaks were averaged for each slide to provide one final quantitative parameter of the signal intensity for each condition. This approach is exemplified in Figure S12.
Optimized Model Design.
An independent model was built for each outcome variable (i.e., on-tissue crystal size (Figure S25), off-tissue crystal size (Figure S26), analyte delocalization (Figure S27), signal intensity (Figure S28), number of analytes (Figure S29), and spraying time (Figure S30)). A square-root transformation was applied to the delocalization, ranked relative signal intensity, number of analytes, and spraying time outcome measurements prior to analysis to approximate the count-based values to a normal distribution. For each outcome variable, the model was built using all three primary input factors (i.e., solvent flow rate, nozzle speed, and tray temperature), all three two-factor interactions (i.e., solvent flow rate*nozzle speed, solvent flow rate*tray temperature, and nozzle speed*tray temperature), and the single three-factor interaction (solvent flow rate*nozzle speed*tray temperature). A sum-of-squares forward regression analysis was then performed to find input factors that were significant for each outcome variable at an α-level of 0.1. If the interaction terms were significant, the individual primary terms were also included. Then, an analysis of variance (ANOVA) was performed for the selected factorial model for each response outcome. The p-values reported in the manuscript are the ANOVA p-values. For each of the primary factors (i.e., tray temperature, solvent flow rate, and nozzle speed), the model criteria were set to be within the range of the tested parameter values. For tray temperature, this was defined as 22–48 °C; for solvent flow rate, this was defined as 0.100–0.160 mL/min; and for nozzle speed, this was defined as 1200–1920 mm/min. For the outcome variables, the model was designed to minimize the crystal size on- and off-tissue, the delocalization measurement, and the spraying time and to maximize the signal intensity and the number of analytes detected with the limits set at the measured values so as to not overextend the model (Figure S31). The crystal size on-tissue, the delocalization measurement, the signal intensity, and the number of analytes were weighted equally at the highest importance, followed by the spraying time and the average crystal size off-tissue, respectively. Default solution search parameters of one hundred solutions with 50 design starting points, a duplicate solution filter of 0.5, and a simplex fraction of 0.1 were used. Inputs and outputs from Stat-Ease software used to generate the optimized model are shown in Figure S32.
Optimized Model Design Validation.
To assess the predicted optimized model, a ninth kidney section was sprayed according to the predicted optimized parameters using the HTX M5 Sprayer. The number of passes was adjusted to yield a matrix density for kidney section 9 most similar to the weighted average of the matrix density of the eight kidney sections used in the DOE. Kidney section 9 was imaged using the same parameters as the previous eight kidney sections. All outcome variables (i.e., on-tissue crystal size, off-tissue crystal size, analyte delocalization, signal intensity, number of analytes, and spraying time) used to build the model were measured for this kidney section.
RESULTS
Average Crystal Size On-Tissue.
All six response outcomes for each of the eight test kidney sections are displayed in Table 2. Solvent flow rate was the only significant term that affected the average crystal size on-tissue (Figure S25). A lower flow rate value of 0.100 mL/min resulted in a smaller crystal size on-tissue as compared to a higher solvent flow rate value of 0.160 mL/min (p-value = 0.013) (Figure S13).
Table 2.
Three Experimental Factors Varied Across Eight Spraying Conditions and Six Measured Outcome Variables Were Used to Build the Modela
| kidney section |
solvent flow rate (mL/min) |
nozzle speed (mm/min) |
sample temperature (°C) |
average crystal size on-tissue (μm) |
average crystal size off-tissue (μm) |
off-tissue delocalization (μm) |
relative signal intensity ranked response |
number of analytes |
spraying time (min) |
|---|---|---|---|---|---|---|---|---|---|
| 1 | 0.100 | 1920 | 48 | 6.51 ± 1/47 | 15.64 ± 3.05 | 0 ± 0 | 1.92 ± 0.68 | 59 ± 23 | 14 |
| 2 | 0.100 | 1920 | ambient | 5.52 ± 1.03 | 7.69 ± 0.87 | 254 ± 67 | 7.00 ± 0.63 | 84 ± 2 | 14 |
| 3 | 0.100 | 1200 | ambient | 6.97 ± 0.76 | 11.67 ± 2.93 | 500 ± 90 | 6.08 ± 0.51 | 88 ± 7 | 13 |
| 4 | 0.160 | 1920 | 48 | 13.35 ± 3.96 | 19.45 ± 3.56 | 175 ± 50 | 4.83 ± 1.10 | 88 ± 8 | 8 |
| 5 | 0.160 | 1200 | ambient | 24.75 ± 3.99 | 21.21 ± 2.82 | 617 ± 62 | 4.25 ± 0.66 | 81 ± 11 | 7 |
| 6 | 0.160 | 1200 | 48 | 16.18 ± 4.43 | 16.00 ± 2.57 | 408 ± 70 | 4.25 ± 1.38 | 87 ± 6 | 7 |
| 7 | 0.160 | 1920 | ambient | 13.64 ± 3.70 | 23.02 ± 3.82 | 554 ± 73 | 4.33 ± 1.36 | 76 ± 8 | 8 |
| 8 | 0.100 | 1200 | 48 | 9.03 ± 0.42 | 16.89 ± 4.01 | 123 ± 40 | 3.41 ± 0.22 | 85 ± 2 | 13 |
The three experimental factors that were varied were the flow rate, the nozzle velocity, and the tray temperature. The resulting six outcome variables were the average crystal size on- and off-tissue, the delocalization, the relative signal intensity, the number of analytes, and the spraying time, which were measured to build the model.
Average Crystal Size Off-Tissue.
The average crystal size off-tissue was larger than that observed on-tissue for most spraying conditions (Figures 1, S10, and S14). The crystal size observed off-tissue also varied less, in terms of both the absolute range of the crystal size and the standard deviation, than that observed on-tissue. Similar to the on-tissue results, the solvent flow rate had the largest percent effect on the off-tissue crystal size. The lower solvent flow rate of 0.100 mL/min resulted in a reduction in the off-tissue crystal size when compared with a higher solvent flow rate of 0.160 mL/min (p-value = 0.017). The interaction of the tray temperature and the solvent flow rate was also a significant contributing term for the off-tissue average crystal size (p-value = 0.023), as was the interaction term of the solvent flow rate and the nozzle speed (p-value = 0.037).
Figure 1.

Microscopy images of matrix crystals on-tissue. Images are organized by the nozzle velocity and the flow rate, the two parameters that were identified to have significant effects on the average matrix crystal size. The applied tray temperature is given for each kidney section.
Off-Tissue Delocalization.
For off-tissue delocalization of the potassium adduct of palmitoyl thio-phosphatidylcholine at m/z 772.6, tray temperature was the most significant term (p-value = 0.010) (Figure S27). The higher tray temperature of 48 °C resulted in less off-tissue delocalization than the lower tray temperature of 22 °C (Figure S15). This finding suggests that a higher tray temperature accelerates solvent evaporation, giving analytes less time to diffuse across- and off-tissue. Similarly, an increased solvent flow rate was associated with an increase in analyte delocalization (p-value = 0.024) (Figure S15) as a greater amount of the solvent deposited on-tissue could create a greater liquid reservoir where analytes could diffuse (Figures 2 and S14).
Figure 2.

Ion images of m/z 772.6 Da ± 0.05% for all eight kidney sections. Images are organized by the tray temperature and the flow rate, the two parameters that had significant effects on the delocalization of m/z 772.6, which was identified as potassiated palmitoyl thio-phosphatidylcholine (PC) from the tissue margin. The applied nozzle speed is given for each kidney section.
Number of Peaks.
The number of peaks was determined by exporting the average skyline spectra (Figures S1-S9) into mMass as described above.23,24 All peaks automatically selected by the mMass PeakPicker with a signal-to-noise ratio of three or greater were summed to determine the total number of peaks. Peak lists can be found in the Supporting Information. Kidney sections 4 and 5 had the most detected peaks with an average of 87 peaks, while kidney section 1 had the lowest number of detected peaks with only 59 peaks (Figure S17). No experimental factors were found to be statistically significant in affecting the number of peaks detected (Figure S29).
Signal Intensity.
The interaction term of the solvent flow rate and the tray temperature was the only factor that had a significant effect on the signal intensity (p-value = 0.031). There were no significant differences in the relative signal intensity of the four measured lipids at m/z 725.7, 741.6, 758.8, and 772.6 in kidney sections sprayed with the lower solvent flow rate value of 0.100 mL/min versus the higher solvent flow rate value of 0.160 mL/min or between the kidney sections sprayed with an ambient tray temperature (25 °C) versus a heated tray (48 °C) (Figures S15 and S16). However, the interacting conditions of a lower solvent flow rate of 0.100 mL/min and an ambient tray temperature versus a higher solvent flow rate of 0.160 mL/min and a 48 °C tray temperature were associated with a higher average signal intensity for the four lipid peaks evaluated (Figures 3, 4, and S17). For these four lipid peaks, kidney section 1 had the lowest rank among the eight conditions, with m/z 741.6, 758.8, and 772.6 not selected by mMass PeakPicker, and kidney section 2 had the highest average rank among the eight conditions.
Figure 3.

Ion images of m/z 725.7 Da ± 0.05% for all eight kidney sections. Images are organized by the tray temperature and the flow rate. The interaction of these two parameters was found to have the most significant effect on the ranked relative signal intensity of four lipid peaks, i.e., sodiated N-palmitoyl-d-erythro-sphingosylphosphorylcholine at m/z 725.7, potassiated N-palmitoyl-d-erythro-sphingosylphosphorylcholine at 741.6, sodiated palmitoyl thio-phosphatidylcholine at 758.8, and potassiated palmitoyl thio-phosphatidylcholine at 772.6. The applied nozzle speed is given for each kidney section.
Figure 4.

Ion images of m/z 741.6 Da ± 0.05% for all eight kidney sections. Images are organized by the tray temperature and the flow rate. The interaction of these two parameters was found to have the most significant effect on the ranked relative signal intensity of four lipid peaks, i.e., sodiated N-palmitoyl-d-erythro-sphingosylphosphorylcholine at m/z 725.7, potassiated N-palmitoyl-d-erythro-sphingosylphosphorylcholine at 741.6, sodiated palmitoyl thio-phosphatidylcholine at 758.8, and potassiated palmitoyl thio-phosphatidylcholine at 772.6. The applied nozzle speed is given for each kidney section.
Spraying Time.
The response variable of spraying time was dependent on the solvent flow rate and the nozzle speed (p-values = 7.50 × 10⁻⁶ and 2.2 × 10⁻⁵, respectively) (Figure S30). It was expected that the kidney sections sprayed with a higher solvent flow rate would have shorter spraying times than kidney sections sprayed with a lower solvent flow rate, since the number of passes was adjusted to ensure that the same amount of matrix was deposited on each kidney section. Thus, conditions with the higher solvent flow rate of 0.160 mL/min had fewer passes than conditions with the lower solvent flow rate of 0.100 mL/min. However, we also found that a higher nozzle speed was associated with an increase in the spraying time. This suggests that if the amount of matrix sprayed on each sample is kept constant, the additional passes necessary to deposit the same amount of matrix at a higher nozzle speed cause an increase in the spraying time greater than the time saved by the faster nozzle speed.
Optimized Model.
Using a two-level factorial design of experiment, the optimized modeled solution was predicted to have the following parameters: a tray temperature of 48 °C, a flow rate of 0.147 mL/min, and a nozzle speed of 1920 mm/min. Kidney section 9 was sprayed using the predicted optimized experimental parameters, and the six response variables of on-tissue crystal size, off-tissue crystal size, analyte delocalization, signal intensity, number of analytes, and spraying time were measured and compared to their predicted values. Specifically, the predicted response values for crystal size on-tissue and off-tissue were 14.8 and 17.4 μm, respectively. The measured values for crystal size on-tissue and off-tissue were 13.6 and 15.4 μm, respectively (Figure 5). Off-tissue delocalization was predicted to be 114 μm (2 to 3 pixels), while measured the off-tissue delocalization was 96 μm ± 4 μm (2 pixels). Since the spatial resolution for imaging was 50 μm, our measurement of 96 μm compared to the 114 μm predicted value is within the error of the spatial resolution. As displayed in Figure 6, compared with the four tissue sections from the DOE that displayed the lowest levels of delocalization of m/z 772.6, kidney section 9 displayed slightly more delocalization but approximately twice the signal intensity of kidney sections 2, 4, and 8. The predicted relative signal intensity rank for the optimized model was 4.4, and the detection of 79 analytes was predicted. In kidney section 9 that was sprayed using the predicted optimized parameters, the measured relative signal rank was 6.6, and 81 ± 1 analytes were detected. These parameters required nine passes to achieve the approximately same matrix density as that tested in the other conditions for an estimated spraying time of 9 min. The spraying time in the run of the optimized model was consistent with the predicted 9 min.
Figure 5.
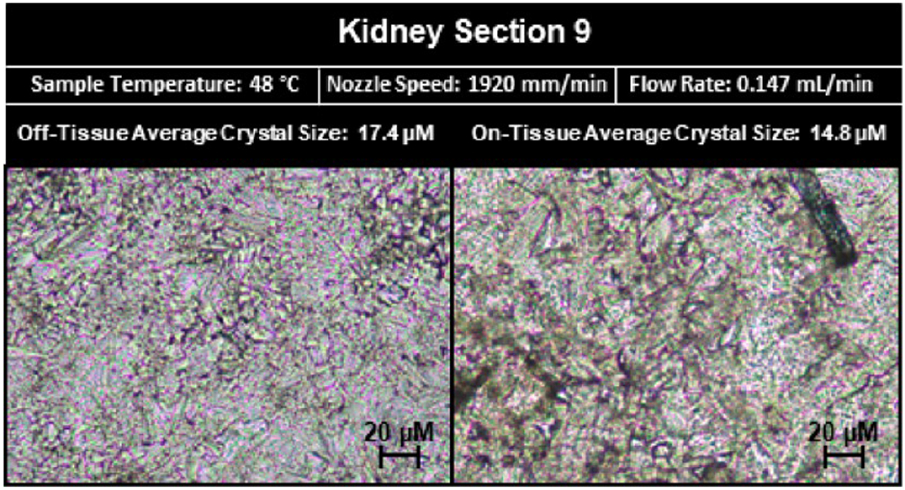
Microscopy images of matrix crystals on- and off-tissue from kidney section 9. The measured crystal sizes on- and off-tissue were smaller than the predicted values. The on-tissue predicted crystal size value was 12.0 μm while the measured value was 14.8 μm, and the off-tissue predicted crystal size value was 22.8 μm while the measured value was 17.4 μm.
Figure 6.

Ion images of m/z 772.6 Da ± 0.05% for five of the nine kidney sections. Kidney sections 1, 2, 4, and 8 were the sections in the original DOE that displayed the least delocalization of potassiated palmitoyl thio-phosphatidylcholine (PC) at m/z 772.6. Kidney section 9 was sprayed with the optimized parameters determined by the DOE. The measured delocalization value was 96 μm on kidney section 9, and the signal intensity of m/z 772.6 was greater in kidney section 9 than the average signal intensity in kidney sections 1, 2, 4 and 8.
DISCUSSION
We were able to optimize and validate a model for matrix spraying for MALDI MSI of lipids in the mouse kidney using a robotic sprayer with a heated sample tray using only 27 kidney sections. We found that solvent flow rate and sample temperature significantly affected the average crystal size, both on- and off-tissue, and the analyte delocalization, and the interaction of the two terms significantly affected the ranked signal intensity. Nozzle speed was only found to significantly affect the average crystal size, both on- and off-tissue, and the spraying time. These results suggest that when optimizing a model for MALDI MSI spraying protocols, the solvent flow rate and the sample temperature play a more important role than the nozzle speed in minimizing analyte delocalization. It is known that a lower solvent rate leads to a “drier” matrix deposition that prevents analyte delocalization due to the decreased amount of time that is needed to have the solvent evaporate from the tissue. We hypothesized that an increased sample temperature, which is achieved using a heated sample tray, would also minimize analyte delocalization through the same process of accelerating solvent evaporation. However, an increased nozzle speed should also lead to a “drier” spray as less solvent is applied over each square millimeter of tissue per second, although our results indicate that this way of drying the spray was less effective than decreasing the solvent flow rate or increasing the sample temperature. A potential explanation for this observation is that the experiment was designed to deposit the same total amount of matrix on each kidney section by varying the number of passes for each spraying condition, but we did not assign a drying time between passes for protocols with higher nozzle speeds. As each kidney section was mounted on a standard-sized glass slide and thus the nozzle was covering the same area for each condition, conditions with a higher nozzle velocity had less time between when the nozzle passed over the same point on the tissue on subsequent passes. This decreased drying time between passes could have offset the fact that less solvent was deposited per square millimeter of tissue and led to the nozzle speed not significantly affecting analyte delocalization. In future experiments, it would be interesting to introduce a variable of drying time to conditions with higher nozzle speeds to account for the decreased time between passes.
We also found that the only significant factor that affected the ranked signal intensity measurement was the interaction term of the solvent flow rate and the sample temperature. Interestingly, the kidney sections with the four highest measurements were kidney sections 2 and 3, which were sprayed with the lower flow rate of 0.100 mL/min at a tray temperature of 22 °C, and kidney sections 4 and 6, which were sprayed with the higher flow rate of 0.160 mL/min at a sample temperature of 48 °C. These findings suggest that the increased signal intensity does not simply result from increasing the “wetness” of the spray. Rather, there is an optimal range where the spray is “wet” enough that it has sufficient time to penetrate the tissue and cocrystallize the matrix with analytes before the solvent evaporates but “dry” enough that the matrix does not overwhelm the analytes of interest and lead to matrix suppression, as postulated by Knochenmuss et al. in 1996 and supported in multiple subsequent studies.25-28 By using either a lower flow rate and an ambient tray temperature or a higher flow rate and a sample tray heated to 48 °C, we likely optimized the cocrystallization ratio of the matrix to the analyte, leading to the observed highest ranked signal intensity responses for those conditions.
Previous studies looking at matrix deposition optimization procedures support our findings. Similar to our results, Anderton et al. reported that the “wettest” spraying conditions did not provide the highest sensitivity.3 The authors suggested the percentage of water in which they dissolved their matrix had a greater effect on analyte extraction than increasing the flow rate or lowering the nozzle speed.3 While solvent composition was not a parameter examined in our study, it is notable that there are likely more experimental factors and potential interactions among these factors that could affect signal sensitivity than were investigated in our study. In agreement with our results, Anderton et al. found that a higher solvent flow rate was associated with greater analyte delocalization.3 This study also reported that nozzle speed did not have a significant effect on analyte delocalization. While sample temperature was not investigated in the study by Anderton et al., the authors did find that an increase in the nozzle temperature decreased analyte delocalization, which corroborates our data that increasing the solvent evaporation rate helps to limit analyte delocalization.3 Huizing et al. reported that more delocalization was observed at the edge of mini-pig colon tissues when a spraying method was used as compared to a solvent-free sublimation method of matrix deposition.9 While this finding does not provide direct information about the solvent flow rate, it supports our observation that drier matrix deposition methods lead to less off-tissue delocalization.9 Additional factors that could affect analyte delocalization should be evaluated in future studies. Additional factors that could potentially drive analyte delocalization include condensation from ambient humidity, solvent composition, and the nature of the analyte, among others.29 Studies are currently ongoing in our lab to further evaluate critical factors of analyte delocalization.
The use of factorial design enabled us to develop an optimized model for imaging lipids in whole mouse kidney using a DHB matrix with only eight different conditions tested in triplicate, resulting in a total of 24 imaging experiments. The DOE-optimized model accurately predicted the average delocalization, number of peaks, and spray time. However, our model overestimated both on- and off-tissue crystal size and underestimated the signal intensity when tested on kidney section 9. A possible explanation for these discrepancies could lie in factors that were not considered with this model. In this study, our goal was to investigate if a spraying method for MALDI MSI of a specific tissue and class of analytes could be optimized, or at least improved, using minimal resources and time. For this reason, we restricted our study to the upper and lower limits of each of the experimental variables. Future studies that pursue the optimization of MALDI MSI spraying protocols by applying factorial design could explore reducing the number of experimental factors and exploring delocalization beyond a single m/z value. Specifically, if a study eliminated the factor of nozzle speed, which we found to have insignificant effects on several critical response variables, and ran a two-level factorial DOE using the solvent flow rate and the sample temperature as experimental factors, four experimental conditions could be tested in triplicate using only 24 kidney sections. This method could also be used to more carefully investigate the factors that affect signal intensity. In our model, we estimated the signal intensity from four peaks only using a relative ranking approach, which is an over-simplification of the complexities that drive signal intensities in pixel spectra of MALDI imaging experiments. Future studies could utilize two-level factorial DOE approaches to test other factors and more fully explore signal intensity across the spectrum.
Our results indicate that heating the sample is advantageous for matrix deposition in MALDI MSI as it allows for a higher flow rate that corresponds to increased signal intensity without significantly compromising the image resolution by analyte delocalization. While no degradation was observed in our samples, degradation could potentially occur depending on the tissue and molecular class to be imaged. One potential explanation for our finding of no degradation following sample heating is that the sample is dehydrated and aqueous conditions are required for many degradation reactions, including the hydrolysis of lipids. In older model sprayers or home-built systems, a thin thermal pad or heat tape controlled by a rheostat could potentially be used to achieve sample heating; however, close monitoring of the temperature would be required. In addition, our final optimized model shows that spraying with a higher nozzle speed enables the use of a higher flow rate without interfering with the matrix crystal size while also limiting the time required for the matrix deposition process. As the MALDI imaging community works toward moving high-spatial-resolution MALDI MSI in the clinic, time-efficient sample preparation becomes ever more important.
The use of DOE in “-omics”-based studies will require careful consideration. In this study, we focused on a few specific lipids. However, many MALDI imaging studies will have multiple different analytes of interest from different molecular classes. In these cases, one should carefully consider the analytes of interest and use, at a minimum, representative m/z values for each molecular class of interest. This process, however, will be more time and labor intensive as more peaks will be required for analysis.
Reproducible and meaningful MSI results depend on the quality of the sample preparation procedures, especially as MSI technology expands into the wider scientific and medical community. As MALDI imaging moves into the clinic, time and cost become increasingly important. However, it is critical to minimize of the use of resources, including tissue samples, instrument time, and personnel time, for method optimization to run MALDI imaging laboratories cost-effectively. A simple two-factor DOE allowed us to assess independent and interacting effects of three different experimental factors of the spraying protocol on six outcome variables using minimal resources. Minimizing the number of sections can also be critical in studies where minimal tissue is available. This method is also fully customizable depending on the purpose of the experiment. In the case of drug studies, where only one analyte is of interest, the method can be set to optimize for a single m/z rather than the relative intensity of multiple peaks. In the case of large studies, this will also allow for multiple metrics, including any of the response parameters used in this study, to be used as a standard with an acceptable error for each independent experiment. Our DOE experiment included parameters that allowed for the evaluation of both sample preparation (crystal size, delocalization, and spraying time) and imaging features (number of peaks and signal intensity). In a large-scale clinical environment, having standard response parameters from both sample preparation and imaging will allow for more straightforward troubleshooting in the event of a problem. Future experiments could explore the use of DOE approaches for optimizing spraying conditions that cover a greater range of m/z values, tissue types, and matrices.
Supplementary Material
ACKNOWLEDGMENTS
The authors would like to acknowledge the Johns Hopkins Applied Imaging Mass Spectrometry (AIMS) Core Facility at the Johns Hopkins University School of Medicine. We would also like to acknowledge the National Institutes of Health Grants R01 CA213492 and R01 CA213428 for funding.
Footnotes
Supporting Information
The Supporting Information is available free of charge at https://pubs.acs.org/doi/10.1021/jasms.1c00081.
Peak list experimental data (XLSX)
Average spectra and Stat-Ease outputs (PDF)
The authors declare the following competing financial interest(s): Alain Cressien and Sloane Tilley work for HTX technologies, which is the sprayer used in these experiments.
Contributor Information
Caitlin Tressler, The Russell H. Morgan Department of Radiology and Radiological Science, Division of Cancer Imaging Research, The Johns Hopkins University School of Medicine, Baltimore, Maryland 21205, United States.
Sloane Tilley, HTX Technologies, LLC, Chapel Hill, North Carolina 27516, United States.
Ethan Yang, The Russell H. Morgan Department of Radiology and Radiological Science, Division of Cancer Imaging Research, The Johns Hopkins University School of Medicine, Baltimore, Maryland 21205, United States.
Christopher Donohue, The Russell H. Morgan Department of Radiology and Radiological Science, Division of Cancer Imaging Research, The Johns Hopkins University School of Medicine, Baltimore, Maryland 21205, United States.
Eric Barton, The Russell H. Morgan Department of Radiology and Radiological Science, Division of Cancer Imaging Research, The Johns Hopkins University School of Medicine, Baltimore, Maryland 21205, United States.
Alain Creissen, HTX Technologies, LLC, Chapel Hill, North Carolina 27516, United States.
Kristine Glunde, The Russell H. Morgan Department of Radiology and Radiological Science, Division of Cancer Imaging Research, The Johns Hopkins University School of Medicine, Baltimore, Maryland 21205, United States; The Sidney Kimmel Comprehensive Cancer Center and Department of Biological Chemistry, The Johns Hopkins University School of Medicine, Baltimore, Maryland 21205, United States.
REFERENCES
- (1).Caprioli RM; Farmer TB; Gile J Molecular Imaging of Biological Samples: Localization of Peptides and Proteins Using MALDI-TOF MS. Anal. Chem 1997, 69 (23), 4751–4760. [DOI] [PubMed] [Google Scholar]
- (2).Goodwin RJA Sample preparation for mass spectrometry imaging: Small mistakes can lead to big consequences. J. Proteomics 2012, 75 (16), 4893–4911. [DOI] [PubMed] [Google Scholar]
- (3).Anderton CR; et al. Utilizing a Robotic Sprayer for High Lateral and Mass Resolution MALDI FT-ICR MSI of Microbial Cultures. J. Am. Soc. Mass Spectrom 2016, 27 (3), 556–559. [DOI] [PubMed] [Google Scholar]
- (4).Gemperline E; Rawson S; Li L Optimization and Comparison of Multiple MALDI Matrix Application Methods for Small Molecule Mass Spectrometric Imaging. Anal. Chem 2014, 86 (20), 10030–10035. [DOI] [PMC free article] [PubMed] [Google Scholar]
- (5).Ščupáková K; et al. Cellular resolution in clinical MALDI mass spectrometry imaging: the latest advancements and current challenges. Clin. Chem. Lab. Med 2020, 58 (6), 914–929. [DOI] [PMC free article] [PubMed] [Google Scholar]
- (6).Bouschen W; Spengler B Artifacts of MALDI sample preparation investigated by high-resolution scanning microprobe matrix-assisted laser desorption/ionization (SMALDI) imaging mass spectrometry. Int. J. Mass Spectrom 2007, 266 (1), 129–137. [Google Scholar]
- (7).Dueñas ME; Carlucci L; Lee YJ Matrix Recrystallization for MALDI-MS Imaging of Maize Lipids at High-Spatial Resolution. J. Am. Soc. Mass Spectrom 2016, 27 (9), 1575–1578. [DOI] [PubMed] [Google Scholar]
- (8).Jaskolla TW; et al. Comparison Between Vacuum Sublimed Matrices and Conventional Dried Droplet Preparation in MALDI-TOF Mass Spectrometry. J. Am. Soc. Mass Spectrom 2009, 20 (6), 1104–1114. [DOI] [PubMed] [Google Scholar]
- (9).Huizing LRS; et al. Development and evaluation of matrix application techniques for high throughput mass spectrometry imaging of tissues in the clinic. Clinical Mass Spectrometry 2019, 12, 7–15. [DOI] [PMC free article] [PubMed] [Google Scholar]
- (10).Veličković D; et al. Response Surface Methodology As a New Approach for Finding Optimal MALDI Matrix Spraying Parameters for Mass Spectrometry Imaging. J. Am. Soc. Mass Spectrom 2020, 31 (3), 508–516. [DOI] [PMC free article] [PubMed] [Google Scholar]
- (11).Yang J; Caprioli RM Matrix Sublimation/Recrystallization for Imaging Proteins by Mass Spectrometry at High Spatial Resolution. Anal. Chem 2011, 83 (14), 5728–5734. [DOI] [PMC free article] [PubMed] [Google Scholar]
- (12).Warren AD; Mitchell DJ; Gates PJ Methodologies for the airbrush application of MALDI matrices. Eur. J. Mass Spectrom 2018, 24 (1), 89–95. [DOI] [PubMed] [Google Scholar]
- (13).Anderson DMG; et al. A method to prevent protein delocalization in imaging mass spectrometry of non-adherent tissues: application to small vertebrate lens imaging. Anal. Bioanal. Chem 2015, 407 (8), 2311–2320. [DOI] [PMC free article] [PubMed] [Google Scholar]
- (14).Hankin JA; Barkley RM; Murphy RC Sublimation as a method of matrix application for mass spectrometric imaging. J. Am. Soc. Mass Spectrom 2007, 18 (9), 1646–52. [DOI] [PMC free article] [PubMed] [Google Scholar]
- (15).Li S; Zhang Y; Liu J; Han J; Guan M; Yang H; Lin Y; Xiong S; Zhao Z; et al. Electrospray deposition device used to precisely control the matrix crystal to improve the performance of MALDI MSI. Sci. Rep 2016, 6 (1), 37903. [DOI] [PMC free article] [PubMed] [Google Scholar]
- (16).Leopold J; et al. Recent Developments of Useful MALDI Matrices for the Mass Spectrometric Characterization of Lipids. Biomolecules 2018, 8 (4), 173. [DOI] [PMC free article] [PubMed] [Google Scholar]
- (17).DeFeo JA; Juran JM Juran’s Quality Handbook: The Complete Guide to Performance Excellence, 7th ed.; McGraw-Hill Education: New York, NY, 2016. [Google Scholar]
- (18).Emiabata-Smith DF; Crookes DL; Owen MR A Practical Approach to Accelerated Process Screening and Optimisation. Org. Process Res. Dev 1999, 3 (4), 281–288. [Google Scholar]
- (19).Abd-Elal RM; et al. Trans-nasal zolmitriptan novasomes: in-vitro preparation, optimization and in-vivo evaluation of brain targeting efficiency. Drug Delivery 2016, 23 (9), 3374–3386. [DOI] [PubMed] [Google Scholar]
- (20).Gemede HF Nutritional and antinutritional evaluation of complementary foods formulated from maize, pea, and anchote flours. Food Sci. Nutr 2020, 8 (4), 2156–2164. [DOI] [PMC free article] [PubMed] [Google Scholar]
- (21).Franco J; et al. Profiling of epidermal lipids in a mouse model of dermatitis: Identification of potential biomarkers. PLoS One 2018, 13 (4), No. e0196595. [DOI] [PMC free article] [PubMed] [Google Scholar]
- (22).Miyamoto S; et al. Mass Spectrometry Imaging Reveals Elevated Glomerular ATP/AMP in Diabetes/obesity and Identifies Sphingomyelin as a Possible Mediator. EBioMedicine 2016, 7, 121–134. [DOI] [PMC free article] [PubMed] [Google Scholar]
- (23).Strohalm M; et al. mMass 3: A Cross-Platform Software Environment for Precise Analysis of Mass Spectrometric Data. Anal. Chem 2010, 82 (11), 4648–4651. [DOI] [PubMed] [Google Scholar]
- (24).Strohalm M; et al. mMass data miner: an open source alternative for mass spectrometric data analysis. Rapid Commun. Mass Spectrom 2008, 22 (6), 905–908. [DOI] [PubMed] [Google Scholar]
- (25).Knochenmuss R; et al. The Matrix Suppression Effect and Ionization Mechanisms in Matrix-assisted Laser Desorption/Ionization. Rapid Commun. Mass Spectrom 1996, 10 (8), 871–877. [Google Scholar]
- (26).Knochenmuss R; et al. The matrix suppression effect in matrix-assisted laser desorption/ionization: application to negative ions and further characteristics. Rapid Commun. Mass Spectrom 1998, 12 (9), 529–534. [Google Scholar]
- (27).Donegan M; et al. Controlling matrix suppression for matrix-assisted laser desorption/ionization analysis of small molecules. Rapid Commun. Mass Spectrom 2004, 18 (17), 1885–1888. [Google Scholar]
- (28).Taylor AJ; Dexter A; Bunch J Exploring Ion Suppression in Mass Spectrometry Imaging of a Heterogeneous Tissue. Anal. Chem 2018, 90 (9), 5637–5645. [DOI] [PubMed] [Google Scholar]
- (29).Fournelle F; et al. Minimizing Visceral Fat Delocalization on Tissue Sections with Porous Aluminum Oxide Slides for Imaging Mass Spectrometry. Anal. Chem 2020, 92 (7), 5158–5167. [DOI] [PubMed] [Google Scholar]
Associated Data
This section collects any data citations, data availability statements, or supplementary materials included in this article.