

Abstract
Both higher and lower affinity self-reactive CD4+ T cells are expanded in autoimmunity; however, their individual contribution to disease remains unclear. We addressed this question using peptide-MHCII chimeric antigen receptor (pMHCII-CAR) T cells to specifically deplete peptide-reactive T cells in mice. Integration of improvements in CAR engineering with TCR repertoire analysis was critical for interrogating in vivo the role of TCR affinity in autoimmunity. Our original MOG35–55 pMHCII-CAR, which targeted only higher affinity TCRs, could prevent the induction of experimental autoimmune encephalomyelitis (EAE). However, pMHCII-CAR enhancements to pMHCII stability, as well as increased survivability via overexpression of a dominant-negative Fas, were required to target lower affinity MOG-specific T cells and reverse ongoing clinical EAE. Thus, these data suggest a model in which higher affinity autoreactive T cells are required to provide the “activation energy” for initiating neuroinflammatory injury, but lower affinity cells are sufficient to maintain ongoing disease.
One Sentence Summary:
Higher and lower affinity autoreactive T cells have distinct roles in initiating and maintaining central nervous system autoimmunity.
INTRODUCTION
Autoimmunity is thought to arise from self-antigen reactive effector T cells possibly induced by impaired regulatory T cell (Treg) function or cross-reactivity to foreign antigens. For example, multiple sclerosis (MS) is widely believed to be caused by myelin-specific autoreactive CD4+ T cells (1–3). Similarly, experimental autoimmune encephalomyelitis (EAE), a murine model of MS, can be driven by self-reactivity to myelin oligodendrocyte glycoprotein (MOG). Classically, immunity is thought to be driven by clonal expansion towards higher affinity T cell clones (4, 5). Initially, this was also thought to be true for EAE due to the marked expansion of MOG-specific T cells identified using MHCII tetramers (6, 7). However, it became clear that MHCII tetramers were not identifying the entire population of self-reactive T cells, as revealed by the development of new techniques capable of identifying lower affinity T cells such as micropipette-based adhesion 2D affinity assays (8, 9). These data showed that lower, rather than higher, affinity MOG-specific CD4+ T cells dominate during EAE (8), raising the question of how self-reactive T cells with higher or lower affinity contribute to autoimmunity.
We addressed this question using peptide-MHCII CAR (pMHCII-CAR) T cells to delete antigen-specific T cells in vivo for the treatment of autoimmunity. We modeled our pMHCII-CAR after the MHCI-specific Signaling and Antigen-presenting Bifunctional Receptor (SABR) construct used to assess T cell specificity in vitro (10). Our intial MOG pMHCII-CAR construct expressed on CD8+ T cells could efficiently deplete higher affinity peptide-specific CD4+ T cells in vivo and block initiation of EAE, but could not deplete lower affinity 2D2 TCR transgenic (Tg) T cells nor reduce clinical deficits once disease was initiated. Improvements in the pMHCII-CAR construct resulted in higher sensitivity for deletion of 2D2 as well as other lower affinity autoreactive T cells and ameliorated ongoing clinical disease in EAE. Therefore, these data suggest that higher affinity autoreactive T cells are criticial for initiation of neuroinflammation, wheras lower affinity T cells are sufficient to maintain ongoing disease.
RESULTS
Generation of pMHCII-CAR constructs
To develop a CAR that would recognize antigen-specific MHCII-restricted CD4+ T cells, we started with intact MHCII αβ-dimers rather than a signal chain construct (11), reasoning that this may simplify application to other MHCII alleles. We first determined that fusion of a CD28-CD3zeta (28z) signaling domain after the C-terminus and not transmembrane (TM) domain of the MHCII I-Ab β chain resulted in the most NFAT-GFP signal in T cell hybridoma cells (12) upon stimulation with plate bound anti-MHCII (fig. S1A). Encoding of a peptide in I-Ab β with a 16 amino acid (a.a.) flexible linker (13) (Fig. 1A) markedly enhanced the cell surface expression of MHCII (fig. S1B). We then assessed whether the pMHCII-CAR could be triggered by its cognate TCR. Consistent with the results using SABR (10), we observed robust activation of OVA323–339, hCLIP, and GP61–80 pMHCII-CAR expressing hybridomas by their cognate TCRs expressed on OTII, TCli, and SMARTA transgenic (Tg) cells, respectively, but not other TCR specificities or polyclonal CD4+ T cells (Fig. 1B). We continued to use the 28z signaling domain as it generated a stronger NFAT signal than z alone in hybridoma cells (fig. S1C).
Fig. 1. TCR-specific recognition by pMHCII-CAR.
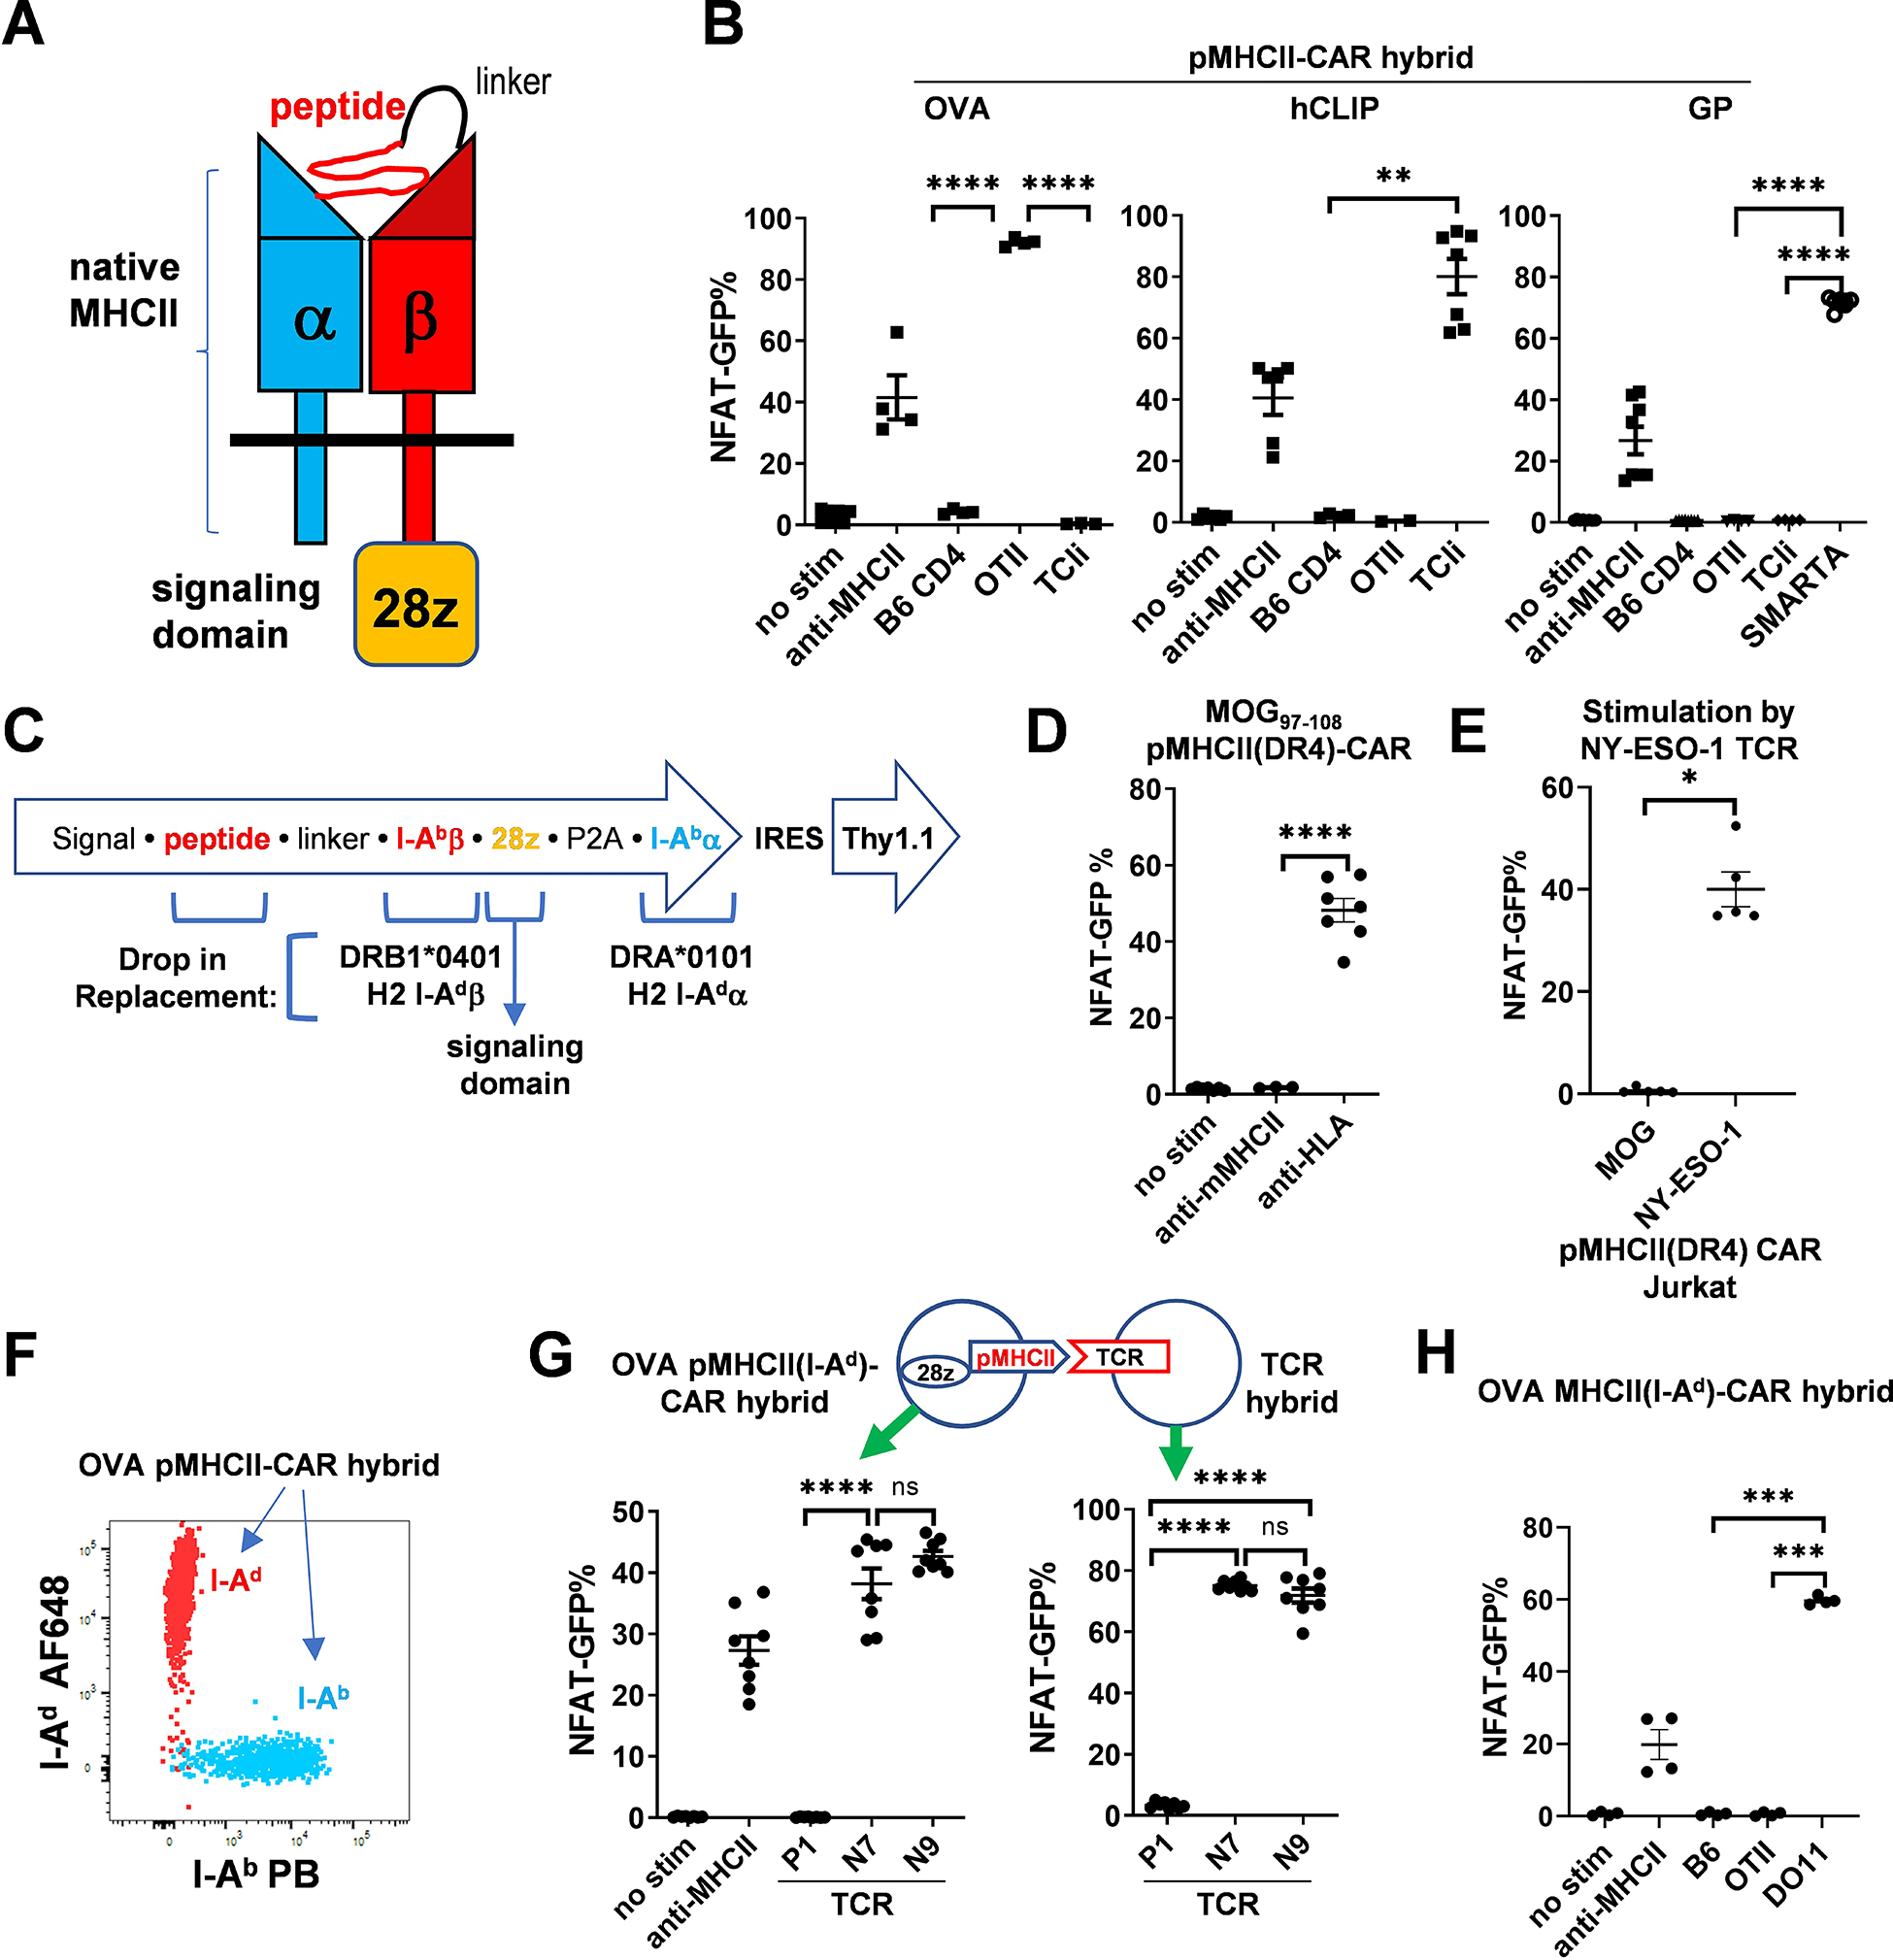
(A) Schematic of pMHCII-CAR using intact MHCII molecules. The peptide is attached to I-Abβ via a flexible linker. The signaling domain (CD28/CD3z) is attached to the C-terminus of I-Abβ. (B) pMHCII-CARs are TCR-specific. NFAT-GFP hybridoma cells were RV transduced with the indicated pMHCII-CAR vectors and co-cultured with the indicated T cells (expt.=2–3; 2–3 technical replicates each). NFAT-GFP expression was assessed 2 days later by flow cytometry. Plate-bound anti-MHCII antibody was used as a positive control. (C) Diagram of RV construct and feasibility of drop-in replacement of peptide, MHCII, and signaling domain. The MHCIIβ and MHCIIα chains are co-expressed via a (GSG)P2A linker. The reporter Thy1.1 or mCherry is expressed after an IRES. (D and E) Analysis of an HLA-DR4 pMHCII-CAR. (D) NFAT-GFP signaling of MOG97–108 pMHCII(DR4)-CAR transduced hybridoma cells in response to plate bound anti-HLA-DR antibody was assessed by flow cytometry 2 days later (expt.=2, 3–4 technical replicates each). Anti-mouse MHCII was tested in one experiment. (E) NFAT-GFP signaling of NY-ESO-1119–133 or MOG97–108 pMHCII(DR4)-CAR transduced Jurkat cells was assessed 18 hours after co-culture with NY-ESO-1 TCR expressing Jurkat cells. (F and G) Analysis of an I-Ad pMHCII-CAR. (F) The FACS plot shows overlayed I-Ad and I-Ab expression of hybridoma cell lines transduced with OVA323–339 in either I-Ad or I-Ab pMHCII-CAR constructs. (G) TCR-specific activation of OVA pMHCII(I-Ad)-CAR. Shown are the percentages of NFAT-GFP+ cells amongst OVA323–339 pMHCII(I-Ad)-CAR-expressing (left) or I-Ad restricted OVA323–339 reactive TCR-expressing (right) hybridoma cells that were co-cultured for 2d. I-Ad restricted OVA323–339 reactive clones P1, N7, N9 were previously described (16). (H) MHCII-restricted activation of pMHCII-CAR. NFAT-GFP signals induced by B6 or the indicated TCR Tg cells are shown (expt.=2, 2 technical replicates each). Bars show mean ± SEM. Nested one-way ANOVA with Holm-Sidak multiple-comparison test or nested Student’s t-test; ns, not significant; * P < 0.05; **P < 0.01; ***P < 0.001; ****P < 0.0001.
To assess the feasibility of using other MHCII alleles, required for personalization of pMHCII-CAR T cell treatment, we tested whether the MHCII α and β chains from other alleles could be directly swapped into the I-Ab construct (Fig. 1C). First, we generated a MOG97–108 pHLA-CAR using the human HLA-DR4 allele with easily detectable cell surface expression and anti-HLA-induced signaling (fig. S2A, Fig. 1D). Consistent with the TCR-specificity seen with murine pMHCII-CARs (Fig. 1B), NY-ESO-1, but not MOG, pMHCII(DR4)-CAR expressing Jurkat cells (14) were stimulated by NY-ESO-1 TCR (15) expressing Jurkat cells (Fig. 1E). Second, we tested a different murine MHCII, I-Ad. Allele-specific antibodies discriminated between the OVA323–339 I-Ad and I-Ab pMHCII-CAR constructs (Fig. 1F). Moreover, OVA323–339 pMHCII(I-Ad)-CAR could be activated in vitro by OVA-specific I-Ad restricted TCRs (16) expressed on hybridoma cells (Fig. 1G). Interestingly, this I-Ad pMHCII-CAR recognized only OVA-specific I-Ad-restricted DO11, but not I-Ab-restricted OTII, T cells (Fig. 1H, fig. S2B). In summary, we generated pMHCII-CAR vectors from 3 different MHCII alleles, either mouse or human, by simply including different MHCII α and β chains as drop-in replacements, suggesting that this straightforward pMHCII-CAR design is easily adaptable to different MHCII alleles.
TCR-specific CD4+ T cell killing by pMHCII-CAR T cells
A bi-directional assessment of cognate interactions using NFAT-GFP in hybridoma cells suggested that pMHCII-CAR signaling was less efficient than TCR signaling (Fig. 1G), but in the range of TCR interactions with pMHCII presented on dendritic cells (DCs) in our previous studies (12, 17, 18). We asked whether pMHCII-CARs could be used to target and kill antigen-specific CD4+ T cells in vivo. To test this, we retrovirally (RV) transduced pMHCII-CARs into naïve CD8+ T cells activated by anti-CD3 and anti-CD28. Transduction efficiency was routinely over 40% based on the Thy1.1 reporter (fig. S3A). Surface expression of pMHCII was dependent on the peptide but could be robust (fig. S3). Transfer of pMHCII-CAR expressing CD8+ T cells into host mice resulted in deletion of only the cognate-TCR Tg cells (Fig. 2, A to C), recapitulating the in vitro specificity in vivo. The mesenteric lymph node (MLN) was typically analyzed for in vivo TCR Tg depletion assays as deletion was equivalent in the MLN and spleen (Fig. 2C), and the MLN exhibited less non-specific staining than spleen. Note that CAR T cell transfer was performed into hosts without preconditioning such as lymphodepletion or irradiation. We also tested whether pMHCII-CAR T cells could eliminate activated effector CD4+ T cells, which would be important for the treatment of ongoing immune-mediated disease. Remarkably, CD4+ T cell killing was very efficient, with injection of 22,000 pMHCII-CAR T cells sufficient to eliminate almost all OTII T cells activated by immunization with OVA/IFA (Fig. 2, D and E). In summary, these data show that both naïve and activated CD4+ T cells can be efficiently eliminated in vivo using pMHCII-CAR cells in a TCR-specific manner.
Fig. 2. Killing of cognate CD4+ T cells by pMHCII-CAR T cells in vivo.

(A and B) TCR-specific depletion of naïve CD4+ T cells by pMHCII-CAR T cells. Sorted naïve (CD44lo CD62Lhi) CD8+ T cells were activated in vitro and RV transduced with the indicated pMHCII-CAR vectors. (A) 2×10⁵ OTII and TCli-αβ TCR Tg T cells were injected i.v. into B6 mice one day before transfer of 2×10⁵ CAR T cells. MLN were harvested after 7 days and target cell deletion was analyzed by flow cytometry. OTII and TCli-αβ cells were identified by Vα2 and Vβ6 expression, respectively, amongst total donor CD45.1 CD4+ T cells. Percentages of TCli-αβ (left) or OTII (right) cells out of total CD4+ T cells in each condition are shown (expt.=2, n=5–7 per group). Open and closed symbols indicate hosts with TCR Tg cells injected individually vs together, respectively. (B) OVA323–339 pMHCII(I-Ad)-CAR expressing BALB/c CD8+ T cells (1×10⁶) were used to target DO11 T cells (2×10⁵) transferred 1d prior. Anti-clonotype antibody (KJ1-26) was used to identify the percentage of DO11 cells of total CD4+ T cells at harvest (expt.=2; n=5 per group). (C) Rapid depletion of OTII cells by pMHCII-CAR T cells in MLN and spleen. Congenically marked OTII and B6 naïve CD4+ T cells (2×10⁵ each) were co-injected 1d before i.v. transfer of 2×10⁵ OVA323–339 pMHCII-CAR T cells. The percentages of donor OTII T cells (red) or B6 CD4+ T cells (black) amongst total CD4+ T cells in MLN or spleen are shown at the indicated times post CAR T cell transfer (expt.=2; n=6 per group). (D and E) Depletion of activated OTII cells by OVA323–339 pMHCII-CAR T cells. Host B6 mice were injected with 2×10⁵ OTII cells, immunized the next day with OVA/IFA, followed 2 days later by pMHCII-CAR T cells injection (2×10⁵ in (D), or as indicated in (E)). OTII cell depletion was examined 5 days later (expt.=2; n=5–6 (D) or n=4–7 (E) per group). P values were determined by one-way ANOVA with Holm-Sidak, except (B) Student’s t-test, and (C) repeated measures ANOVA. Bars show mean ± SEM; ns, not significant; *P < 0.05; **P < 0.01; ***P < 0.001; ****P < 0.0001.
Prevention and treatment of CNS autoimmunity using pMHCII-CAR T cells
One of the goals for pMHCII-CAR T cell therapy is the treatment of autoimmune disease. However, pathogenic autoreactive TCRs, in comparison to the foreign reactive TCRs studied above, may be of lower affinity due to encounter of antigen in the thymus resulting in negative or T regulatory (Treg) cell selection (16, 19, 20). To test the impact of lower affinity pMHCII:TCR interactions, we used a previously described altered peptide ligand (APL) of OVA peptide, OVAE336Q, which shows decreased stimulation of OTII T cells compared with wild-type (wt) OVA (21, 22). We found that OVAE336Q pMHCII-CAR was less efficient at in vitro activation or in vivo deletion compared to wild-type OVA (Fig. 3, A and B) with similar surface expression (fig. S3B). Notably, the lower affinity OVAE336Q, but not wt OVA323–339, pMHCII-CAR was dependent on CD4 for in vitro signaling (Fig. 3B), suggesting that the use of an intact MHCII molecule can facilitate CAR signaling by co-receptor engagement. This does not appear to be possible with the previously reported pMHCII-TCR fusion due to the lack of a CD4 binding site (23). In summary, these data suggest that pMHCII:TCR affinity dictates the efficiency of target cell recognition and killing by pMHCII-CAR T cells.
Fig. 3. Treatment of EAE with MOG35–55 pMHCII-CAR T cells.

(A) Decreased OTII T cell depletion with lower affinity pMHCII-CAR T cells. B6 mice were injected with 2×10⁵ OTII cells, followed the next day by 2×10⁵ OVA323–339 or OVAE336Q pMHCII-CAR T cells. The frequency of OTII cells amongst the total CD4+ T cell population was assessed 5d post-CAR T injection by flow cytometry (expt.=2, n=4–5 per group). (B) CD4 co-receptor involvement in low affinity pMHCII-CAR signaling. OVA pMHCII-CAR hybrids were co-cultured with OTII cells in the presence or absence of anti-CD4 (20 μg/ml) for 2 days and assessed for NFAT-GFP by flow cytometry (expt.=2; each with 3 technical replicates). (C) MOG35–55 pMHCII-CAR hybridomas do not recognize 2D2 in vitro. MOG35–55 pMHCII-CAR hybridoma cells were cocultured with the indicated naïve T cells. NFAT-GFP expression was examined after 2 days by flow cytometry (expt.=2, each with 3 technical replicates). Plate coated anti-MHCII antibody (20 μg/ml) was used as positive control. (D) Low expression of MOG35–55 pMHCII-CAR on primary CD8+ T cells by flow cytometry. Surface expression of OVA323–339 and GP61–80 pMHCII-CAR are shown for comparison. Events shown are gated on Thy1.1+ transduced cells. (E) Inability to deplete 2D2 TCR Tg T cells with MOG35–55 pMHCII-CAR T cells in vivo. OTII and 2D2 TCR Tg T cells (2×10⁵ each) were co-injected 1d before injection of 2×10⁵ pMHCII-CAR T cells. At d5 post-CAR T cell injection, the percentages of OTII (left) or 2D2 T cells (right) of total CD4+ T cells were assessed as Vα2+Vα3.2− or Vα2−Vα3.2+, respectively, of transferred CD45.1+ CD4+ T cells by flow cytometry (expt.=2; n=6 per group). (F and G) Amelioration of EAE with MOG35–55 pMHCII-CAR T cells. EAE was induced by immunization with MOG35–55 in CFA with 2 doses of PTX separated by 48 hr, followed by 3×10⁶ OVA323–339 or MOG35–55 pMHCII-CAR T cells injected at d12, 13, and 14 post-immunization. (F) Disease activity was assessed by a clinical score for neurologic impairment (expt.=2; n=13–14 per group). (G) Flow cytometric analysis of MOG38–49 tetramer+ (tet+) cells in the CNS at d26 after immunization (expt.=2; n=10–11/group). P values were determined by nested Student’s t-test (B), ordinary Student’s t-test (G), nested ANOVA with Holm-Sidak (C), ordinary ANOVA with Holm-Sidak (A, E), or repeated measures ANOVA (F). Bars show mean ± SEM; ns, not significant; *P < 0.05; **P < 0.01; ***P < 0.001; ****P < 0.0001.
We then asked whether MOG35–55 pMHCII-CAR would recognize 2D2 TCR Tg cells (24), which can be used to induce EAE but have been reported to have low affinity for MOG35–55 (9, 25). However, 2D2 T cells did not activate pMHCII-CAR-expressing NFAT-GFP reporter hybridoma cells (Fig. 3C), which may be partially explained by the low surface expression of the MOG35–55 pMHCII-CAR compared with OVA or GP peptide constructs (Fig. 3D). Consistent with these in vitro results, we did not find evidence of pMHCII-CAR-mediated depletion of 2D2 in vivo (Fig. 3E). Thus, these data predicted that MOG35–55 pMHCII-CAR, at least in this original form, would be ineffective against autoimmunity caused by low affinity self-reactive T cells such as 2D2.
As 2D2 may not be representative of all encephalitogenic CD4+ T cells, we proceeded to test whether MOG35–55 pMHCII-CAR T cells could be used to treat EAE. B6 mice were immunized subcutaneously (s.c.) with MOG35–55 peptide in CFA followed by pertussis toxin (PTX) injection at immunization and 48 hours later. Unexpectedly, injection of MOG35–55 pMHCII-CAR T cells at the time of disease onset markedly limited disease activity (Fig. 3F). This corresponded with a decrease in MOG38–49-tetramer+ cells in the CNS (Fig. 3G). As 2D2 T cells could not be targeted by this pMHCII-CAR (Fig. 3, C and E), our interpretation is that the encephalitogenic T cells inducing active EAE are likely to recognize MOG35–55 with a higher affinity than 2D2 T cells.
Di-sulfide trap enhances pMHCII-CAR expression and sensitivity to low-affinity MOG-specific T cells
To optimize pMHCII-CAR T cell therapy for EAE, our initial goal was to improve the efficiency of deleting low-affinity T cells given our inability to target 2D2 T cells. As the cell surface expression of MOG35–55 pMHCII-CAR was low (Fig. 4A), we tested modifications that could improve pMHCII stability. We utilized an artificial “di-sulfide trap” (DST) that crosslinks a cysteine in the linker (p9+2 position) attached to I-Abβ with a mutated cysteine at I-Abα72 to stabilize the pMHCII molecule (26). Consistent with reports showing improved pMHCII stability in MOG tetramers (26), we also observed markedly improved surface expression of MOGDST pMHCII-CAR (Fig. 4A). MOGDST pMHCII-CAR facilitated NFAT-GFP induction in vitro in response to 2D2 when expressed in hybridoma cells (Fig. 4B), and depletion of 2D2 cells in vivo when expressed in CD8+ T cells (Fig. 4C). Despite the improvements afforded by MOGDST in terms of pMHCII expression and 2D2 recognition and killing, MOGDST pMHCII-CAR T cells did not statistically improve upon MOG35–55 pMHCII-CAR T cell therapy of EAE (Fig. 4D). These results suggest that while MOGDST pMHCII-CAR T cells may be able to recognize and deplete a wider affinity range of MOG-reactive T cells, additional modifications are necessary to enhance their efficacy for the treatment of EAE.
Fig. 4. Di-sulfide trap modification improves MOG pMHCII-CAR surface expression and sensitivity.

(A) Surface expression of indicated pMHCII-CAR by flow cytometry of transduced primary CD8+ T cells. (B) MOGDST pMHCII-CAR recognizes 2D2 TCR in vitro. NFAT-GFP expression at 2d was assessed using hybridoma cells expressing a pMHCII-CAR (indicated on x-axis) co-cultured with the naïve T cells (top of graph) (expt.=2; each with 2 technical replicates). (C) 2D2 target T cell deletion by MOGDST pMHCII-CAR T cells. 2D2 TCR Tg cells (2×10⁵) were injected 1d before injection of the indicated 2×10⁵ pMHCII-CAR T cells. Shown are 2D2 target (left) or CAR (right) T cell survival as a percentage of total CD4+ or CD8+ T cells 5 days later (expt.=2; n=6/group). (D) No significant improvement in EAE therapy with MOGDST pMHCII-CAR T cells. EAE induction and CAR T cell therapy was performed as per Fig. 3F, with 3×10⁶ pMHCII-CAR T cells injected at d11, 12, 13 post-immunization (expt.=2; n=13–15/group). P values were determined by nested one-way ANOVA with Holm-Sidak multiple-comparison (B), ordinary ANOVA with Holm-Sidak (C), or repeated measures ANOVA (D). Bars show mean ± SEM, *P < 0.05; **P < 0.01.
Inhibition of Fas enhances pMHCII-CAR T cell survival and lethality
A potential avenue for enhancing CAR T cell efficacy was suggested by the in vivo 2D2 deletion experiment, where we noted a low rate of MOGDST pMHCII-CAR T cell survival (Fig. 4C). We therefore tested modifications reported to enhance CAR T cell survival, including overexpression of Bcl2 (27) and inhibition of Fas signaling via overexpression of a dominant-negative Fas with a deleted death domain (FasΔDD) (28). These genes were incorporated into the 3’ end of the vector using a T2A sequence. In comparison with MOGDST alone, the overexpression of FasΔDD but not Bcl2 markedly increased target 2D2 killing and CAR T cell recovery 5 days after transfer (Fig. 5, A and B; fig. S4, A and B). However, FasΔDD expression did not facilitate in vivo depletion of 2D2 by T cells expressing the original MOG35–55 CAR construct (fig. S4C), suggesting that FasΔDD did not markedly enhance target cell recognition. Rather, FasΔDD may act to block the effect of increased Fas levels seen on MOGDST vs MOG35–55 CAR T cells after in vivo interaction with 2D2 cells (fig. S4D), and thereby limit Fas-mediated apoptosis of CAR T cells.
Fig. 5. Fas blockade on pMHCII CAR T cells improves target T cell killing and EAE treatment.

(A and B) Efficient in vivo depletion of 2D2 cells by MOGDST pMHCII-FasΔDD-CAR T cells. Congenitally marked target 2D2 and OTII cells (2×10⁵ each) were co-transferred 1d before injection of indicated 2×10⁵ pMHCII-CAR T cells (x-axis) and assessed 5 days later (expt.=2; n=6/group). Shown is (A) 2D2 survival represented by its ratio to the internal OTII injection control, which is then normalized to 100% survival in the MOG35–55 pMHCII-CAR no deletion control samples; and (B) percentage of surviving CAR T cells of total CD8+ cells. (C and D) Assessment of pMHCII-CAR T cell-mediated killing mechanisms. Faslgld (C) or Prf1−/− (D) CD8+ T cells were used to generate MOGDST pMHCII-FasΔDD-CAR T cells. Shown are the target 2D2 T cell deletion efficiency at d3 post-CAR T cell-injection normalized to the WT condition (expt.=2; n=6/group). (E and F) Improved EAE treatment by MOGDST pMHCII-FasΔDD-CAR T cells. EAE was induced as per Fig. 3F. The indicated pMHCII-CAR T cells (3×10⁶) were injected at d12, 13, 14 post-immunization. (E) EAE prevention represents mice with clinical score = 0 at time of CAR T cell injection (expt.=2; 7 MOG35–55, 7 MOGDST pMHCII-FasΔDD, n= 2 OVA, 7 OVA (historical, expt.=2)). (F) EAE treatment represents data from mice with clinical score > 0 at the time of CAR T cell therapy (expt.=2; n= 3 OVA, 9 MOG35–55, 11 MOGDSTFasΔDD). Data shown are the delta from the clinical score on day of CAR T cell injection. (G and H) Treatment of established EAE with CAR T cells (see also fig. S5). Data shown are (G) the delta from the clinical score on day of CAR T cell injection (d18), and (H) CAR T cell survival in the CNS 8 days after injection (expt.=2; n= 5 OVA, 7 MOG35–55, 9 MOGDSTFasΔDD). To assess both the utility and potential toxicity of CAR T cells on moderate EAE, mice with clinical scores of 1.5–2.5 on d18 after immunization were analyzed. Student’s t-test or one-way ANOVA with Holm-Sidak (A to D, and H), or repeated measures ANOVA (E to G). Kruskal-Wallis test for d3/4 graphs on right of G. Bars show mean ± SEM; ns, not significant; *P < 0.05; **P < 0.01; ***P<0.001; ****P < 0.0001.
The increased lethality of MOGDST pMHCII-CAR-FasΔDD T cells may simply be due to inhibition of Fas-FasL-mediated cell death of the CAR T cell resulting in persistent availability to re-engage other targets. However, inhibition of Fas may also permit prolonged or higher expression of FasL on the CAR T cell, facilitating killing. We therefore addressed the killing mechanism of pMHCII-CAR T cells using FasLgld mice (29), which encode a hypomorph mutation of FasL which markedly reduces Fas-mediated killing (30). We found that MOGDST pMHCII-CAR-FasΔDD CD8+ T cells expressing FasLgld show a ~15% reduction in their ability to kill 2D2, whereas perforin-deficiency did not affect CAR T cell killing (Fig. 5, C and D).
We then tested the efficacy of MOGDST pMHCII-CAR-FasΔDD in EAE when transferred into mice 12 days after MOG immunization, at which time on average half of the mice show initial clinical signs of inflammatory demyelination. Consistent with prior experiments (Fig. 3F, 4D), MOG35–55 pMHCII-CAR treatment of mice without signs of EAE was effective at limiting disease, while treatment with MOGDST pMHCII-CAR-FasΔDD prevented almost all clinical signs of EAE (Fig. 5E). However, a clear benefit of MOGDST pMHCII-CAR-FasΔDD was observed in mice that had already manifested signs of EAE, with a significant reduction in subsequent clinical scores, whereas initially symptomatic MOG35–55 pMHCII-CAR-treated mice remained clinically unchanged (Fig. 5F). We also asked whether MOG-specific CAR T cells could inadvertently cause neurotoxicity (31) when treating ongoing EAE later in the disease course (day 18 after immunization) via the use of a slightly modified EAE protocol with reduced severity (32). We did not see evidence as a group nor in individual mice of clinical worsening after CAR T cell administration (fig. S5). Consistent with superiority at clinical onset (Fig. 5F), we observed a therapeutic effect of MOGDST pMHCII-CAR-FasΔDD but not MOG35–55 CAR T cells on established EAE (Fig. 5G, fig. S5), which was associated with significantly improved CAR T survival in the CNS (Fig. 5H). Collectively, these data provide proof of principle that antigen-specific CAR T cells can be used to treat ongoing autoimmune disease.
Targeting lower affinity MOG-specific T cells is critical for amelioration of EAE
While we inferred that the ability of MOGDST pMHCII-CAR-FasΔDD, but not MOG35–55 pMHCII-CAR, T cells to treat EAE is a result of lower affinity MOG-specific T cell deletion, this was based only on a differential effect in 2D2 cell killing. To obtain greater insight regarding the TCRs targeted by these pMHCII-CARs, we studied their impact on the MOG-specific TCR repertoire of fixed TCRβ chain TCliβ Tg mice (Fig. 6A) (12, 17, 18, 33). We first identified putative MOG-specific TCRs in TCRβ Tg mice by performing TCRα sequencing of Foxp3IRES-GFP− CD44hi CD62Llo T effector (Teff) cells sorted from mice immunized in vivo with MOG35–55 and further expanded in vitro on splenic DCs and MOG peptide (Fig. 6, B and C). Many of the in vitro expanded TCRs were commonly found in the Teff subset in the CNS of mice with clinical EAE, supporting the notion they are MOG-specific (Fig. 6D). Finally, we asked whether we could identify any TCRs that were removed from the CNS due to MOG35–55 pMHCII-CAR T cells. By DESeq2 analysis, we found 3 abundant Treg, but not Teff, TCRs that were decreased in frequency with CAR T treatment (Fig. 6E). In summary, we picked 3 CNS Treg TCRs as well as 8 TCRs identified in our in vitro assay for functional testing of MOG reactivity (Fig. 6F).
Fig. 6. Selection of candidate MOG-specific TCR clones from TCR repertoire analysis.

(A) Experimental strategy for TCR sequencing with TCliβ Tg Foxp3IRES-GFP mice. Mice were immunized with MOG35–55 in CFA followed with 2 doses of PTX. TCRα sequencing was performed with purified PLN Treg or Teff cells at wk2, or with PLN or CNS T cells at wk4. For in vitro expansion, wk2 PLN Teff cells were labeled with cell trace violet (CTV), and cocultured with splenic DCs for 5 days in the presence of 10μg/ml MOG35–55 peptide, then CTVneg cells were sorted for TCR sequencing. (B) Selection of in vitro expanded TCRs. Heatmaps show frequencies of top 10 Teff TCRs from in vivo wk2 PLN (left) or further expansion in vitro (right) (expt.=1; n=3). (C) Selection of lower frequency TCR DS2 and DS4 based on DESeq2 analysis with wk2 PLN Teff TCR repertoire after mice were immunized with CFA or MOG/CFA. Volcano plot (left) shows differentially induced TCRs. Dots indicate individual TCRs. Dashed red line indicates 0.05 padj from DESeq2. Heatmap (right) shows frequencies of top padj TCRs (expt.=1; n=4/group). (D) Top CNS Teff TCRs at wk4 in EAE mice. Volcano plot shows differentially induced CNS Teff TCRs (left; expt.=2; n=10) when compared with PLN data of CFA-immunized mice of (C). Heatmap (right) shows frequencies of top CNS Teff TCRs vs in vitro expanded TCRs. (E) Selection of CNS Treg TCRs JYM11, JYM13, and JYM14 that may be reduced by MOG35–55 pMHCII-CAR T cells. TCR repertoire analysis was performed with Teff or Treg cells from the CNS of TCliβ Tg Foxp3IRES-GFP mice at wk4 as per (A), except the mice received media or 3×10⁷ total MOG35–55 pMHCII CAR T cells at d7, 8 and 9. Volcano plots (top) of Teff or Treg TCR repertoire when comparing no CAR T and MOG35–55 CAR T group (expt.=1; n=4–5/group). Heatmap (bottom) shows frequencies of top 5 CNS Treg TCRs. Among these, TCRs potentially reduced in frequency by MOG35–55 CAR T cells (relaxed criteria of padj<0.5) were selected for functional testing. (F) Candidate MOG-specific TCRs tested. Shown are rationales for selecting each TCR and their reactivity to MOG35–55 peptide.
These 11 TCRα chains were gene synthesized and retrovirally expressed on NFAT-GFP reporter hybridoma cells expressing the fixed TCRβ chain and murine CD4 (12, 17, 18). Eight TCRs were stimulated by MOG35–55 presented by flt3L-induced DCs with widely varying efficiencies as measured by an estimated EC50 (half maximal effective concentration), and is used here as a surrogate for pMHCII:TCR affinity (Fig. 6F, Fig. 7A). Interestingly, there was a strong bias towards a single CDR3 length and 2 different J chains amongst the MOG-reactive TCRs, with the exception of JYM14 – the TCR with the highest reactivity (Fig. 6F). In summary, this approach allowed us to capture a substantial fraction of the MOG-specific TCR repertoire in TCliβ Tg mice which span an estimated thousand-fold range of “affinity” for MOG35–55 (Fig. 6F, Fig. 7A).
Fig. 7. Targeting lower affinity MOG-specific T cells is required for amelioration of EAE.

(A) MOG reactivity of TCRs identified by TCR repertoire analysis in Fig. 6. Data shown are percent NFAT-GFP+ of the indicated TCR expressing hybridoma cells in response to titrated doses of MOG35–55 peptide presented by flt3L-stimulated DCs after 2 days. These curves were used to estimate an EC50 (right). Note that the EC50 of very low reactivity TCRs is extrapolated. No peptide controls showed <1% NFAT-GFP (expt.=2; 4 technical replicates). (B) Correlation between TCR affinity and T cell subset. (Left) Heatmap of mean Treg or Teff TCR frequency in the CNS of EAE-induced mice at 4 weeks of individual MOG-specific TCRs arranged in order of decreasing reactivity based on (A). (Right) Skewing towards the Treg vs Teff subset is shown (% in Treg repertoire/(% in Treg repertoire + % in Teff repertoire)). Red line is derived from sigmoidal fitting analysis. (C) Correlation between TCR affinity and abundance in CNS Teff TCR repertoire at wk4. Black line is from linear regression. (D) Correlation between EC50 and fold increase of individual MOG-specific TCR between wk2 and wk4 in PLN Teff TCR repertoire. The line is nonlinear sigmoidal fitting. (E and F) MOGDST pMHCII-FasΔDD-CAR T cells, but not MOG35–55 pMHCII-CAR T cells, induce significant changes in the TCR repertoire experiments described in Fig. 6E and fig. S5. Data shown are NMDS plots of horn distance for CNS Teff TCRs at wk4 (E), and P-values of PERMANOVA test between the indicated samples (F). Each dot represents data from individual mice. (G and H) Deletion of MOG-specific TCRs by pMHCII-CAR T cells. Each dot represents data from individual mice. (G) The cumulative frequency of 6 known MOG-reactive Teff TCRs are shown from the PLN or CNS Teff subset with the indicated pMHCII-CAR T cell treatment. (H) Individual intermediate (JYM2) or lower (JYM1) affinity TCR frequencies in CNS Teff cells are shown. Also see fig. S5D. (I) Correlation of TCR activation by pMHCII-CAR and MOG35–55 peptide. Percentages of NFAT-GFP+ cells of TCR-transduced hybridoma cells interacting with indicated pMHCII-CAR expressing hybridoma cells were correlated with estimated EC50 from (A). Green (MOG35–55) or red (MOGDST) lines are from simple linear regression of points to be on the linear portion of the curve (top 3 for MOG, and all points for MOGDST). (J) Model integrating TCR affinity, autoimmunity, and pMHCII-CAR deletion. Correlation between TCR affinity and pMHCII-CAR-mediated depletion efficiency is shown. Red (MOGDSTFASΔDD) or green (MOG35–55) lines represent sigmoidal fitting of deletion efficiency. Abundant MOG-specific T eff cells are of relatively lower affinity. MOG35–55 pMHCII-CAR T cells can eliminate higher affinity MOG-specific T cells, whereas deletion of lower affinity MOG-specific Teff cells requires MOGDST pMHCII-CAR-FasΔDD T cells. (K) Correlation of higher affinity Teff TCR JYM2 with disease severity in MOG35–55 pMHCII-CAR T cell treated mice. P values are from Spearman’s correlation between clinical scores and MOG-specific TCR frequencies in PLN Teff cells. (L) Hypothetical “activation energy” (Eact) model for induction of autoimmunity. The role of higher affinity MOG-specific T cells in EAE maybe analogous to “activation energy” in a chemical reaction, whereas once autoimmunity is initiated, can be maintained by lower affinity T cells. The grey line indicates clinical score, which would be on a different y-axis scale and would lag behind the “activation energy” (black line) needed to induce disease. Kruskal-Wallis test (G, H); *P< 0.05; **P<0.01; ***P<0.001.
Of this group of MOG-reactive TCRs, the two TCRs with the highest sensitivity (JYM14 and DS4) were enriched in Treg cells in the CNS of EAE mice, whereas the remaining TCRs were predominantly found in the Teff subset (Fig. 7B). This is consistent with prior modeling of thymic Treg cell development (16) and studies of MOG-specific T cells (34). Notably, we observed a strong inverse correlation between the frequency of MOG-specific Teff TCRs in the CNS and sensitivity to MOG35–55 peptide (Fig. 7C) indicating that lower, and not higher, affinity MOG-specific T cells represent the majority of CNS infiltrating Teff cells during EAE. These lower affinity MOG-specific TCR frequencies were markedly higher in the CNS than PLN (fig. S6). Preferential expansion of lower affinity MOG-specific Teff TCRs was also observed in TCR repertoire studies between wk2 and wk4 in the PLN (Fig. 7D). Together, these data strongly suggest that during the EAE disease course there is progressive selection towards lower affinity MOG-specific effector TCR clones.
We next asked whether pMHCII-CAR T cell treatment altered the MOG-specific TCR repertoire. Although EAE was milder likely due to the limited TCR repertoire in fixed TCRβ chain Tg mice, a clear inhibition of EAE was mediated by MOG35–55 pMHCII-CAR and MOGDST pMHCII-CAR-FasΔDD T cells (fig. S7A). While there was not an obvious change in alpha diversity of the CNS Teff TCR repertoire with CAR T cell therapy (fig. S7B), a non-metric multidimensional scaling (NMDS) plot showed that MOGDST pMHCII-CAR-FasΔDD induced greater changes in the CNS Teff TCR repertoire than MOG35–55 pMHCII-CAR (Fig. 7E), which is supported by permutational multivariate analysis of variance (PERMANOVA) testing (Fig. 7F), DESeq2 differential expression analysis (fig. S7C), and the cumulative loss of MOG35–55-specific TCRs (Fig. 7, G and H; fig. S7D). Thus, these data demonstrate that MOGDST pMHCII-CAR-FasΔDD T cells deleted the vast majority of MOG-specific Teff cells in the CNS (Fig. 7G, fig. S7D), which correlated with the efficiency of TCR:pMHCII-CAR interaction (Fig. 7, H to J).
Notably, the frequency of the higher affinity MOG-specific Teff TCR, JYM2 remaining within the PLN ~3 weeks after MOG35–55 pMHCII-CAR T cell treatment was significantly correlated with the clinical score (Fig. 7K), whereas the frequencies of lower affinity TCRs were not correlated. Of note, we found approximately ~2 fold higher sensitivity of JYM2 TCR to MOG35–55 peptide when compared to 2D2 TCR (fig. S7E). Taken together, the TCR repertoire and 2D2 killing data support the conclusion that generation of lower affinity MOG-specific T cells without higher affinity T cells does not lead to the development of clinical disease. These data therefore suggest that the generation of higher affinity T cells are analogous to the provision of “activation energy” in a chemical reaction, which is required to initiate autoimmunity, whereas lower affinity T cells are sufficient for the maintenance of ongoing autoimmunity (Fig. 7L).
DISCUSSION
Our data are consistent with recent reports regarding the potential for antigen-specific T cell depletion therapy for autoimmunity. For example, in a partially humanized murine model of rheumatoid arthritis, pMHCII-CAR T cells composed of HLA-DR1 bound to a type II collagen peptide were effective at preventing collagen-induced arthritis (35). The pMHCII-CAR approach represents an alternative to a recent report using a MHCII-TCR fusion (5M)CAR to prevent autoimmune diabetes (23). A potential advantage of using the intact MHCII molecule over a MHCII-TCR fusion is the ease of constructing pMHCII-CARs using different MHCII alleles, which we did with murine I-Ad and human HLA-DR4 sequences without modification as proof-of-principle. On the other hand, the MHCII-TCR fusion has a theoretical advantage via the use of endogenous CD3 signaling mechanisms compared with the 28z in our pMHCII-CAR. However, the signaling domain of pMHCII-CAR can be further tuned to increase or decrease sensitivity, whereas the MHC-TCR:CD3 signal cannot be easily adjusted. Moreover, the MHCII-TCR fusion does not result in CD4 co-receptor engagement, requiring addition of non-specific co-receptors with signaling domains (CD80-lck). Future experiments will be required to directly compare these methodologies and evaluate the efficiency of TCR recognition, CD4+ T cell killing, and CAR T cell persistence.
One challenge that we encountered regarding antigen-specific therapy for autoimmunity is that the affinity of self-reactive Teff cells appears substantially lower than those reactive to foreign-antigens, presumably due to the need to escape thymic negative and Treg selection (19). Consequently, higher affinity self-reactive Treg cells are likely to be preferentially eliminated. Our TCR repertoire analysis confirmed that MOG-specific Treg TCRs were higher affinity than Teff TCRs (34), and are preferentially eliminated by the lower sensitivity MOG35–55 pMHCII-CAR T cells, whereas a substantial number of MOG-specific Teff cells remain. However, the lack of disease exacerbation suggests that a proposed Treg cell suppression mechanism based on peptide-specific inhibition (36) may not be essential to abrogate inflammation. Rather, our data are supportive of a recent study of prostate antigens (37) arguing against this requirement for Treg cell function. Future studies will be required to ascertain the importance of Treg cell elimination with pMHCII-CAR T cell therapy. By contrast, selective elimination of antigen-specific Treg cells using lower sensitivity pMHCII-CAR T cells may be of benefit for cancer immunotherapy.
One unexpected finding from the TCR repertoire analysis was that lower, and not higher, affinity MOG-specific TCRs expanded in the PLN between weeks 2 and 4 after MOG immunization. In addition, we found an inverse correlation between affinity and abundance of MOG-specific Teff TCRs in the CNS. This is similar to a study of chronic Cytomegalovirus infection (38), and in line with previous observations supporting a greater role of lower affinity T cells in EAE and other responses (8, 39). Our data is consistent with the literature showing that MOG35–55 -specific Treg TCRs are of substantially higher affinity for self than Teff cells (34), that 2D2 cells exhibit “low” affinity for MOG (9), and that many MOG-specific TCRs may lie below the detection range of pMHCII tetramers based on 2D affinity measurements (8). Initial attempts to treat EAE with a MOG35–55 pMHCII-CAR were successful in preventing EAE from worsening but could not improve clinical signs of ongoing disease. Addressing the durability of MOG35–55 CAR T cell responses during certain stages of disease remains as an important future question. Improvements in pMHCII-CAR stability and signaling strength via the use of a DST, and prevention of CAR T cell death via the use of a dominant negative FasΔDD, resulted in higher sensitivity which allowed the targeting of both higher and lower affinity MOG-specific CD4+ T cells. Notably, the difference between the original lower sensitivity vs improved higher sensitivity MOG pMHCII CARs enabled us to investigate the relative contributions of higher vs lower affinity T cells in ongoing autoimmune disease.
The observations using pMHCII-CAR T cells with differential sensitivity for self-reactive TCRs lead us to propose a model whereby higher affinity autoreactive T cells provide an initial “activation energy” to initiate autoimmunity, analogous to the energy required to initiate a chemical reaction. We postulate that previously reported driver clones (40) represent higher affinity T cells providing “activation energy” for initiating autoimmune disease. This model suggests that autoimmune disease is difficult to trigger, as thymic selection or peripheral expansion of high affinity self-reactive T cells would occur inefficiently. While further studies are required to extend these results beyond the active EAE model studied here, our results imply that the elimination of infrequently generated high affinity autoreactive T cell clones with pMHCII-CAR T cell treatment may be sufficient to prevent onset of autoimmune disease if this threshold has not been crossed.
The notion of a “prodrome” phase prior to crossing the “activation energy” threshold into autoimmune disease has been observed in both mouse models and humans. For example, it is well established that NOD mice invariably develop a clear inflammatory reaction around the islets of Langerhans at a young age, but islet destruction develops later (41). In humans, this may be analogous to the observation that autoantibodies to insulin are detectable well before development of diabetes (42, 43). Similarly, anti-nuclear and anti-thyroid antibodies can be observed well before the diagnosis of systemic lupus erythematosus (SLE) or autoimmune thyroiditis (44, 45). Thus, these examples support the model that an “activation energy” threshold is required for the development of autoimmune pathology.
Finally, our model of autoimmunity suggests that lower affinity T cells are sufficient to perpetuate disease activity. This would therefore imply that targeting flares of disease may not be sufficient to mitigate long term damage due to persistence and activity from lower affinity T cells. Indeed, the benefit of curtailing clinical relapses in MS, for example, is controversial as current disease-modifying therapies are highly effective at reducing relapse rates but are not as effective at preventing eventual progression of disability (46), perhaps analogous to our treatment with lower sensitivity pMHCII-CAR T cells. Thus, we speculate that targeting the repertoire of low affinity autoreactive T cells driving chronic smoldering CNS inflammation may address a key underlying driver of MS disability. Although our most modified CAR T cells showed significant therapeutic effect on ongoing disease, we were not able to completely resolve clinical outcomes, which implies that further modifications are required such as engineering homing receptors, increasing/decreasing sensitivity of signaling domain, and incorporating other genes to help cytotoxicity and survival. Lastly, targeting additional peptide-specificities emerging from epitope spreading could be a promising strategy for efficient treatment of remitting autoimmunity.
MATERIALS AND METHODS
Study Design
The aim of this study was to specifically eliminate autoreactive T cells using pMHCII-CAR expressing CD8+ T cells. During the development of pMHCII-CAR constructs with greater functional capacity, we sought to understand the role of higher and lower affinity self-reactive TCRs during autoimmunity. The efficacy of pMHCII-CAR constructs was assessed using various approaches, including in vitro NFAT-GFP cell line assays, in vivo depletion assays using transgenic CD4+ T cells, the active EAE mouse model of autoimmunity, and TCR sequencing analysis.
Mice
Mouse breeding and experiments were performed in a specific pathogen-free facility using protocols approved by the Washington University Animal Studies Committee. Strains used (table S1): C57BL/6 and Balb/c mice were obtained from Charles River or the Jackson laboratory. OT-II (#004194), SMARTA (# 030450), 2D2 (#006912), and CD45.1 C57BL/6 (#002014), Prf1−/− (#002407), FasLgld (#001021) mice were obtained from the Jackson laboratory. TCli TCRαβ mice were previously described (33). Each TCR Tg transgenic line was maintained as CD45.1 C57BL/6 background. DO11 mice were kindly provided by Dr. Kenneth Murphy (Washington University School of Medicine in St. Louis). TCli TCRβ mice (33) were bred with Tcra−/− (Jackson laboratory, #002116) and Foxp3IRES-GFP mice (Jackson laboratory, #006772). TCli TCRβ Tcra+/− Foxp3IRES-GFP mice were used for TCR sequencing as previously described (18). 6–8 week old male and female mice were used for experiments with exception of mice for active EAE induction, which were 8–10 week old male and female mice.
pMHCII-CAR constructs
We first tested MigR1-based RV constructs in which a second generation CD28-CD3zeta (28z) signaling domain was attached immediately after the transmembrane (TM) domain or after the C-terminus of either the I-Ab α or β chain. To facilitate surface expression, a peptide was added with a 16 a.a. flexible linker after the signal peptide in I-Abβ as previously described (13). To facilitate transduction of primary T cells, a tricistronic RV vector was generated with signal peptide-antigen peptide-linker-I-Abβ−28z-(GSG)P2A-I-Abα with an IRES-Thy1.1 (or mCherry) reporter. I-Ab α and β sequences were replaced for different MHC or HLA alleles. The disulfide trap was generated as described (26) with a cysteine a.a. after the peptide in the p9+2 position, or a glycine as a control. In some experiments, bcl2 (47) or FasΔDD (28) was added after the I-Abα with a (GSG)T2A sequence. Please refer to Fig. 1C and table S2.
RV production
RV was produced as previously described (48). Briefly, MigR1-based RV vectors were transfected into Phoenix-eco cell line using TransIT-293 (Thermo Fisher # MIR2700). Viral supernatant was collected after culturing cells at 32°C for 24hr.
In vitro NFAT-GFP hybridoma assay
For measuring pMHCII-CAR reactivity to TCR Tg T cells, NFAT-GFP hybridoma assays were performed as previously described (12). Briefly, hybridoma cells expressing GFP under an NFAT promotor were RV transduced with pMHCII-CAR vectors. RV transduced hybridoma cells (104) were cocultured for 2 days with primary target TCR T cells (2×10⁵) prior to assessment of GFP expression. As a positive control, wells were coated with 20 μg/ml anti-MHCII antibody (clone M5/114, BioXcell) or 20 μg/ml anti-HLA-DR (clone L243, BioXcell). For measuring sensitivity of cloned TCR to MOG35–55 peptide, TCRα chains were gene synthesized and retrovirally expressed on NFAT-GFP reporter hybridoma cells expressing the fixed TCRβ chain and murine CD4 (12, 17). 1×10⁴ TCR-expressing lines were cocultured for 2 days with 2.5×10⁴ flt3L-stimulated DCs in the presence of titrated concentrations of MOG35–55 peptide (0.25 – 20 μg/ml) prior to analyzing GFP expression. To assess interaction between the MOG pMHCII-CAR construct and MOG-specific TCRs, each 1×10⁴ MOG pMHCII-CAR expressing cell line and 1×10⁴ TCR-expressing line were cocultured for 2d prior to GFP measurement on TCR-expressing lines.
In vitro NFAT-GFP Jurkat assay
The NY-ESO-1-targeted TCR (15) was generously provided by Dr. Thomas Blankenstein (Max Delbrück Center for Molecular Medicine, Berlin, Germany). TRACKO/TRBCKO dual knockout Jurkat cells engineered to express an NFAT-GFP reporter (14) were engineered to express NY-ESO-1119–133 or MOG97–108 pMHCII(DR4)-CARs (15). Transduction efficiency was assessed by flow cytometry using an anti-DR4 antibody (BioLegend, Clone L243). In parallel, dual knockout Jurkat cells were engineered to express a transgenic TCR targeting NY-ESO-1119–133, and transduction efficiency was evaluated by flow cytometry using an anti-TCR constant chain antibody (Invitrogen clone WT31). Co-cultures were established at effector (CAR+) to target (TCR+) ratios of 1:4, and the GFP signal in CAR+ cells was assessed after 18 hours.
pMHCII-CAR T cell generation and transfer
FACS-purified CD44lo CD62Lhi naïve CD8 T cells (1×10⁶/well of 24 well plate) from CD45.1 C57BL/6 mice were activated in vitro with soluble 0.1μg/ml anti-CD3 (145-2C11) and 1μg/ml anti-CD28 (37.51) antibodies in plates coated with 18 μg/ml goat anti-hamster IgG (Jackson ImmunoResearch #127-005-099) in the presence of 1×10³ IU hIL-2. Twenty seven hrs after stimulation, cells were spinfected (37°C 1300g for 2h) with the indicated pMHCII-CAR RVs (1ml viral supernatant per each well) and subsequently cultured with 1×10³ IU/ml hIL-2 (Teceleukin, Hoffmann-La Roche) before use. Cells cultured for 2 additional days were used for depletion assays of target TCR Tg cells in vivo. Longer cultures for 4–6 additional days were conducted for EAE experiments. CAR T cell transfer was performed into mice without preconditioning by lymphodepletion or irradiation.
Depletion of TCR Tg target T cells in vivo
Congenically marked LN cells from TCR Tg mice (target TCR Tg T cells; 2 × 10⁵) were transferred retro-orbitally into hosts followed one day later by transfer of 2×10⁵ pMHCII-CAR T cells. After 5–7 more days, the frequency of remaining TCR Tg cells in the mesenteric lymph nodes was assessed by flow cytometry. For normalizing 2D2 target survival in depletion experiments with MOG-pMHCII CAR T cells, equal numbers (2 × 10⁵) of OTII cells were transferred.
EAE induction and clinical score assessment
Active EAE was induced as previously described (49). Briefly, mice were subcutaneously injected with 200 μg of MOG35–55 peptide emulsified in complete Freund’s adjuvant, and intraperitoneally injected with 200ng Pertussis Toxin. After 48hrs, mice received a second dose of Pertussis Toxin. To assess potential side effect of CAR T treatment, mice were treated with 100μg of MOG35–55 peptide and 300ng Pertussis Toxin in Fig. 5G and H for less severe clinical phenotype (32). Mice were observed daily, and clinical score was assessed with five point scoring system: 0 = no disease, 1 = limp tail, 2 = mild hind limb paresis, 3 = severe hind limb paresis, 4 = complete hind limb plegia or quadriplegia, 5 = moribund or dead.
CNS cell preparation for flow cytometric analysis
CNS cell preparation was performed as previously described (50). Briefly, mice were perfused with 25–30ml of cold PBS prior to isolation of CNS tissue. Mononuclear cells were purified separately from homogenized brains and spinal cords by centrifugation for 30 min in 30% Percoll (GE Healthcare) solution.
Antibodies and flow cytometry
Isolated cells were washed with PBS containing 1% FBS and 0.05% sodium azide (VWR), stained with fluorochrome-conjugated antibodies to together with propidium iodide (Life technology) to eliminate dead cells. Fluorescently conjugated antibodies (table S3) were purchased from BioLegend, Invitrogen, and Becton Dickinson. For detection of MOG-specific CD4 T cells, CNS cells were stained for 1 hr at room temperature with mixture of fluorochrome-conjugated antibodies and IA(b)/ GWYRSPFSRVVH APC-labeled tetramer (NIH Tetramer Core Facility) prepared in 10% FBS DMEM media. Samples were analyzed using a FACSAria IIu (Becton Dickinson), and data were processed with FlowJo 10 (Treestar).
TCR sequencing and data analysis
T cells were isolated from peripheral LN (PLN: cervical, axillary, brachial, and inguinal LNs) or CNS of TCli TCRβ Tcra+/− Foxp3IRES-GFP mice. TCR sequencing was performed as previously described (18). After TCRα cDNA was synthesized from sorted T cells (17), amplification was performed using a multiplex PCR (18). MiSeq (250 paired end reads) sequencing data of T cell populations from individual mice were analyzed via dada2 (51) without bimera filtering to identify amplicon sequence variants and reduce noise due to sequencing errors. TCR sequences were parsed as before to identify the TRAV and CDR3 amino acid sequence which together are used to designate a unique TCR (18). TCR repertoires were analyzed in R using Phyloseq, DESeq2, and Vegan (table S4). Candidate MOG35–55 specific TCRs were selected and gene-synthesized for further investigations. High frequency candidate TCRs both from in vitro expansion and PLN/CNS of immunized mice were selected. Low frequency candidate TCRs were identified by differentially induced TCR analysis using DESeq2. est. EC50 values calculated by in vitro NFAT-GFP hybridoma assays with RV transduced TCRs were used to corelate affinities and frequencies in the TCR repertoire analysis.
Statistical analysis
Mean and SEM values were calculated by using Prism 9 (GraphPad, table S4). Statistical significance was typically determined by unpaired Student’s t test or by one-way ANOVA followed by Holm-Sidak multiple-comparison testing. For comparing TCR frequencies, which are not normally distributed, Kruskal-Wallis testing was performed. In vitro assays were analyzed by nested Student’s t-test or nested one-way ANOVA. Repeated measures ANOVA was used for EAE scores over time as indicated. The number of biological replicates, independent experiments (expt.), and statistical tests are indicated in figure legends. P values less than 0.05 were considered significant.
Supplementary Material
Acknowledgements:
The following reagent was obtained through the NIH Tetramer Core Facility: IA(b)/ GWYRSPFSRVVH APC-labeled tetramer. We would like to thank T. Bigley and M. Paley (Washington University in St. Louis) for critical reading of the manuscript.
Funding:
This study was supported by R01-AI07987 and the Wolff Professorship (C.S.H), NINDS (R01NS106289) and the National Multiple Sclerosis Society (RG-1802-30253) (G.F.W.), and NCI (K08CA237740) (N.S.), and the National Multiple Sclerosis Society (RG-2111-38724) (B.T.E.).
Footnotes
Conflicts of Interests: The authors declare no conflict of interest.
Data and Materials availability:
TCR sequencing data have been deposited at European Nucleotide Archive (ENA) and publicly available under accession number PRJEB53445. pMHCII-CAR and TCR expression plasmids are available upon request via MTA with Washington University in St. Louis. All data needed to evaluate the conclusions of the paper are present in the paper or the Supplementary Materials.
References
- 1.Zamvil SS, Mitchell DJ, Moore AC, Kitamura K, Steinman L, Rothbard JB, T-cell epitope of the autoantigen myelin basic protein that induces encephalomyelitis. Nature 324, 258–260 (1986). [DOI] [PubMed] [Google Scholar]
- 2.Varrin-Doyer M, Shetty A, Spencer CM, Schulze-Topphoff U, Weber MS, Bernard CC, Forsthuber T, Cree BA, Slavin AJ, Zamvil SS, MOG transmembrane and cytoplasmic domains contain highly stimulatory T-cell epitopes in MS. Neurol Neuroimmunol Neuroinflamm 1, e20 (2014). [DOI] [PMC free article] [PubMed] [Google Scholar]
- 3.Hur EM, Youssef S, Haws ME, Zhang SY, Sobel RA, Steinman L, Osteopontin-induced relapse and progression of autoimmune brain disease through enhanced survival of activated T cells. Nat Immunol 8, 74–83 (2007). [DOI] [PubMed] [Google Scholar]
- 4.Savage PA, Boniface JJ, Davis MM, A kinetic basis for T cell receptor repertoire selection during an immune response. Immunity 10, 485–492 (1999). [DOI] [PubMed] [Google Scholar]
- 5.Price DA, Brenchley JM, Ruff LE, Betts MR, Hill BJ, Roederer M, Koup RA, Migueles SA, Gostick E, Wooldridge L, Sewell AK, Connors M, Douek DC, Avidity for antigen shapes clonal dominance in CD8+ T cell populations specific for persistent DNA viruses. J Exp Med 202, 1349–1361 (2005). [DOI] [PMC free article] [PubMed] [Google Scholar]
- 6.Sabatino JJ Jr., Shires J, Altman JD, Ford ML, Evavold BD, Loss of IFN-gamma enables the expansion of autoreactive CD4+ T cells to induce experimental autoimmune encephalomyelitis by a nonencephalitogenic myelin variant antigen. J Immunol 180, 4451–4457 (2008). [DOI] [PubMed] [Google Scholar]
- 7.Nelson RW, Beisang D, Tubo NJ, Dileepan T, Wiesner DL, Nielsen K, Wuthrich M, Klein BS, Kotov DI, Spanier JA, Fife BT, Moon JJ, Jenkins MK, T cell receptor cross-reactivity between similar foreign and self peptides influences naive cell population size and autoimmunity. Immunity 42, 95–107 (2015). [DOI] [PMC free article] [PubMed] [Google Scholar]
- 8.Sabatino JJ Jr., Huang J, Zhu C, Evavold BD, High prevalence of low affinity peptide-MHC II tetramer-negative effectors during polyclonal CD4+ T cell responses. J Exp Med 208, 81–90 (2011). [DOI] [PMC free article] [PubMed] [Google Scholar]
- 9.Rosenthal KM, Edwards LJ, Sabatino JJ Jr., Hood JD, Wasserman HA, Zhu C, Evavold BD, Low 2-dimensional CD4 T cell receptor affinity for myelin sets in motion delayed response kinetics. PLoS One 7, e32562 (2012). [DOI] [PMC free article] [PubMed] [Google Scholar]
- 10.Joglekar AV, Leonard MT, Jeppson JD, Swift M, Li G, Wong S, Peng S, Zaretsky JM, Heath JR, Ribas A, Bethune MT, Baltimore D, T cell antigen discovery via signaling and antigen-presenting bifunctional receptors. Nat Methods 16, 191–198 (2019). [DOI] [PMC free article] [PubMed] [Google Scholar]
- 11.Starwalt SE, Masteller EL, Bluestone JA, Kranz DM, Directed evolution of a single-chain class II MHC product by yeast display. Protein Eng 16, 147–156 (2003). [DOI] [PubMed] [Google Scholar]
- 12.Lathrop SK, Bloom SM, Rao SM, Nutsch K, Lio CW, Santacruz N, Peterson DA, Stappenbeck TS, Hsieh CS, Peripheral education of the immune system by colonic commensal microbiota. Nature 478, 250–254 (2011). [DOI] [PMC free article] [PubMed] [Google Scholar]
- 13.Cunliffe SL, Wyer JR, Sutton JK, Lucas M, Harcourt G, Klenerman P, McMichael AJ, Kelleher AD, Optimization of peptide linker length in production of MHC class II/peptide tetrameric complexes increases yield and stability, and allows identification of antigen-specific CD4+T cells in peripheral blood mononuclear cells. Eur J Immunol 32, 3366–3375 (2002). [DOI] [PubMed] [Google Scholar]
- 14.Jutz S, Leitner J, Schmetterer K, Doel-Perez I, Majdic O, Grabmeier-Pfistershammer K, Paster W, Huppa JB, Steinberger P, Assessment of costimulation and coinhibition in a triple parameter T cell reporter line: Simultaneous measurement of NF-kappaB, NFAT and AP-1. J Immunol Methods 430, 10–20 (2016). [DOI] [PubMed] [Google Scholar]
- 15.Poncette L, Chen X, Lorenz FK, Blankenstein T, Effective NY-ESO-1-specific MHC II-restricted T cell receptors from antigen-negative hosts enhance tumor regression. J Clin Invest 129, 324–335 (2019). [DOI] [PMC free article] [PubMed] [Google Scholar]
- 16.Lee HM, Bautista JL, Scott-Browne J, Mohan JF, Hsieh CS, A broad range of self-reactivity drives thymic regulatory T cell selection to limit responses to self. Immunity 37, 475–486 (2012). [DOI] [PMC free article] [PubMed] [Google Scholar]
- 17.Chai JN, Peng Y, Rengarajan S, Solomon BD, Ai TL, Shen Z, Perry JSA, Knoop KA, Tanoue T, Narushima S, Honda K, Elson CO, Newberry RD, Stappenbeck TS, Kau AL, Peterson DA, Fox JG, Hsieh CS, Helicobacter species are potent drivers of colonic T cell responses in homeostasis and inflammation. Sci Immunol 2, (2017). [DOI] [PMC free article] [PubMed] [Google Scholar]
- 18.Russler-Germain EV, Jung J, Miller AT, Young S, Yi J, Wehmeier A, Fox LE, Monte KJ, Chai JN, Kulkarni DH, Funkhouser-Jones LJ, Wilke G, Durai V, Zinselmeyer BH, Czepielewski RS, Greco S, Murphy KM, Newberry RD, Sibley LD, Hsieh CS, Commensal Cryptosporidium colonization elicits a cDC1-dependent Th1 response that promotes intestinal homeostasis and limits other infections. Immunity 54, 2547–2564 e2547 (2021). [DOI] [PMC free article] [PubMed] [Google Scholar]
- 19.Koehli S, Naeher D, Galati-Fournier V, Zehn D, Palmer E, Optimal T-cell receptor affinity for inducing autoimmunity. Proc Natl Acad Sci U S A 111, 17248–17253 (2014). [DOI] [PMC free article] [PubMed] [Google Scholar]
- 20.Zehn D, Bevan MJ, T cells with low avidity for a tissue-restricted antigen routinely evade central and peripheral tolerance and cause autoimmunity. Immunity 25, 261–270 (2006). [DOI] [PMC free article] [PubMed] [Google Scholar]
- 21.Sinai P, Dozmorov IM, Song R, Schwartzberg PL, Wakeland EK, Wulfing C, T/B-cell interactions are more transient in response to weak stimuli in SLE-prone mice. Eur J Immunol 44, 3522–3531 (2014). [DOI] [PMC free article] [PubMed] [Google Scholar]
- 22.Robertson JM, Jensen PE, Evavold BD, DO11.10 and OT-II T cells recognize a C-terminal ovalbumin 323–339 epitope. J Immunol 164, 4706–4712 (2000). [DOI] [PubMed] [Google Scholar]
- 23.Kobayashi S, Thelin MA, Parrish HL, Deshpande NR, Lee MS, Karimzadeh A, Niewczas MA, Serwold T, Kuhns MS, A biomimetic five-module chimeric antigen receptor ((5M)CAR) designed to target and eliminate antigen-specific T cells. Proc Natl Acad Sci U S A 117, 28950–28959 (2020). [DOI] [PMC free article] [PubMed] [Google Scholar]
- 24.Bettelli E, Pagany M, Weiner HL, Linington C, Sobel RA, Kuchroo VK, Myelin oligodendrocyte glycoprotein-specific T cell receptor transgenic mice develop spontaneous autoimmune optic neuritis. J Exp Med 197, 1073–1081 (2003). [DOI] [PMC free article] [PubMed] [Google Scholar]
- 25.Jager A, Dardalhon V, Sobel RA, Bettelli E, Kuchroo VK, Th1, Th17, and Th9 effector cells induce experimental autoimmune encephalomyelitis with different pathological phenotypes. J Immunol 183, 7169–7177 (2009). [DOI] [PMC free article] [PubMed] [Google Scholar]
- 26.Stadinski BD, Zhang L, Crawford F, Marrack P, Eisenbarth GS, Kappler JW, Diabetogenic T cells recognize insulin bound to IAg7 in an unexpected, weakly binding register. Proc Natl Acad Sci U S A 107, 10978–10983 (2010). [DOI] [PMC free article] [PubMed] [Google Scholar]
- 27.Karlsson H, Lindqvist AC, Fransson M, Paul-Wetterberg G, Nilsson B, Essand M, Nilsson K, Frisk P, Jernberg-Wiklund H, Loskog A, Combining CAR T cells and the Bcl-2 family apoptosis inhibitor ABT-737 for treating B-cell malignancy. Cancer Gene Ther 20, 386–393 (2013). [DOI] [PubMed] [Google Scholar]
- 28.Yamamoto TN, Lee PH, Vodnala SK, Gurusamy D, Kishton RJ, Yu Z, Eidizadeh A, Eil R, Fioravanti J, Gattinoni L, Kochenderfer JN, Fry TJ, Aksoy BA, Hammerbacher JE, Cruz AC, Siegel RM, Restifo NP, Klebanoff CA, T cells genetically engineered to overcome death signaling enhance adoptive cancer immunotherapy. J Clin Invest 129, 1551–1565 (2019). [DOI] [PMC free article] [PubMed] [Google Scholar]
- 29.Riera L, Gariglio M, Pagano M, Gaiola O, Simon MM, Landolfo S, Control of murine cytomegalovirus replication in salivary glands during acute infection is independent of the Fas ligand/Fas system. New Microbiol 24, 231–238 (2001). [PubMed] [Google Scholar]
- 30.Karray S, Kress C, Cuvellier S, Hue-Beauvais C, Damotte D, Babinet C, Levi-Strauss M, Complete loss of Fas ligand gene causes massive lymphoproliferation and early death, indicating a residual activity of gld allele. J Immunol 172, 2118–2125 (2004). [DOI] [PubMed] [Google Scholar]
- 31.Gust J, Ponce R, Liles WC, Garden GA, Turtle CJ, Cytokines in CAR T Cell-Associated Neurotoxicity. Front Immunol 11, 577027 (2020). [DOI] [PMC free article] [PubMed] [Google Scholar]
- 32.Lin CC, Bradstreet TR, Schwarzkopf EA, Sim J, Carrero JA, Chou C, Cook LE, Egawa T, Taneja R, Murphy TL, Russell JH, Edelson BT, Bhlhe40 controls cytokine production by T cells and is essential for pathogenicity in autoimmune neuroinflammation. Nat Commun 5, 3551 (2014). [DOI] [PMC free article] [PubMed] [Google Scholar]
- 33.Wong P, Goldrath AW, Rudensky AY, Competition for specific intrathymic ligands limits positive selection in a TCR transgenic model of CD4+ T cell development. J Immunol 164, 6252–6259 (2000). [DOI] [PubMed] [Google Scholar]
- 34.Kieback E, Hilgenberg E, Stervbo U, Lampropoulou V, Shen P, Bunse M, Jaimes Y, Boudinot P, Radbruch A, Klemm U, Kuhl AA, Liblau R, Hoevelmeyer N, Anderton SM, Uckert W, Fillatreau S, Thymus-Derived Regulatory T Cells Are Positively Selected on Natural Self-Antigen through Cognate Interactions of High Functional Avidity. Immunity 44, 1114–1126 (2016). [DOI] [PubMed] [Google Scholar]
- 35.Whittington KB, Prislovsky A, Beaty J, Albritton L, Radic M, Rosloniec EF, CD8(+) T Cells Expressing an HLA-DR1 Chimeric Antigen Receptor Target Autoimmune CD4(+) T Cells in an Antigen-Specific Manner and Inhibit the Development of Autoimmune Arthritis. J Immunol, (2021). [DOI] [PMC free article] [PubMed] [Google Scholar]
- 36.Akkaya B, Oya Y, Akkaya M, Al Souz J, Holstein AH, Kamenyeva O, Kabat J, Matsumura R, Dorward DW, Glass DD, Shevach EM, Regulatory T cells mediate specific suppression by depleting peptide-MHC class II from dendritic cells. Nat Immunol 20, 218–231 (2019). [DOI] [PMC free article] [PubMed] [Google Scholar]
- 37.Klawon DEJ, Gilmore DC, Leonard JD, Miller CH, Chao JL, Walker MT, Duncombe RK, Tung KS, Adams EJ, Savage PA, Altered selection on a single self-ligand promotes susceptibility to organ-specific T cell infiltration. J Exp Med 218, (2021). [DOI] [PMC free article] [PubMed] [Google Scholar]
- 38.Schober K, Voit F, Grassmann S, Muller TR, Eggert J, Jarosch S, Weissbrich B, Hoffmann P, Borkner L, Nio E, Fanchi L, Clouser CR, Radhakrishnan A, Mihatsch L, Luckemeier P, Leube J, Dossinger G, Klein L, Neuenhahn M, Oduro JD, Cicin-Sain L, Buchholz VR, Busch DH, Reverse TCR repertoire evolution toward dominant low-affinity clones during chronic CMV infection. Nat Immunol 21, 434–441 (2020). [DOI] [PubMed] [Google Scholar]
- 39.Martinez RJ, Andargachew R, Martinez HA, Evavold BD, Low-affinity CD4+ T cells are major responders in the primary immune response. Nat Commun 7, 13848 (2016). [DOI] [PMC free article] [PubMed] [Google Scholar]
- 40.van den Elzen P, Menezes JS, Ametani A, Maverakis E, Madakamutil L, Tang XL, Kumar V, Sercarz EE, Limited clonality in autoimmunity: drivers and regulators. Autoimmun Rev 3, 524–529 (2004). [DOI] [PubMed] [Google Scholar]
- 41.Fu W, Wojtkiewicz G, Weissleder R, Benoist C, Mathis D, Early window of diabetes determinism in NOD mice, dependent on the complement receptor CRIg, identified by noninvasive imaging. Nat Immunol 13, 361–368 (2012). [DOI] [PMC free article] [PubMed] [Google Scholar]
- 42.Regnell SE, Lernmark A, Early prediction of autoimmune (type 1) diabetes. Diabetologia 60, 1370–1381 (2017). [DOI] [PMC free article] [PubMed] [Google Scholar]
- 43.Leslie D, Lipsky P, Notkins AL, Autoantibodies as predictors of disease. J Clin Invest 108, 1417–1422 (2001). [DOI] [PMC free article] [PubMed] [Google Scholar]
- 44.Arbuckle MR, McClain MT, Rubertone MV, Scofield RH, Dennis GJ, James JA, Harley JB, Development of autoantibodies before the clinical onset of systemic lupus erythematosus. N Engl J Med 349, 1526–1533 (2003). [DOI] [PubMed] [Google Scholar]
- 45.Hutfless S, Matos P, Talor MV, Caturegli P, Rose NR, Significance of prediagnostic thyroid antibodies in women with autoimmune thyroid disease. J Clin Endocrinol Metab 96, E1466–1471 (2011). [DOI] [PMC free article] [PubMed] [Google Scholar]
- 46.Kappos L, Wolinsky JS, Giovannoni G, Arnold DL, Wang Q, Bernasconi C, Model F, Koendgen H, Manfrini M, Belachew S, Hauser SL, Contribution of Relapse-Independent Progression vs Relapse-Associated Worsening to Overall Confirmed Disability Accumulation in Typical Relapsing Multiple Sclerosis in a Pooled Analysis of 2 Randomized Clinical Trials. JAMA Neurol 77, 1132–1140 (2020). [DOI] [PMC free article] [PubMed] [Google Scholar]
- 47.Wang H, Han P, Qi X, Li F, Li M, Fan L, Zhang H, Zhang X, Yang X, Bcl-2 Enhances Chimeric Antigen Receptor T Cell Persistence by Reducing Activation-Induced Apoptosis. Cancers (Basel) 13, (2021). [DOI] [PMC free article] [PubMed] [Google Scholar]
- 48.Pear WS, Nolan GP, Scott ML, Baltimore D, Production of high-titer helper-free retroviruses by transient transfection. Proc Natl Acad Sci U S A 90, 8392–8396 (1993). [DOI] [PMC free article] [PubMed] [Google Scholar]
- 49.Wu GF, Shindler KS, Allenspach EJ, Stephen TL, Thomas HL, Mikesell RJ, Cross AH, Laufer TM, Limited sufficiency of antigen presentation by dendritic cells in models of central nervous system autoimmunity. J Autoimmun 36, 56–64 (2011). [DOI] [PMC free article] [PubMed] [Google Scholar]
- 50.Parker Harp CR, Archambault AS, Cheung M, Williams JW, Czepielewski RS, Duncker PC, Kilgore AJ, Miller AT, Segal BM, Kim AHJ, Randolph GJ, Wu GF, Neutrophils promote VLA-4-dependent B cell antigen presentation and accumulation within the meninges during neuroinflammation. Proc Natl Acad Sci U S A 116, 24221–24230 (2019). [DOI] [PMC free article] [PubMed] [Google Scholar]
- 51.Callahan BJ, McMurdie PJ, Rosen MJ, Han AW, Johnson AJ, Holmes SP, DADA2: High-resolution sample inference from Illumina amplicon data. Nat Methods 13, 581–583 (2016). [DOI] [PMC free article] [PubMed] [Google Scholar]
- 52.Cho YL, Flossdorf M, Kretschmer L, Hofer T, Busch DH, Buchholz VR, TCR Signal Quality Modulates Fate Decisions of Single CD4(+) T Cells in a Probabilistic Manner. Cell Rep 20, 806–818 (2017). [DOI] [PubMed] [Google Scholar]
Associated Data
This section collects any data citations, data availability statements, or supplementary materials included in this article.
Supplementary Materials
Data Availability Statement
TCR sequencing data have been deposited at European Nucleotide Archive (ENA) and publicly available under accession number PRJEB53445. pMHCII-CAR and TCR expression plasmids are available upon request via MTA with Washington University in St. Louis. All data needed to evaluate the conclusions of the paper are present in the paper or the Supplementary Materials.