

SUMMARY
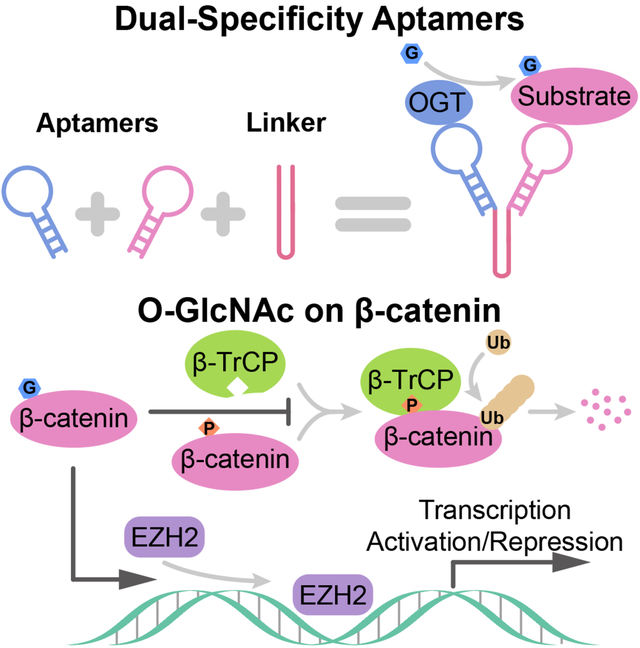
O-GlcNAc is a dynamic post-translational modification (PTM) that regulates protein functions. In studying the regulatory roles of O-GlcNAc, a major roadblock is the inability to change O-GlcNAcylation on a single protein at a time. Herein, we developed a dual RNA aptamer based approach that simultaneously targeted O-GlcNAc transferase (OGT) and β-catenin, the key transcription factor of the Wnt signaling pathway, to selectively increase O-GlcNAcylation of the latter without affecting other OGT substrates. Using the OGT/β-catenin dual-specificity aptamers, we found that O-GlcNAcylation of β-catenin stabilizes the protein by inhibiting its interaction with β-TrCP. O-GlcNAc also increases β-catenin’s interaction with EZH2, recruits EZH2 to promoters and dramatically alters the transcriptome. Further, by coupling riboswitches or an inducible expression system to aptamers, we enabled inducible regulation of protein-specific O-GlcNAcylation. Together, our findings demonstrate the efficacy and versatility of dual-specificity aptamers for regulating O-GlcNAcylation on individual proteins.
Graphical Abstract
In Brief
Zhu and Hart report the development of dual-specificity RNA aptamers for altering O-GlcNAcylation of specific proteins; this work provides a versatile tool kit for studying an elusive post-translational modification.
INTRODUCTION
O-linked β-N-acetylglucosamine (O-GlcNAc) is a post-translational modification (PTM) attached to serine and threonine residues of more than 8,000 human nucleocytoplasmic proteins1–3. O-GlcNAc is a highly dynamic PTM which is actively added and removed by two enzymes: O-GlcNAc transferase (OGT) and O-GlcNAcase (OGA), respectively4–7. As a fast-cycling, nutrient-sensitive PTM, O-GlcNAc regulates many signaling events, interplays with phosphorylation, and regulates protein functions such as intermolecular interactions and degradation. Abnormal O-GlcNAcylation is associated with many human diseases, including cancer and diabetes8.
With current approaches, it is difficult to study the biological functions of O-GlcNAc on a specific protein. OGT and OGA are the sole O-GlcNAc modifying enzymes, any chemical inhibitors or genetic approaches targeting them change O-GlcNAcylation on thousands of proteins simultaneously. O-GlcNAc and phosphate frequently modify the same or proximal sites in a mutually exclusive way. This crosstalk makes studies that use site-directed mutagenesis to convert serine or threonine to other non-modifiable residues difficult to interpret. Moreover, there is no amino acid mimic of O-GlcNAcylation, as there is for phosphorylation. The lack of tools to modify O-GlcNAcylation of a single protein without affecting the many others in the cell has substantially impeded our understanding of the functions of this ubiquitous and essential modification.
To address this problem, Pratt and others have used expressed protein ligation to study O-GlcNAc modified proteins in vitro9,10. In this method, a chemically synthesized, O-GlcNAc modified peptide is ligated to bacterial expressed, unmodified protein portions to generate a full-length protein with O-GlcNAc on certain sites. Proteins produced in this method are completely modified at defined sites but can only be used for in vitro assays. It also requires cysteine residues at the ligation sites. Woo and colleagues used nanobody-tagged OGT or OGA constructs to selectively modify O-GlcNAcylation of target proteins in cells11,12. However, the tight and stable binding of these antibodies to the target proteins make sorting out the biological effects of altered O-GlcNAcylation from the effects of the antibody binding difficult.
Wnt signaling plays essential roles in the regulation of cell proliferation, differentiation, and self-renewal of stem cells. Its abnormalities occur in many types of cancer and inheritable disorders13,14. β-catenin is the key transcription factor in the canonical Wnt signaling pathway. Its functions are regulated by PTMs. In resting cells, β-catenin maintains a low abundance due to the consecutive phosphorylation, ubiquitination, and degradation15,16. Wnt signaling triggers a cascade of events that ultimately stabilizes β-catenin by inhibiting its ubiquitination, causing its nuclear accumulation and activation of downstream genes17. Besides phosphorylation and ubiquitination, the functions of β-catenin are regulated by PTMs including O-GlcNAcylation18.
Here, we developed an RNA-based method that induces protein-specific O-GlcNAcylation under endogenous levels of OGT and OGA, and studied how O-GlcNAc regulates β-catenin. Dual-specificity (DS) aptamers are modular designed RNA that connect two aptamer motifs with a linker domain. In cells, they induce proximity between OGT and a designated protein, and increase O-GlcNAcylation on the substrate. These RNA aptamers have short half-lives in cells and their binding can be controlled by riboswitches. Using DS aptamers, we induced O-GlcNAcylation on GFP-tagged and endogenous proteins and studied the regulatory roles of O-GlcNAc on β-catenin. O-GlcNAc regulates the interactions between β-catenin and a variety of proteins, including the E3 ubiquitin ligase β-TrCP, and the epigenetic modifiers EZH2, KAT2A, KAT5 and EP300. Particularly, O-GlcNAcylated β-catenin recruits EZH2 to promoters and shifts the transcriptome in a Wnt-dependent manner. Finally, by coupling riboswitches, or a Tet-On inducible expression system to DS aptamers, we deployed DS aptamers for inducible regulation of O-GlcNAcylation. Beyond O-GlcNAc, DS aptamers also provide us programable tools for the regulation of other PTMs and interactions in a cell.
RESULTS
A Noninhibiting RNA Aptamer Targeting ncOGT Was Generated From SELEX
Discovered in 1990, aptamers are short, single-stranded DNA or RNA molecules that bind targets with high affinity and specificity. They have been selected to bind a wide variety of targets from metal ions, small organic molecules, proteins to whole cells19–22. Aptamers are generated from the in vitro selection named Systematic Evolution of Ligands by EXponential enrichment (SELEX, Figure 1A), which is an iterative binding, partitioning and amplification process.
Figure 1. A Noninhibiting RNA Aptamer Targeting ncOGT Was Generated From SELEX.
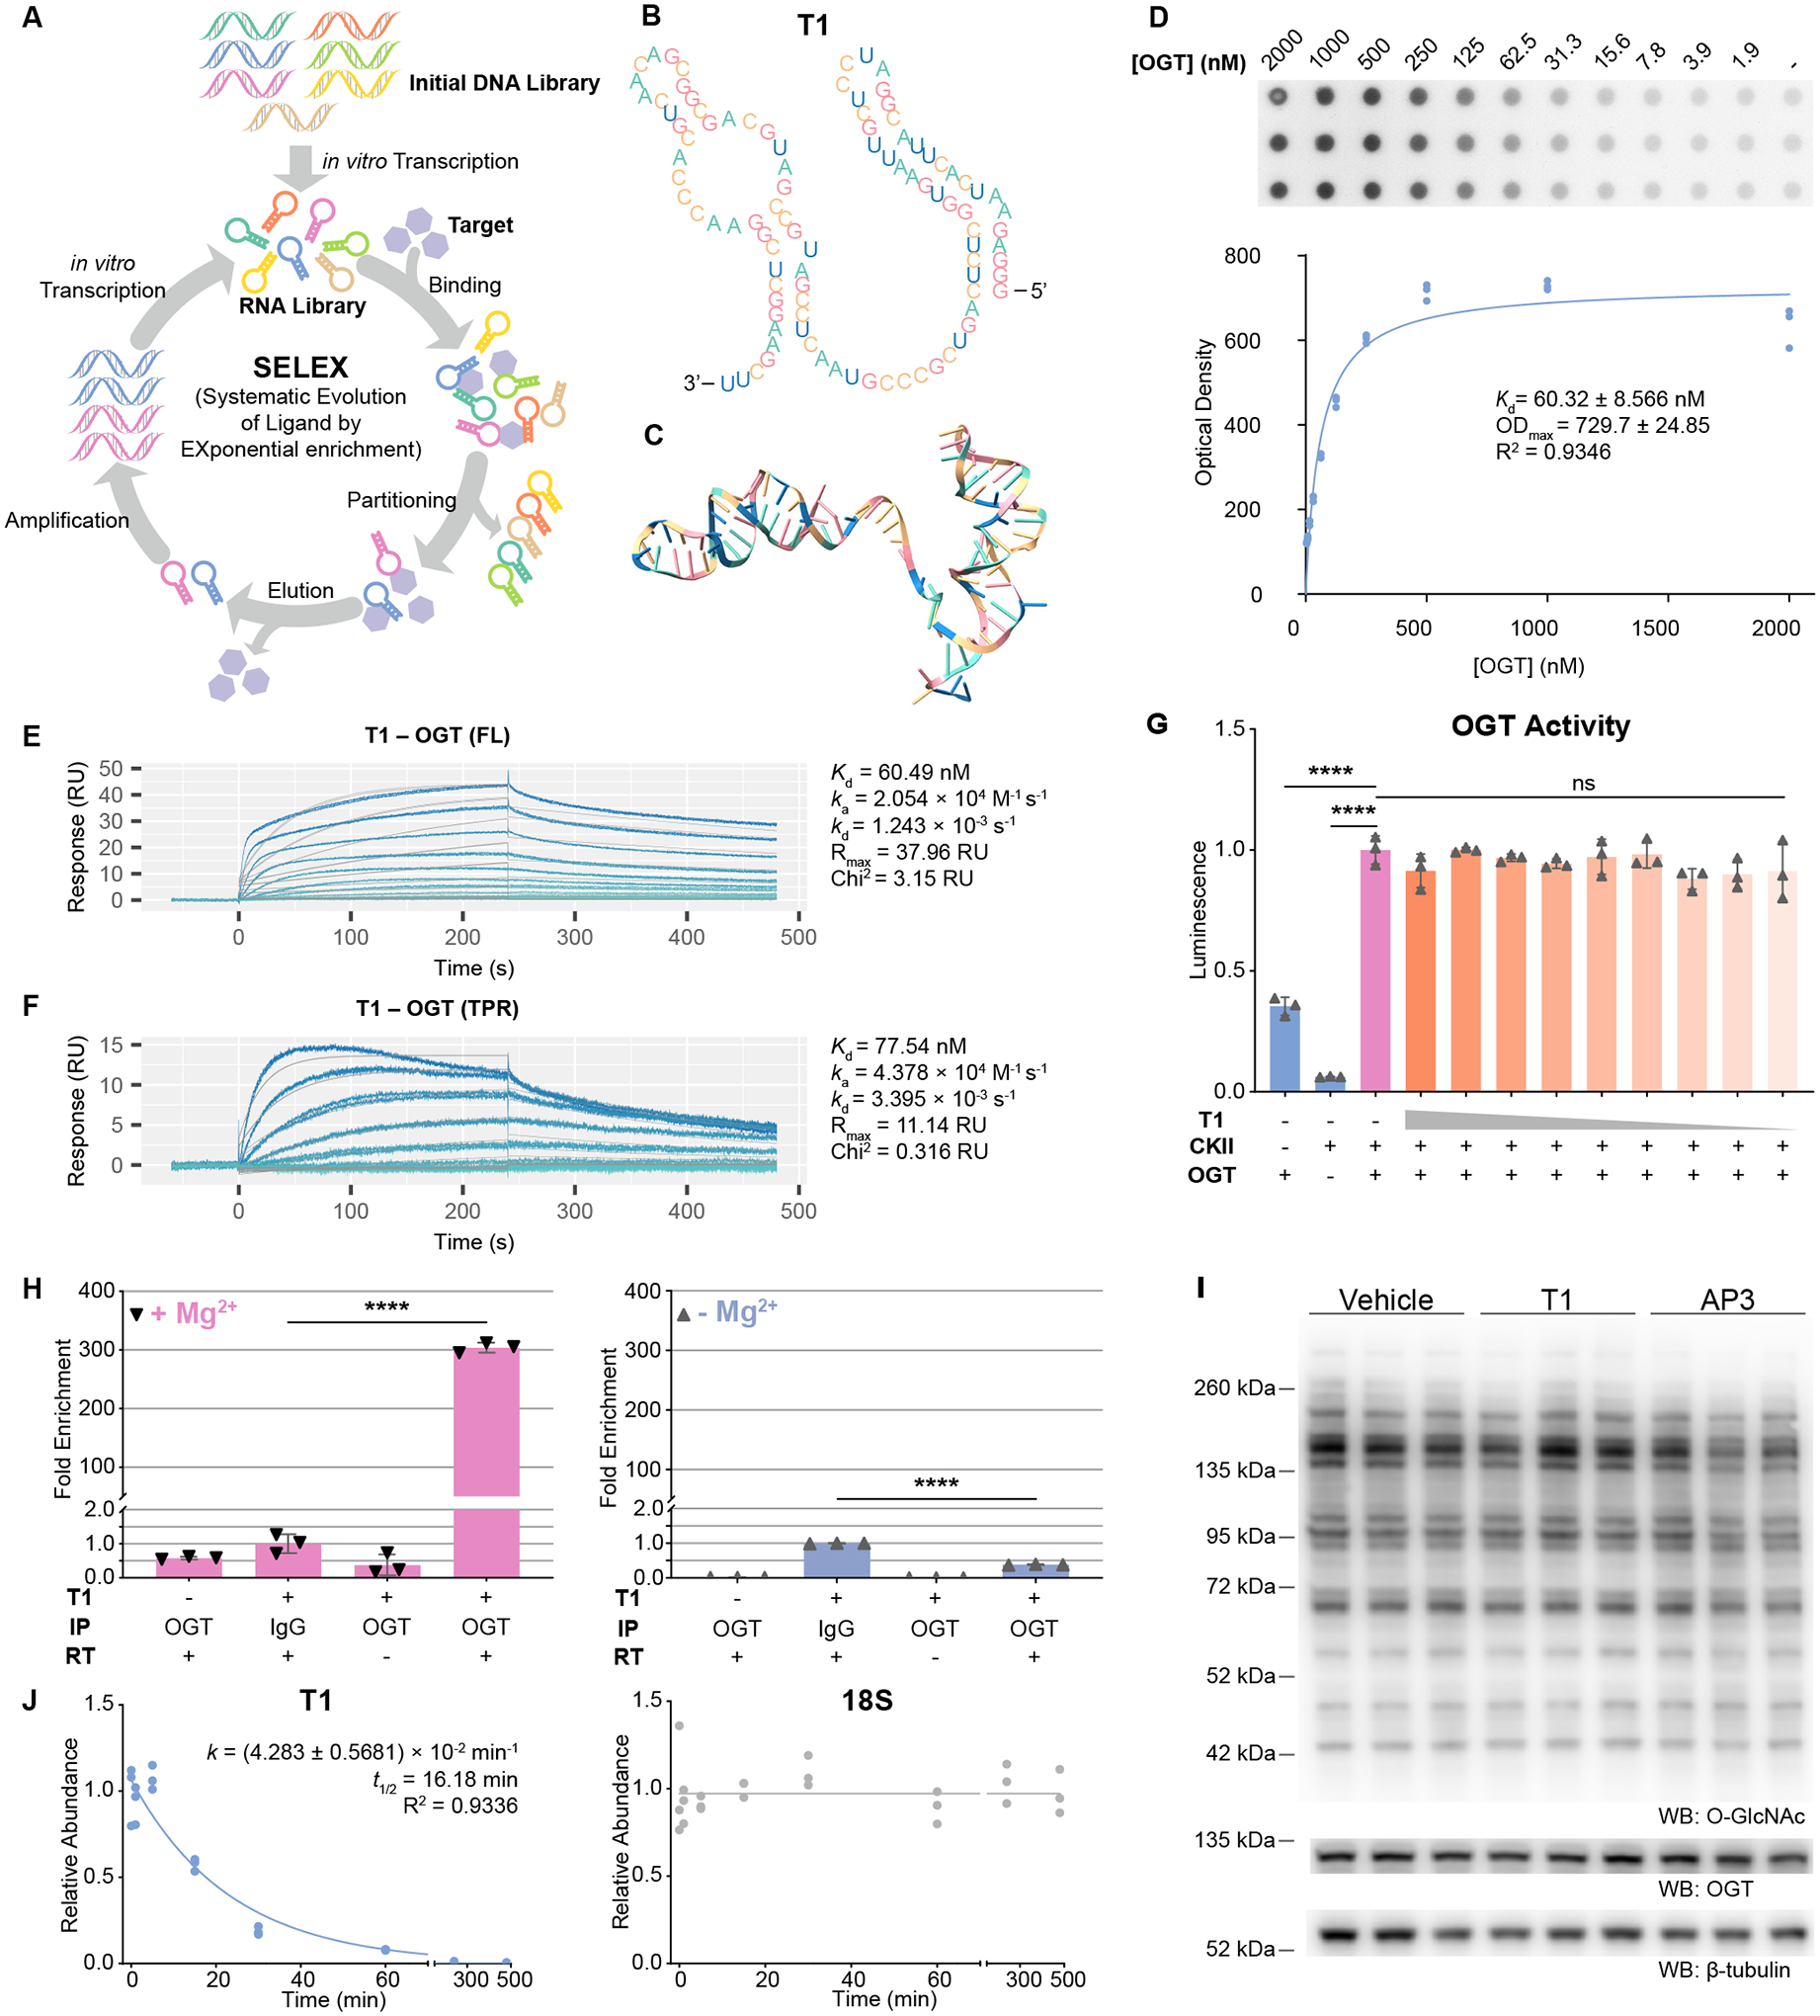
(A) Schematic of SELEX.
(B) and (C) Predicted secondary (B) and tertiary (C) structures of T1. Nucleotides in the two panels are color coded in the same way.
(D) Radiolabeled Dot-Blot Assay measuring the binding affinity of T1 to full-length ncOGT. Data are fitted to a Michaelis-Menten model (curve).
(E) and (F) Surface Plasmon Resonance (SPR) characterizing the binding affinity and kinetics of T1 to full-length ncOGT (E), and to the TPR domain (F). Sensorgrams represent OGT concentrations from 1 μM to 977 pM (E) or 1 μM to 488 pM (F), in 2× serial dilutions. Data are fitted to a 1:1 binding model.
(G) UDP-Glo assay of OGT activity in the presence of T1. T1 was included in the indicated reactions (orange) from 2 μM to 7.8 nM in 2× serial dilution. Data are normalized to the positive control reaction (red). N=3.
(H) RNA-IP and RT-qPCR quantification of OGT-bound T1 in cells. OGT was immunoprecipitated from T1-expressing cells, using buffers with Mg2+ (left panel) or without Mg2+ (right panel). Then OGT-bound T1 was quantified by RT-qPCR. Data are normalized to the IgG groups. RT – Reverse Transcriptase. N=3.
(I). Western Blot (WB) analysis of global O-GlcNAcylation in HEK293T cells expressing T1 or AP3. N=3.
(J) Pulse-chase experiments on the half-life of T1 in cells. Cells stably expressing T1 were treated with ActD for the indicated periods. Abundance of T1 was quantified by RT-qPCR (left panel) and normalized to that of 18S rRNA (right panel) and initial timepoint (T=0). Data are fitted to a one-phase decay model (curve). N=3.
One-way ANOVA test in (G), (H). Data are represented as mean ± SD. ns, p ≥ 0.05; ****, p < 0.0001.
To regulate O-GlcNAcylation with DS aptamers, it is a prerequisite that we have a noninhibiting RNA aptamer targeting the nucleocytoplasmic isoform of OGT (ncOGT). Therefore, SELEX was performed. To generate aptamers that bind the non-catalytic domain of OGT, we switched the targets of SELEX between the full-length ncOGT and its tetratricopeptide repeat (TPR) domain (STAR Methods)23. After 11 rounds of SELEX, the sequence T1 was highly enriched in the final RNA library (Figures 1B, 1C).
We validated T1 as a noninhibiting aptamer targeting ncOGT in vitro. Binding between T1 and ncOGT was confirmed in Radiolabeled Dot-Blot Assays (Figure 1D), and further characterized in Surface Plasmon Resonance (SPR) (Figure 1E). In both experiments, the dissociation constant (Kd) was measured to be ~60 nM. SPR also shows that T1 recognizes the TPR domain of ncOGT (Figure 1F). To study if T1 inhibits the activity of the enzyme, we performed UDP-Glo OGT activity assays (Figure 1G). No inhibition was observed when T1 was included in the reactions from 7.8 nM to 2 μM, which was ~ 33 times higher than the Kd.
We further validated T1 in living cells. The binding between T1 and OGT in HEK293T cells was confirmed in RNA-IP experiments (Figure 1H). When expressed in cells, T1 was highly enriched on immunoprecipitated OGT protein. This binding requires Mg2+. In RNA-IP reactions containing no Mg2+, T1 was no longer enriched on OGT. The divalent Mg2+ ion facilitates RNA folding by shielding the negative charges on the RNA backbone24,25, and Mg2+ was included in the selection buffer in SELEX. In cells, expression of T1 did not change the global O-GlcNAcylation pattern or the abundance of OGT (Figure 1I). Moreover, in pulse-chase experiments with actinomycin D (ActD) treatment, we found T1 to have a short half-life (16.18 min) in cells. In contrast, 18S rRNA was stable during the 8-hr treatment (Figure 1J).
In conclusion, T1 is an RNA aptamer that binds OGT without inhibiting its enzymatic activity both in vitro and in cells. It is a short-lived RNA in cellular context.
Dual-Specificity Aptamers Increase O-GlcNAcylation on GFP-Tagged Proteins
Next, we conjoined T1 with AP3, an RNA aptamer of GFP26. In these DS aptamers, T1 and AP3 were connected by a linker region. We first designed a series of flexible linkers that were single-stranded, GC-neutral, and that did not interfere with the folding of T1 and AP3 (Figure 2A). Like the individual T1 aptamer, the DS aptamer has a short half-life (8.029 min) in cells (Figure 2B). The nomenclature of all aptamers in this research is illustrated in Table S1.
Figure 2. Dual-Specificity Aptamers Increase O-GlcNAcylation on GFP-Tagged Proteins.
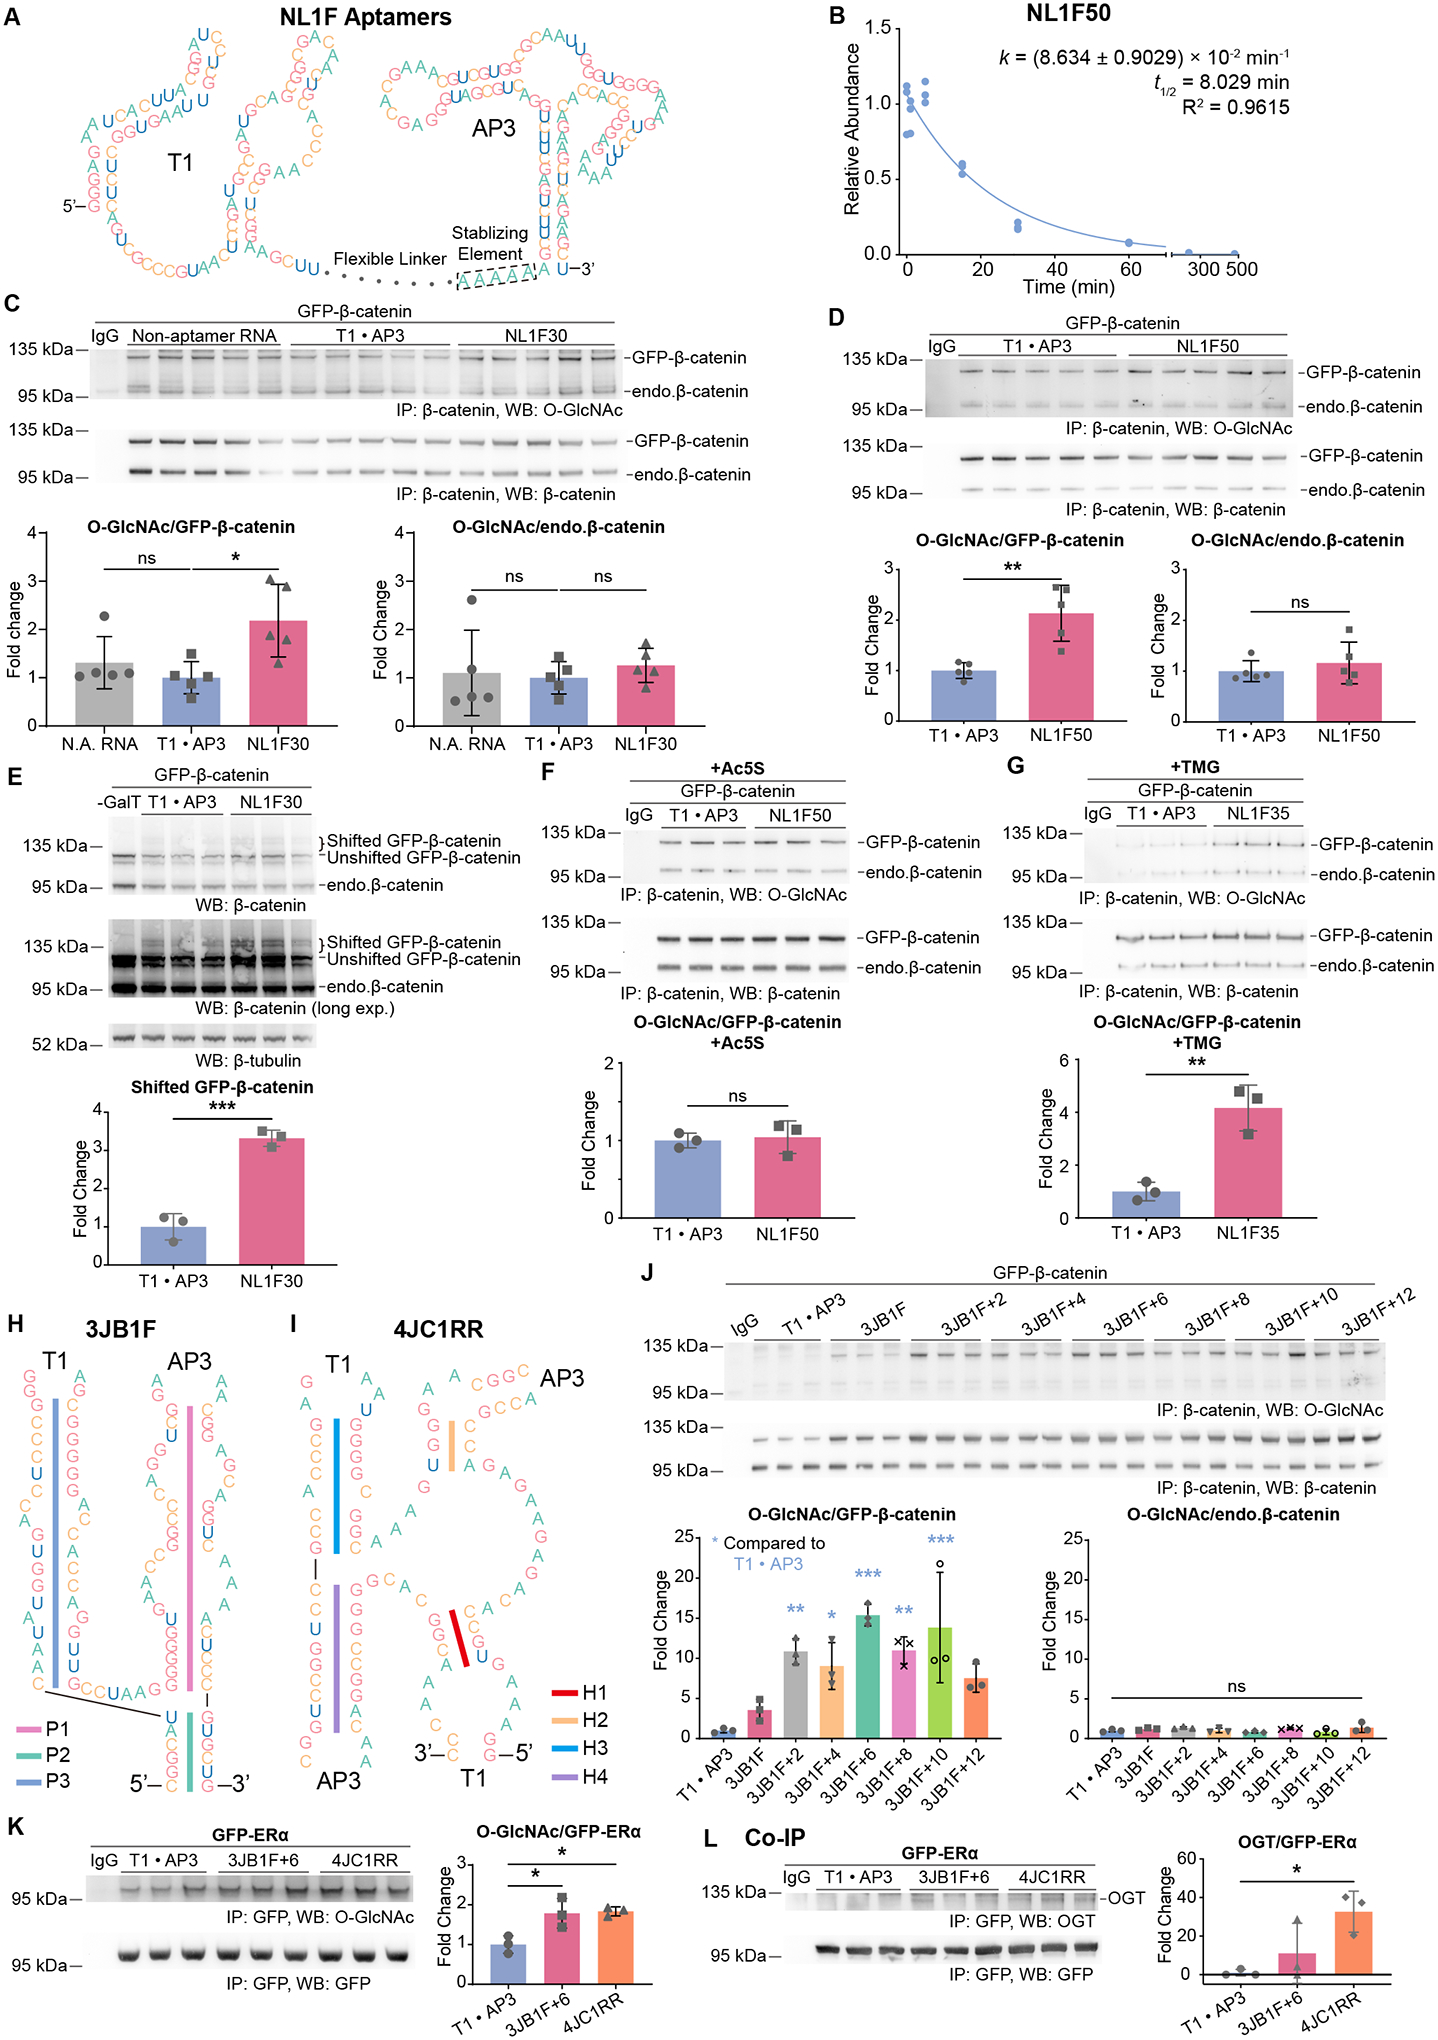
(A) Schematic of DS aptamers with flexible linkers (NL1F, T1-linker-AP3). Five adenine residues are inserted upstream of AP3 to stabilize the transcribed U6 terminator.
(B) Pulse-chase experiments on the half-life of NL1F50 (T1–50nt-AP3). Experiments were performed and analyzed in the same way as in Figure 1J. N=3.
(C) and (D) IP-WB on cells expressing GFP-β-catenin and the indicated aptamers. N.A. – Non-aptamer. endo. – endogenous. N=5.
(E) Mass-shift assays on cells expressing GFP-β-catenin and the indicated aptamers. Two blots on β-catenin with short and long exposure time are shown. Intensities of the shifted bands are normalized to that of β-tubulin. N=3.
(F) and (G) IP-WB on cells expressing GFP-β-catenin and the indicated aptamers and treated with 50 μM Ac5S for 20 hr (F) or 2 μM TMG for 6 hr (G). N=3.
(H) and (I) Schematics of the DS aptamers with folded linkers. 3JB1F has a three-way RNA junction (H) and 4JC1RR has a four-way RNA junction (I) as linkers.
(J) Optimization of the folded linker in 3JB1F. IP-WB on cells expressing GFP-β-catenin and the indicated aptamers. N=3.
(K) and (L) IP-WB (K) or Co-IP (L) on HEK293T cells expressing GFP-ERα and the indicated aptamers. N=3.
T1 · AP3 – Individual T1 and AP3 aptamers (control). NL1F30/50 – DS aptamers (T1-linker-AP3) with flexible linkers of 30/50 nt. 3JB1F/4JC1RR – DS aptamers (T1-linker-AP3) with folded linkers. +2/+4/…/+12, serial additions (bp) into the folded linker. Quantitated WB data are normalized to the control groups (T1 · AP3). Aptamers and proteins were expressed from plasmids. One-way ANOVA test in (C), (J), (K), (L). Student’s t-test in other panels. Data are represented as mean ± SD. ns, p ≥ 0.05; *, p < 0.05; **, p < 0.01; ***, p < 0.001.
See also Figures S1 and S2.
Expression of these NL1F DS aptamers significantly increased O-GlcNAcylation of GFP-β-catenin in a specific manner. Protein-specific O-GlcNAcylation was quantified by immunoprecipitation (IP) and Western Blot (WB). In comparison to the individual T1 and AP3 aptamers (T1 · AP3), NL1F30, NL1F35 and NL1F50 up-regulated O-GlcNAc levels on GFP-β-catenin by 2- to 3-fold (Figures 2C, 2D, S2A to S2C). Efficacy of DS aptamers was further confirmed in mass-shift assays, where O-GlcNAc groups were enzymatically labeled with N-azidoacetylgalactosamine (GalNAz), then conjugated to polyethylene glycol (PEG) of 8.5 kDa by strain-promoted alkyne-azide cycloaddition (SPAAC), causing a mobility shift of the protein in WB27. In mass-shift assays, NL1F30 and NL1F50 increased O-GlcNAcylation on GFP-β-catenin by 3.3-fold and 2.9-fold, respectively (Figures 2E, S2F). Increasing the expression of GFP-β-catenin renders NL1F35 ineffective, suggesting that the molar ratio of aptamer to substrate is important for the efficacy of DS aptamers (Figures S2B, S2C). Meanwhile, O-GlcNAc on endogenous β-catenin remained unchanged (Figures 2C, 2D, S2A), and DS aptamers did not affect global O-GlcNAcylation (Figure S2E). These results indicate good selectivity of the DS aptamers. The abundance of GFP-β-catenin was also increased, suggesting a stabilizing effect of O-GlcNAc on this protein (Figure S2E). DS aptamer increased O-GlcNAcylation on GFP-β-catenin in Wnt-stimulated cells (Figure S2G). On GFP-β-catenin, the changes in O-GlcNAcylation arose from its β-catenin portion, as O-GlcNAc on the GFP tag was undetectable (Figure S2D).
Ac4-5SGlcNAc (Ac5S) and thiamet-G (TMG) are highly potent inhibitors of OGT and OGA, respectively28,29. DS aptamers did not induce hyper-O-GlcNAcylation on GFP-β-catenin in Ac5S-treated cells but increased this modification in TMG-treated cells (Figures 2F and 2G). Thus, the activity of OGT is required for aptamer-induced O-GlcNAcylation, while the activity of OGA is not. These observations, together with the observation that the DS aptamers do not change the abundance of OGT and OGA (Figures 3C, 3D), rule out the possibility that aptamer-induced O-GlcNAcylation arise from the potential “off-target” effects of RNA aptamers.
Figure 3. O-GlcNAc Stabilizes GFP-β-catenin by Inhibiting Its Interaction With β-TrCP.
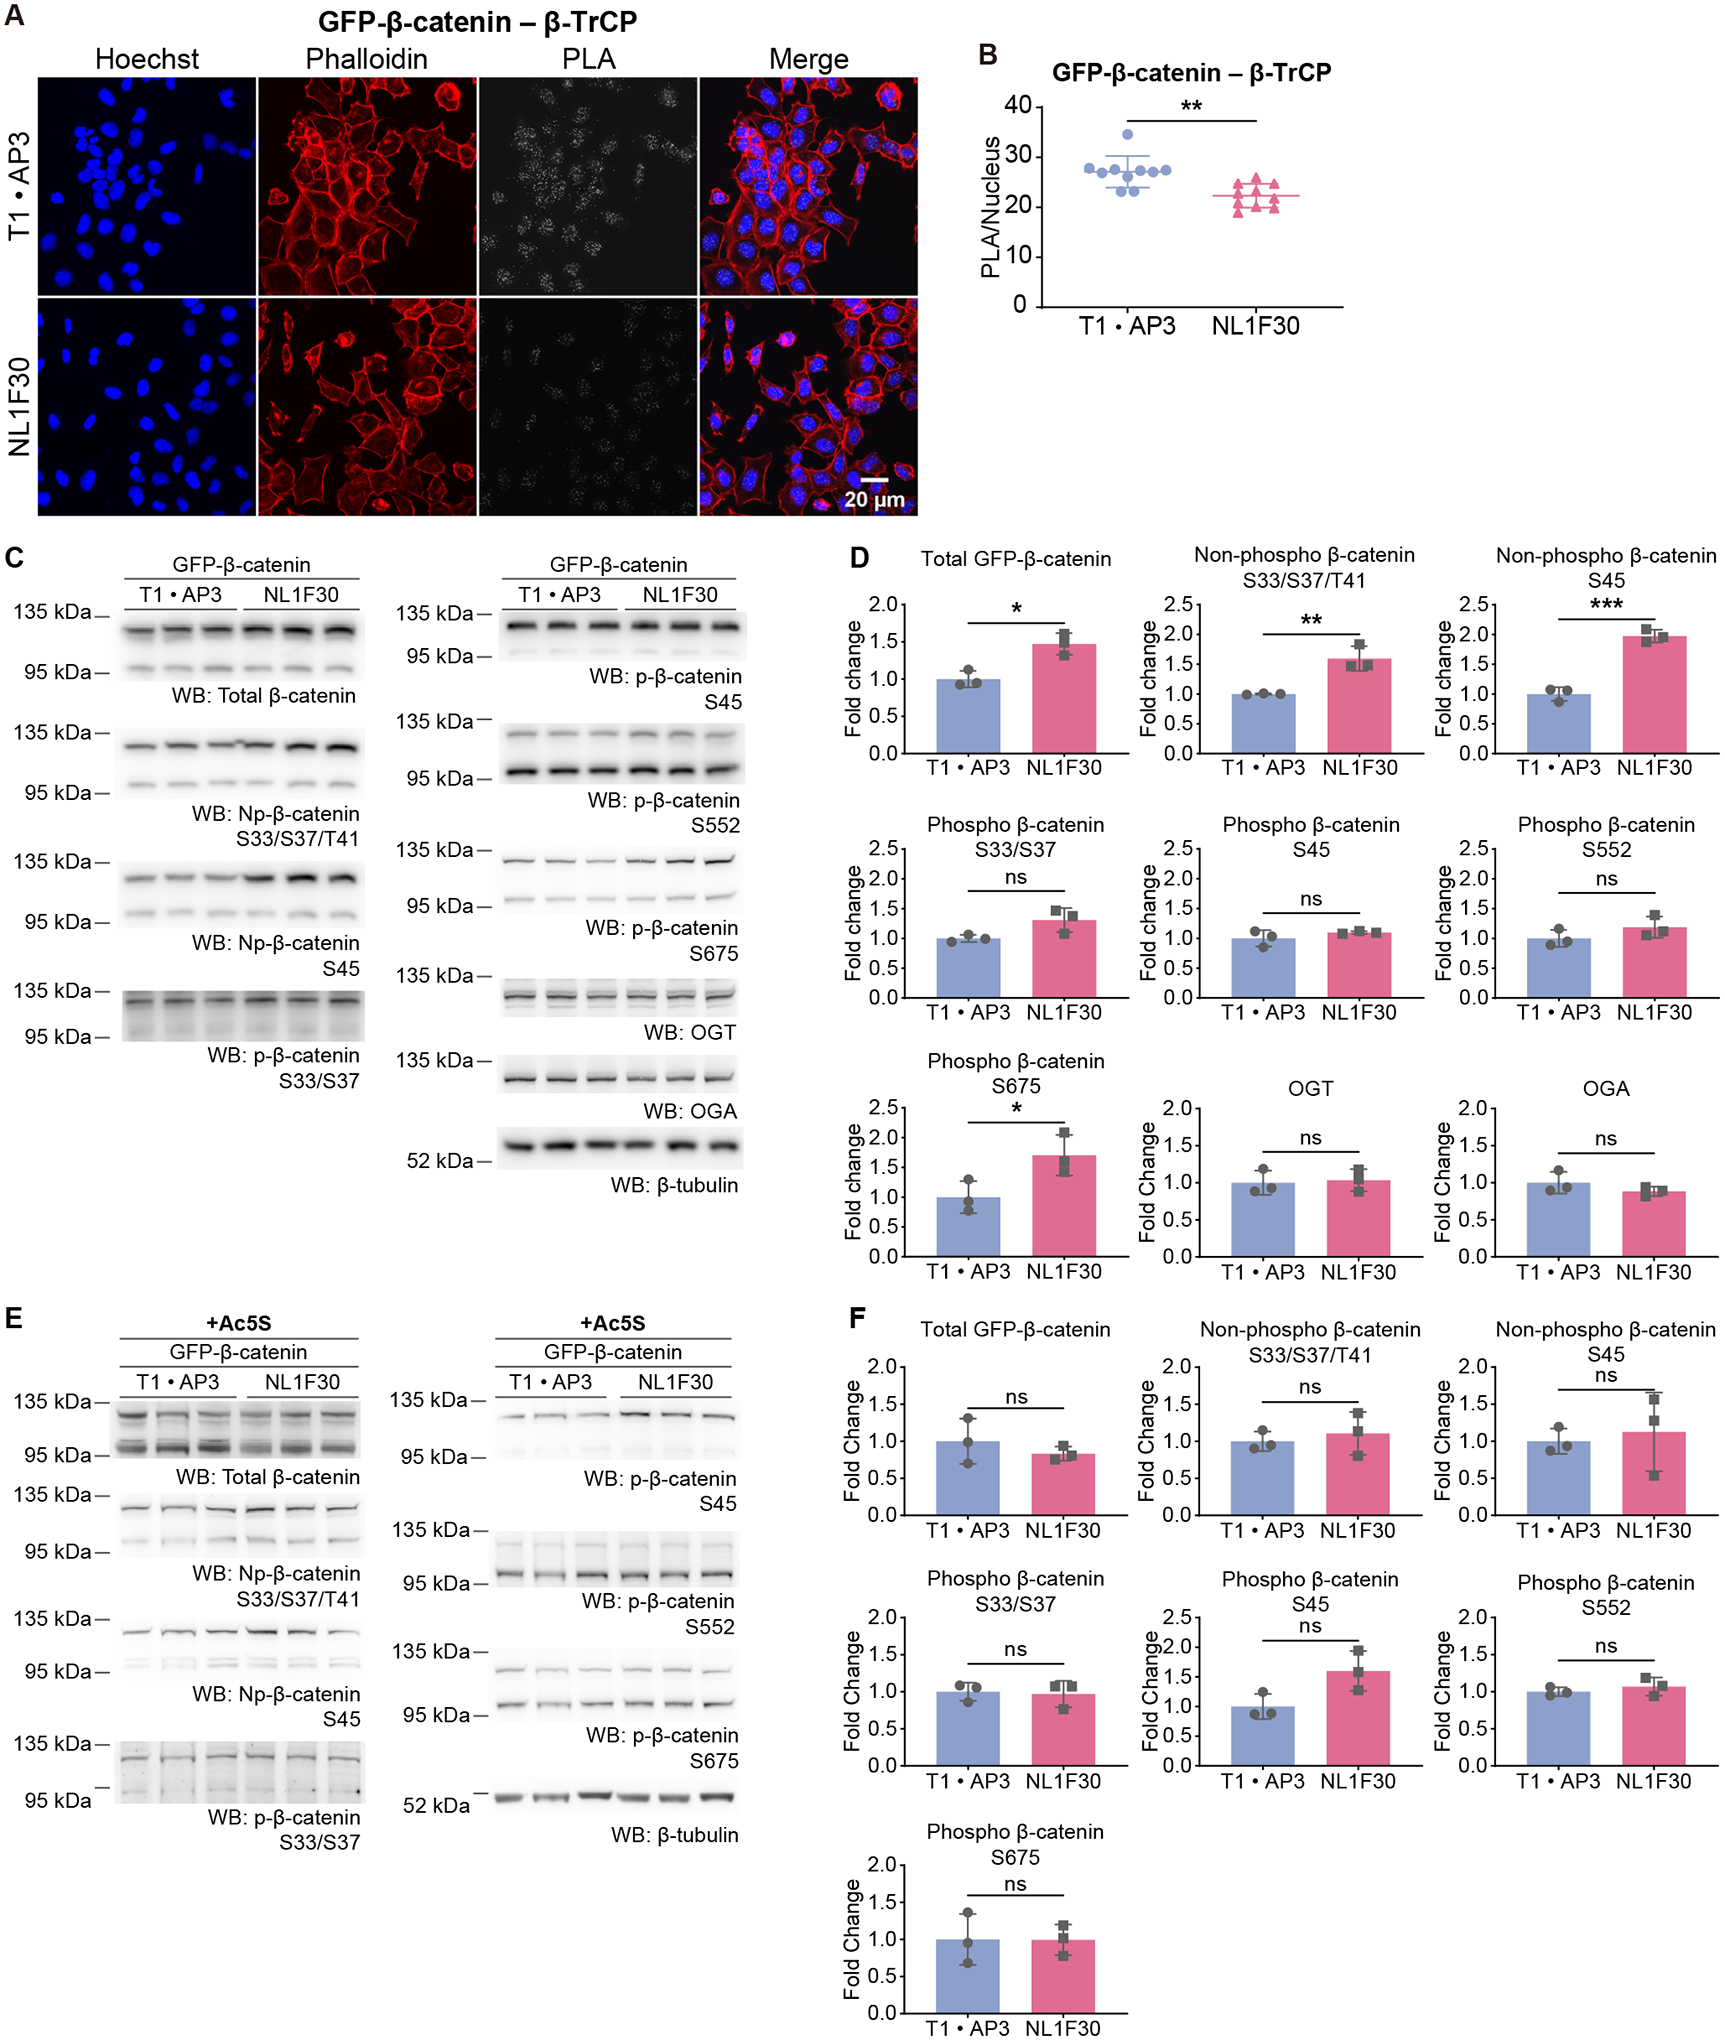
(A) Confocal images of Proximity Ligation Assay (PLA) on cells expressing GFP-β-catenin and the indicated aptamers. PLA was performed with antibodies targeting GFP and β-TrCP.
(B) Quantification of (A). PLA puncta are counted and normalized to the number of nuclei in each image. N=10.
(C) to (F) WB on HEK293T cells expressing GFP-β-catenin and the indicated plasmids. In (E), cells were treated with 50 μM Ac5S for 20 hr. (D) and (F) Quantifications of (C) and (E). Intensity of each band is normalized to that of β-tubulin. Np – non-phosphorylated. p – phosphorylated. N=3.
T1 · AP3 – Individual T1 and AP3 aptamers (control). NL1F30 – DS aptamers (T1-linker-AP3) with a flexible linker of 30 nt. Quantitated data are normalized to the control groups (T1 · AP3). Student’s t-test. Data are represented as mean ± SD. ns, p ≥ 0.05; *, p < 0.05; **, p < 0.01; ***, p < 0.001.
See also Figure S3.
In addition to the single-stranded flexible linkers, we designed DS aptamers with folded linkers. Three-way and four-way RNA junctions are naturally occurring RNA structures. In family C of three-way junctions, the P1 and P2 helices are coaxially stacked while the P3 helix “bends” towards P1 (Figure 2H)30. These structural properties result in proximity between the two helices. We picked a structure (PDB 1MFQ, S-domain of 7SL RNA) from this family31 and grafted T1 and AP3 onto its helices. By swapping the locations of T1 and AP3, two DS aptamers (3JB1F and 3JB1R) were generated (Figures 2H, S2H). On 3JB1F and 3JB1R, T1 and AP3 were of identical distance but different orientations. To optimize the folded linkers, we introduced serial additions into the P3 helices of 3JB1F and 3JB1R (Figure S1A). Considering that in RNA double helices, addition of 1 bp introduces a rotation of 32.7° but only increases the length by 2.8 Å32, these additions cause notable changes in the orientation of T1/AP3, but minor variations on the distance.
The 3JB1F variants significantly promoted O-GlcNAcylation on GFP-β-catenin (Figure 2J). The original 3JB1F increased this PTM by 3.5-fold, which was dramatically improved by serial additions on its P3 helix. Most of the variants increased O-GlcNAc on GFP-β-catenin by more than 10-fold. Among them, the variant with 6 bp addition (3JB1F+6; Figure S1A) increased this PTM by 15-fold. Notably, the impact of serial additions showed some “periodicity”, which peaked at 6 bp and decreased as additions grew longer. This observation agrees with the structural properties of RNA helices, where addition of 11 bp introduces a 360° rotation. Meanwhile, O-GlcNAcylation of endogenous β-catenin remained unchanged (Figure 2J). 3JB1R increased O-GlcNAcylation of GFP-β-catenin by 2-fold, however, serial additions had little effect (Figure S2I). This observation indicates that on 3JB1R, the orientation of T1 is suboptimal, so that OGT is facing away from its target protein when bound to the complex.
DS aptamers increase O-GlcNAc levels on other GFP-tagged proteins. Here we designed another folded linker. In family π of four-way RNA junctions, the helices H3 and H4 are coaxially stacked while H1 and H2 “swings”, and H2 is attracted to H3 (Figure 2I)33. We picked a structure (PDB 1U9S, specificity domain of A-type ribonuclease P) from this family34, and grafted two copies of T1 and AP3 onto its helices (Figure S1B). This 4JC1RR, as well as 3JB1F+6, increased O-GlcNAc on GFP-tagged Estrogen Receptor α (ERα), Src and AMP-activated protein kinase α2 (AMPKα2) (Figures 2K, S2J, S2L). Co-immunoprecipitation (Co-IP) revealed that 4JC1RR promoted the interactions between OGT and these proteins (Figures 2L, S2K), supporting our hypothesis that DS aptamers increase O-GlcNAcylation by inducing proximity between OGT and its substrates.
In conclusion, DS aptamers with flexible or folded linkers promote interactions between OGT and GFP-tagged proteins and selectively increase O-GlcNAcylation on these substrates.
DS Aptamers Reveal Unmapped O-GlcNAc Sites on β-catenin
Our study reveals unmapped O-GlcNAc sites. Four O-GlcNAc sites have been mapped (Ser23, Thr40, Thr41 and Thr112) on β-catenin18. When all these sites were mutated to alanine, O-GlcNAcylation on this GFP-β-catenin4A mutant was still induced by NL1F30 or 3JB1F+6 (Figures S3A, S3E), though to a lesser extent than on the wild-type protein (Figures 2C, 2J). This induction required the activity of OGT (Figures S3C, S3G). Similar to on the wild-type protein, O-GlcNAc stabilized the 4A mutant (Figures S3B, S3F). Interestingly, though NL1F30 did not induce higher O-GlcNAcylation than 3JB1F+6, it was more effective on stabilizing the protein. The stabilization effects required the activity of OGT (Figures S3D, S3H). These observations suggest that NL1F30 and 3JB1F+6 have different site-selectivity when inducing O-GlcNAcylation on GFP-β-catenin, and that O-GlcNAc on the unidentified sites regulates the stability of β-catenin.
In control experiments without aptamers, O-GlcNAc signal on the 4A mutant was reduced by a bacterial homolog of OGA (CpOGA)35, or by competing the O-GlcNAc antibody with 1 M GlcNAc during WB (Figures S3I, S3J). These results confirm the WB bands to be specific to O-GlcNAc, and that O-GlcNAc on the 4A mutant was not artifacts of aptamer expression.
O-GlcNAc Stabilizes GFP-β-catenin by Inhibiting Its Interaction With β-TrCP
As the key transcription factor of the Wnt signaling pathway, β-catenin is activated by Wnt. Without Wnt, newly synthesized β-catenin is recruited to a destruction complex comprised of Axin, APC, GSK3β and CK1. In the complex, β-catenin is consecutively phosphorylated by CK1 and GSK3β on its Ser45, Thr41, Ser37 and Ser33 residues, ubiquitinated by the SCFβ-TrCP complex and degraded by proteasomes15,16,36. Binding of Wnt to the membrane receptor Frizzled triggers a cascade of signaling events, which ultimately blocks the ubiquitination of phosphorylated β-catenin in the destruction complex17. Stabilized β-catenin saturates the complex, accumulates in the cytoplasm, enters the nucleus, and activates transcription37.
β-TrCP recruits β-catenin that is phosphorylated on Ser33 and Ser37 to the SCFβ-TrCP E3 ubiquitin ligase, causing its ubiquitination and degradation15,38. In Proximity Ligation Assays (PLA), we found that DS aptamer inhibited the interaction between GFP-β-catenin and β-TrCP (Figures 3A, 3B). We reasoned that impairing this interaction would inhibit the degradation of phosphorylated GFP-β-catenin, therefore saturate the destruction complex, stabilize the newly synthesized, unphosphorylated GFP-β-catenin, and increase the total abundance of this protein (Figures S2E, 3C, 3D, S3B, S3F). DS aptamer increased the non-phosphorylated moiety of GFP-β-catenin regarding Ser33, Ser37, Thr41 and Ser45 (Figures 3C, 3D), agreeing with our hypothesis. Meanwhile, abundance of phosphorylated GFP-β-catenin was unchanged regarding these sites (Figures 3C, 3D), suggesting that O-GlcNAc inhibit the interaction between GFP-β-catenin and β-TrCP not by competing phosphorylation, but likely by steric hinderance since it has a large Stokes radius39. Additionally, DS aptamer increased phosphorylation on Ser675 (Figures 3C, 3D) that enhances the transcriptional activity of β-catenin40. These site-specific phosphorylations on endogenous β-catenin were not changed (Figures 3C, S3K). Changes of site-specific phosphorylation required the activity of OGT (Figures 3E, 3F, S3L), supporting that they were caused by aptamer-induced O-GlcNAcylation.
In conclusion, O-GlcNAc on GFP-β-catenin inhibits its recognition by β-TrCP and stabilizes this protein.
DS Aptamers Increase O-GlcNAcylation on Endogenous β-catenin
Beyond epitope-tagged proteins, we asked if DS aptamers could regulate O-GlcNAc on endogenous proteins. An RNA aptamer (bc339) targeting β-catenin was generated from SELEX (Figure 4A). We characterized its binding properties by SPR (Figure 4B). The dissociation constant (Kd) between bc339 and β-catenin is 16.00 nM. We connected this aptamer (bc339) to T1 with a series of flexible linkers, thus the NL8F DS aptamers were designed (Figure 4C).
Figure 4. DS Aptamers Increase O-GlcNAcylation on Endogenous β-catenin.
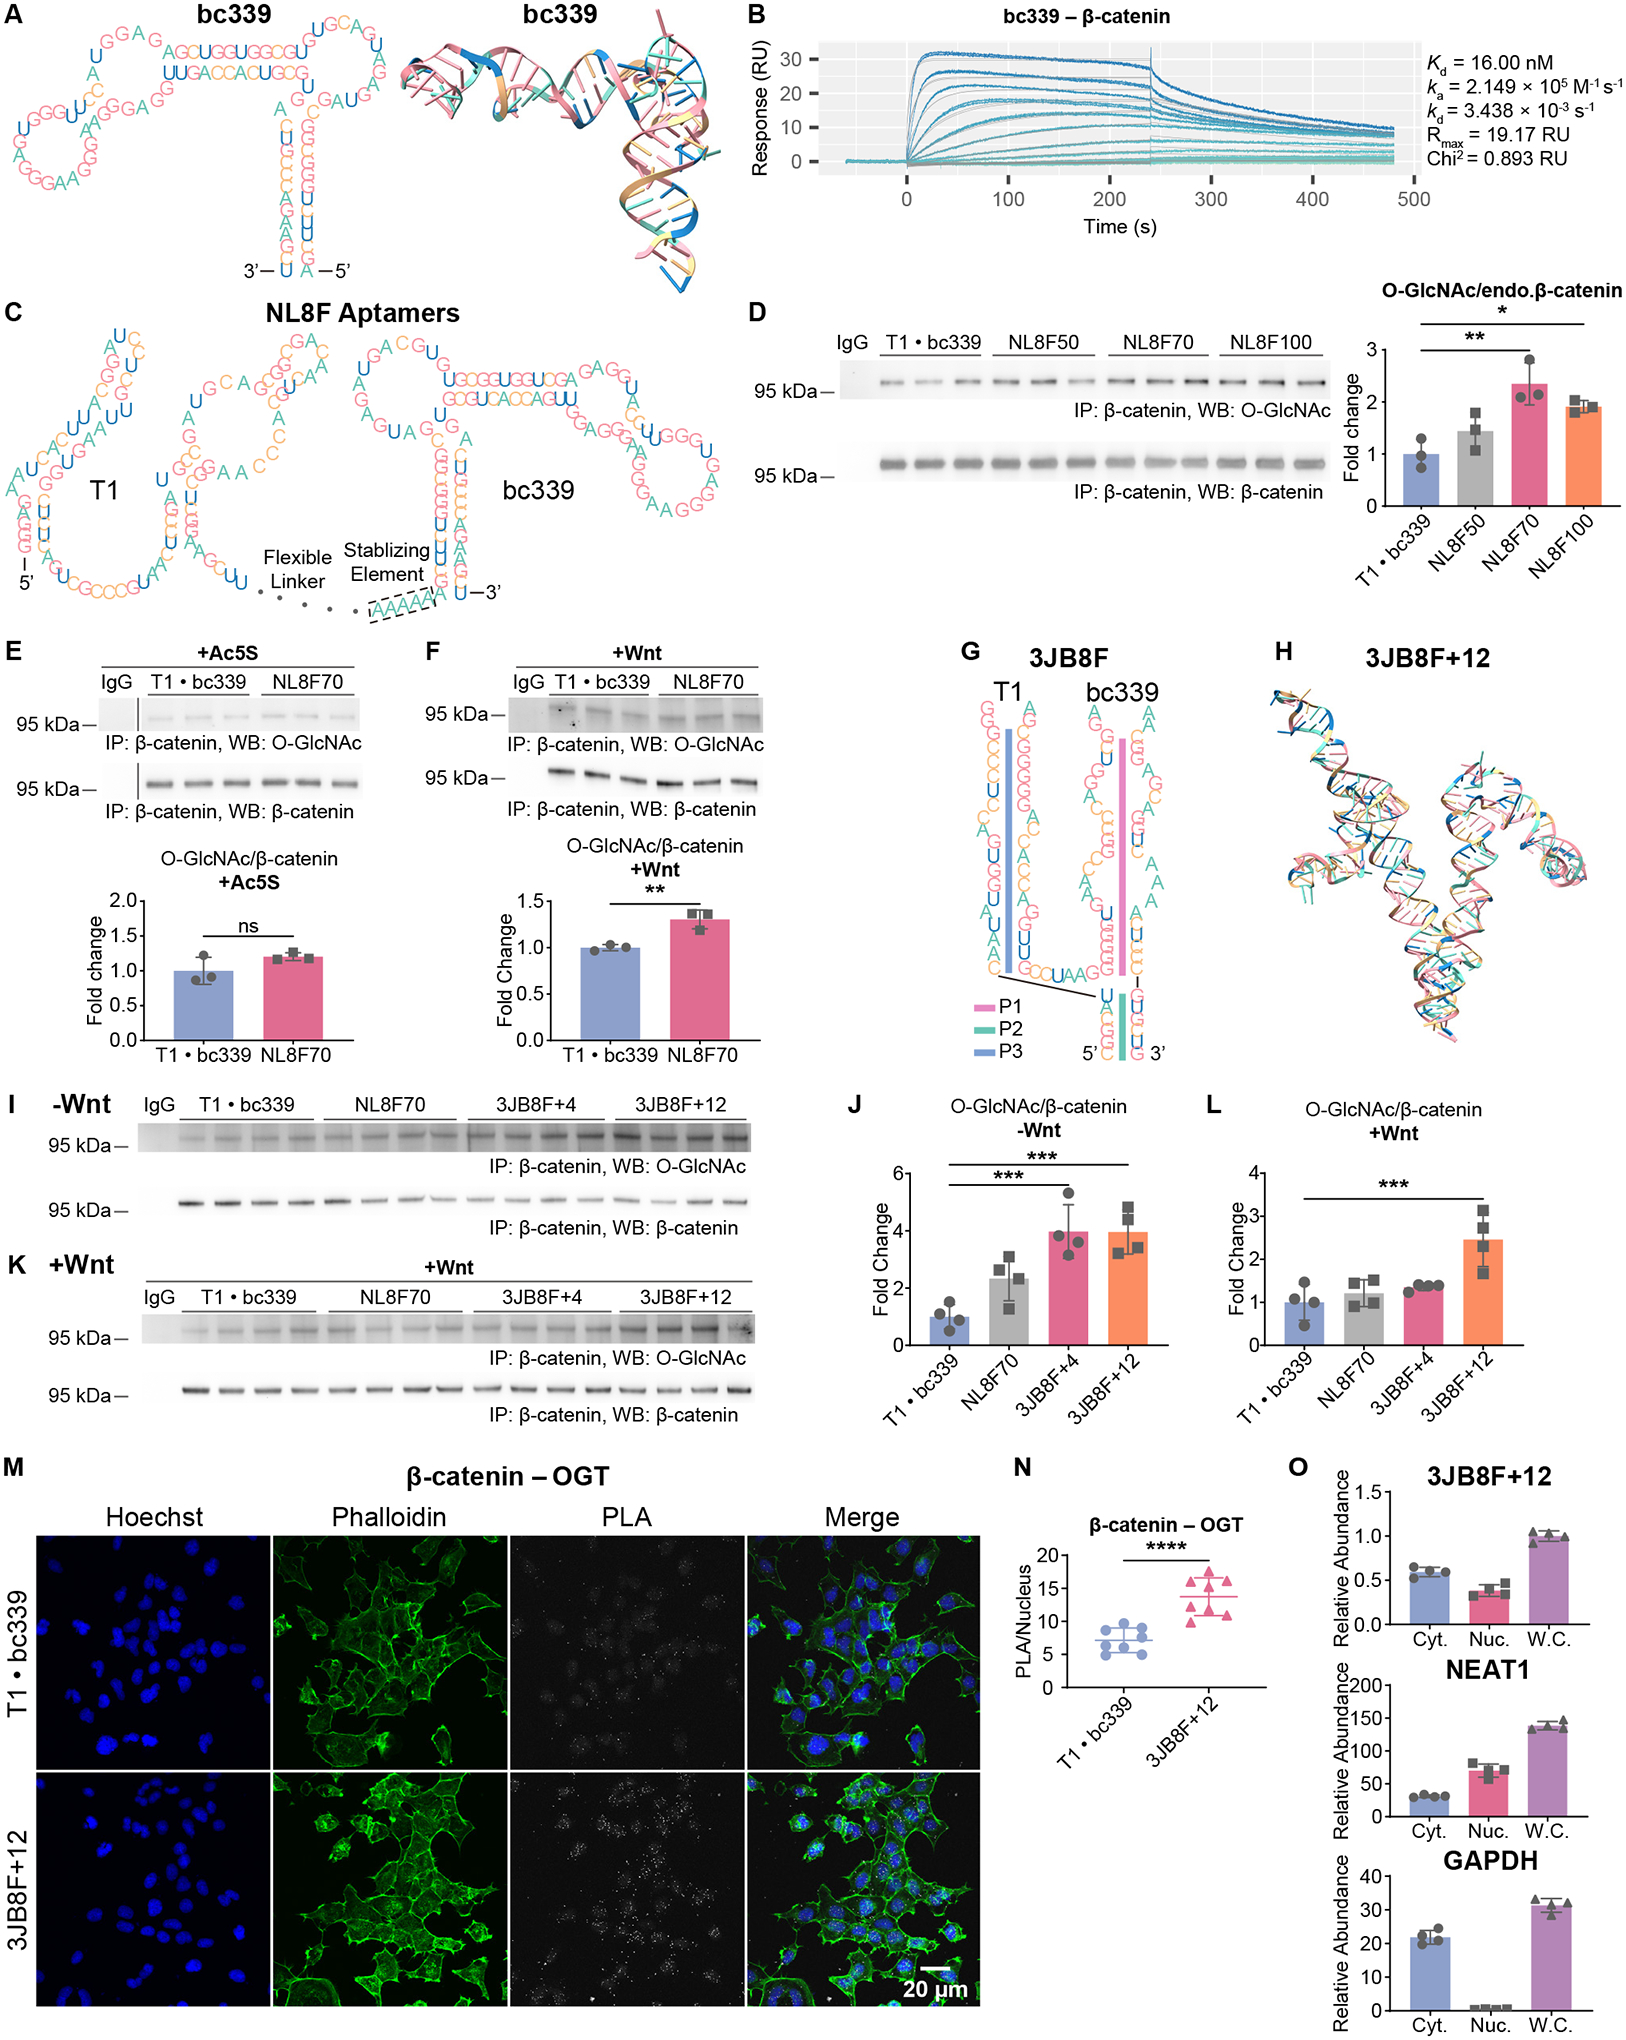
(A) Predicted secondary (left panel) and tertiary (right panel) structures of bc339. Nucleotides in the two panels are color coded in the same way.
(B) SPR characterizating the binding affinity and kinetics of bc339. Sensorgrams represent β-catenin concentrations from 1 μM to 122 pM in 2× serial dilutions. Data are fitted to a 1:1 binding model.
(C) Schematic of DS aptamers with flexible linkers (NL8F, T1-linker-bc339). Five adenine residues are inserted upstream of bc339 to stabilize the transcribed U6 terminator.
(D) IP-WB on HEK293T cells expressing the indicated aptamers. N=3.
(E) and (F) IP-WB on HEK293T cells expressing the indicated aptamers and treated with 50 μM Ac5S for 20 hr (E) or Wnt3A-conditioned medium for 4 hr (F). Irrelevant lanes are cropped. N=3.
(G) Schematic of DS aptamers (3JB8F, T1-linker-bc339) with folded linkers.
(H) Predicted tertiary structure of the DS aptamer 3JB8F+12. Nucleotides are color coded in the same way as in (G). Complete sequence and secondary structure prediction are shown in Figure S1C.
(I) to (L) IP-WB on HEK293T cells expressing the indicated aptamers, under −Wnt (I, J) and +Wnt (K, L) conditions. (J) and (L) Quantification of (I) and (K). N=4.
(M) and (N) Confocal images of PLA on HEK293T cells expressing the indicated aptamers. (N) Quantification of (M). Total PLA puncta is counted and normalized to the number of nuclei in each image. N=8.
(O) Subcellular localization of 3JB8F+12. Nucleus and cytoplasm of cells stably expressing 3JB8F+12 was isolated, and RNA in each fraction was quantified by RT-qPCR. RNA abundances are normalized to that of 3JB8F+12 in whole cell lysate (purple bar in upper panel). NEAT1 is a nuclear RNA control. GAPDH is a cytoplasmic RNA control. Cyt. – Cytoplasm. Nuc. – Nucleus. W.C. – Whole Cell. N=4.
T1 · bc339 – Individual T1 and bc339 aptamers (control). NL8F50/70/100 – DS aptamers (T1-linker-bc339) with flexible linkers of 50/70/100 nt. 3JB8F – DS aptamers (T1-linker-bc339) with folded linkers. +4/+12, serial additions (bp) into the folded linker. Quantitated data are normalized to the control groups (T1 · bc339). Aptamers were expressed from plasmids. Student’s t-test in (E), (F), (N). One-way ANOVA test in other panels. Data are represented as mean ± SD. ns, p ≥ 0.05; *, p < 0.05; **, p < 0.01; ***, p < 0.001; ****, p < 0.0001.
NL8F70 and NL8F100 increased O-GlcNAcylation of endogenous β-catenin by 2.3- and 1.9-fold, respectively (Figure 4D). NL8F100 moderately stabilized β-catenin (Figure S4A). Meanwhile, global O-GlcNAcylation, as well as the abundance of OGT and OGA, remained unchanged (Figure S4A). These results reveal good selectivity of the DS aptamers. Inhibiting OGT prevented aptamer-induced O-GlcNAcylation (Figure 4E). Efficacy of NL8F70 was confirmed in mass-shift assay (Figure S4B). However, when Wnt signaling was activated, efficacy of NL8F70 became less clear (Figures 4F, 4K, 4L).
We also constructed DS aptamers with folded linkers. By replacing the GFP aptamer (AP3) in the 3JB1F constructs with bc339, we designed the 3JB8F constructs (Figures 4G, 4H, S1C). Among them, 3JB8F+12 increased O-GlcNAcylation of β-catenin by 4-fold in the absence of Wnt (Figures 4I, 4J), and by 2.5-fold in the presence of Wnt (Figures 4K, 4L). It also stabilized β-catenin (Figures S4C, S4D). Global O-GlcNAcylation was not changed by 3JB8F+12 under either condition (Figures S4E, S4F). Like other DS aptamers, 3JB8F+12 requires the activity of OGT to induce O-GlcNAcylation under both −Wnt and +Wnt conditions (Figures S4G, S4H).
In PLA and Co-IP, we found that 3JB8F+12 substantially promoted the interaction between OGT and β-catenin (Figures 4M, 4N, S4I). These results support our hypothesis that DS aptamers regulate O-GlcNAcylation by targeting a substrate protein to OGT. We studied the subcellular localization of DS aptamers by nucleus/cytoplasm fractionation and RT-qPCR (Figure 4O). Compared to the RNA species enriched in nucleus (NEAT1) and cytoplasm (GAPDH), 3JB8F+12 localizes in both. Therefore, DS aptamers could regulate O-GlcNAcylation on both nuclear and cytoplasmic proteins.
We constructed another DS aptamer (3JB8R+12) by swapping T1 and bc339 on 3JB8F+12 (Figures S1D, S4J). Though it consists of identical modules, 3JB8R+12 was unable to regulate O-GlcNAcylation of β-catenin under either status of Wnt signaling (Figures S4K and S4L). This observation further supports our hypothesis that not only the distance, but also the orientations of the individual aptamers on the folded linker are critical to the efficacy of DS aptamers.
In conclusion, the T1-linker-bc339 DS aptamers specifically increase O-GlcNAcylation on endogenous β-catenin. DS aptamers could induce O-GlcNAcylation in both nucleus and cytoplasm.
O-GlcNAc Regulates β-catenin’s Interactions With Epigenetic Modifiers and Increases Its Transcriptional Activity
We then studied how O-GlcNAc regulates the functions of β-catenin using DS aptamers. As a transcription factor that does not have a DNA binding domain, the functions of β-catenin heavily rely on its interactions with other proteins, including EZH2, KAT2A and EP30041–43.
Enhancer of zeste homolog 2 (EZH2) is the catalytic subunit of the Polycomb Repressive Complex 2 (PRC2), which plays important roles in gene repression and during development44,45. It catalyzes the tri-methylation of Lys27 on Histone H3 (H3K27me3), which marks silent promoters46. In PLA and Co-IP, we found that the interaction between β-catenin and EZH2 was increased by 3JB8F+12, regardless of the Wnt signaling status (Figures 5A, 5B, 5I, 5J, S4M, S4N). This increase was prevented by inhibition of OGT (Figures 5C, 5D, 5K, 5L). Furthermore, 3JB8R+12, the DS aptamer that does not change O-GlcNAc levels on β-catenin, had no effect on this interaction (Figures 5E, 5F, 5M, 5N). Proximity between β-catenin and H3K27me3 was also increased by 3JB8F+12 (Figures 5G, 5H, 5O, 5P). We conclude that O-GlcNAcylation of β-catenin promotes its interaction with EZH2.
Figure 5. O-GlcNAc Promotes β-catenin’s Interactions With EZH2.
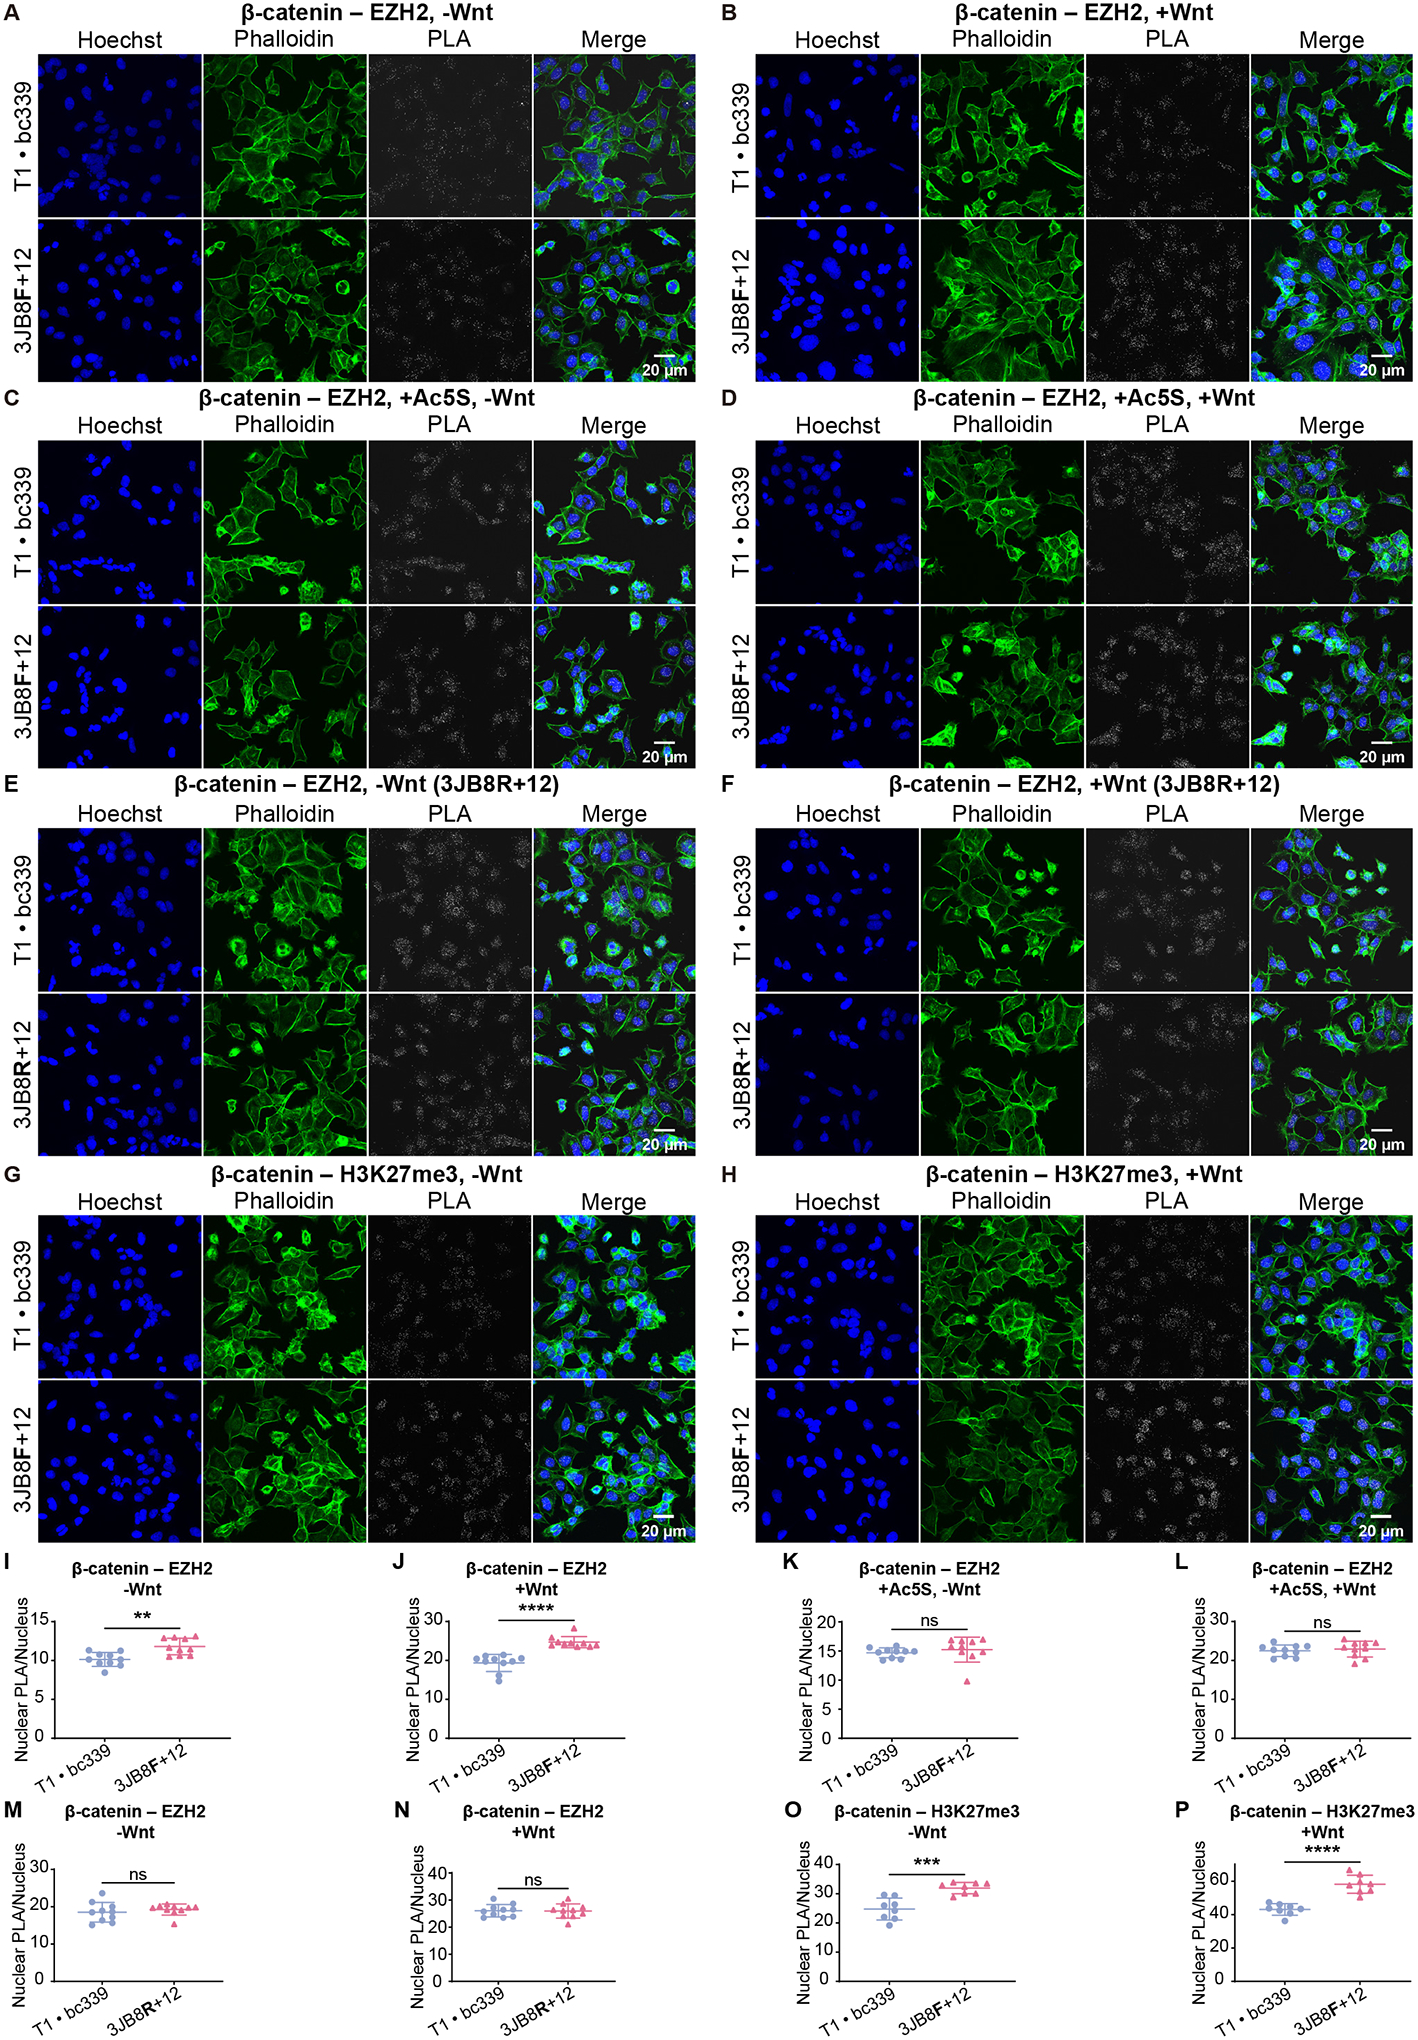
(A) to (H) Confocal images of PLA on HEK293T cells expressing the control aptamers (T1 · bc339) or a DS aptamer (3JB8F+12 or 3JB8R+12), under −Wnt or +Wnt conditions. PLA was performed with antibodies targeting β-catenin and EZH2 or H3K27me3. In (C) and (D), cells were treated with 50 μM Ac5S for 20 hr.
(I) to (P) Quantification of (A) to (H). PLA puncta in nucleus are counted and normalized to the number of nuclei in each image. Student’s t-test, N=10 (I to N) or 8 (O, P). Data are represented as mean ± SD. ns, p ≥ 0.05; **, p < 0.01; ***, p < 0.001; ****, p < 0.0001.
T1 · bc339 – Individual T1 and bc339 aptamers (control). 3JB8F+12/R+12 – DS aptamers (T1-linker-bc339) with folded linkers.
See also Figures S5 and S6.
KAT2A (GCN5) is a histone acetyltransferase that acetylates the Lys9 of histone H3 (H3K9ac). H3K9ac correlates with actively expressed genes47. In PLA, we found that 3JB8F+12 increased the interaction between β-catenin and KAT2A in spite of the Wnt signaling status (Figures S5A, S5B, S5I, S5J). Inhibition of OGT prevented this change (Figures S5C, S5D, S5K, S5L). 3JB8R+12 had no effect on this interaction (Figures S5E, S5F, S5M, S5N). Moreover, 3JB8F+12 also increased the proximity between β-catenin and H3K9ac (Figures S5G, S5H, S5O, S5P). In conclusion, O-GlcNAc on β-catenin enhances its interaction with KAT2A.
3JB8F+12 regulates the interactions between β-catenin and other histone modifiers. It significantly inhibited the interaction between β-catenin and EP300, an acetyltransferase and transcription coactivator (Figures S6A, S6B, S6I, S6J)48. It also impaired the interaction between β-catenin and KAT5 (TIP60), a lysine acetyltransferase that is involved in the regulation of transcription, in DNA repair and in apoptosis (Figures S6C, S6D, S6K, S6L)49. Additionally, this DS aptamer inhibits the interaction between endogenous β-catenin and β-TrCP (Figures S6E, S6F, S6M, S6N), agreeing with our observation on GFP-β-catenin and β-TrCP (Figures 3A, 3B). Negative control experiments revealed good specificity of PLA experiments (Figures S6G, S6H, S6O, S6P).
Using aptamers, we studied how O-GlcNAc regulates β-catenin’s transcriptional activity in Wnt signaling. In TOPFlash assays, 3JB8F+12 elevated the activity of β-catenin in response to Wnt (Figure S7A), which required the activity of OGT (Figure S7B). These results agree with the observations when the O-GlcNAc modifying enzymes was inhibited with genetic or chemical approaches. Knockdown of OGT considerably impaired the activity of β-catenin, which was restored by rescuing this enzyme (Figure S7C). Reducing global O-GlcNAcylation with the OGT inhibitor (Ac5S) impaired the activity of β-catenin, but elevating global O-GlcNAcylation with the OGA inhibitor (TMG) further activated it (Figure S7D). In a control experiment, neither single or double individual aptamers (T1, bc339, T1 · bc339) affected the activity of β-catenin (Figure S7E). In conclusion, O-GlcNAc on β-catenin promotes its activity in response to Wnt. However, the luciferase reporter in TOPFlash assay is encoded on a plasmid and driven by an artificial promoter that contains seven TCF/LEF binding sites. Its expression is highly sensitive to β-catenin but has a different epigenetic context comparing to chromosomal genes. Thus, this assay measures the activity of β-catenin at high sensitivity, but the native regulations on chromosomal genes are not represented.
O-GlcNAc on β-catenin Recruits EZH2 to Promoters and Shifts the Transcriptome
Next, we wondered if the enhanced interaction with β-catenin regulates the chromatin binding of EZH2. We performed Cleavage Under Targets and Release Using Nuclease (CUT&RUN) on HEK293T cells expressing the individual aptamers (T1 · bc339) or the DS aptamer (3JB8F+12)50,51. CUT&RUN sequencing revealed that 3JB8F+12 increased the binding of EZH2 on 923 and 3473 sites in the absence and presence of Wnt, respectively (Figures 6A to 6C; Table S4). The differential binding sites predominantly localized on the promoter regions of the genome (Figures S7F, S7G). All differential binding events of EZH2 were prevented by knocking-down β-catenin, or by inhibiting OGT (Figures S7H, S7I, S7K), indicating they required increased O-GlcNAcylation and β-catenin. In addition, β-catenin is critical to the chromatin localization of EZH2, as its knockdown drastically impaired the promoter binding of EZH2 without affecting its abundance (Figures S7J, S7K). Given that O-GlcNAc on β-catenin enhances its interaction with EZH2 (Figures 5, S4M, S4N), we conclude that the strengthened interaction recruits EZH2 to promoters.
Figure 6. O-GlcNAc on β-catenin Recruits EZH2 to Promoters and Shifts the Transcriptome.
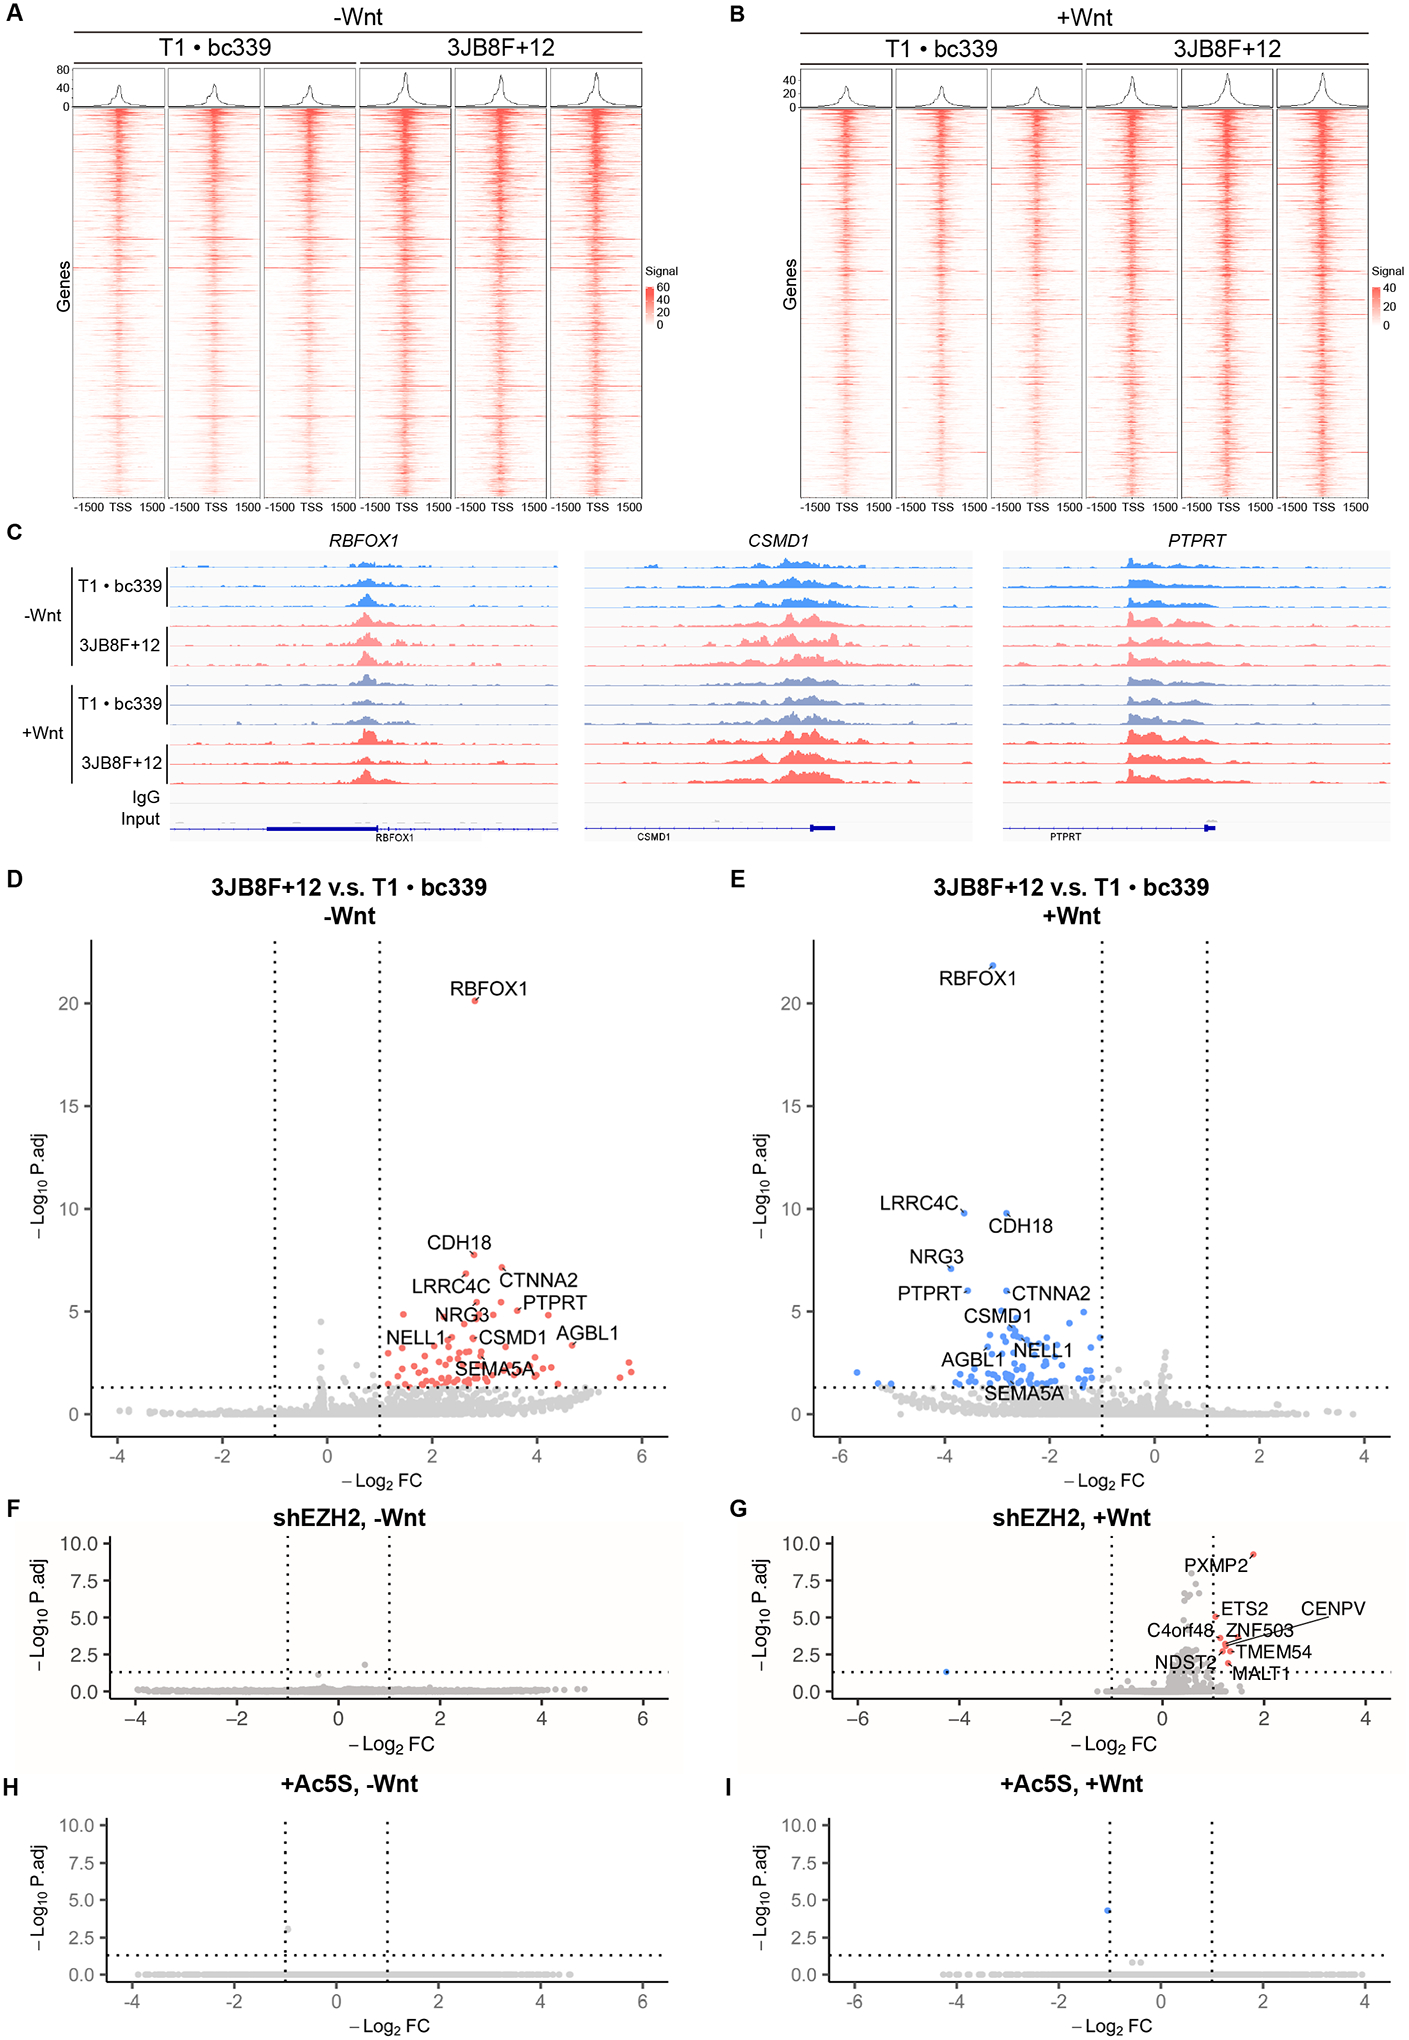
(A) and (B) Heatmap of the differential binding sites of EZH2. CUT&RUN sequencing was performed to HEK293T cells expressing the indicated aptamers and exposed to regular (−Wnt) or Wnt3A-conditioned (+Wnt) medium.
(C) The binding peaks of EZH2 on three promoters under indicated conditions.
(D) to (I) Volcano plot of RNA-seq data. HEK293T cells expressing the control (T1 · bc339) or DS (3JB8F+12) aptamers were treated with regular (−Wnt) or Wnt3A-conditioned (+Wnt) medium. In (F) and (G), EZH2 was knocked-down in cells with a shRNA. In (H) and (I), cells were treated with Ac5S.
T1 · bc339 – Individual T1 and bc339 aptamers (control). 3JB8F+12 – DS aptamer (T1-linker-bc339) with a folded linker.
We further asked if increased O-GlcNAcylation of β-catenin impacts the transcriptome. RNA sequencing (RNA-Seq) was performed on HEK293T cells expressing either the individual (T1 · bc339) or the DS (3JB8F+12) aptamers, in the absence and presence of Wnt. Surprisingly, the DS aptamer altered the transcriptome in opposite ways depending on the status of Wnt signaling. In the absence of Wnt, 3JB8F+12 promoted the expression of 83 genes. In contrast, when Wnt signaling was activated, 3JB8F+12 repressed the expression of 85 genes (Figures 6D, 6E; Table S5). These differential expressions required both EZH2 and elevated O-GlcNAc, as they were prevented by knocking-down EZH2 or inhibiting OGT (Figures 6F to 6I, S7K). In addition, when EZH2 was knocked-down and Wnt was present, O-GlcNAcylation of β-catenin slightly enhanced the transcription of eight other genes (Figures 6G, 6I). This observation suggests that O-GlcNAc on β-catenin also has mild, EZH2-independent activating effects on transcription, which could be overwritten by its EZH2-dependent repressive effects. Considering that EZH2 is associated with PRC2 that is a transcription repressor, the increased promoter binding of EZH2 may function in the repression of genes caused by O-GlcNAcylation of β-catenin when Wnt signaling was activated. However, the mechanism underlying the activation of genes without Wnt awaits further investigation. As EZH2 was reported to activate the androgen receptor gene independently of PRC2 and its methyltransferase activity52, it is possible that EZH2 activated the genes we observed in the same way. It is also possible that O-GlcNAc on β-catenin recruited some transcription activators to the chromatin when Wnt was absent, which we have not identified in this research.
In conclusion, O-GlcNAc on β-catenin strengthens its interaction with EZH2 and recruits EZH2 to the promoters. Globally, it regulates the transcriptome in two ways: it activates gene expression in the absence of Wnt but represses gene expression when Wnt signaling is activated. Our study reveals a synergistic mechanism that β-catenin regulate gene expression by recruiting histone modifiers.
Inducible Regulation of O-GlcNAcylation by Coupling DS Aptamers to Riboswitches or a Tet-On System
DS aptamers allow us to regulate O-GlcNAcylation on a single protein and to study protein-specific effects of this PTM. However, there is a concern about this method: will the normal functions of OGT and substrate proteins be interfered, if DS aptamers remain bound to them? This concern is partly solved by the fact that the individual and dual-specificity aptamers are short-lived (Figures 1J, 2B). Nevertheless, an inducible mechanism that forces the aptamers to dissociate from their targets would be ideal.
We designed inducible DS aptamers by incorporating riboswitch elements. Riboswitches are naturally derived or artificially designed RNA that change their conformations upon binding of ligands53,54. They usually contain three modules: a sensor that is a ligand-binding aptamer; an actuator that carries out downstream effects; and a transmitter sequence that couples the two55. In our design, two sets of riboswitches were incorporated into the DS aptamer NL1F50. In the newly generated inducible DS aptamer LRS1F50C (Figures 7A, 7B), the fluorogenic “Mango” aptamers serve as sensors56,57. TO1-biotin (TO1), the ligand of Mango, is a non-toxic, membrane permeable molecule that binds Mango with low nanomolar affinity58. The T1 and AP3 aptamers are the actuators, since it is their binding that the riboswitches aim to regulate. The transmitter elements were designed so that they bind the core sequences of Mango in the absence of TO1, but switch to bind T1 and AP3 in the presence of TO1 (STAR Methods). As a result, addition of TO1 triggers the folding of Mango, which disrupts the folding of T1 and AP3 and “turns off” the function of the DS aptamer (Figures 7A, 7B). In cells, LRS1F50C increased O-GlcNAcylation on GFP-β-catenin by 3-fold without affecting that of endogenous β-catenin, and it was inactivated by TO1 (Figures 7C to 7E).
Figure 7. Inducible Regulation of O-GlcNAcylation by Coupling DS Aptamers to Riboswitches or a Tet-On System.
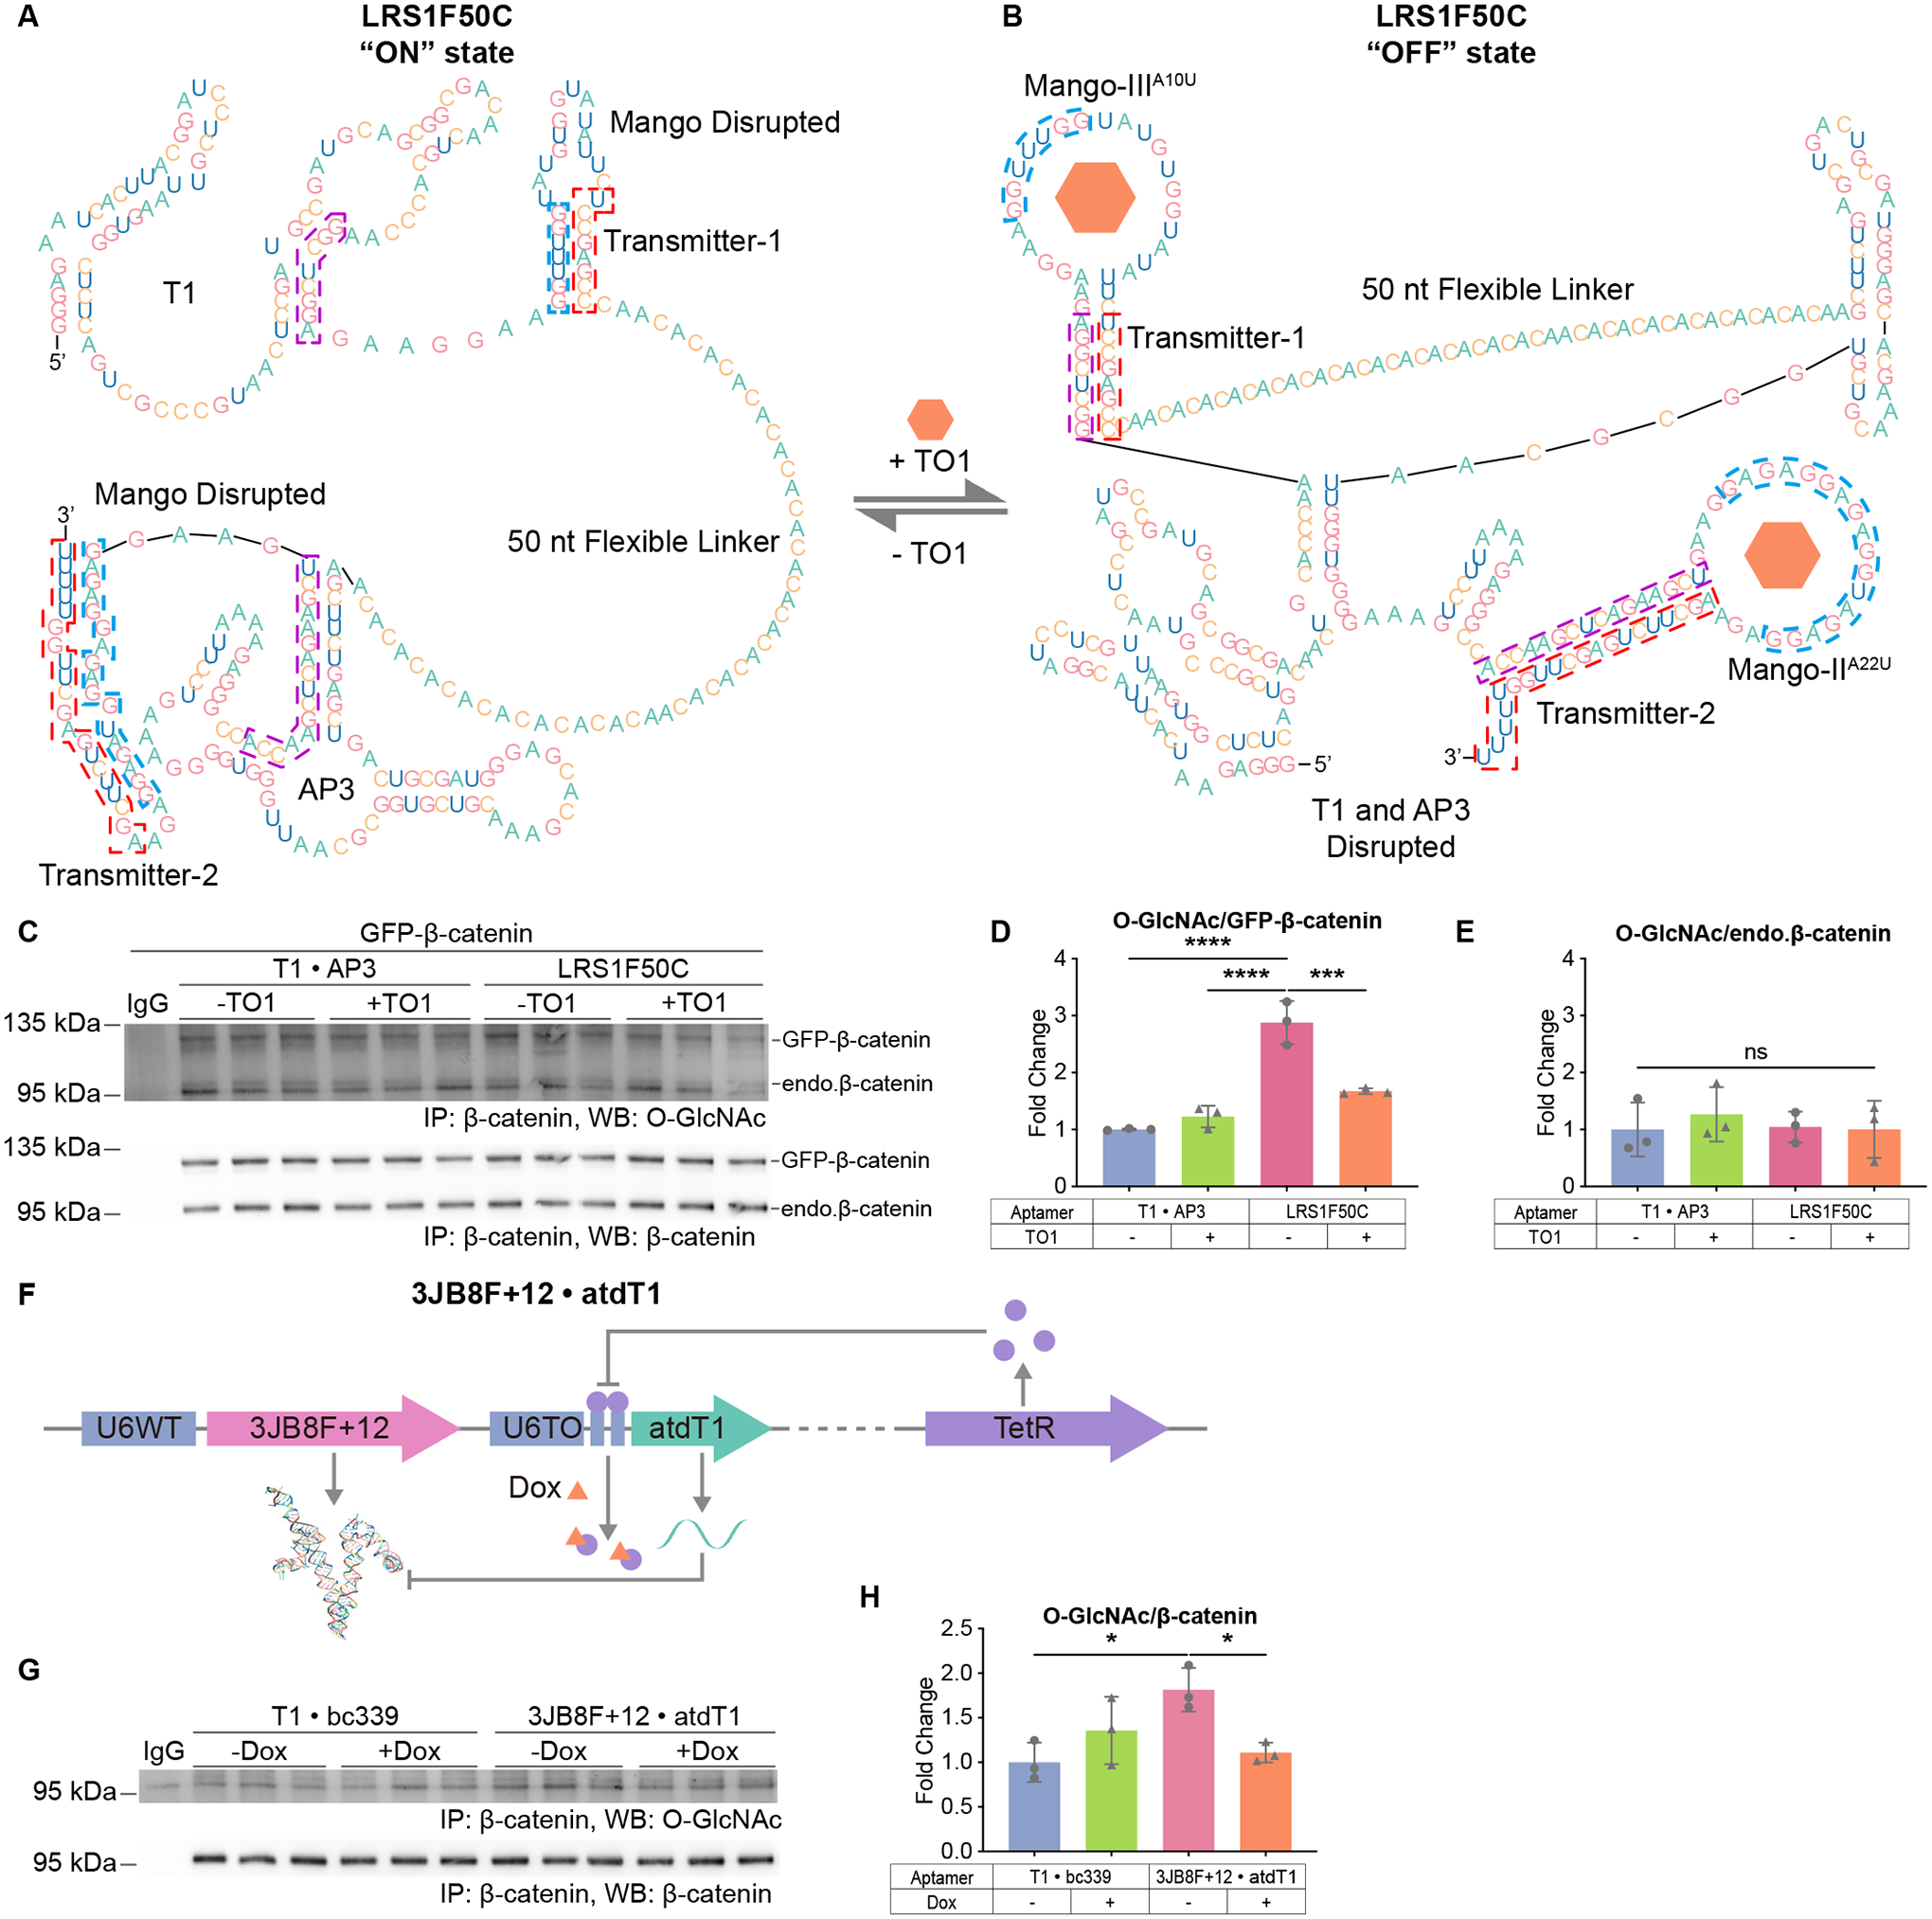
(A) and (B) Schematics of LRS1F50C and its conformation transitions. The transmitter elements are boxed in red, their alternative binding sequences are boxed in blue and purple. (A) The “ON” state of LRS1F50C. (B) The “OFF” state of LRS1F50C.
(C) to (E) IP-WB on cells expressing GFP-β-catenin and the indicated aptamers, and treated with 750 μM TO1 (+TO1) or equal volume of DMF (−TO1). (D) and (E) Quantification of (C). N=3.
(F) Schematic of controlling 3JB8F+12 with a Tet-On system.
(G) and (H) IP-WB on cells transfected with the indicated plasmids, and treated with Dox (+Dox) or equal volume of DMSO (−Dox). (H) Quantification of (G). N=3.
Two-way ANOVA test. Data are represented as mean ± SD. ns, p ≥ 0.05; *, p < 0.05; ***, p < 0.001; ****, p < 0.0001.
We also used a Tet-On inducible expression system to control the function of DS aptamers. In this system, 3JB8F+12 is constitutively expressed, driven by a wild-type U6 promoter (U6WT). An antidote RNA of T1 (atdT1) is expressed under an inducible promoter (U6TO), which combines a truncated U6 promoter with two Tet operator elements. Doxycycline (Dox) activates the expression of atdT1, which disrupts the folding of 3JB8F+12 (Figure 7F). In cells, this system induced O-GlcNAcylation on endogenous β-catenin in the absence of Dox, and addition of Dox rendered it inactive (Figures 7G, 7H). Since aptamers are short-lived in cells (Figures 1J, 2B), inducible expression could allow the dynamic control of DS aptamers at high time-resolution.
Taken together, using riboswitches or the Tet-On system, we showed the proof-of-principle that DS aptamers can be used for inducible regulation of protein-specific O-GlcNAcylation. Further optimization on the riboswitches and the Tet-On system are necessary to improve the specificity and dynamic ranges of these tools.
DISCUSSION
We developed DS aptamers that induce protein-specific O-GlcNAcylation, without changing the activity of OGT or OGA, or tagging these enzymes that interferes with their normal functions. Using these tools, we found that O-GlcNAc regulates β-catenin by tuning its interactions with other proteins like β-TrCP and EZH2. Riboswitches or inducible expression systems can be used for the dynamic control of DS aptamers. The modular feature endows DS aptamers broad potential applications, such as regulating other PTMs, facilitating the formation of protein complexes, and even inducing proximity between proteins and/or organelles.
Unmapped O-GlcNAc Sites on β-catenin
Our research reveals unmapped O-GlcNAc sites on β-catenin (Figures S3A to S3J). We also find that O-GlcNAc on β-catenin regulates its interactions with KAT2A and EP300 (Figures S5, S6). Considering that β-catenin binds EP300 and KAT5 via its C-terminus41,59, and that O-GlcNAc interplays with phosphate on Ser675 (Figure 3C), some of the unmapped sites probably reside in this region. O-GlcNAc stabilizes the GFP-β-catenin4A mutant (Figures S3B, S3F). Since O-GlcNAc stabilizes β-catenin by inhibiting its interaction with β-TrCP (this study), which recognizes phosphorylation on Ser33 and Ser3715, some of the unmapped sites could be near this region. Mapping these sites will be important for investigating the site-specific effects of O-GlcNAc in the future.
Critical Roles of the Linker in DS Aptamers
The linker domain, which critically affects the efficacy of DS aptamers, can adopt either flexible or folded structures. Our optimization of the folded linkers reveals that in a DS aptamer, both the distance between the two individual aptamers and their orientations are important factors. Folded linkers tend to increase the efficacy of DS aptamers (Figures 2C, 2D, 2J; 4D, 4F, 4I to 4L), probably because 1) they induce higher degrees of proximity than flexible linkers; and 2) the folding of these linkers is highly spontaneous (ΔG ≪ 0), which facilitates the folding of the aptamer motifs. Meanwhile, the rigidity of folded linkers seems to reduce the degrees of freedom of the bound proteins, so that some variations of these DS aptamers do not increase O-GlcNAcylation. Therefore, when using these DS aptamers to target a new protein, an optimization that covers 0 – 11 bp variations of the RNA helix (0 – 360° rotation) will be needed. Alternative choices are folded linkers with more flexibility, like the 4-way RNA junction we used in this study (Figure 2I). In this linker, the H1 and H2 helices “swings”, which provides the bound proteins higher degrees of freedom.
The rigidity of folded linkers could provide better site-selectivity when inducing O-GlcNAcylation. Though NL1F30 is no more effective than 3JB1F+6 on inducing O-GlcNAcylation on the GFP-β-catenin mutant (Figures S3A, S3E), it is much more effective in stabilizing the protein (Figures S3B, S3F), indicating that the two DS aptamers have different site-selectivity. On 3JB1F+6, the rigid RNA helix restricts the bound proteins so that only certain O-GlcNAc sites on β-catenin are accessible to OGT, thus O-GlcNAcylation is preferably induced on these residues. Therefore, the substrate protein could be “rotated” gradually by introducing serial additions or deletions to the RNA helix where it resides, and O-GlcNAc on different sites can be induced.
Limitations of the Study
We used IP-WB and mass-shift assay to detect O-GlcNAc on β-catenin. Antibodies of β-catenin were used to precipitate the protein in IP, or to detect its shifted bands in WB. However, most available antibodies recognize β-catenin on its N- or C- terminus, where O-GlcNAc sites are identified or indicated in this study. We have found that O-GlcNAc and PEG at or near the epitope inhibits antibody recognition, thus the aptamer-induced O-GlcNAcylation in this study may be underestimated.
We show proof-of-principle of using riboswitches and Tet-On system to control DS aptamers, further optimization is needed on their designs. Also, the T1 and bc339 aptamers can be optimized for higher affinity and shorter lengths. Our data suggests unidentified O-GlcNAc sites on β-catenin but we did not map them, thus the site-selectivity of DS aptamers are speculative. In future studies, site-mapping will be needed to confirm the physiological relevance of the aptamer-induced O-GlcNAcylation in this study. The mechanism of EZH2-dependent transcription activation and repression also awaits investigation.
STAR METHODS
RESOURSE AVAILABILITY
Lead Contact
Further information and requests for resources and reagents should be directed to and will be fulfilled by the lead contact, Dr. Gerald W. Hart (gwhart@jhmi.edu).
Materials Availability
Plasmids generated in this study have been deposited to Addgene. Cell lines generated in this study are available from the lead contact with a complete Materials Transfer Agreement.
Data and Code Availability
CUT&RUN-seq and RNA-seq data have been deposited at GEO and are publicly available as of the date of publication. Accession numbers are listed in the key resources table. All other data have been deposited at Figshare and are publicly available as of the date of publication. The DOI is listed in the key resources table.
This paper does not report original code.
Any additional information required to reanalyze the data reported in this paper is available from the lead contact upon request.
KEY RESOURCES TABLE
| REAGENT or RESOURCE | SOURCE | IDENTIFIER |
|---|---|---|
| Antibodies | ||
| Mouse monoclonal anti-O-GlcNAc IgM (strain CTD110.6) | Comer et al.81 Produced in the lab | N/A |
| Rabbit polyclonal anti-OGT (AL28) | Iyer et al.82 Produced in the lab | N/A |
| Rabbit polyclonal anti-OGT (AL24) | Kreppel et al.80 Produced in the lab | N/A |
| Chicken polyclonal anti-OGA IgY (345) | Butkinaree et al.83 Produced in the lab | N/A |
| Mouse monoclonal anti-β-Catenin (clone 14) | BD Biosciences | Cat#: 610153; RRID: AB_397555 |
| Rabbit polyclonal anti-β-Catenin | Cell Signaling Technology | Cat#: 9562; RRID: AB_331149 |
| Rabbit polyclonal anti-β-Catenin | ProteinTech | Cat#: 17565-1-AP; RRID: AB_2088102 |
| Rabbit monoclonal anti-Non-phospho (Active) β-Catenin (Ser33/37/Thr41) (D13A1) | Cell Signaling Technology | Cat#: 8814; RRID: AB_11127203 |
| Rabbit monoclonal anti-Non-phospho (Active) β-Catenin (Ser45) (D2U8Y) | Cell Signaling Technology | Cat#: 19807; RRID: AB_2650576 |
| Recombinant Rabbit polyclonal anti-phospho-β-Catenin (Ser33/37) (4HCLC) | Invitrogen | Cat#: 711404; RRID: AB_2633009 |
| Rabbit polyclonal anti-phospho-β-Catenin (Ser45) | Cell Signaling Technology | Cat#: 9564; RRID: AB_331150 |
| Rabbit monoclonal anti-phospho-β-Catenin (Ser552) (D8E11) | Cell Signaling Technology | Cat#: 5651; RRID: AB_10831053 |
| Rabbit monoclonal anti-phospho-β-Catenin (Ser675) (D2F1) | Cell Signaling Technology | Cat#: 4176, RRID: AB_1903923 |
| Recombinant Rabbit monoclonal anti-GFP | Invitrogen | Cat#: G10362; RRID: AB_2536526 |
| Mouse monoclonal anti-GFP (3E6) | Invitrogen | Cat#: A-11120; RRID: AB_221568 |
| GFP-Trap Magnetic Agarose | ProteinTech | Cat#: gtma-10; RRID: AB_2631358 |
| Rabbit polyclonal anti-β-TrCP | Invitrogen | Cat#: PA5-106884; RRID: AB_2854548 |
| Rabbit monoclonal anti-EZH2 (D2C9) | Cell Signaling Technology | Cat#: 5246; RRID: AB_10694683 |
| Mouse monoclonal anti-EP300 (clone NM11) | Active Motif | Cat#: 61401; RRID: AB_2716754 |
| Rabbit monoclonal anti-KAT2A/GCN5L2 (C26A10) | Cell Signaling Technology | Cat#: 3305; RRID: AB_2128281 |
| Rabbit polyclonal anti-KAT5 | ProteinTech | Cat#: 10827-1-AP; RRID: AB_2128431 |
| Rabbit monoclonal anti-H3K27me3 (C36B11) | Cell Signaling Technology | Cat#: 9733; RRID: AB_2616029 |
| Rabbit monoclonal anti-H3K9ac (C5B11) | Cell Signaling Technology | Cat#: 9649; RRID: AB_823528 |
| Rabbit polyclonal anti-β-Tubulin | Cell Signaling Technology | Cat#: 2146; RRID: AB_2210545 |
| Normal Rabbit IgG | Millipore | Cat#: 12-370; RRID: AB_145841 |
| Normal Rabbit IgG | Cell Signaling Technology | Cat#: 2729; RRID: AB_1031062 |
| Mouse IgG1 Isotype Control (MOPC-21) | Invitrogen | Cat#: MA1-10406; RRID: AB_2536774 |
| Goad anti-Mouse IgM (μ-chain specific) polyclonal secondary antibody, HRP-conjugated | Sigma-Aldrich | Cat#: A8786; RRID: AB_258413 |
| Goat anti-Rabbit IgG (Heavy Chain), Superclonal recombinant secondary antibody, HRP-conjugated | Invitrogen | Cat#: A27036; RRID: AB_2536099 |
| Goat anti-Mouse IgG (H+L), Superclonal recombinant secondary antibody, HRP-conjugated | Invitrogen | Cat#: A28177; RRID: AB_2536163 |
| Bacterial and virus strains | ||
| Stellar Competent Cells: E. coli HST08 strain | TaKaRa | Cat#: 636766 |
| NiCo21 (DE3) Competent E. coli | New England BioLabs | Cat#: C2529H |
| Biological samples | ||
| Chemicals, peptides, and recombinant proteins | ||
| TransIT-X2 | Mirus Bio | Cat#: MIR 6000 |
| Dulbecco’s Modified Eagle Medium (DMEM) | Gibco | Cat#: 10567014 |
| Fetal bovine serum (FBS) | Gibco | Cat#: 16140071 |
| Penicillin-Streptomycin | Gibco | Cat#: 15140163 |
| Hygromycin B | Gibco | Cat#: 10687010 |
| Puromycin dihydrochloride | Sigma-Aldrich | Cat#: P8833 |
| TrypLE Express Enzyme | Gibco | Cat#: 12604013 |
| 2-Propanol | Sigma-Aldrich | Cat#: I9516-500mL; CAS: 67-63-0 |
| Q5 High-Fidelity DNA Polymerase | New England BioLabs | Cat#: M0491 |
| SuperScript IV Reverse Transcriptase | Invitrogen | Cat#: 18090010 |
| TOPO TA Cloning Kit for Sequencing | Invitrogen | Cat#: 450030 |
| Amine Coupling Kit | GE Healthcare/Cytiva | Cat#: BR100050 |
| Antarctic Phosphatase | New England BioLabs | Cat#: M0289 |
| [γ−32P]-ATP | American Radiolabeled Chemicals | Cat#: ARP 0102F-250 μCi |
| T4 Polynucleotide Kinase | New England Biolabs | Cat#: M0201 |
| Acid-Phenol: Chloroform, pH 4.5 | Invitrogen | Cat#: AM9720 |
| Phenol: Chloroform, pH 8.05 | Invitrogen | Cat#: 15593031 |
| Yeast tRNA | Invitrogen | Cat#: AM7119 |
| Bovine Serum Albumin | New England BioLabs | Cat#: B9001 |
| IPTG | Invitrogen | Cat#: 15529019 |
| Protease Inhibitor Cocktail | Roche | Cat#: 11873580001 |
| Lysozyme | Thermo Scientific | Cat#: 89833 |
| PreScission Protease | GenScript | Cat#: Z02799 |
| PMSF | Roche | Cat#: 10837091001 |
| DNA Polymerase I, Large (Klenow) Fragment | New England BioLabs | Cat#: M0210 |
| Halt Phosphatase Inhibitor Cocktail | Thermo Scientific | Cat#: 78426 |
| RNaseOUT Recombinant Ribonuclease Inhibitor | Invitrogen | Cat#: 10777019 |
| Ribonucleoside Vanadyl Complex | New England BioLabs | Cat#: S1402 |
| TURBO DNase | Invitrogen | Cat#: AM2238 |
| GalTY289L | Gift from K. Moremen | N/A |
| UDP-GalNAz | Chemily | Cat#: SN02012 |
| Amino-dPEG12-Tris (dPEG12-Tris(m-dPEG11)3)3 | Quanta BioDesign | Cat#: 10482 |
| DBCO-NHS ester | Click Chemistry Tools | Cat#: A133 |
| Iodoacetamide | Sigma-Aldrich | Cat#: I1149 |
| Dichloromethane | Sigma-Aldrich | Cat#: D65100 |
| TaqMan Fast Advanced Master Mix | Applied Biosystems | Cat#: 4444557 |
| TRIzol Reagent | Invitrogen | Cat#: 15596026 |
| 16% Formaldehyde (w/v), Methanol-free | Thermo Scientific | Cat#: 28908 |
| TO1-3PEG-Biotin | Applied Biological Materials (abm) | Cat#: G955 |
| CKII peptide (PGGSTPVSSANMM) | Synthesized by JHMI Synthesis & Sequencing Facility | N/A |
| Critical commercial assays | ||
| Pierce BCA Protein Assay Kit | Thermo Scientific | Cat#: 23227 |
| UDP-Glo Glycosyltransferase Assay kit | Promega | Cat#: V6971 |
| In-Fusion HD Cloning Plus kit | TaKaRa Bio | Cat#: 638909 |
| Purelink Fast Low Endotoxin Midi Plasmid Purification kit | Invitrogen | Cat#: A35892 |
| Pierce Protein A/G Magnetic Beads | Thermo Scientific | Cat#: 88802 |
| Ni-NTA Agarose | Qiagen | Cat#: 30210 |
| Pierce Glutathione Agarose Beads | Thermo Scientific | Cat#: 16100 |
| NuPAGE 4 to 12%, Bis-Tris, 1.0 mm, Midi Protein Gel, 20-well | Invitrogen | Cat#: WG1402BOX |
| Amersham Hybond P 0.2 PVDF membrane | GE Healthcare/Cytiva | Cat#: 10600021 |
| SuperSignal West Femto ECL Substrate | Thermo Scientific | Cat#: 34095 |
| SuperSignal West Pico PLUS ECL Substrate | Thermo Scientific | Cat#: 34577 |
| PARIS Kit | Invitrogen | Cat#: AM1921 |
| Duolink PLA Reagents | Sigma-Aldrich | Cat#: DUO92001, DUO92005, DUO92013, DUO82049 |
| AlexaFluor 488 phalloidin | Invitrogen | Cat#: R37110 |
| AlexaFluor 555 phalloidin | Invitrogen | Cat#: R37112 |
| ProLong Glass Antifade Mountant with NucBlue Stain | Invitrogen | Cat#: P36985 |
| CUTANA ChIC/CUT&RUN Kit | EpiCypher | Cat#: 14-1048 |
| Qubit 1X dsDNA HS Assay Kit | Invitrogen | Cat#: Q33230 |
| NEBNext Ultra II DNA Library Prep with Sample Purification Beads | New England BioLabs | Cat#: E7103L |
| NEBNext Multiplex Oligos for Illumina (96 Unique Dual Index Primer Pairs) | New England BioLabs | Cat#: E6440S |
| Nano-Glo Dual-Luciferase Reporter Assay System | Promega | Cat#: N1610 |
| Deposited data | ||
| Human Reference Genome GRCh38.p13 | Ensembl | http://www.ensembl.org/Homo_sapiens/Info/Index |
| Escherichia coli Reference Genome ASM584v2 (str. K12 substr. MG1655) | Ensembl Bacteria | https://bacteria.ensembl.org/Escherichia_coli_str_k_12_substr_mg1655_gca_000005845/Info/Index |
| CUT&RUN Sequencing Data (Raw and Analyzed) | This paper | GEO: GSE190172 |
| CUT&RUN Sequencing Data, shβ-catenin samples (Raw and Analyzed) | This paper | GEO: GSE214775 |
| CUT&RUN Sequencing Data, Ac5S treated samples (Raw and Analyzed) | This paper | GEO: GSE214774 |
| RNA Sequencing Data (Raw and Analyzed) | This paper | GEO: GSE189378 |
| RNA Sequencing Data, Ac5S treated samples (Raw and Analyzed) | This paper | GEO: GSE189622 |
| RNA Sequencing Data, shEZH2 samples (Raw and Analyzed) | This paper | GEO: GSE214777 |
| Raw and analyzed data of this paper | This paper | Figshare: https://doi.org/10.6084/m9.figshare.17129945.v4 |
| Experimental models: Cell lines | ||
| HEK293T | ATCC | Cat#: CRL-3216, RRID: CVCL_0063 |
| L Wnt-3A | Willert et al.79 ATCC | Cat#: CRL-2647; RRID: CVCL_0635 |
| T1 | This paper | N/A |
| NL1F50 | This paper | N/A |
| 3JB8F+12 | This paper | N/A |
| shβ-catenin | This paper | N/A |
| shEZH2 | This paper | N/A |
| Experimental models: Organisms/strains | ||
| Oligonucleotides | ||
| DNA oligos for SELEX, see Table S6 | This paper | N/A |
| Primers and Probes for TaqMan Assays, see Table S6 | This paper | N/A |
| Aptamer Sequences, see Table S7 | This paper | N/A |
| DNA oligo: NH2-T24: /5AmMC6/TTTTTTTTTTTTTTTTTTTTTTTT | Chang et al.73 Synthesized by IDT | N/A |
| Recombinant DNA | ||
| pET24a-ncOGT-FL | This paper | RRID: Addgene_190821 |
| pET24a-ncOGT-TPR | This paper | RRID: Addgene_190822 |
| pET28a-β-catenin | Gift from R. Moon, unpublished | RRID: Addgene_17198 |
| pGEX-6P-1-CpOGA | Rao et al.35 | N/A |
| pEGFP-β-catenin_WT | Murase et al.76 | RRID: Addgene_16071 |
| pEGFP-β-cateninS23A, T40A, T41A, T112A | This paper | RRID: Addgene_190824 |
| pEGFP-C1-ERα | Stenoien et al.77 | RRID: Addgene_28230 |
| mEmerald c-SRC | Gift from M. Davidson, unpublished | RRID: Addgene_54118 |
| GFP-AMPKα2 | Hudson et al.78 | N/A |
| pSilencer2.1-U6-T1 | This paper | RRID: Addgene_190825 |
| pSilencer2.1-U6-AP3 | This paper | RRID: Addgene_190826 |
| pSilencer2.1-U6-17-6 (Non-aptamer RNA) | This paper | RRID: Addgene_190827 |
| pSilencer2.1-U6-T1-U6-AP3 (T1 ∙ AP3) | This paper | RRID: Addgene_190828 |
| pSilencer2.1-U6-NL1F30 | This paper | RRID: Addgene_190829 |
| pSilencer2.1-U6-NL1F35 | This paper | RRID: Addgene_190830 |
| pSilencer2.1-U6-NL1F50 | This paper | RRID: Addgene_190831 |
| pSilencer2.1-U6-3JB1F | This paper | RRID: Addgene_190832 |
| pSilencer2.1-U6-3JB1F+2 | This paper | RRID: Addgene_190833 |
| pSilencer2.1-U6-3JB1F+4 | This paper | RRID: Addgene_190834 |
| pSilencer2.1-U6-3JB1F+6 | This paper | RRID: Addgene_190835 |
| pSilencer2.1-U6-3JB1F+8 | This paper | RRID: Addgene_190836 |
| pSilencer2.1-U6-3JB1F+10 | This paper | RRID: Addgene_190837 |
| pSilencer2.1-U6-3JB1F+12 | This paper | RRID: Addgene_190838 |
| pSilencer2.1-U6-3JB1R | This paper | RRID: Addgene_190839 |
| pSilencer2.1-U6-3JB1R+2 | This paper | RRID: Addgene_190840 |
| pSilencer2.1-U6-3JB1R+4 | This paper | RRID: Addgene_190841 |
| pSilencer2.1-U6-3JB1R+6 | This paper | RRID: Addgene_190842 |
| pSilencer2.1-U6-3JB1R+8 | This paper | RRID: Addgene_190843 |
| pSilencer2.1-U6-3JB1R+10 | This paper | RRID: Addgene_190844 |
| pSilencer2.1-U6-3JB1R+12 | This paper | RRID: Addgene_190845 |
| pSilencer2.1-U6-4JC1FF | This paper | RRID: Addgene_190846 |
| pSilencer2.1-U6-4JC1RR | This paper | RRID: Addgene_190847 |
| pSilencer2.1-U6-bc339 | This paper | RRID: Addgene_190848 |
| pSilencer2.1-U6-T1-U6-bc339 (T1 ∙ bc339) | This paper | RRID: Addgene_190849 |
| pSilencer2.1-U6-NL8F50 | This paper | RRID: Addgene_190850 |
| pSilencer2.1-U6-NL8F70 | This paper | RRID: Addgene_190851 |
| pSilencer2.1-U6-NL8F100 | This paper | RRID: Addgene_190852 |
| pSilencer2.1-U6-3JB8F+4 | This paper | RRID: Addgene_190853 |
| pSilencer2.1-U6-3JB8F+12 | This paper | RRID: Addgene_190854 |
| pSilencer2.1-U6-3JB8R+12 | This paper | RRID: Addgene_190855 |
| pSilencer2.1-U6-LRS1F50C | This paper | RRID: Addgene_190856 |
| TOPFlash | Veeman et al.85 | RRID: Addgene_12456 |
| FOPFlash | Veeman et al.85 | RRID: Addgene_12457 |
| pNL1.1.TK[Nluc/TK] | Promega | Cat#: N1501 |
| TRC2-pLKO.5-scrambled | Sigma | Cat#: SHC216 |
| TRC2-pLKO.5-shOGT | Sigma | Cat#: TRCN0000286200 |
| TRC2-pLKO-shβ-catenin | Sigma | Cat#: TRCN0000314921 |
| pLKO.1-shEZH2 | Sigma | Cat#: TRCN0000040077 |
| pMD2.G | Gift from D. Trono, unpublished | RRID: Addgene_12259 |
| psPAX2 | Gift from D. Trono, unpublished | RRID: Addgene_12260 |
| pcDNA3.1-OGT_opt | This paper | RRID: Addgene_190858 |
| pcDNA3.1-empty | This paper | RRID: Addgene_190859 |
| Software and algorithms | ||
| cutadapt | Martin65 | https://cutadapt.readthedocs.io/en/stable/ |
| Trim Galore! | Krueger et al.88 | https://github.com/FelixKrueger/TrimGalore |
| FASTAptamer | Alam et al.66 | https://github.com/FASTAptamer/FASTAptamer |
| RNAfold webserver | Lorenz et al.67 | http://rna.tbi.univie.ac.at/cgi-bin/RNAWebSuite/RNAfold.cgi |
| RNAStructure, version 6.3 | Reuter and Mathews68 | https://rna.urmc.rochester.edu/RNAstructure.html |
| RNAComposer | Popenda et al.69 Antczak et al.70 | http://rnacomposer.cs.put.poznan.pl/ |
| QRNAS | Stasiewicz et al.71 | http://genesilico.pl/software/standalone/qrnas |
| UCSF ChimeraX | Pettersen et al.72 | https://www.cgl.ucsf.edu/chimerax/ |
| Biacore Evaluation Software | GE Healthcare/Cytiva | 29310602 |
| ggplot2 | Wickham74 | https://ggplot2.tidyverse.org |
| Fiji | Schindelin et al.75 | https://imagej.net/software/fiji/ |
| BioVoxxel Toolbox | Brocher86 | https://imagej.net/plugins/biovoxxel-toolbox |
| HISAT2 | Kim et al.89 | http://daehwankimlab.github.io/hisat2/ |
| featureCounts | Liao et al.90 | http://subread.sourceforge.net/ |
| annotateMyIDs | Dunning91 | https://github.com/markdunning/galaxy-annotateMyIDs |
| DESeq2 | Love et al.92 | https://bioconductor.org/packages/release/bioc/html/DESeq2.html |
| EnhancedVolcano | Blighe et al.93 | https://github.com/kevinblighe/EnhancedVolcano |
| Bowtie2 | Langmead and Salzberg96 | http://bowtie-bio.sourceforge.net/bowtie2/index.shtml |
| samtools | Li et al.97 | http://www.htslib.org/ |
| bedtools | Quinlan and Hall98 | https://bedtools.readthedocs.io/en/latest/ |
| SEACR | Meers et al.99 | https://github.com/FredHutch/SEACR |
| The Integrative Genomics Viewer (IGV) | Robinson et al.105 | http://software.broadinstitute.org/software/igv/home |
| Diffbind | Stark and Brown100 Ross-Innes et al.101 | https://bioconductor.org/packages/release/bioc/html/DiffBind.html |
| ChIPseeker | Yu et al.102 | https://bioconductor.org/packages/release/bioc/html/ChIPseeker.html |
| profileplry | Carroll and Barrows103 | https://www.bioconductor.org/packages/release/bioc/html/profileplyr.html |
| GraphPad Prism | GraphPad Software | https://www.graphpad.com/ |
| Other | ||
| Biacore T100 SPR system | GE Healthcare/Cytiva | |
| Sensor Chip PEG, Series S | GE Healthcare/Cytiva | Cat#: 29239810 |
| Slide-A-Lyzer G2 Dialysis Cassettes, 20K MWCO | Thermo Scientific | Cat#: 87735 |
| Vivaspin protein concentrator, 30K MWCO | GE Healthcare/Cytiva | Cat#: 28932235 |
| SpectraMax i3x | Molecular Devices | |
| iBright FL 1500 Imaging System | Invitrogen | Cat#: A44115 |
| 8-well Chamber Slide w/ removable wells | Thermo Scientific | Cat#: 154941 |
| HybEZ II Hybridization System | Advanced Cell Diagnostics | Cat#: 321710 |
| Amersham Imager 600 RGB | GE Healthcare/Cytiva | Cat#: 29-0834-67 |
EXPERIMENTAL MODEL AND SUBJECT DETAILS
Cell Lines
The HEK293T (CRL-3216) and L Wnt-3A (CRL-2647) cell lines were obtained from ATCC. The T1, NL1F50 and 3JB8F+12 cell lines were generated by transfecting the respective plasmids into HEK293T cells using TransIT-X2 (Mirus Bio, MIR 6000), and selected with 500 μg/mL hygromycin. Cell lines expressing shβ-catenin and shEZH2 were generated by lentiviral transduction of HEK293T cells, and selected with 1 μg/mL puromycin. Experimental details are described below.
METHOD DETAILS
SELEX
Library Construction
Systematic evolution of ligands by exponential enrichment (SELEX) was based on previous publications60–62. DNA oligos used in SELEX are listed in Table S6. The initial single-stranded DNA (ssDNA) libraries (L1-N60-ncs for OGT aptamers, L2-N50-ncs for β-catenin aptamers) were synthesized by Integrated DNA Technologies (Coralville, IA, USA), using a customized recipe (A: 29%, C: 29%, G: 19%, T: 23%) for the random regions. ssDNA libraries were purified by Polyacrylamide gel electrophoresis (PAGE, Invitrogen EC6875BOX) and eluted from gel with Probe Elution Buffer (0.5 M Sodium Acetate, 1 mM EDTA, 0.2% SDS). Purified ssDNA was converted to double-stranded DNA (dsDNA) by annealing to L1–5’-T7-cs (for OGT aptamers) or L2–5’-T7-cs (for β-catenin aptamers) and Klenow extension (NEB M0210). RNA libraries were synthesized from PAGE-purified dsDNA libraries by in vitro transcription with T7 RNA polymerase (NEB M0251). RNA libraries were PAGE-purified, precipitated with isopropanol (Sigma-Aldrich I9516–500mL), washed with 70% ethanol and dissolved in nuclease-free water.
Partition and Amplification
To improve target specificity and to minimize PCR bias, “Toggle SELEX” and “RAPID-SELEX” was applied in the partition and amplification steps63,64. Detailed schemes of partition and amplification are described in Table S2. Partition of library was performed in Aptamer Binding Buffer (ABB, 20 mM Tris-HCl, 150 mM NaCl, 5 mM MgCl2, 0.05% Tween-20, pH 7.5) for OGT aptamers, or Intracellular Buffer (IB, 20 mM HEPES, 110 mM KCl, 10 mM NaCl, 0.4 mM MgCl2, 5 mM KH2PO4, 0.05% Tween-20, pH 7.2) for β-catenin aptamers. Each RNA library and its desired target protein were incubated at 37 °C for 1 hr with rotation. The target proteins were either pre-immobilized on His-tag binding magnetic beads (MB, Invitrogen 10103D), or captured by nitrocellulose membrane disks (NC, Millipore HATF02500) after incubation. Unbound RNA sequences were washed away with 1 mL of ABB or IB. Elution of bound RNA was either by Proteinase K (Thermo Scientific EO0492) digestion at 37 °C for 30 min followed by denaturation in 100μL formamide (Thermo Scientific 17899) at 95°C for 2 minutes, or with 300 mM imidazole. Eluted RNA was converted to cDNA using SuperScript IV Reverse Transcriptase (Invitrogen 18090010) and RT primers (L1–3’-const-ncs for OGT aptamers; L2–3’-const-ncs for β-catenin aptamers), then PCR amplified using Taq Polymerase (NEB M0273L) for 16 cycles. Counter selection (CS) was included in indicated rounds with 1 μg Hexa-His peptide (Abbiotec 350220) immobilized onto MB. In certain rounds of selection, eluted RNA was proceeded to the next selection cycles without amplification, in order to reduce amplification bias and time consumption64. Eluted RNA in the final cycles was converted to cDNA by RT-PCR (Invitrogen 18090010).
Library Sequencing and Data Analysis
For OGT aptamers, the final DNA library was cloned into the pCR4-TOPO plasmid using the TOPO TA cloning kit (Invitrogen 450030) and transformed into Chemically Competent E. coli cells (TaKaRa 636766). 84 colonies were subjected to plasmid purification and Sanger-sequencing at the JHMI Synthesis & Sequencing Facility. Frequency of all resulted sequences were calculated, and the most represented sequence (T1) was chosen for validation.
For β-catenin aptamers, enriched DNA libraries from rounds 5 and 8 were submitted for Next-Generation Sequencing at the JHMI Transcriptomics and Deep Sequencing Core Facility, on an Illumina HiSeq 2500 sequencer.
Analysis of the sequencing data started from trimming of the sequencing adaptors and the constant flanking regions using cutadapt65. Enrichment analysis was carried out using FASTAptamer66. Frequencies of all sequences in each library were counted and clustered based on their similarity. Enrichment of each cluster was assessed across different SELEX rounds. The most enriched sequence (bc339) was chosen for validation.
RNA Structure Prediction
Secondary structures of RNA were predicted using the RNAfold webserver67 and drawn with StructureEditor in the RNAStructure 6.3 package68. Tertiary structures were predicted using RNAComposer69,70, refined by QRNAS71, and visualized with UCSF ChimeraX72.
Surface Plasmon Resonance (SPR)
For SPR, Multi Cycle Kinetics was performed on a Biacore T100 (GE Healthcare/Cytiva) instrument at 25 °C, following the protocol by Chang et al.73. In assay preparation, an amine-modified T24 DNA linker (NH2-T24) was immobilized to ~100 RU in both reference and test flow cells on a sensorchip PEG (GE Healthcare/Cytiva 29239810), using the Amine Coupling Kit (GE Healthcare/Cytiva BR100050). RNA of T1 or bc339 with a A28 tail on the 3’-end were diluted to 100 nM in ABB (T1) or IB + 200 mM NaCl (bc339). Diluted RNA solutions were denatured at 65 °C for 5 min and re-folded at room temperature for 5 min. At the beginning of each cycle, the A28-tagged RNA solutions were injected into the test flow cell and captured by the immobilized T24 DNA linker. Protein analytes were diluted in ABB (OGT) or IB (β-catenin) and injected sequentially into both reference and test flow cells, at a rate of 30 μL/min. Concentrations tested are listed in the figure legends. Each concentration was duplicated. At the end of each cycle, surface was regenerated with 25 mM of NaOH for 30 sec at 30 μL/min, which removed the captured RNA and protein. Data was analyzed using the Biacore Evaluation Software (GE Healthcare/Cytiva), where the overlaid sensorgrams were fitted into a 1:1 binding model. Curves were exported and replotted with ggplot274 for better illustration.
Radiolabeled Dot-Blot Assay
Radio-Labeling of RNA
For end preparation, the terminal phosphate groups of RNA were removed by Antarctic Phosphatase (NEB M0289). Then the 5’-end of 200 pmol RNA was labeled with 10 μCi of [γ−32P]-ATP (American Radiolabeled Chemicals, ARP 0102F-250 μCi) using T4 Polynucleotide Kinase (NEB M0201). Labeled RNA was extracted with Acid-Phenol: Chloroform, pH4.5 (Invitrogen AM9720), precipitated with isopropanol, washed with 70% ethanol, and dissolved in nuclease-free water.
Dot-Blot Assay
Radiolabeled RNA was diluted in ABB, denatured at 65 °C for 5 min and re-folded at room temperature for 5 min. Then 100 nM of RNA was incubated with multiple concentrations (see figure legends) of purified ncOGT at 37 °C for 30 min. The volume of each assay was 50 μL. 1 μM yeast tRNA (Invitrogen AM7119) and 50 μg/mL Bovine Serum Albumin (BSA, NEB B9001S) were included as non-specific competitors. After incubation, the reactions were filtered sequentially through a nitrocellulose membrane (Amersham 10600042) and a Nylon membrane (Invitrogen AM10102), on a Bio-Dot Microfiltration Apparatus (Bio-Rad 170–6545). Membranes were washed with 100 μL ABB to remove unbound RNA. Washed membranes were air-dried and exposed to a film (Amersham 28906836) for 2 hr. The film was developed and scanned, and the image was analyzed with Fiji75. Quantified data was fitted into a Michaelis-Menten model using GraphPad Prism.
Protein Expression and Purification
Bacterial Expression of Recombinant Proteins
For OGT-FL, TPR and β-catenin: NiCo21 (DE3) Competent E.coli (NEB C2529H) transformed with a plasmid (pET24a-ncOGT-FL, pET24a-TPR or pET28a-β-catenin) was inoculated into 50 mL LB medium for overnight culture at 37 °C, 250 rpm. On Day 2, the whole culture was transferred into 500 mL LB medium, and the growth was observed by measuring its OD600 every 30 min. When the OD600 reached 1.2, the whole culture was cooled on ice for 15 min. Protein expression was induced by adding 200 μM (OGT-FL and TPR) or 500 μM (β-catenin) IPTG (Invitrogen 15529019). Then the culture was continued at 16 °C, 180 rpm for 24 hr. Cells were harvested by centrifugation at 4°C, 5000 rcf for 15 min and washed with cold PBS.
For CpOGA: NiCo21 (DE3) cells transformed with pGEX-6P-1-CpOGA35 was cultured and induced in the same way as above, except that protein expression was induced with 200 μM IPTG at 22°C, 250 rpm for 24 hr.
Protein Purification
For OGT-FL, TPR and β-catenin: All steps in protein purification were performed at 4 °C. Protease Inhibitor Cocktail (Roche 11873580001) was added into the Stock, Lysis, Wash and Elution Buffers below. Bacterial pellet was re-suspended in 10 mL Stock Buffer (50 mM Tris, 300 mM NaCl, pH 8.0). Cells were lysed by adding 10 mL Lysis Buffer (Stock Buffer + 10 mM Imidazole, 1% Triton X-100, and 10 mg/ml Lysozyme (Thermo Scientific 89833)) and incubate on ice for 30 min. Lysate was homogenized by sonication on ice for 5 cycles of 12 sec ON, 30 sec OFF at power 4 (Fisher Scientific F550), centrifugation at 13,000 rcf for 15 min and collection of the supernatant. The supernatant was loaded onto a chromatography column packed with 2 mL Ni-NTA agarose slurry (Qiagen 30210) and passed the column twice under gravity flow. Then the column was washed with 45 mL Wash Buffer (Stock Buffer + 30 mM Imidazole), and protein was eluted with 4 mL Elution Buffer (Stock Buffer + 250 mM Imidazole). Elute was dialyzed three times against 4 L of Dialysis Buffer (20 mM Tris pH 7.5, 50 mM NaCl and 0.2 mM PMSF (Roche 10837091001) in a dialysis cassette (20K MWCO, Thermo Scientific 87735). The first and third dialysis were for 3 hr, and the second was for overnight. Dialyzed protein solution was concentrated with a Vivaspin protein concentrator (30K MWCO, Cytiva 28932235). Protein concentration was measured by BCA assay (Thermo Scientific 23227). Purified proteins were stored at −80 °C for up to a year.
For CpOGA: Bacterial pellet was re-suspended and lysed in the same way as above, except that the Stock Buffer and Lysis Buffer were replaced with Buffer A (50 mM HEPES, 250 mM NaCl, pH7.5) and Lysis Buffer A (Buffer A + 10 mg/mL lysozyme). The cleared lysate was loaded to an equilibrated column packed with 2 mL Glutathione Agarose Beads (Thermo Scientific 16100). The loaded column was capped and rotated for 2.5 hr at 4 °C, to capture the GST-tagged CpOGA from lysate. Then lysate was allowed to pass through the column by gravity, and the beads was washed with 20 mL Buffer A. The CpOGA protein was eluted by cleaving the GST-tag. The cleavage was performed by adding 100 U PreScission Protease (GenScript Z02799–100U) in 5 mL Cleavage Buffer (50 mM Tris-HCl, 150 mM NaCl, 1 mM EDTA, 1 mM DTT, pH 7.0 at 25 °C) to the column, and rotating for overnight at 4 °C. The elute was collected and dialyzed against 4 L of 1x TBS for overnight at 4 °C in a dialysis cassette (20K MWCO, Thermo Scientific 87735). The dialyzed protein solution was concentrated, quantified and stored as above.
OGT Activity Assay (UDP-Glo)
Activity of OGT was measured using the UDP-Glo Glycosyltransferase Assay kit (Promega V6971), following the manufacturer’s protocol. Assays were performed on a white 96-well half-area plate (Corning CLS3992–25EA). Each reaction contains 0.625 ng OGT, 50 μM CKII peptide substrate (PGGSTPVSSANMM, JHMI Synthesis & Sequencing Facility), 10 μM yeast tRNA and various concentrations (see figure legends) of RNA aptamer in 12.5 μL ABB. Reactions were incubated at room temperature for 15 min, and 12.5 μL UDP Detection Reagent was added to each reaction. After incubation at room temperature for 1 hr, luminescence was measured on a Plate Reader (SpectraMax i3x, Molecular Devices).
Cell Culture and Transfection
Cells were cultured in DMEM with 1 g/L glucose, pyruvate and GlutaMAX (Gibco, 10567022), supplemented with 10% heat-inactivated Fetal bovine serum (Gibco 16140071), 200 U/mL penicillin and 200 μg/mL streptomycin (Gibco 15140163). Culture medium was changed daily. Cells were cultured in a 37 °C incubator (Heracell VIOS 160i) with 5% CO2 and 95% humidity. For subculturing, cells were rinsed with PBS, monodispersed with TrypLE (Gicbo 12604013) and counted on a cell counter (Nexcelom Auto 1000). Cells were discarded when their passage numbers reached 15.
For plasmid transfection in 10 cm dishes, 2×10⁶ HEK293T cells were seeded per dish, and transfection was done after 24 hr (at 40% – 60% confluency). Desired amounts of plasmids were dissolved in 100 μL Opti-MEM medium (Gibco 51985034), and TransIT-X2 Transfection Reagent (Mirus Bio, MIR 6000) was added at a ratio of 4 μL of Reagent per 1 μg of DNA. The mixture was gently mixed, incubated at room temperature for 20 min and distributed evenly into the culture dish. Medium was changed to fresh DMEM at 6 hr post-transfection. Plasmid usage in transfection: To target OGT to GFP-β-catenin, 0.1 μg of GFP-β-catenin76 and 1 μg of each aptamer-encoding plasmid were co-transfected per 10 cm dish. To target OGT to other GFP-tagged proteins, 0.5 μg of GFP-Src (gift from M. Davidson, unpublished), or 1 μg of GFP-ERα/GFP-AMPKα277,78 and 2 μg of each aptamer-encoding plasmid were co-transfected per 10 cm dish. To target OGT to endogenous β-catenin, 1.5 μg of each plasmid was transfected per 10 cm dish. For cells cultured in different containers, the number of cells, amounts of DNA and transfection reagent were adjusted according to the bottom area of the container.
For cell treatments, Ac4-5SGlcNAc (Ac5S) was added into medium at 50 μM, for 20 hr; Thiamet-G (TMG) was used at 2 μM for 6 hr; TO1-biotin (TO1) was used at 750 nM for 8 hr. Wnt stimulation was by 50% (v/v) Wnt3A-conditioned medium for 4 hr.
Generation of Stable Cell Lines
For cells stably expressing T1, NL1F50 and 3JB8F+12: the desired plasmids were transfected into HEK293T cells as above and selected with 500 μg/mL hygromycin B (Gibco 10687010) in culture medium. The selection started at 24 hr post-transfection and lasted for ~3 weeks, till most of cells died and the survived cells grew confluent. Then the cells were sub-cultured and stored in liquid nitrogen.
Cells expressing shβ-catenin and shEZH2 were generated by lentiviral transduction.
Production of Lentivirus
6×10⁵ HEK293T cells were seeded on a 6 cm dish. After 24 hr, 1 μg of shβ-catenin (Sigma TRCN0000314921) or 1 μg of shEZH2 (Sigma TRCN0000040077) plasmids was co-transfected with 0.75 μg of psPAX2 (Addgene 12260) and 0.25 μg of pMD2.G (Addgene 12259). Culture medium was replenished at 6 hr post-transfection. Culture continued without medium change, and the first batch of medium was harvested at 48 hr post-transfection. Medium was replenished and the second bath of medium was harvested at 72 hr post-transfection. The two batches were combined, spun at 1250 rpm for 5 min to remove cell pellet, and stored at −80 °C in 1 mL aliquots.
Lentiviral Transduction and Selection
6×10⁵ HEK293T cells were seeded on a 6 cm dish. After 24 hr, culture medium was changed to fresh DMEM with 8 μg/mL DEAE-Dextran, and 1 mL of thawed lentivirus solutions was added to the cell, and mixed by gently rocking. Culture medium was changed at 24 hr post-transfection. Antibiotic selection started at 48 hr post-transfection with 1 μg/mL puromycin (Sigma-Aldrich P8833) in medium, and continued till most cells died and the survived cells grew confluent. Then the cells were sub-cultured and stored in liquid nitrogen.
Production of Wnt3A-Conditioned Medium
L Wnt-3A cells79 was sub-cultured at 1:10 in 15 cm dishes. Medium glucose level was monitored twice daily with OneTouch Ultra 2 meter and OneTouch Ultra Blue test strips. When glucose was below 20 mg/dL, it was replenished with 100 g/L glucose solution (Sigma-Aldrich G8270) that was filtered through 0.2 μm PES filter (Whatman 6896–2502), to about 120 mg/dL. The first batch of medium was harvested on the fourth day of culture, and fresh DMEM was added to the cells. Culture continued for another three days, and the second batch of medium was harvested. The two batches were combined, filtered through a 0.2 μm PES bottle-top filter (Fisher Scientific FB12566510), and stored at 4 °C for up to 6 months. This conditioned medium was diluted to 50% (v/v) with regular DMEM for cell treatment.
Molecular Cloning
For molecular cloning, we used the seamless cloning method using the In-Fusion HD Cloning Plus kit (TaKaRa Bio 638909), following manufacturer’s protocol.
Sequences encoding individual and DS aptamers were cloned into the pSilencer2.1-U6 hygro plasmid. The insert fragments were generated in three ways: Klenow extension, Gene Synthesis and PCR amplification. Klenow extension was used for fragments smaller than 100 bp without repetitive sequences. Two DNA oligos representing the 5’-end and 3’- end of the insert with 15–20 bp overhang were synthesized by Integrated DNA Technologies (Coralville, IA, USA). 1 nmol of each oligo was diluted in 20 μL Klenow Annealing Buffer (10 mM Tris-HCl, 10 mM MgCl2, pH 8.0), denatured at 95 °C for 2 min and annealed to each other at room temperature for 5 min. Extension reactions were carried out using Klenow Fragment (NEB M0210). DNA was purified on 4% agarose gel and extracted with a gel extraction kit (Takara Bio 740609). Inserts with repetitive sequences or longer than 100 bp, and codon-optimized sequences were synthesized by GeneArt (ThermoFisher) and GeneScript (New Jersy, USA). All other inserts were amplified by PCR. 15 bp overhangs with desired linearized vectors were included on both ends of all inserts. Vectors were linearized by inverse PCR using Q5 High-Fidelity DNA Polymerase (NEB M0491). Ligation reactions were conducted with the In-Fusion HD Cloning Plus kit (TaKaRa Bio 638909). After ligation, chemically competent cells (TaKaRa 636766) were transformed with the ligation reaction, and single colonies were picked for sanger-sequencing. Colonies with correct sequences were stored as glycerol stock (20% glycerol) at −80 °C. For transfection of cultured mammalian cells, plasmids were purified with the PureLink Low-Endotoxin Midiprep Kit (Invitrogen A35892).
Point mutations were introduced by inverse PCR with overlapping primers containing the desired mutations. Products of inverse PCR were purified on agarose gels, and self-ligated using the In-Fusion HD Cloning Plus kit (TaKaRa Bio 638909). The ligation reactions were transformed into competent cells, and single colonies were picked and sequenced as above.
Immunoprecipitation (IP), Co-IP and RNA-IP
For immunoprecipitation (IP) of β-catenin, cells were cultured in 10 cm dishes, and harvested with 500 μL RIPA buffer (20 mM Tris-HCl pH 7.5, 150 mM NaCl, 1% (w/v) sodium deoxycholate, 0.1% (w/v) SDS, 1% (v/v) NP-40, 50 mM NaF, 5 mM Na4P2O7, 1mM EDTA and 1mM EGTA). 1 mM PMSF, 1 mM DTT, 1 μM PUGNAc, 2 μM TMG, 50 mM GlcNAc, 1x Protease Inhibitor Cocktail (Roche 11873580001) and 1x Phosphatase Inhibitor Cocktail (Thermo Scientific 78426) were freshly added. Cell lysate was sonicated at power 4 for 10 sec (Fisher Scientific F550), centrifuged at 17,000 rcf for 15 min. Supernatant was collected and protein concentration was measured by BCA assay (Thermo Scientific 23227). IP reactions were assembled with 0.5 mg of cell lysate and 0.5 μg of anti-β-catenin antibody (BD Biosciences 610153) or IgG control (Invitrogen MA1–10406), and the volume was adjusted to 0.5 mL with IP buffer (20 mM Tris-HCl pH 7.4, 150 mM NaCl, 1% (v/v) TritonX-100, 50 mM NaF, 5 mM Na4P2O7, 1mM EDTA and 1mM EGTA) with inhibitors freshly added. IP reactions were rotated at 4 °C for overnight. On the next day, 7.5 μL Protein A/G magnetic bead slurry (Thermo Scientific 88802) was added, and reactions were rotated at room temperature for 1 hr. Beads were collected on a magnetic stand and washed 5 times with 1 mL IP buffer. Proteins were eluted with 10 μL 2× Laemmli Buffer (Bio-Rad 161–0737) and denatured at 95 °C for 3 min. Denatured samples were loaded on a 4–12% SDS-PAGE gel (Invitrogen WG1402BOX) and proceeded to Western Blot protocols.
For IP and co-immunoprecipitation (Co-IP) of GFP, the same method for IP was used, except cells were lysed with Co-IP Lysis Buffer (150 mM NaCl, 30 mM Tris pH7.5, 1 mM EDTA, 1% TritonX-100, 10% glycerol) with the same inhibitors. IP reactions were assembled with 1 mg of cell lysate and 5 μL of GFP-trap magnetic agarose beads (ProteinTech gtma-20, for GFP-β-catenin), or 2 μg of anti-GFP antibody (Invitrogen G10362, for other GFP-tagged proteins) or IgG control (CST 2729). On the next day, 20 μL Protein A/G magnetic bead slurry (Thermo Scientific 88802) was added to capture the antibody-antigen complex.
For RNA-IP, we adopted the IP protocol with some modifications. 1 mM MgCl2 was added into the RIPA and IP buffers for “+ Mg2+” samples. Cells were harvested in RIPA buffer with inhibitors, 100 U/mL RNaseOUT (Invitrogen 10777019) and 2 mM Ribonucleoside Vanadyl Complex (NEB S1402S) freshly added. IP reactions were assembled with 1 mg of cell lysate and 1 μg of anti-OGT antibody (AL24, purified in the lab)80, and the volumes were adjusted to 1 mL with IP buffer (inhibitors freshly added). For IgG control, 1 μg normal rabbit IgG (Millipore 12–370) was used instead of the antibody. On the next day, 15 μL Protein A/G magnetic bead slurry (Thermo Scientific 88802) was added to capture the antibody-OGT-RNA complex. After washing, residual DNA was digested by 20 units of Turbo DNase (Invitrogen AM2238) in 200 μL Turbo DNase Buffer at 37 °C for 30 min. Then proteins were digested by 100 μg Proteinase K (Invitrogen 25530049) at 50 °C for 30 min. RNA was extracted with Acid-Phenol: Chloroform, pH4.5 (Invitrogen AM9720), precipitated with isopropanol, washed with 70% ethanol, and dissolved in nuclease-free water.
CpOGA Treatment
CpOGA treatment was performed on total cell lysate before IP. Cells were harvested with Co-IP Lysis Buffer with 1 mM DTT, 1 mM PMSF and 1x Protease Inhibitor Cocktail (Roche 11873580001). PUGNAc and GlcNAc were not included in the lysis buffer so that CpOGA would not be inhibited. 50 μg of purified CpOGA or equal volume of PBS was added to 0.5 mg of lysate, and incubated at 37 °C for 1 hr. Then the reaction was cooled on ice and subjected to IP.
RT-qPCR
Purified RNA was first converted into cDNA using the SuperScript IV Reverse Transcriptase (Invitrogen 18090010) and RT primers (Table S6). A “RT -” control reaction without the enzyme was included for all samples. Synthesized cDNA was quantified by qPCR on a Stratagene Mx3000P (Agilent Technologies) using TaqMan Fast Advanced Master Mix (Applied Biosystems 4444557), and desired TaqMan assays (Table S6). Amount of residual genomic/plasmid DNA was subtracted from each sample using the readout from its “RT -” control.
Western Blot
Eluted IP reactions or 20 μg of total cell lysates (in Laemmli Buffer and denatured at 95 °C) were loaded on a 4–12% SDS-PAGE gel (Invitrogen WG1402BOX) and run at 160 V for 90 min. Gel was transferred to a 0.2 μm pore-sized PVDF membrane (GE Healthcare/Cytiva 10600021). Wet transfer was performed in a Criterion Blotter (Bio-Rad 1704070) at 0.45 A for 120 min in Bis-Tris Transfer Buffer (25 mM Bicine, 25 mM Bis-Tris, 1 mM EDTA and 10% (v/v) Methanol). After transfer, membrane was blocked at room temperature for 30 min with rocking, in Blocking Buffer (5% (w/v) BSA (Rockland BSA-1000) dissolved in TBS-T). Blocked membrane was incubated with primary antibody (diluted in Blocking Buffer unless indicated below), at 4 °C for overnight with rocking. On the next day, the membrane was washed for 3 times of 5 min in TBS-T with rocking. Washed membrane was incubated with HRP-conjugated secondary antibody diluted in Blocking Buffer at room temperature for 1 hr with rocking. Then the membrane was washed for 3 times of 5 min, and imaged with ECL reagent (Thermo Scientific 34095) on an iBright FL1500 Imaging system (Invitrogen A44115) or an Amersham Imager 600 RGB (GE Healthcare/Cytiva 29–0834-67) under Chemiluminescence mode.
The images were analyzed using Fiji75. Background signal was subtracted using a rolling-ball method (radius = 20 or 30), then the lanes were plotted, and band intensities were quantified. To quantify protein-specific O-GlcNAcylation, the band intensities from a O-GlcNAc blot were normalized to those of their corresponding protein-specific blot. Statistical analysis was performed with the GraphPad Prism software.
Dilutions of primary antibodies (in 5% (w/v) BSA unless indicated): anti-O-GlcNAc (CTD110.6)81 – 1:2000; anti-β-catenin (CST 9562) – 0.2 μg/mL; anti-β-catenin (ProteinTech 17565–1-AP, used in mass-shift assay) – 1:2000; anti-Non-phospho (Active) β-Catenin (Ser33/37/Thr41) – 1:1000; anti-Non-phospho (Active) β-Catenin (Ser45) – 1:1000; anti-phospho-β-Catenin (Ser33/37) – 2 μg/mL; anti-phospho-β-Catenin (Ser45) – 1:1000; anti-phospho-β-Catenin (Ser552) – 1:1000; anti-phospho-β-Catenin (Ser675) – 1:1000; anti-OGT (AL28)82 – 1:1000 in 5% (w/v) non-fat milk (Nestle NES22928) in TBS-T; anti-OGA (345)83 – 1:1000 in 5% (w/v) non-fat milk (Nestle NES22928) in TBS-T; anti-EZH2 – 1:1000; anti-GFP (3E6) – 2 μg/mL; anti-β-tubulin – 1:1000.
Dilutions of secondary antibodies (in 5% (w/v) BSA): anti-Mouse IgM (Sigma-Aldrich A8786) – 1:2000; anti-Rabbit IgG (Invitrogen A27036) – 1:10000; anti-Mouse IgG (Invitrogen A28177) – 1:10000.
Mass-Shift Assay
Mass-shift assay was performed following the protocol by Hardiville et al.84 with the following modifications. Cells were harvested in RIPA buffer, sonicated and cleared as mentioned above. In each GalT labeling reaction, 50 μg of total cell lysate was labeled using the GalTY289L enzyme (a kind gift from Dr. Kelly Moremen at CCRC) and UDP-GalNAz (Chemily SN02012). A “-GalT” control group without GalTY289L enzyme was included in all experiments. All 50 μg of the labeled sample was subjected to the SPAAC Click-chemistry reaction, where it was incubated with 10 mM of DBCO-PEG (8.5 kDa) or equal volume of DMSO at 37 °C for 16 hr. PEG-labeled proteins were precipitated with chloroform-methanol and subjected to Western blot. The shifted and unshifted bands of β-catenin was detected with a different antibody (ProteinTech 17565–1-AP). DBCO-PEG (8.5 kDa) was synthesized according to Hardiville et al.84, except that Amino-dPEG12-Tris (dPEG12-Tris(m-dPEG11)3)3 (Quanta BioDesign 10482) was used.
Pulse-Chase Experiments on RNA Half-life
HEK293T stable cell lines that express desired aptamers were cultured in 6-well plate with 1.5 mL medium. Each treatment was replicated in three wells. On day 1, 2.5×10⁵ cells were seeded in each well. Medium was changed daily. On day 3, actinomycin D was added into each well at 5 μg/mL, on a series of timepoints (see figure legends). When the treatment periods are over, cells were harvested by discarding the medium and adding 750 μL of TRIzol reagent (Invitrogen 15596026) into each well. The lysate was mixed and incubated at room temperature for 5 min and transferred into a Phasemaker tube (Invitrogen A33248). The aqueous phase was separated by adding 150 μL chloroform, thoroughly vertexing and incubating at room temperature for 5 min, and spinning at 12,000 rcf for 15 min at 4 °C. The upper aqueous layer was carefully collected without toughing the other layers. RNA was precipitated with isopropanol, washed with 70% ethanol, dissolved in nuclease-free water, and proceeded to RT-qPCR.
Nucleus/Cytoplasm Fractionation
Nucleus/Cytoplasm Fractionation was performed using the PARIS Kit (Invitrogen AM1921), following the kit manual. 100 U/mL RNaseOUT (Invitrogen 10777019) and 2 mM Ribonucleoside Vanadyl Complex (NEB S1402S) were freshly added to buffers. 2.5×10⁵ cells of the HEK293T stable cell line were cultured for 2 days on 6-well plates, 8 wells in total. Cells were monodispersed with TrypLE (Gibco 12604013) and rinsed with PBS. All steps between cell lysis and addition of 2X Lysis/Binding Solution were performed at 4 °C. 1.0×10⁶ cells were collected from each well. For the 4 replicates of Nucleus/Cytoplasm fractionation, cells were lysed by resuspending in 300 μL ice cold Cell Fractionation Buffer and incubating on ice for 10 min. The nuclear and cytoplasmic fractions were separated by spinning at 500 rcf for 5 min. The upper cytoplasmic fraction was carefully collected and transferred into a RNase free tube with equal volume of 2X Lysis/Binding Solution. The pelleted nuclear fraction was washed by resuspending in 300 μL cold Cell Fractionation Buffer and spinning at 500 rcf for 1 min. The nuclear pellet was collected and lysed with 300 μL ice cold Cell Disruption Buffer, followed by 300 μL of 2X Lysis/Binding Solution. For the 4 replicates of total cell lysate (control), collected cells were lysed in 300 μL ice cold Cell Disruption Buffer + 300 μL of 2X Lysis/Binding Solution. RNA was purified with the spin columns included in the kit and subjected to RT-qPCR.
TOPFlash/FOPFlash Luciferase Reporter Assay
Amount and time of transfection for each plasmid is listed in Table S3. On day 1, 2.5×10⁵ cells were seeded in each well on 6-well plates. After 24 hr, plasmids encoding the Firefly Luciferase (TOPFlash or FOPFlash)85 and the NanoLuc Luciferase (pNL1.1.TK[Nluc/TK], Promega N1501) were transfected into cells. For OGT knockdown and rescue assays, plasmids encoding shOGT and codon-optimized ncOGT were also transfected at this time. On day 3, cells were detached with TrypLE, and 1.5×10⁴ of desired cells were seeded on a 96-well plate in 80 μL medium. On Day 4, cells were transfected with plasmids encoding desired aptamers. On Day 5, culture medium was changed to fresh DMEM (in −Wnt wells) or 50% Wnt3A-conditioned medium (in +Wnt wells) at 20 hr post-transfection. At 24 hr post-transfection, Dual Luciferase Reporter Assay was performed using the Nano-Glo Dual-Luciferase Reporter Assay System (Promega N1521), following the kit manual. Luminescence generated by Firefly Luciferase (TOPFlash or FOPFlash) and NanoLuc Luciferase was measured on a SpectraMax i3x plate reader (Molecular Devices). In data analysis, signal intensity of the Firefly Luciferase was normalized to that of NanoLuc Luciferase in the same well, as a control for variations in transfection efficiency. Then the normalized readings of the TOPFlash wells were normalized again to that of the FOPFlash wells with the same treatments. The second normalization was purposed to control the background (leaky) expression of Firefly Luciferase. Statistical analysis was performed with the GraphPad Prism software.
Proximity Ligation Assay (PLA)
For PLA, cells were cultured on 8-well Chamber Slides (Thermo Scientific 154941). 1.0×10⁴ cells were seeded in each well with 250 μL medium. After 24 hr, 19.7 ng/well of aptamer-encoding plasmids were transfected into cells (equivalent to 1.5 μg in 10 cm dish). Medium was changed 6 hr after transfection. At 24 hr post-transfection, the plastic chambers were removed, and cells were fixed with 4% formaldehyde (Thermo Scientific 28908, diluted in PBS) at room temperature for 15 min, rinsed twice with PBS, and permeabilized in freshly made Permeabilization Buffer (0.5% Triton X-100 in PBS) at room temperature for 20 min. Cells were washed twice in PBS, barriers were created around each well with a Hydrophobic Barrier Pen (Vector Laboratories H-4000), and proceeded to PLA. PLA was performed using the Duolink Probes, Buffers and Detection Reagents (DUO92001, DUO92005, DUO92013 and DUO82049), following the kit manual. Incubation steps were performed in a HybEZ Hybridization Oven with a humidity control tray (ACD 321711). After the final washes, cells were stained with AlexaFluor488-conjugated phalloidin (Invitrogen R37110) or AlexaFluor555-conjugated phalloidin (Invitrogen R37112) for 30 min at room temperature and washed in water for 1 min. Slides were air dried for 15 min at 60 °C in dark. Dried slides were mounted with Prolong Glass Mountant with NucBlue (Hoechst 33342) (Invitrogen P36985) and cover glasses. Mounted slides were left at room temperature for 24 hr before imaging.
Primary antibody usage: anti-β-catenin (BD Biosciences 610153) – 1:250; anti-GFP (3E6) – 0.8 μg/mL; anti-OGT (AL28) – 1:1000; anti-β-TrCP – 1:200; anti-EZH2 – 1:200; anti-EP300 – 0.5 μg/mL; anti-KAT2A/GCN5L2 – 1:100; anti-KAT5 – 1:100; anti-H3K27me3 – 1:800; anti-H3K9ac – 1:400.
Mounted slides were imaged on an Olympus FV1200 confocal microscope using an Olympus UPLFLN40XO lens (40x, NA = 1.3, Oil Immersion). Image acquisition was controlled by the Olympus FluoView (Ver. 4.2a) software. Samples were imaged under 405 nm (for NucBlue/Hoechst, HV = 650, Gain = 1, Offset = 5, Laser Power = 9.0%), 488 nm (for Phalloidin, HV = 630, Gain = 1, Offset = 5, Laser Power = 7.0%) or 559 nm (for Phalloidin, HV = 630, Gain = 1, Offset = 5, Laser Power = 5.0%) and 635 nm (for PLA, HV = 550, Gain = 1, Offset = 5, Laser Power = 6.0%). The pinhole was set to 1 Airy Unit (80 μm). 12-bit images of the three channels were acquired sequentially.
Analysis of the imaging data was done with Fiji75. Total PLA puncta in an image were labeled and counted with the “Find maxima” function (Prominence > 500). For nuclear PLA puncta, total puncta in the PLA channel were first labeled in the same way, then the nuclear areas on the Hoechst channel were labeled by adjusting threshold (> 500). Nuclear PLA puncta were counted with the “Speckle Inspector” function in the BioVoxxel Toolbox86, using the threshold-adjusted Hoechst channel as the “Primary objects”, and the maxima-labeled PLA channel as the “Secondary objects”. Number of nuclei was manually counted. the ratio of total PLA puncta / nuclei, or nuclear PLA / nuclei was calculated for each image. Statistical analysis was performed with GraphPad Prism.
For easy visualization in the figure panels, image contrast was enhanced by resetting the upper limit of display range in Fiji as follow: Hoechst and Phalloidin channels = 2047, PLA channel = 1023 (OGT, EZH2, KAT2A and KAT5 figures) or 2047 (β-TrCP and EP300 figures). Adjustments were applied only to the presented figures, not to the original images nor during image analysis.
RNA Sequencing and Data Analysis
HEK293T cells (wildtype or knockdown of EZH2) were cultured in 10 cm dishes and transfected with desired plasmids. Ac5S and Wnt treatments were performed as described in the Cell Culture and Transfection section. At 24 hr post-transfection, medium was discarded, and cells were lysed using 1 mL of TRIzol Reagent (Invitrogen 15596026) per culture dish. Lysates were mixed by pipetting, transferred into a Phasemaker tube (Invitrogen A33248) and incubated at room temperature for 5 min. The aqueous phase was separated by adding 200 μL chloroform, thoroughly vertexing and spinning at 12,000 rcf for 15 min at 4 °C. The upper aqueous layer was carefully collected without touching the other layers. RNA was precipitated with isopropanol, washed with 70% ethanol, dissolved in nuclease-free water, and submitted to GENEWIZ (South Plainfield, NJ, USA) for sequencing. Sequencing was done on an Illumina HiSeq 4000 sequencer in 2×150 bp mode.
Analysis of the RNA-Seq data followed the protocols by Doyle et al.87. Sequencing adaptors were trimmed from the raw reads using Trim Galore65,88 with parameters (--paired --clip_R1 10 --clip_R2 10 --three_prime_clip_R1 1 --three_prime_clip_R2 1). Trimmed reads were mapped to the human reference genome (GRCh38.p13) using HISAT289 with parameters (--dta). Mapped reads were counted to each genes by featureCounts90 with parameters (-C -F GTF -g gene_id -p --countReadPairs -t transcript). The count matrix was annotated using annotateMyIDs91. Differential expression of genes was analyzed with DESeq292 and plotted using EnhancedVolcano93.
CUT&RUN Sequencing and Data Analysis
Cleavage Under Targets and Release Using Nuclease (CUT&RUN) was performed using the CUTANA ChIC/CUT&RUN kit (EpiCypher 14–1048), following the kit manual. DTT (1 mM), PUGNAc (1 μM), TMG (2 μM) and Protease Inhibitors Cocktail (1x) were freshly added into all buffers. Cell culture and transfection were carried out on 6-well culture plates. At 24 hr post-transfection, cells were monodispersed by scrapping and pipetting. 5.0×10⁵ cells were used for each reaction. Nuclei of cells were isolated by resuspending 5.0×10⁵ cells in 100 μL of cold Nuclear Extraction Buffer (20 mM HEPES pH 7.9, 10 mM KCl, 0.10% (v/v) Triton X-100, 20% (v/v) glycerol, inhibitors and 0.5 mM Spermidine freshly added) and incubating on ice for 10 min. Nuclei were collected by centrifugation at 600 rcf for 3 min at 4 °C, then re-suspended in 100 μL of cold Nuclear Extraction Buffer. Following steps were performed as instructed in the kit manual. 500 ng of EZH2 antibody (CST 5246) was used in each 50 μL of binding reaction. A negative control reaction using 500 ng of rabbit IgG (EpiCypher 13–0042k) was included. After chromatin digestion, 0.5 ng of E.coli genomic DNA (kit included) was spiked-in to each reaction with the Stop Buffer. After chromatin release, DNA fragments were purified by Phenol: Chloroform (Invitrogen 15593031) extraction and isopropanol precipitation. Concentrations of DNA were measured using the Qubit 1X dsDNA HS Assay Kit (Invitrogen Q33230).
Preparation of Sequencing Library was performed using the NEBNext Ultra II DNA Library Prep Kit (NEB E7103L), and NEBNext Multiplex Oligos for Illumina (NEB E6440S), following the protocol by Liu94. 6 ng DNA from each CUT&RUN reaction was used as the starting material. A negative control (Input) with 6 ng of sonication-sheard genomic DNA from HEK293T cells was included. Prepared DNA library was dissolved in nuclease-free water, and submitted to GENEWIZ (South Plainfield, NJ, USA) for sequencing. Sequencing was performed on an Illumina HiSeq 4000 sequencer in 2×150 bp mode.
Analysis of the sequencing data followed the protocol by Zheng et al.95. In brief, sequencing adaptors were trimmed from the raw reads using Trim Galore65,88 with parameters (--paired --clip_R1 10 --clip_R2 10 --three_prime_clip_R1 1 --three_prime_clip_R2 1). Trimmed reads were mapped to the human reference genome (GRCh38.p13) using Bowtie296 with parameters (-I 10 -X 700 --no-mixed --no-discordant --dovetail --very-sensitive-local). For spike-in calibration, the trimmed reads were additionally mapped to the E.coli reference genome (ASM584v2) with parameters (-I 10 -X 700 --no-mixed --no-discordant --dovetail --very-sensitive --end-to-end), and scale factors were calculated according to the protocol95. Mapped BAM files were filtered by samtools view97 with paramters (-q 20 -F 0×4) and converted to BED format using bedtools bamtobed98. The BED files were spike-in calibrated using the calculated scale factors, and converted to genomic coverage bedgraph files using the bedtools genomecov function98. Peak calling was performed with SEACR99 under the stringent mode with parameters (-n non -m stringent), using the bedgraph file of IgG as control. Differential binding analysis was performed using Diffbind100,101, using the mapped BAM reads (to human and E.coli reference genomes) from Bowtie2 and the called peaks from SEACR as input with parameters (dba.blacklist: blacklist = DBA_BLACKLIST_GRCH38, greylist = FALSE; dba.normalize: method = DBA_DESEQ2, normalize = DBA_NORM_RLE, spikein = TRUE; dba.analyze: method = DBA_DESEQ2). The differential binding sites were annotated with ChIPSeeker102. The heatmap was generated using the dba.plotprofile function in Diffbind, and the profileplyr package103. For visualization, normalized bedgraph files were converted to bigwig files using UCSC bedGraphToBigWig104. The genomic browser views were generated by inspecting the bigwig files in the Integrative Genomics Viewer (IGV)105.
Design of Riboswitch Elements
To generate the inducible aptamer LRS1F50C, two sets of riboswitch mechanisms each including a mango aptamer (Mango-IIA22U or Mango-IIIA10U)56,57 and a transmitter element were incorporated into the DS aptamer NL1F50 (Figures 7A and 7B). A transmitter element was designed to imperfectly pair with both the core sequence of a Mango aptamer, and with part of T1/AP3. This design allows the transmitter to disrupt the folding of either Mango or T1/AP3 by binding to one of them. This alternative binding is switched by addition/removal of the effector molecule (TO1, abm G955), which facilitates the correct folding of Mango aptamers. In addition, the linker region serves as an insulator, so that the two riboswitch mechanisms do not interfere with each other and can be designed individually.
Design of a transmitter element’s sequence was guided by the change of Gibbs Free Energy. For spontaneous processes, the change of Gibbs Free Energy must be negative (ΔΔG < 0). In the system consists of an RNA riboswitch (including a sensor aptamer, an actuator aptamer, and a transmitter), a ligand (TO1) and a target protein (OGT or a GFP-tagged protein), the ΔΔG of a conformational change is influenced by 1) the folding of the RNA; and 2) the binding of aptamers to the ligand and the target protein.
Taking the Mango-IIIA10U riboswitch that regulates T1 as an example, its conformational change triggered by addition of TO1 (from the “ON” state shown in Figure 7A, to the “OFF” state shown in Figure 7B) should be a spontaneous process:
| Eq.1 |
Meanwhile, removal of TO1 triggers the reverse conformational change:
| Eq.2 |
Note that
| Eq.3 |
Eq.1 and Eq.2 are the criteria of a good riboswitch design.
In (1), after addition of TO1:
| Eq.4 |
In Eq.2, after removal of TO1:
| Eq.5 |
By combining Eq.1 to Eq.5, we get
| Eq.6 |
In a good riboswitch design, its ΔΔGRNA folding (ON to OFF) must satisfy Eq.6.
In Eq.6,
| Eq.7 |
In these formulars,
1) the ΔGRNA folding items are sensitive to the transmitter sequences but insensitive to the presence of TO1, and they were calculated using the RNAfold webserver67;
2) the ΔGbinding items are insensitive to the transmitter sequences, and they were calculated from the equation:
| Eq.8 |
In Eq.8, R is the gas constant (8.314 J·K−1·mol−1) and T = 298.15 K. The dissociation constants (Kd) were measured by SPR (T1 to OGT: 60.49 nM, measured at 298.15 K) or reported previously (AP3 to GFP: 5.1 nM, measured at 295.15 K; Mango-IIA22U/Mango-IIIA10U to TO1: 0.9/1.7 nM, temperature unknown)26,56,57 were used in the calculations.
Sequences of the transmitter elements in both riboswitch mechanisms were manually designed to satisfy formulars Eq.6 to Eq.8.
QUANTIFICATION AND STATISTICAL ANALYSIS
Statistical analysis was performed in the GraphPad Prism 9 software. Unpaired two-tailed Student’s t-test was applied to comparisons between two groups. For single-variable comparisons between multiple groups, one-way ANOVA test followed by Dunnett’s test comparing to the control groups (T1 · AP3 or T1 · bc339) was applied. For two-variable comparisons, two-way ANOVA test followed by Turkey’s test was applied. Error bars in all plots represents Standard Deviation (SD). For experiments performed with cells, N represents the number of biological replicates. For PLA, N represents the number of different views analyzed. Details of sample number, data representation and statistical comparison method of each plot can be found in the figures and legends. ns, p ≥ 0.05; *, p < 0.05; **, p < 0.01; ***, p < 0.001; ****, p < 0.0001.
Supplementary Material
Figure S1. Predicted Secondary Structures of Several Dual-Specificity Aptamers Used in This Research. Related to All Figures
(A) to (D) Sequences and predicted secondary structures of 3JB1F+6, 4JC1RR, 3JB8F+12 and 3JB8R+12, respectively.
Figure S2. Dual-Specificity Aptamers Increase O-GlcNAcylation on GFP-Tagged Proteins. Related to Figure 2
(A) IP-WB of HEK293T cells expressing GFP-β-catenin and the indicated aptamers. N=5.
(B) Optimization of co-transfection of GFP-β-catenin. IP-WB on cells co-transfected with various amounts of plasmids encoding GFP-β-catenin, and 1 μg plasmids encoding the indicated aptamers.
(C) Quantification of (B). Data are normalized to the control group (T1 · AP3) with 0.1 μg GFP-β-catenin plasmid. N=3.
(D) IP-WB on cells expressing GFP and the indicated aptamers. The lane with protein ladder is included as a positive control. N=3.
(E) WB of total cell lysates from Figure 2C.
(F) Mass-shift assays on cells expressing GFP-β-catenin and the indicated aptamers. Two blots on β-catenin with short and long exposure time are shown. Intensities of the shifted bands are normalized to that of β-tubulin. N=3.
(G) IP-WB of cells expressing GFP-β-catenin and the indicated aptamers, and stimulated with Wnt3A-conditioned medium for 4 hr. Irrelevant lanes are cropped. N=3.
(H) Schematic of 3JB1R.
(I) Optimization of the linker domain of 3JB1R. IP-WB on cells expressing GFP-β-catenin and the indicated aptamers. N=3.
(J) and (K) IP-WB (K), and Co-IP (K) on cells expressing GFP-Src and the indicated aptamers. N=3.
(L) IP-WB of cells expressing GFP-AMPKα2 and the indicated aptamers. N=3.
T1 · AP3 – Individual T1 and AP3 aptamers (control). NL1F35/50 – DS aptamers (T1-linker-AP3) with flexible linkers of 35/50 nt. 3JB1F/3JB1R/4JC1RR – DS aptamers (T1-linker-AP3) with folded linkers. +2/+4/…/+12, serial additions (bp) into the folded linker. Quantitated data are normalized to the control groups (T1 · AP3). Student’s t-test in (A), (F), (G). Two-way ANOVA test in (C). One-way ANOVA test in other panels. Data are represented as mean ± SD. ns, p ≥ 0.05; *, p < 0.05; **, p < 0.01; ***, p < 0.001; ****, p < 0.0001.
Figure S3. DS Aptamers Reveal Unmapped O-GlcNAc Sites on β-catenin, and O-GlcNAc Stabilizes GFP-β-catenin by Inhibiting Its Interaction With β-TrCP. Related to Figure 3
(A), (C), (E) and (G) IP-WB on cells expressing GFP-β-catenin and the indicated aptamers.
In (C) and (G), cells were treated with 50 μM Ac5S for 20 hr. N=3.
(B), (D), (F) and (H) WB on cells expressing GFP-β-catenin and the indicated aptamers. In (D) and (H), cells were treated with 50 μM Ac5S for 20 hr. In (F) and (H), both chemiluminescence and fluorescence WB were performed and they generated consistent results. Intensity of each band is normalized to that of β-tubulin. N=3.
(I) O-GlcNAc on the GFP-β-cateninS23A; T40A; T41A; T112A; or 4A mutant was reduced by CpOGA. Lysate of HEK293T cells expressing GFP-β-catenin4A was treated with CpOGA and subjected to IP-WB. N=3.
(J) Antibody recognition of O-GlcNAc on GFP-β-catenin4A was competed by 1 M GlcNAc. IP-WB of cells expressing GFP-β-catenin4A. 1 M GlcNAc was included in the antibody solution during WB for the membrane on the left. Lanes on the left and right are from two membranes but imaged together for equal exposure. Borders were added to the top blots. N=3.
(K) and (L) Quantifications of phosphorylation on endogenous β-catenin and abundance of proteins in Figures 3D (K) and 3E (L). Intensity of each band is normalized to that of β-tubulin. N=3.
T1 · AP3 – Individual T1 and AP3 aptamers (control). NL1F30 – DS aptamers (T1-linker-AP3) with flexible linkers of 30 nt. 3JB1F+6 – DS aptamers (T1-linker-bc339) with a folded linker. Quantitated data are normalized to the control groups (T1 · AP3) unless indicated. Student’s t-test. Data are represented as mean ± SD. ns, p ≥ 0.05; *, p < 0.05; **, p < 0.01; ***, p < 0.001.
Figure S4. DS Aptamers Increase O-GlcNAcylation on Endogenous β-catenin. Related to Figures 4, 5
(A) WB of whole cell lysate from Figure 4D and quantification. Intensity of each band in WB is normalized to that of β-tubulin. One-way ANOVA test, N=3.
(B) Mass-shift assays on HEK293T cells expressing the indicated aptamers. Two blots of β-catenin with short and long exposure time are shown. Intensity of the shifted bands is normalized to that of β-tubulin. N=3.
(C) and (D) WB on cells expressing the indicated aptamers, and treated with regular (C) or Wnt3A-conditioned (D) medium. Intensity of each β-catenin band is normalized to that of β-tubulin. N=3.
(E) and (F) WB on HEK293T cells expressing the indicated aptamers, and treated with regular (E) or Wnt3A-conditioned (F) medium. N=4.
(G) and (H) IP-WB of HEK293T cells expressing the indicated aptamers, treated with Ac5S and regular (G) or Wnt3A-conditioned (H) medium. N=3.
(I) Co-IP between β-catenin and OGT, on cells expressing the indicated aptamers. Intensity of each OGT band is normalized to that of β-catenin. N=3.
(J) Predicted tertiary structure of the DS aptamer 3JB8R+12. Nucleotides are color coded in the same way as its secondary structure prediction in Figure S1D.
(K) and (L) IP-WB on HEK293T cells expressing the indicated aptamers, and treated with regular (K) or Wnt3A-conditioned (L) medium. N=3.
(M) and (N) Co-IP between β-catenin and EZH2, on cells expressing the indicated aptamers, and treated with regular (M) or Wnt3A-conditioned (N) medium. Intensity of each EZH2 band is normalized to that of β-catenin. N=6.
T1 · bc339 – Individual T1 and bc339 aptamers (control). NL8F50/70/100 – DS aptamers (T1-linker-bc339) with flexible linkers of 50/70/100 nt. 3JB8F/3JB8R – DS aptamers (T1-linker-bc339) with folded linkers. +12, 12 bp additions into the folded linker. Quantitated data are normalized to the control groups (T1 · bc339). One-way ANOVA test in (A). Student’s t-test in other panels. Data are represented as mean ± SD. ns, p ≥ 0.05; *, p < 0.05, ***, p < 0.001.
Figure S5. O-GlcNAc Promotes β-catenin’s Interactions With KAT2A. Related to Figure 5
(A) to (H) Confocal images of Proximity Ligation Assay (PLA) on HEK293T cells expressing the indicated aptamers and stimulated with regular (−Wnt) or Wnt3A-conditioned (+Wnt) medium. PLA was performed with antibodies targeting β-catenin and KAT2A or H3K9ac. In (C) and (D), cells were treated with 50 μM Ac5S for 20 hr.
(I) to (P) Quantification of (A) to (H). PLA puncta in nucleus are counted and normalized to the number of nuclei in each image. Student’s t-test. N=10. Data are represented as mean ± SD. ns, p ≥ 0.05; ***, p < 0.001; ****, p < 0.0001.
T1 · bc339 – Individual T1 and bc339 aptamers (control). 3JB8F+12/R+12 – DS aptamers (T1-linker-bc339) with folded linkers.
Figure S6. O-GlcNAc Regulates β-catenin’s Interactions With EP300, KAT5 and β-TrCP. Related to Figure 5
(A) to (F) Confocal images of PLA on HEK293T cells expressing the indicated aptamers, and stimulated with regular (−Wnt) or Wnt3A-conditioned (+Wnt) medium. PLA was performed with antibodies targeting β-catenin and EP300, KAT5, or β-TrCP.
(G) and (H) Confocal images of the negative control experiments of PLA. Cells were treated with regular (−Wnt) or Wnt3A-conditioned (+Wnt) medium. PLA was performed with the antibody targeting β-catenin and normal rabbit IgG.
(I) to (P) Quantification of (A) to (H). Nuclear or total PLA puncta are counted and normalized to the number of nuclei in each image. Student’s t-test. N=10 (I to N) or 5 (O to P). Data are represented as mean ± SD. **, p < 0.01; ***, p < 0.001; ****, p < 0.0001.
T1 · bc339 – Individual T1 and bc339 aptamers (control). 3JB8F+12 – A DS aptamer (T1-linker-bc339) with a folded linker.
Figure S7. O-GlcNAc on β-catenin Increases Its Transcriptional Activity and Recruits EZH2 to Promoters. Related to Figure 6
(A) to (B) TOPFlash luciferase reporter assay on HEK293T cells expressing the indicated aptamers, and stimulated with regular (−Wnt) or Wnt3A-conditioned (+Wnt) medium. In (B), cells were treated with 50 μM Ac5S for 20 hr. N=3.
(C) TOPFlash assay on cells expressing a scrambled RNA (scrambled), a shRNA targeting OGT (shOGT), or the shRNA with a codon-optimized OGT (shOGT + OGT). N=6.
(D) TOPFlash assay on cells treated with vehicle (DMSO), an inhibitor of OGT (Ac5S) or an inhibitor of OGA (TMG). N=3.
(E) TOPFlash assay on cells expressing the indicated RNA. N=3.
(F) and (G) Distribution of the differential binding sites of EZH2 on the genome, under −Wnt (A) and +Wnt (B) conditions.
(H) and (I) The binding peaks of EZH2 on the three promoters shown in Figure 6C under the indicated conditions. N=3.
(J) Numbers of the binding peaks of EZH2 on the genome under the indicated conditions. Analysis is performed on the data presented in Figures 6C and S7H. N=3.
(K) WB on HEK293T cells that are WT, or stably expressing a shRNA targeting β-catenin or EZH2. Intensity of each band is normalized to that of β-tubulin. Irrelevant lanes are cropped. N=2.
T1 · bc339 – Individual T1 and bc339 aptamers (control). 3JB8F+12 – A DS aptamer (T1-linker-bc339) with a folded linker. Two-way ANOVA test in (A) to (E) and (J). Data are represented as mean ± SD. ns, p ≥ 0.05; **, p < 0.01; ***, p < 0.001; ****, p < 0.0001.
Table S3. Transfections in TOPFlash Assay. Related to Figure S7
Table S4. Differential Binding Sites of EZH2 Identified in CUT&RUN. Related to Figure 6
Table S5. Differentially Expressed Genes Identified in RNA-Seq. Related to Figure 6
Table S6. DNA Oligos for SELEX and TaqMan Assays. Related to STAR Methods and Key Resources Table
Table S7. Aptamer Sequences. Related to Key Resources Table
Highlights.
Dual-specificity RNA aptamers regulates O-GlcNAcylation on individual proteins
O-GlcNAc stabilizes β-catenin by inhibiting its interaction with β-TrCP
O-GlcNAc on β-catenin recruits EZH2 to promoters and alters transcription
Dual-specificity aptamers can be controlled by riboswitches or a Tet-On system
ACKNOWLEDGMENTS
We thank members in the Hart lab for their support; Drs. J. Corden, J. Pomerantz, T. Inoue, J. Boeke and D. Leahy at JHU for serving on Y.Z.’s Ph.D. thesis committee; C. Bergmann at CCRC for sharing the SPR instrument; M. Murphy and E. Roush at GE Healthcare/Cytiva for advice on SPR; K. Moremen at CCRC for sharing the GalTY289L enzyme. This project was supported by NIH P01HL107153 and R01GM116891. G.W.H. receives a share of royalty received on sales of the CTD110.6 antibody, which is managed by JHU.
Footnotes
Publisher's Disclaimer: This is a PDF file of an unedited manuscript that has been accepted for publication. As a service to our customers we are providing this early version of the manuscript. The manuscript will undergo copyediting, typesetting, and review of the resulting proof before it is published in its final form. Please note that during the production process errors may be discovered which could affect the content, and all legal disclaimers that apply to the journal pertain.
DECLARATION OF INTERESTS
A patent application based on this work has been filed. G.W.H. and Y.Z. are inventors of this patent.
REFERENCES
- 1.Torres CR, and Hart GW (1984). Topography and polypeptide distribution of terminal N-acetylglucosamine residues on the surfaces of intact lymphocytes. Evidence for O-linked GlcNAc. J Biol Chem 259, 3308–3317. [PubMed] [Google Scholar]
- 2.Hanover JA, Cohen CK, Willingham MC, and Park MK (1987). O-linked N-acetylglucosamine is attached to proteins of the nuclear pore. Evidence for cytoplasmic and nucleoplasmic glycoproteins. J Biol Chem 262, 9887–9894. [PubMed] [Google Scholar]
- 3.Wulff-Fuentes E, Berendt RR, Massman L, Danner L, Malard F, Vora J, Kahsay R, and Olivier-Van Stichelen S (2021). The human O-GlcNAcome database and meta-analysis. Sci Data 8, 25. 10.1038/s41597-021-00810-4. [DOI] [PMC free article] [PubMed] [Google Scholar]
- 4.Haltiwanger RS, Blomberg MA, and Hart GW (1992). Glycosylation of nuclear and cytoplasmic proteins. Purification and characterization of a uridine diphospho-N-acetylglucosamine:polypeptide beta-N-acetylglucosaminyltransferase. J Biol Chem 267, 9005–9013. [PubMed] [Google Scholar]
- 5.Dong DL, and Hart GW (1994). Purification and characterization of an O-GlcNAc selective N-acetyl-beta-D-glucosaminidase from rat spleen cytosol. Journal of Biological Chemistry 269, 19321–19330. 10.1016/s0021-9258(17)32170-1. [DOI] [PubMed] [Google Scholar]
- 6.Lubas WA, Frank DW, Krause M, and Hanover JA (1997). O-Linked GlcNAc transferase is a conserved nucleocytoplasmic protein containing tetratricopeptide repeats. J Biol Chem 272, 9316–9324. 10.1074/jbc.272.14.9316. [DOI] [PubMed] [Google Scholar]
- 7.Gao Y, Wells L, Comer FI, Parker GJ, and Hart GW (2001). Dynamic O-glycosylation of nuclear and cytosolic proteins: cloning and characterization of a neutral, cytosolic beta-N-acetylglucosaminidase from human brain. J Biol Chem 276, 9838–9845. 10.1074/jbc.M010420200. [DOI] [PubMed] [Google Scholar]
- 8.Hart GW, Slawson C, Ramirez-Correa G, and Lagerlof O (2011). Cross talk between O-GlcNAcylation and phosphorylation: roles in signaling, transcription, and chronic disease. Annu Rev Biochem 80, 825–858. 10.1146/annurev-biochem-060608-102511. [DOI] [PMC free article] [PubMed] [Google Scholar]
- 9.Tarrant MK, Rho HS, Xie Z, Jiang YL, Gross C, Culhane JC, Yan G, Qian J, Ichikawa Y, Matsuoka T, et al. (2012). Regulation of CK2 by phosphorylation and O-GlcNAcylation revealed by semisynthesis. Nat Chem Biol 8, 262–269. 10.1038/nchembio.771. [DOI] [PMC free article] [PubMed] [Google Scholar]
- 10.Marotta NP, Lin YH, Lewis YE, Ambroso MR, Zaro BW, Roth MT, Arnold DB, Langen R, and Pratt MR (2015). O-GlcNAc modification blocks the aggregation and toxicity of the protein alpha-synuclein associated with Parkinson’s disease. Nat Chem 7, 913–920. 10.1038/nchem.2361. [DOI] [PMC free article] [PubMed] [Google Scholar]
- 11.Ramirez DH, Aonbangkhen C, Wu HY, Naftaly JA, Tang S, O’Meara TR, and Woo CM (2020). Engineering a Proximity-Directed O-GlcNAc Transferase for Selective Protein O-GlcNAcylation in Cells. ACS Chem Biol. 10.1021/acschembio.0c00074. [DOI] [PMC free article] [PubMed] [Google Scholar]
- 12.Ge Y, Ramirez DH, Yang B, D’Souza AK, Aonbangkhen C, Wong S, and Woo CM (2021). Target protein deglycosylation in living cells by a nanobody-fused split O-GlcNAcase. Nat Chem Biol 17, 593–600. 10.1038/s41589-021-00757-y. [DOI] [PMC free article] [PubMed] [Google Scholar]
- 13.Clevers H (2006). Wnt/beta-catenin signaling in development and disease. Cell 127, 469–480. 10.1016/j.cell.2006.10.018. [DOI] [PubMed] [Google Scholar]
- 14.Nusse R, and Clevers H (2017). Wnt/beta-Catenin Signaling, Disease, and Emerging Therapeutic Modalities. Cell 169, 985–999. 10.1016/j.cell.2017.05.016. [DOI] [PubMed] [Google Scholar]
- 15.Hart M, Concordet JP, Lassot I, Albert I, del los Santos R, Durand H, Perret C, Rubinfeld B, Margottin F, Benarous R, and Polakis P (1999). The F-box protein β-TrCP associates with phosphorylated β-catenin and regulates its activity in the cell. Current Biology 9, 207–211. 10.1016/s0960-9822(99)80091-8. [DOI] [PubMed] [Google Scholar]
- 16.Liu C, Li Y, Semenov M, Han C, Baeg G-H, Tan Y, Zhang Z, Lin X, and He X (2002). Control of β-Catenin Phosphorylation/Degradation by a Dual-Kinase Mechanism. Cell 108, 837–847. 10.1016/s0092-8674(02)00685-2. [DOI] [PubMed] [Google Scholar]
- 17.Li VS, Ng SS, Boersema PJ, Low TY, Karthaus WR, Gerlach JP, Mohammed S, Heck AJ, Maurice MM, Mahmoudi T, and Clevers H (2012). Wnt signaling through inhibition of beta-catenin degradation in an intact Axin1 complex. Cell 149, 1245–1256. 10.1016/j.cell.2012.05.002. [DOI] [PubMed] [Google Scholar]
- 18.Olivier-Van Stichelen S, Dehennaut V, Buzy A, Zachayus JL, Guinez C, Mir AM, El Yazidi-Belkoura I, Copin MC, Boureme D, Loyaux D, et al. (2014). O-GlcNAcylation stabilizes beta-catenin through direct competition with phosphorylation at threonine 41. FASEB J 28, 3325–3338. 10.1096/fj.13-243535. [DOI] [PMC free article] [PubMed] [Google Scholar]
- 19.Ellington AD, and Szostak JW (1990). In vitro selection of RNA molecules that bind specific ligands. Nature 346, 818–822. 10.1038/346818a0. [DOI] [PubMed] [Google Scholar]
- 20.Tuerk C, and Gold L (1990). Systematic evolution of ligands by exponential enrichment: RNA ligands to bacteriophage T4 DNA polymerase. Science 249, 505–510. 10.1126/science.2200121. [DOI] [PubMed] [Google Scholar]
- 21.Robertson DL, and Joyce GF (1990). Selection in vitro of an RNA enzyme that specifically cleaves single-stranded DNA. Nature 344, 467–468. 10.1038/344467a0. [DOI] [PubMed] [Google Scholar]
- 22.Gold L, Janjic N, Jarvis T, Schneider D, Walker JJ, Wilcox SK, and Zichi D (2012). Aptamers and the RNA world, past and present. Cold Spring Harb Perspect Biol 4. 10.1101/cshperspect.a003582. [DOI] [PMC free article] [PubMed] [Google Scholar]
- 23.Lazarus MB, Nam Y, Jiang J, Sliz P, and Walker S (2011). Structure of human O-GlcNAc transferase and its complex with a peptide substrate. Nature 469, 564–567. 10.1038/nature09638. [DOI] [PMC free article] [PubMed] [Google Scholar]
- 24.Pyle AM (2002). Metal ions in the structure and function of RNA. J Biol Inorg Chem 7, 679–690. 10.1007/s00775-002-0387-6. [DOI] [PubMed] [Google Scholar]
- 25.Carothers JM, Goler JA, Kapoor Y, Lara L, and Keasling JD (2010). Selecting RNA aptamers for synthetic biology: investigating magnesium dependence and predicting binding affinity. Nucleic Acids Res 38, 2736–2747. 10.1093/nar/gkq082. [DOI] [PMC free article] [PubMed] [Google Scholar]
- 26.Shui B, Ozer A, Zipfel W, Sahu N, Singh A, Lis JT, Shi H, and Kotlikoff MI (2012). RNA aptamers that functionally interact with green fluorescent protein and its derivatives. Nucleic Acids Res 40, e39. 10.1093/nar/gkr1264. [DOI] [PMC free article] [PubMed] [Google Scholar]
- 27.Darabedian N, Thompson JW, Chuh KN, Hsieh-Wilson LC, and Pratt MR (2018). Optimization of Chemoenzymatic Mass Tagging by Strain-Promoted Cycloaddition (SPAAC) for the Determination of O-GlcNAc Stoichiometry by Western Blotting. Biochemistry 57, 5769–5774. 10.1021/acs.biochem.8b00648. [DOI] [PMC free article] [PubMed] [Google Scholar]
- 28.Yuzwa SA, Macauley MS, Heinonen JE, Shan X, Dennis RJ, He Y, Whitworth GE, Stubbs KA, McEachern EJ, Davies GJ, and Vocadlo DJ (2008). A potent mechanism-inspired O-GlcNAcase inhibitor that blocks phosphorylation of tau in vivo. Nat Chem Biol 4, 483–490. 10.1038/nchembio.96. [DOI] [PubMed] [Google Scholar]
- 29.Gloster TM, Zandberg WF, Heinonen JE, Shen DL, Deng L, and Vocadlo DJ (2011). Hijacking a biosynthetic pathway yields a glycosyltransferase inhibitor within cells. Nat Chem Biol 7, 174–181. 10.1038/nchembio.520. [DOI] [PMC free article] [PubMed] [Google Scholar]
- 30.Lescoute A, and Westhof E (2006). Topology of three-way junctions in folded RNAs. RNA 12, 83–93. 10.1261/rna.2208106. [DOI] [PMC free article] [PubMed] [Google Scholar]
- 31.Kuglstatter A, Oubridge C, and Nagai K (2002). Induced structural changes of 7SL RNA during the assembly of human signal recognition particle. Nat Struct Biol 9, 740–744. 10.1038/nsb843. [DOI] [PubMed] [Google Scholar]
- 32.Tanaka Y, Fujii S, Hiroaki H, Sakata T, Tanaka T, Uesugi S, Tomita K, and Kyogoku Y (1999). A’-form RNA double helix in the single crystal structure of r(UGAGCUUCGGCUC). Nucleic Acids Res 27, 949–955. 10.1093/nar/27.4.949. [DOI] [PMC free article] [PubMed] [Google Scholar]
- 33.Laing C, and Schlick T (2009). Analysis of four-way junctions in RNA structures. J Mol Biol 390, 547–559. 10.1016/j.jmb.2009.04.084. [DOI] [PMC free article] [PubMed] [Google Scholar]
- 34.Krasilnikov AS, Xiao Y, Pan T, and Mondragon A (2004). Basis for structural diversity in homologous RNAs. Science 306, 104–107. 10.1126/science.1101489. [DOI] [PubMed] [Google Scholar]
- 35.Rao FV, Dorfmueller HC, Villa F, Allwood M, Eggleston IM, and van Aalten DM (2006). Structural insights into the mechanism and inhibition of eukaryotic O-GlcNAc hydrolysis. EMBO J 25, 1569–1578. 10.1038/sj.emboj.7601026. [DOI] [PMC free article] [PubMed] [Google Scholar]
- 36.ter Haar E, Coll JT, Austen DA, Hsiao HM, Swenson L, and Jain J (2001). Structure of GSK3beta reveals a primed phosphorylation mechanism. Nat Struct Biol 8, 593–596. 10.1038/89624. [DOI] [PubMed] [Google Scholar]
- 37.Clevers H, and Nusse R (2012). Wnt/beta-catenin signaling and disease. Cell 149, 1192–1205. 10.1016/j.cell.2012.05.012. [DOI] [PubMed] [Google Scholar]
- 38.Liu C, Kato Y, Zhang Z, Do VM, Yankner BA, and He X (1999). beta-Trcp couples beta-catenin phosphorylation-degradation and regulates Xenopus axis formation. Proc Natl Acad Sci U S A 96, 6273–6278. 10.1073/pnas.96.11.6273. [DOI] [PMC free article] [PubMed] [Google Scholar]
- 39.Hart GW (2019). Nutrient regulation of signaling and transcription. J Biol Chem 294, 2211–2231. 10.1074/jbc.AW119.003226. [DOI] [PMC free article] [PubMed] [Google Scholar]
- 40.Taurin S, Sandbo N, Qin Y, Browning D, and Dulin NO (2006). Phosphorylation of beta-catenin by cyclic AMP-dependent protein kinase. J Biol Chem 281, 9971–9976. 10.1074/jbc.M508778200. [DOI] [PubMed] [Google Scholar]
- 41.Hecht A, Vleminckx K, Stemmler MP, van Roy F, and Kemler R (2000). The p300/CBP acetyltransferases function as transcriptional coactivators of beta-catenin in vertebrates. EMBO J 19, 1839–1850. 10.1093/emboj/19.8.1839. [DOI] [PMC free article] [PubMed] [Google Scholar]
- 42.Shi B, Liang J, Yang X, Wang Y, Zhao Y, Wu H, Sun L, Zhang Y, Chen Y, Li R, et al. (2007). Integration of estrogen and Wnt signaling circuits by the polycomb group protein EZH2 in breast cancer cells. Mol Cell Biol 27, 5105–5119. 10.1128/MCB.00162-07. [DOI] [PMC free article] [PubMed] [Google Scholar]
- 43.Chen J, Luo Q, Yuan Y, Huang X, Cai W, Li C, Wei T, Zhang L, Yang M, Liu Q, et al. (2010). Pygo2 associates with MLL2 histone methyltransferase and GCN5 histone acetyltransferase complexes to augment Wnt target gene expression and breast cancer stem-like cell expansion. Mol Cell Biol 30, 5621–5635. 10.1128/MCB.00465-10. [DOI] [PMC free article] [PubMed] [Google Scholar]
- 44.Margueron R, and Reinberg D (2011). The Polycomb complex PRC2 and its mark in life. Nature 469, 343–349. 10.1038/nature09784. [DOI] [PMC free article] [PubMed] [Google Scholar]
- 45.Lavarone E, Barbieri CM, and Pasini D (2019). Dissecting the role of H3K27 acetylation and methylation in PRC2 mediated control of cellular identity. Nat Commun 10, 1679. 10.1038/s41467-019-09624-w. [DOI] [PMC free article] [PubMed] [Google Scholar]
- 46.Barski A, Cuddapah S, Cui K, Roh TY, Schones DE, Wang Z, Wei G, Chepelev I, and Zhao K (2007). High-resolution profiling of histone methylations in the human genome. Cell 129, 823–837. 10.1016/j.cell.2007.05.009. [DOI] [PubMed] [Google Scholar]
- 47.Karmodiya K, Krebs AR, Oulad-Abdelghani M, Kimura H, and Tora L (2012). H3K9 and H3K14 acetylation co-occur at many gene regulatory elements, while H3K14ac marks a subset of inactive inducible promoters in mouse embryonic stem cells. BMC Genomics 13, 424. 10.1186/1471-2164-13-424. [DOI] [PMC free article] [PubMed] [Google Scholar]
- 48.Li J, Sutter C, Parker DS, Blauwkamp T, Fang M, and Cadigan KM (2007). CBP/p300 are bimodal regulators of Wnt signaling. EMBO J 26, 2284–2294. 10.1038/sj.emboj.7601667. [DOI] [PMC free article] [PubMed] [Google Scholar]
- 49.Bakshi K, Ranjitha B, Dubey S, Jagannadham J, Jaiswal B, and Gupta A (2017). Novel complex of HAT protein TIP60 and nuclear receptor PXR promotes cell migration and adhesion. Sci Rep 7, 3635. 10.1038/s41598-017-03783-w. [DOI] [PMC free article] [PubMed] [Google Scholar]
- 50.Skene PJ, and Henikoff S (2017). An efficient targeted nuclease strategy for high-resolution mapping of DNA binding sites. Elife 6. 10.7554/eLife.21856. [DOI] [PMC free article] [PubMed] [Google Scholar]
- 51.Meers MP, Bryson TD, Henikoff JG, and Henikoff S (2019). Improved CUT&RUN chromatin profiling tools. Elife 8. 10.7554/eLife.46314. [DOI] [PMC free article] [PubMed] [Google Scholar]
- 52.Kim J, Lee Y, Lu X, Song B, Fong KW, Cao Q, Licht JD, Zhao JC, and Yu J (2018). Polycomb- and Methylation-Independent Roles of EZH2 as a Transcription Activator. Cell Rep 25, 2808–2820 e2804. 10.1016/j.celrep.2018.11.035. [DOI] [PMC free article] [PubMed] [Google Scholar]
- 53.Serganov A, and Nudler E (2013). A decade of riboswitches. Cell 152, 17–24. 10.1016/j.cell.2012.12.024. [DOI] [PMC free article] [PubMed] [Google Scholar]
- 54.Sherlock ME, and Breaker RR (2020). Former orphan riboswitches reveal unexplored areas of bacterial metabolism, signaling, and gene control processes. RNA 26, 675–693. 10.1261/rna.074997.120. [DOI] [PMC free article] [PubMed] [Google Scholar]
- 55.Win MN, and Smolke CD (2008). Higher-order cellular information processing with synthetic RNA devices. Science 322, 456–460. 10.1126/science.1160311. [DOI] [PMC free article] [PubMed] [Google Scholar]
- 56.Trachman RJ 3rd, Abdolahzadeh A, Andreoni A, Cojocaru R, Knutson JR, Ryckelynck M, Unrau PJ, and Ferre-D’Amare AR (2018). Crystal Structures of the Mango-II RNA Aptamer Reveal Heterogeneous Fluorophore Binding and Guide Engineering of Variants with Improved Selectivity and Brightness. Biochemistry 57, 3544–3548. 10.1021/acs.biochem.8b00399. [DOI] [PMC free article] [PubMed] [Google Scholar]
- 57.Trachman RJ 3rd, Autour A, Jeng SCY, Abdolahzadeh A, Andreoni A, Cojocaru R, Garipov R, Dolgosheina EV, Knutson JR, Ryckelynck M, et al. (2019). Structure and functional reselection of the Mango-III fluorogenic RNA aptamer. Nat Chem Biol 15, 472–479. 10.1038/s41589-019-0267-9. [DOI] [PMC free article] [PubMed] [Google Scholar]
- 58.Dolgosheina EV, Jeng SC, Panchapakesan SS, Cojocaru R, Chen PS, Wilson PD, Hawkins N, Wiggins PA, and Unrau PJ (2014). RNA mango aptamer-fluorophore: a bright, high-affinity complex for RNA labeling and tracking. ACS Chem Biol 9, 2412–2420. 10.1021/cb500499x. [DOI] [PubMed] [Google Scholar]
- 59.Sierra J, Yoshida T, Joazeiro CA, and Jones KA (2006). The APC tumor suppressor counteracts beta-catenin activation and H3K4 methylation at Wnt target genes. Genes Dev 20, 586–600. 10.1101/gad.1385806. [DOI] [PMC free article] [PubMed] [Google Scholar]
- 60.Conrad RC, Giver L, Tian Y, and Ellington AD (1996). In vitro selection of nucleic acid aptamers that bind proteins. Methods Enzymol 267, 336–367. 10.1016/s0076-6879(96)67022-0. [DOI] [PubMed] [Google Scholar]
- 61.Fitzwater T, and Polisky B (1996). A SELEX primer. Methods Enzymol 267, 275–301. 10.1016/s0076-6879(96)67019-0. [DOI] [PubMed] [Google Scholar]
- 62.Kenan DJ, and Keene JD (1999). In vitro selection of aptamers from RNA libraries. Methods Mol Biol 118, 217–231. 10.1385/1-59259-676-2:217. [DOI] [PubMed] [Google Scholar]
- 63.White R, Rusconi C, Scardino E, Wolberg A, Lawson J, Hoffman M, and Sullenger B (2001). Generation of species cross-reactive aptamers using “toggle” SELEX. Mol Ther 4, 567–573. 10.1006/mthe.2001.0495. [DOI] [PubMed] [Google Scholar]
- 64.Szeto K, Latulippe DR, Ozer A, Pagano JM, White BS, Shalloway D, Lis JT, and Craighead HG (2013). RAPID-SELEX for RNA aptamers. PLoS One 8, e82667. 10.1371/journal.pone.0082667. [DOI] [PMC free article] [PubMed] [Google Scholar]
- 65.Martin M (2011). Cutadapt removes adapter sequences from high-throughput sequencing reads. EMBnet.journal 17. 10.14806/ej.17.1.200. [DOI] [Google Scholar]
- 66.Alam KK, Chang JL, and Burke DH (2015). FASTAptamer: A Bioinformatic Toolkit for High-throughput Sequence Analysis of Combinatorial Selections. Mol Ther Nucleic Acids 4, e230. 10.1038/mtna.2015.4. [DOI] [PMC free article] [PubMed] [Google Scholar]
- 67.Lorenz R, Bernhart SH, Honer Zu Siederdissen C, Tafer H, Flamm C, Stadler PF, and Hofacker IL (2011). ViennaRNA Package 2.0. Algorithms Mol Biol 6, 26. 10.1186/1748-7188-6-26. [DOI] [PMC free article] [PubMed] [Google Scholar]
- 68.Reuter JS, and Mathews DH (2010). RNAstructure: software for RNA secondary structure prediction and analysis. BMC Bioinformatics 11, 129. 10.1186/1471-2105-11-129. [DOI] [PMC free article] [PubMed] [Google Scholar]
- 69.Popenda M, Szachniuk M, Antczak M, Purzycka KJ, Lukasiak P, Bartol N, Blazewicz J, and Adamiak RW (2012). Automated 3D structure composition for large RNAs. Nucleic Acids Res 40, e112. 10.1093/nar/gks339. [DOI] [PMC free article] [PubMed] [Google Scholar]
- 70.Antczak M, Popenda M, Zok T, Sarzynska J, Ratajczak T, Tomczyk K, Adamiak RW, and Szachniuk M (2016). New functionality of RNAComposer: an application to shape the axis of miR160 precursor structure. Acta Biochim Pol 63, 737–744. 10.18388/abp.2016_1329. [DOI] [PubMed] [Google Scholar]
- 71.Stasiewicz J, Mukherjee S, Nithin C, and Bujnicki JM (2019). QRNAS: software tool for refinement of nucleic acid structures. BMC Struct Biol 19, 5. 10.1186/s12900-019-0103-1. [DOI] [PMC free article] [PubMed] [Google Scholar]
- 72.Pettersen EF, Goddard TD, Huang CC, Meng EC, Couch GS, Croll TI, Morris JH, and Ferrin TE (2021). UCSF ChimeraX: Structure visualization for researchers, educators, and developers. Protein Sci 30, 70–82. 10.1002/pro.3943. [DOI] [PMC free article] [PubMed] [Google Scholar]
- 73.Chang AL, McKeague M, and Smolke CD (2014). Facile characterization of aptamer kinetic and equilibrium binding properties using surface plasmon resonance. Methods Enzymol 549, 451–466. 10.1016/B978-0-12-801122-5.00019-2. [DOI] [PMC free article] [PubMed] [Google Scholar]
- 74.Wickham H (2016). ggplot2 10.1007/978-3-319-24277-4. [DOI] [Google Scholar]
- 75.Schindelin J, Arganda-Carreras I, Frise E, Kaynig V, Longair M, Pietzsch T, Preibisch S, Rueden C, Saalfeld S, Schmid B, et al. (2012). Fiji: an open-source platform for biological-image analysis. Nat Methods 9, 676–682. 10.1038/nmeth.2019. [DOI] [PMC free article] [PubMed] [Google Scholar]
- 76.Murase S, Mosser E, and Schuman EM (2002). Depolarization Drives β-Catenin into Neuronal Spines Promoting Changes in Synaptic Structure and Function. Neuron 35, 91–105. 10.1016/s0896-6273(02)00764-x. [DOI] [PubMed] [Google Scholar]
- 77.Stenoien DL, Mancini MG, Patel K, Allegretto EA, Smith CL, and Mancini MA (2000). Subnuclear trafficking of estrogen receptor-alpha and steroid receptor coactivator-1. Mol Endocrinol 14, 518–534. 10.1210/mend.14.4.0436. [DOI] [PubMed] [Google Scholar]
- 78.Hudson ER, Pan DA, James J, Lucocq JM, Hawley SA, Green KA, Baba O, Terashima T, and Hardie DG (2003). A Novel Domain in AMP-Activated Protein Kinase Causes Glycogen Storage Bodies Similar to Those Seen in Hereditary Cardiac Arrhythmias. Current Biology 13, 861–866. 10.1016/s0960-9822(03)00249-5. [DOI] [PubMed] [Google Scholar]
- 79.Willert K, Brown JD, Danenberg E, Duncan AW, Weissman IL, Reya T, Yates JR 3rd, and Nusse R (2003). Wnt proteins are lipid-modified and can act as stem cell growth factors. Nature 423, 448–452. 10.1038/nature01611. [DOI] [PubMed] [Google Scholar]
- 80.Kreppel LK, Blomberg MA, and Hart GW (1997). Dynamic glycosylation of nuclear and cytosolic proteins. Cloning and characterization of a unique O-GlcNAc transferase with multiple tetratricopeptide repeats. J Biol Chem 272, 9308–9315. 10.1074/jbc.272.14.9308. [DOI] [PubMed] [Google Scholar]
- 81.Comer FI, Vosseller K, Wells L, Accavitti MA, and Hart GW (2001). Characterization of a mouse monoclonal antibody specific for O-linked N-acetylglucosamine. Anal Biochem 293, 169–177. 10.1006/abio.2001.5132. [DOI] [PubMed] [Google Scholar]
- 82.Iyer SP, Akimoto Y, and Hart GW (2003). Identification and cloning of a novel family of coiled-coil domain proteins that interact with O-GlcNAc transferase. J Biol Chem 278, 5399–5409. 10.1074/jbc.M209384200. [DOI] [PubMed] [Google Scholar]
- 83.Butkinaree C, Cheung WD, Park S, Park K, Barber M, and Hart GW (2008). Characterization of beta-N-acetylglucosaminidase cleavage by caspase-3 during apoptosis. J Biol Chem 283, 23557–23566. 10.1074/jbc.M804116200. [DOI] [PMC free article] [PubMed] [Google Scholar]
- 84.Hardiville S, Banerjee PS, Selen Alpergin ES, Smith DM, Han G, Ma J, Talbot CC Jr., Hu P, Wolfgang MJ, and Hart GW (2020). TATA-Box Binding Protein O-GlcNAcylation at T114 Regulates Formation of the B-TFIID Complex and Is Critical for Metabolic Gene Regulation. Mol Cell 77, 1143–1152 e1147. 10.1016/j.molcel.2019.11.022. [DOI] [PMC free article] [PubMed] [Google Scholar]
- 85.Veeman MT, Slusarski DC, Kaykas A, Louie SH, and Moon RT (2003). Zebrafish Prickle, a Modulator of Noncanonical Wnt/Fz Signaling, Regulates Gastrulation Movements. Current Biology 13, 680–685. 10.1016/s0960-9822(03)00240-9. [DOI] [PubMed] [Google Scholar]
- 86.Brocher J (2015). The BioVoxxel Image Processing and Analysis Toolbox. EuBIAS-Conference. [Google Scholar]
- 87.Doyle M, Phipson B, and Dashnow H (2021). RNA-Seq reads to counts (Galaxy Training Materials; ). [Google Scholar]
- 88.Krueger F, James F, Ewels P, Afyounian E, and Schuster-Boeckler B (2021). Trim Galore!
- 89.Kim D, Paggi JM, Park C, Bennett C, and Salzberg SL (2019). Graph-based genome alignment and genotyping with HISAT2 and HISAT-genotype. Nat Biotechnol 37, 907–915. 10.1038/s41587-019-0201-4. [DOI] [PMC free article] [PubMed] [Google Scholar]
- 90.Liao Y, Smyth GK, and Shi W (2014). featureCounts: an efficient general purpose program for assigning sequence reads to genomic features. Bioinformatics 30, 923–930. 10.1093/bioinformatics/btt656. [DOI] [PubMed] [Google Scholar]
- 91.Dunning M (2017). annotateMyIDs.
- 92.Love MI, Huber W, and Anders S (2014). Moderated estimation of fold change and dispersion for RNA-seq data with DESeq2. Genome Biol 15, 550. 10.1186/s13059-014-0550-8. [DOI] [PMC free article] [PubMed] [Google Scholar]
- 93.Blighe K, Rana S, and Lewis M (2021). EnhancedVolcano: Publication-ready volcano plots with enhanced colouring and labeling. R package version 1.10.0 https://github.com/kevinblighe/EnhancedVolcano. [Google Scholar]
- 94.Liu N (2021). Library Prep for CUT&RUN with NEBNext Ultra II DNA Library Prep Kit for Illumina (E7645) V.2. protocols.io 10.17504/protocols.io.bagaibse. [DOI] [Google Scholar]
- 95.Zheng Y, Ahmad K, and Henikoff S (2020). CUT&Tag Data Processing and Analysis Tutorial. protocols.io 10.17504/protocols.io.bjk2kkye. [DOI] [Google Scholar]
- 96.Langmead B, and Salzberg SL (2012). Fast gapped-read alignment with Bowtie 2. Nat Methods 9, 357–359. 10.1038/nmeth.1923. [DOI] [PMC free article] [PubMed] [Google Scholar]
- 97.Li H, Handsaker B, Wysoker A, Fennell T, Ruan J, Homer N, Marth G, Abecasis G, Durbin R, and Genome Project Data Processing, S. (2009). The Sequence Alignment/Map format and SAMtools. Bioinformatics 25, 2078–2079. 10.1093/bioinformatics/btp352. [DOI] [PMC free article] [PubMed] [Google Scholar]
- 98.Quinlan AR, and Hall IM (2010). BEDTools: a flexible suite of utilities for comparing genomic features. Bioinformatics 26, 841–842. 10.1093/bioinformatics/btq033. [DOI] [PMC free article] [PubMed] [Google Scholar]
- 99.Meers MP, Tenenbaum D, and Henikoff S (2019). Peak calling by Sparse Enrichment Analysis for CUT&RUN chromatin profiling. Epigenetics Chromatin 12, 42. 10.1186/s13072-019-0287-4. [DOI] [PMC free article] [PubMed] [Google Scholar]
- 100.Stark R, and Brown G (2011). DiffBind: differential binding analysis of ChIP-Seq peak data.
- 101.Ross-Innes CS, Stark R, Teschendorff AE, Holmes KA, Ali HR, Dunning MJ, Brown GD, Gojis O, Ellis IO, Green AR, et al. (2012). Differential oestrogen receptor binding is associated with clinical outcome in breast cancer. Nature 481, 389–393. 10.1038/nature10730. [DOI] [PMC free article] [PubMed] [Google Scholar]
- 102.Yu G, Wang LG, and He QY (2015). ChIPseeker: an R/Bioconductor package for ChIP peak annotation, comparison and visualization. Bioinformatics 31, 2382–2383. 10.1093/bioinformatics/btv145. [DOI] [PubMed] [Google Scholar]
- 103.Carroll T, and Barrows D (2021). profileplyr: Visualization and annotation of read signal over genomic ranges with profileplyr. R package version 1.8.1 [Google Scholar]
- 104.Kent WJ, Zweig AS, Barber G, Hinrichs AS, and Karolchik D (2010). BigWig and BigBed: enabling browsing of large distributed datasets. Bioinformatics 26, 2204–2207. 10.1093/bioinformatics/btq351. [DOI] [PMC free article] [PubMed] [Google Scholar]
- 105.Robinson JT, Thorvaldsdottir H, Winckler W, Guttman M, Lander ES, Getz G, and Mesirov JP (2011). Integrative genomics viewer. Nat Biotechnol 29, 24–26. 10.1038/nbt.1754. [DOI] [PMC free article] [PubMed] [Google Scholar]
Associated Data
This section collects any data citations, data availability statements, or supplementary materials included in this article.
Supplementary Materials
Figure S1. Predicted Secondary Structures of Several Dual-Specificity Aptamers Used in This Research. Related to All Figures
(A) to (D) Sequences and predicted secondary structures of 3JB1F+6, 4JC1RR, 3JB8F+12 and 3JB8R+12, respectively.
Figure S2. Dual-Specificity Aptamers Increase O-GlcNAcylation on GFP-Tagged Proteins. Related to Figure 2
(A) IP-WB of HEK293T cells expressing GFP-β-catenin and the indicated aptamers. N=5.
(B) Optimization of co-transfection of GFP-β-catenin. IP-WB on cells co-transfected with various amounts of plasmids encoding GFP-β-catenin, and 1 μg plasmids encoding the indicated aptamers.
(C) Quantification of (B). Data are normalized to the control group (T1 · AP3) with 0.1 μg GFP-β-catenin plasmid. N=3.
(D) IP-WB on cells expressing GFP and the indicated aptamers. The lane with protein ladder is included as a positive control. N=3.
(E) WB of total cell lysates from Figure 2C.
(F) Mass-shift assays on cells expressing GFP-β-catenin and the indicated aptamers. Two blots on β-catenin with short and long exposure time are shown. Intensities of the shifted bands are normalized to that of β-tubulin. N=3.
(G) IP-WB of cells expressing GFP-β-catenin and the indicated aptamers, and stimulated with Wnt3A-conditioned medium for 4 hr. Irrelevant lanes are cropped. N=3.
(H) Schematic of 3JB1R.
(I) Optimization of the linker domain of 3JB1R. IP-WB on cells expressing GFP-β-catenin and the indicated aptamers. N=3.
(J) and (K) IP-WB (K), and Co-IP (K) on cells expressing GFP-Src and the indicated aptamers. N=3.
(L) IP-WB of cells expressing GFP-AMPKα2 and the indicated aptamers. N=3.
T1 · AP3 – Individual T1 and AP3 aptamers (control). NL1F35/50 – DS aptamers (T1-linker-AP3) with flexible linkers of 35/50 nt. 3JB1F/3JB1R/4JC1RR – DS aptamers (T1-linker-AP3) with folded linkers. +2/+4/…/+12, serial additions (bp) into the folded linker. Quantitated data are normalized to the control groups (T1 · AP3). Student’s t-test in (A), (F), (G). Two-way ANOVA test in (C). One-way ANOVA test in other panels. Data are represented as mean ± SD. ns, p ≥ 0.05; *, p < 0.05; **, p < 0.01; ***, p < 0.001; ****, p < 0.0001.
Figure S3. DS Aptamers Reveal Unmapped O-GlcNAc Sites on β-catenin, and O-GlcNAc Stabilizes GFP-β-catenin by Inhibiting Its Interaction With β-TrCP. Related to Figure 3
(A), (C), (E) and (G) IP-WB on cells expressing GFP-β-catenin and the indicated aptamers.
In (C) and (G), cells were treated with 50 μM Ac5S for 20 hr. N=3.
(B), (D), (F) and (H) WB on cells expressing GFP-β-catenin and the indicated aptamers. In (D) and (H), cells were treated with 50 μM Ac5S for 20 hr. In (F) and (H), both chemiluminescence and fluorescence WB were performed and they generated consistent results. Intensity of each band is normalized to that of β-tubulin. N=3.
(I) O-GlcNAc on the GFP-β-cateninS23A; T40A; T41A; T112A; or 4A mutant was reduced by CpOGA. Lysate of HEK293T cells expressing GFP-β-catenin4A was treated with CpOGA and subjected to IP-WB. N=3.
(J) Antibody recognition of O-GlcNAc on GFP-β-catenin4A was competed by 1 M GlcNAc. IP-WB of cells expressing GFP-β-catenin4A. 1 M GlcNAc was included in the antibody solution during WB for the membrane on the left. Lanes on the left and right are from two membranes but imaged together for equal exposure. Borders were added to the top blots. N=3.
(K) and (L) Quantifications of phosphorylation on endogenous β-catenin and abundance of proteins in Figures 3D (K) and 3E (L). Intensity of each band is normalized to that of β-tubulin. N=3.
T1 · AP3 – Individual T1 and AP3 aptamers (control). NL1F30 – DS aptamers (T1-linker-AP3) with flexible linkers of 30 nt. 3JB1F+6 – DS aptamers (T1-linker-bc339) with a folded linker. Quantitated data are normalized to the control groups (T1 · AP3) unless indicated. Student’s t-test. Data are represented as mean ± SD. ns, p ≥ 0.05; *, p < 0.05; **, p < 0.01; ***, p < 0.001.
Figure S4. DS Aptamers Increase O-GlcNAcylation on Endogenous β-catenin. Related to Figures 4, 5
(A) WB of whole cell lysate from Figure 4D and quantification. Intensity of each band in WB is normalized to that of β-tubulin. One-way ANOVA test, N=3.
(B) Mass-shift assays on HEK293T cells expressing the indicated aptamers. Two blots of β-catenin with short and long exposure time are shown. Intensity of the shifted bands is normalized to that of β-tubulin. N=3.
(C) and (D) WB on cells expressing the indicated aptamers, and treated with regular (C) or Wnt3A-conditioned (D) medium. Intensity of each β-catenin band is normalized to that of β-tubulin. N=3.
(E) and (F) WB on HEK293T cells expressing the indicated aptamers, and treated with regular (E) or Wnt3A-conditioned (F) medium. N=4.
(G) and (H) IP-WB of HEK293T cells expressing the indicated aptamers, treated with Ac5S and regular (G) or Wnt3A-conditioned (H) medium. N=3.
(I) Co-IP between β-catenin and OGT, on cells expressing the indicated aptamers. Intensity of each OGT band is normalized to that of β-catenin. N=3.
(J) Predicted tertiary structure of the DS aptamer 3JB8R+12. Nucleotides are color coded in the same way as its secondary structure prediction in Figure S1D.
(K) and (L) IP-WB on HEK293T cells expressing the indicated aptamers, and treated with regular (K) or Wnt3A-conditioned (L) medium. N=3.
(M) and (N) Co-IP between β-catenin and EZH2, on cells expressing the indicated aptamers, and treated with regular (M) or Wnt3A-conditioned (N) medium. Intensity of each EZH2 band is normalized to that of β-catenin. N=6.
T1 · bc339 – Individual T1 and bc339 aptamers (control). NL8F50/70/100 – DS aptamers (T1-linker-bc339) with flexible linkers of 50/70/100 nt. 3JB8F/3JB8R – DS aptamers (T1-linker-bc339) with folded linkers. +12, 12 bp additions into the folded linker. Quantitated data are normalized to the control groups (T1 · bc339). One-way ANOVA test in (A). Student’s t-test in other panels. Data are represented as mean ± SD. ns, p ≥ 0.05; *, p < 0.05, ***, p < 0.001.
Figure S5. O-GlcNAc Promotes β-catenin’s Interactions With KAT2A. Related to Figure 5
(A) to (H) Confocal images of Proximity Ligation Assay (PLA) on HEK293T cells expressing the indicated aptamers and stimulated with regular (−Wnt) or Wnt3A-conditioned (+Wnt) medium. PLA was performed with antibodies targeting β-catenin and KAT2A or H3K9ac. In (C) and (D), cells were treated with 50 μM Ac5S for 20 hr.
(I) to (P) Quantification of (A) to (H). PLA puncta in nucleus are counted and normalized to the number of nuclei in each image. Student’s t-test. N=10. Data are represented as mean ± SD. ns, p ≥ 0.05; ***, p < 0.001; ****, p < 0.0001.
T1 · bc339 – Individual T1 and bc339 aptamers (control). 3JB8F+12/R+12 – DS aptamers (T1-linker-bc339) with folded linkers.
Figure S6. O-GlcNAc Regulates β-catenin’s Interactions With EP300, KAT5 and β-TrCP. Related to Figure 5
(A) to (F) Confocal images of PLA on HEK293T cells expressing the indicated aptamers, and stimulated with regular (−Wnt) or Wnt3A-conditioned (+Wnt) medium. PLA was performed with antibodies targeting β-catenin and EP300, KAT5, or β-TrCP.
(G) and (H) Confocal images of the negative control experiments of PLA. Cells were treated with regular (−Wnt) or Wnt3A-conditioned (+Wnt) medium. PLA was performed with the antibody targeting β-catenin and normal rabbit IgG.
(I) to (P) Quantification of (A) to (H). Nuclear or total PLA puncta are counted and normalized to the number of nuclei in each image. Student’s t-test. N=10 (I to N) or 5 (O to P). Data are represented as mean ± SD. **, p < 0.01; ***, p < 0.001; ****, p < 0.0001.
T1 · bc339 – Individual T1 and bc339 aptamers (control). 3JB8F+12 – A DS aptamer (T1-linker-bc339) with a folded linker.
Figure S7. O-GlcNAc on β-catenin Increases Its Transcriptional Activity and Recruits EZH2 to Promoters. Related to Figure 6
(A) to (B) TOPFlash luciferase reporter assay on HEK293T cells expressing the indicated aptamers, and stimulated with regular (−Wnt) or Wnt3A-conditioned (+Wnt) medium. In (B), cells were treated with 50 μM Ac5S for 20 hr. N=3.
(C) TOPFlash assay on cells expressing a scrambled RNA (scrambled), a shRNA targeting OGT (shOGT), or the shRNA with a codon-optimized OGT (shOGT + OGT). N=6.
(D) TOPFlash assay on cells treated with vehicle (DMSO), an inhibitor of OGT (Ac5S) or an inhibitor of OGA (TMG). N=3.
(E) TOPFlash assay on cells expressing the indicated RNA. N=3.
(F) and (G) Distribution of the differential binding sites of EZH2 on the genome, under −Wnt (A) and +Wnt (B) conditions.
(H) and (I) The binding peaks of EZH2 on the three promoters shown in Figure 6C under the indicated conditions. N=3.
(J) Numbers of the binding peaks of EZH2 on the genome under the indicated conditions. Analysis is performed on the data presented in Figures 6C and S7H. N=3.
(K) WB on HEK293T cells that are WT, or stably expressing a shRNA targeting β-catenin or EZH2. Intensity of each band is normalized to that of β-tubulin. Irrelevant lanes are cropped. N=2.
T1 · bc339 – Individual T1 and bc339 aptamers (control). 3JB8F+12 – A DS aptamer (T1-linker-bc339) with a folded linker. Two-way ANOVA test in (A) to (E) and (J). Data are represented as mean ± SD. ns, p ≥ 0.05; **, p < 0.01; ***, p < 0.001; ****, p < 0.0001.
Table S3. Transfections in TOPFlash Assay. Related to Figure S7
Table S4. Differential Binding Sites of EZH2 Identified in CUT&RUN. Related to Figure 6
Table S5. Differentially Expressed Genes Identified in RNA-Seq. Related to Figure 6
Table S6. DNA Oligos for SELEX and TaqMan Assays. Related to STAR Methods and Key Resources Table
Table S7. Aptamer Sequences. Related to Key Resources Table
Data Availability Statement
CUT&RUN-seq and RNA-seq data have been deposited at GEO and are publicly available as of the date of publication. Accession numbers are listed in the key resources table. All other data have been deposited at Figshare and are publicly available as of the date of publication. The DOI is listed in the key resources table.
This paper does not report original code.
Any additional information required to reanalyze the data reported in this paper is available from the lead contact upon request.
KEY RESOURCES TABLE
| REAGENT or RESOURCE | SOURCE | IDENTIFIER |
|---|---|---|
| Antibodies | ||
| Mouse monoclonal anti-O-GlcNAc IgM (strain CTD110.6) | Comer et al.81 Produced in the lab | N/A |
| Rabbit polyclonal anti-OGT (AL28) | Iyer et al.82 Produced in the lab | N/A |
| Rabbit polyclonal anti-OGT (AL24) | Kreppel et al.80 Produced in the lab | N/A |
| Chicken polyclonal anti-OGA IgY (345) | Butkinaree et al.83 Produced in the lab | N/A |
| Mouse monoclonal anti-β-Catenin (clone 14) | BD Biosciences | Cat#: 610153; RRID: AB_397555 |
| Rabbit polyclonal anti-β-Catenin | Cell Signaling Technology | Cat#: 9562; RRID: AB_331149 |
| Rabbit polyclonal anti-β-Catenin | ProteinTech | Cat#: 17565-1-AP; RRID: AB_2088102 |
| Rabbit monoclonal anti-Non-phospho (Active) β-Catenin (Ser33/37/Thr41) (D13A1) | Cell Signaling Technology | Cat#: 8814; RRID: AB_11127203 |
| Rabbit monoclonal anti-Non-phospho (Active) β-Catenin (Ser45) (D2U8Y) | Cell Signaling Technology | Cat#: 19807; RRID: AB_2650576 |
| Recombinant Rabbit polyclonal anti-phospho-β-Catenin (Ser33/37) (4HCLC) | Invitrogen | Cat#: 711404; RRID: AB_2633009 |
| Rabbit polyclonal anti-phospho-β-Catenin (Ser45) | Cell Signaling Technology | Cat#: 9564; RRID: AB_331150 |
| Rabbit monoclonal anti-phospho-β-Catenin (Ser552) (D8E11) | Cell Signaling Technology | Cat#: 5651; RRID: AB_10831053 |
| Rabbit monoclonal anti-phospho-β-Catenin (Ser675) (D2F1) | Cell Signaling Technology | Cat#: 4176, RRID: AB_1903923 |
| Recombinant Rabbit monoclonal anti-GFP | Invitrogen | Cat#: G10362; RRID: AB_2536526 |
| Mouse monoclonal anti-GFP (3E6) | Invitrogen | Cat#: A-11120; RRID: AB_221568 |
| GFP-Trap Magnetic Agarose | ProteinTech | Cat#: gtma-10; RRID: AB_2631358 |
| Rabbit polyclonal anti-β-TrCP | Invitrogen | Cat#: PA5-106884; RRID: AB_2854548 |
| Rabbit monoclonal anti-EZH2 (D2C9) | Cell Signaling Technology | Cat#: 5246; RRID: AB_10694683 |
| Mouse monoclonal anti-EP300 (clone NM11) | Active Motif | Cat#: 61401; RRID: AB_2716754 |
| Rabbit monoclonal anti-KAT2A/GCN5L2 (C26A10) | Cell Signaling Technology | Cat#: 3305; RRID: AB_2128281 |
| Rabbit polyclonal anti-KAT5 | ProteinTech | Cat#: 10827-1-AP; RRID: AB_2128431 |
| Rabbit monoclonal anti-H3K27me3 (C36B11) | Cell Signaling Technology | Cat#: 9733; RRID: AB_2616029 |
| Rabbit monoclonal anti-H3K9ac (C5B11) | Cell Signaling Technology | Cat#: 9649; RRID: AB_823528 |
| Rabbit polyclonal anti-β-Tubulin | Cell Signaling Technology | Cat#: 2146; RRID: AB_2210545 |
| Normal Rabbit IgG | Millipore | Cat#: 12-370; RRID: AB_145841 |
| Normal Rabbit IgG | Cell Signaling Technology | Cat#: 2729; RRID: AB_1031062 |
| Mouse IgG1 Isotype Control (MOPC-21) | Invitrogen | Cat#: MA1-10406; RRID: AB_2536774 |
| Goad anti-Mouse IgM (μ-chain specific) polyclonal secondary antibody, HRP-conjugated | Sigma-Aldrich | Cat#: A8786; RRID: AB_258413 |
| Goat anti-Rabbit IgG (Heavy Chain), Superclonal recombinant secondary antibody, HRP-conjugated | Invitrogen | Cat#: A27036; RRID: AB_2536099 |
| Goat anti-Mouse IgG (H+L), Superclonal recombinant secondary antibody, HRP-conjugated | Invitrogen | Cat#: A28177; RRID: AB_2536163 |
| Bacterial and virus strains | ||
| Stellar Competent Cells: E. coli HST08 strain | TaKaRa | Cat#: 636766 |
| NiCo21 (DE3) Competent E. coli | New England BioLabs | Cat#: C2529H |
| Biological samples | ||
| Chemicals, peptides, and recombinant proteins | ||
| TransIT-X2 | Mirus Bio | Cat#: MIR 6000 |
| Dulbecco’s Modified Eagle Medium (DMEM) | Gibco | Cat#: 10567014 |
| Fetal bovine serum (FBS) | Gibco | Cat#: 16140071 |
| Penicillin-Streptomycin | Gibco | Cat#: 15140163 |
| Hygromycin B | Gibco | Cat#: 10687010 |
| Puromycin dihydrochloride | Sigma-Aldrich | Cat#: P8833 |
| TrypLE Express Enzyme | Gibco | Cat#: 12604013 |
| 2-Propanol | Sigma-Aldrich | Cat#: I9516-500mL; CAS: 67-63-0 |
| Q5 High-Fidelity DNA Polymerase | New England BioLabs | Cat#: M0491 |
| SuperScript IV Reverse Transcriptase | Invitrogen | Cat#: 18090010 |
| TOPO TA Cloning Kit for Sequencing | Invitrogen | Cat#: 450030 |
| Amine Coupling Kit | GE Healthcare/Cytiva | Cat#: BR100050 |
| Antarctic Phosphatase | New England BioLabs | Cat#: M0289 |
| [γ−32P]-ATP | American Radiolabeled Chemicals | Cat#: ARP 0102F-250 μCi |
| T4 Polynucleotide Kinase | New England Biolabs | Cat#: M0201 |
| Acid-Phenol: Chloroform, pH 4.5 | Invitrogen | Cat#: AM9720 |
| Phenol: Chloroform, pH 8.05 | Invitrogen | Cat#: 15593031 |
| Yeast tRNA | Invitrogen | Cat#: AM7119 |
| Bovine Serum Albumin | New England BioLabs | Cat#: B9001 |
| IPTG | Invitrogen | Cat#: 15529019 |
| Protease Inhibitor Cocktail | Roche | Cat#: 11873580001 |
| Lysozyme | Thermo Scientific | Cat#: 89833 |
| PreScission Protease | GenScript | Cat#: Z02799 |
| PMSF | Roche | Cat#: 10837091001 |
| DNA Polymerase I, Large (Klenow) Fragment | New England BioLabs | Cat#: M0210 |
| Halt Phosphatase Inhibitor Cocktail | Thermo Scientific | Cat#: 78426 |
| RNaseOUT Recombinant Ribonuclease Inhibitor | Invitrogen | Cat#: 10777019 |
| Ribonucleoside Vanadyl Complex | New England BioLabs | Cat#: S1402 |
| TURBO DNase | Invitrogen | Cat#: AM2238 |
| GalTY289L | Gift from K. Moremen | N/A |
| UDP-GalNAz | Chemily | Cat#: SN02012 |
| Amino-dPEG12-Tris (dPEG12-Tris(m-dPEG11)3)3 | Quanta BioDesign | Cat#: 10482 |
| DBCO-NHS ester | Click Chemistry Tools | Cat#: A133 |
| Iodoacetamide | Sigma-Aldrich | Cat#: I1149 |
| Dichloromethane | Sigma-Aldrich | Cat#: D65100 |
| TaqMan Fast Advanced Master Mix | Applied Biosystems | Cat#: 4444557 |
| TRIzol Reagent | Invitrogen | Cat#: 15596026 |
| 16% Formaldehyde (w/v), Methanol-free | Thermo Scientific | Cat#: 28908 |
| TO1-3PEG-Biotin | Applied Biological Materials (abm) | Cat#: G955 |
| CKII peptide (PGGSTPVSSANMM) | Synthesized by JHMI Synthesis & Sequencing Facility | N/A |
| Critical commercial assays | ||
| Pierce BCA Protein Assay Kit | Thermo Scientific | Cat#: 23227 |
| UDP-Glo Glycosyltransferase Assay kit | Promega | Cat#: V6971 |
| In-Fusion HD Cloning Plus kit | TaKaRa Bio | Cat#: 638909 |
| Purelink Fast Low Endotoxin Midi Plasmid Purification kit | Invitrogen | Cat#: A35892 |
| Pierce Protein A/G Magnetic Beads | Thermo Scientific | Cat#: 88802 |
| Ni-NTA Agarose | Qiagen | Cat#: 30210 |
| Pierce Glutathione Agarose Beads | Thermo Scientific | Cat#: 16100 |
| NuPAGE 4 to 12%, Bis-Tris, 1.0 mm, Midi Protein Gel, 20-well | Invitrogen | Cat#: WG1402BOX |
| Amersham Hybond P 0.2 PVDF membrane | GE Healthcare/Cytiva | Cat#: 10600021 |
| SuperSignal West Femto ECL Substrate | Thermo Scientific | Cat#: 34095 |
| SuperSignal West Pico PLUS ECL Substrate | Thermo Scientific | Cat#: 34577 |
| PARIS Kit | Invitrogen | Cat#: AM1921 |
| Duolink PLA Reagents | Sigma-Aldrich | Cat#: DUO92001, DUO92005, DUO92013, DUO82049 |
| AlexaFluor 488 phalloidin | Invitrogen | Cat#: R37110 |
| AlexaFluor 555 phalloidin | Invitrogen | Cat#: R37112 |
| ProLong Glass Antifade Mountant with NucBlue Stain | Invitrogen | Cat#: P36985 |
| CUTANA ChIC/CUT&RUN Kit | EpiCypher | Cat#: 14-1048 |
| Qubit 1X dsDNA HS Assay Kit | Invitrogen | Cat#: Q33230 |
| NEBNext Ultra II DNA Library Prep with Sample Purification Beads | New England BioLabs | Cat#: E7103L |
| NEBNext Multiplex Oligos for Illumina (96 Unique Dual Index Primer Pairs) | New England BioLabs | Cat#: E6440S |
| Nano-Glo Dual-Luciferase Reporter Assay System | Promega | Cat#: N1610 |
| Deposited data | ||
| Human Reference Genome GRCh38.p13 | Ensembl | http://www.ensembl.org/Homo_sapiens/Info/Index |
| Escherichia coli Reference Genome ASM584v2 (str. K12 substr. MG1655) | Ensembl Bacteria | https://bacteria.ensembl.org/Escherichia_coli_str_k_12_substr_mg1655_gca_000005845/Info/Index |
| CUT&RUN Sequencing Data (Raw and Analyzed) | This paper | GEO: GSE190172 |
| CUT&RUN Sequencing Data, shβ-catenin samples (Raw and Analyzed) | This paper | GEO: GSE214775 |
| CUT&RUN Sequencing Data, Ac5S treated samples (Raw and Analyzed) | This paper | GEO: GSE214774 |
| RNA Sequencing Data (Raw and Analyzed) | This paper | GEO: GSE189378 |
| RNA Sequencing Data, Ac5S treated samples (Raw and Analyzed) | This paper | GEO: GSE189622 |
| RNA Sequencing Data, shEZH2 samples (Raw and Analyzed) | This paper | GEO: GSE214777 |
| Raw and analyzed data of this paper | This paper | Figshare: https://doi.org/10.6084/m9.figshare.17129945.v4 |
| Experimental models: Cell lines | ||
| HEK293T | ATCC | Cat#: CRL-3216, RRID: CVCL_0063 |
| L Wnt-3A | Willert et al.79 ATCC | Cat#: CRL-2647; RRID: CVCL_0635 |
| T1 | This paper | N/A |
| NL1F50 | This paper | N/A |
| 3JB8F+12 | This paper | N/A |
| shβ-catenin | This paper | N/A |
| shEZH2 | This paper | N/A |
| Experimental models: Organisms/strains | ||
| Oligonucleotides | ||
| DNA oligos for SELEX, see Table S6 | This paper | N/A |
| Primers and Probes for TaqMan Assays, see Table S6 | This paper | N/A |
| Aptamer Sequences, see Table S7 | This paper | N/A |
| DNA oligo: NH2-T24: /5AmMC6/TTTTTTTTTTTTTTTTTTTTTTTT | Chang et al.73 Synthesized by IDT | N/A |
| Recombinant DNA | ||
| pET24a-ncOGT-FL | This paper | RRID: Addgene_190821 |
| pET24a-ncOGT-TPR | This paper | RRID: Addgene_190822 |
| pET28a-β-catenin | Gift from R. Moon, unpublished | RRID: Addgene_17198 |
| pGEX-6P-1-CpOGA | Rao et al.35 | N/A |
| pEGFP-β-catenin_WT | Murase et al.76 | RRID: Addgene_16071 |
| pEGFP-β-cateninS23A, T40A, T41A, T112A | This paper | RRID: Addgene_190824 |
| pEGFP-C1-ERα | Stenoien et al.77 | RRID: Addgene_28230 |
| mEmerald c-SRC | Gift from M. Davidson, unpublished | RRID: Addgene_54118 |
| GFP-AMPKα2 | Hudson et al.78 | N/A |
| pSilencer2.1-U6-T1 | This paper | RRID: Addgene_190825 |
| pSilencer2.1-U6-AP3 | This paper | RRID: Addgene_190826 |
| pSilencer2.1-U6-17-6 (Non-aptamer RNA) | This paper | RRID: Addgene_190827 |
| pSilencer2.1-U6-T1-U6-AP3 (T1 ∙ AP3) | This paper | RRID: Addgene_190828 |
| pSilencer2.1-U6-NL1F30 | This paper | RRID: Addgene_190829 |
| pSilencer2.1-U6-NL1F35 | This paper | RRID: Addgene_190830 |
| pSilencer2.1-U6-NL1F50 | This paper | RRID: Addgene_190831 |
| pSilencer2.1-U6-3JB1F | This paper | RRID: Addgene_190832 |
| pSilencer2.1-U6-3JB1F+2 | This paper | RRID: Addgene_190833 |
| pSilencer2.1-U6-3JB1F+4 | This paper | RRID: Addgene_190834 |
| pSilencer2.1-U6-3JB1F+6 | This paper | RRID: Addgene_190835 |
| pSilencer2.1-U6-3JB1F+8 | This paper | RRID: Addgene_190836 |
| pSilencer2.1-U6-3JB1F+10 | This paper | RRID: Addgene_190837 |
| pSilencer2.1-U6-3JB1F+12 | This paper | RRID: Addgene_190838 |
| pSilencer2.1-U6-3JB1R | This paper | RRID: Addgene_190839 |
| pSilencer2.1-U6-3JB1R+2 | This paper | RRID: Addgene_190840 |
| pSilencer2.1-U6-3JB1R+4 | This paper | RRID: Addgene_190841 |
| pSilencer2.1-U6-3JB1R+6 | This paper | RRID: Addgene_190842 |
| pSilencer2.1-U6-3JB1R+8 | This paper | RRID: Addgene_190843 |
| pSilencer2.1-U6-3JB1R+10 | This paper | RRID: Addgene_190844 |
| pSilencer2.1-U6-3JB1R+12 | This paper | RRID: Addgene_190845 |
| pSilencer2.1-U6-4JC1FF | This paper | RRID: Addgene_190846 |
| pSilencer2.1-U6-4JC1RR | This paper | RRID: Addgene_190847 |
| pSilencer2.1-U6-bc339 | This paper | RRID: Addgene_190848 |
| pSilencer2.1-U6-T1-U6-bc339 (T1 ∙ bc339) | This paper | RRID: Addgene_190849 |
| pSilencer2.1-U6-NL8F50 | This paper | RRID: Addgene_190850 |
| pSilencer2.1-U6-NL8F70 | This paper | RRID: Addgene_190851 |
| pSilencer2.1-U6-NL8F100 | This paper | RRID: Addgene_190852 |
| pSilencer2.1-U6-3JB8F+4 | This paper | RRID: Addgene_190853 |
| pSilencer2.1-U6-3JB8F+12 | This paper | RRID: Addgene_190854 |
| pSilencer2.1-U6-3JB8R+12 | This paper | RRID: Addgene_190855 |
| pSilencer2.1-U6-LRS1F50C | This paper | RRID: Addgene_190856 |
| TOPFlash | Veeman et al.85 | RRID: Addgene_12456 |
| FOPFlash | Veeman et al.85 | RRID: Addgene_12457 |
| pNL1.1.TK[Nluc/TK] | Promega | Cat#: N1501 |
| TRC2-pLKO.5-scrambled | Sigma | Cat#: SHC216 |
| TRC2-pLKO.5-shOGT | Sigma | Cat#: TRCN0000286200 |
| TRC2-pLKO-shβ-catenin | Sigma | Cat#: TRCN0000314921 |
| pLKO.1-shEZH2 | Sigma | Cat#: TRCN0000040077 |
| pMD2.G | Gift from D. Trono, unpublished | RRID: Addgene_12259 |
| psPAX2 | Gift from D. Trono, unpublished | RRID: Addgene_12260 |
| pcDNA3.1-OGT_opt | This paper | RRID: Addgene_190858 |
| pcDNA3.1-empty | This paper | RRID: Addgene_190859 |
| Software and algorithms | ||
| cutadapt | Martin65 | https://cutadapt.readthedocs.io/en/stable/ |
| Trim Galore! | Krueger et al.88 | https://github.com/FelixKrueger/TrimGalore |
| FASTAptamer | Alam et al.66 | https://github.com/FASTAptamer/FASTAptamer |
| RNAfold webserver | Lorenz et al.67 | http://rna.tbi.univie.ac.at/cgi-bin/RNAWebSuite/RNAfold.cgi |
| RNAStructure, version 6.3 | Reuter and Mathews68 | https://rna.urmc.rochester.edu/RNAstructure.html |
| RNAComposer | Popenda et al.69 Antczak et al.70 | http://rnacomposer.cs.put.poznan.pl/ |
| QRNAS | Stasiewicz et al.71 | http://genesilico.pl/software/standalone/qrnas |
| UCSF ChimeraX | Pettersen et al.72 | https://www.cgl.ucsf.edu/chimerax/ |
| Biacore Evaluation Software | GE Healthcare/Cytiva | 29310602 |
| ggplot2 | Wickham74 | https://ggplot2.tidyverse.org |
| Fiji | Schindelin et al.75 | https://imagej.net/software/fiji/ |
| BioVoxxel Toolbox | Brocher86 | https://imagej.net/plugins/biovoxxel-toolbox |
| HISAT2 | Kim et al.89 | http://daehwankimlab.github.io/hisat2/ |
| featureCounts | Liao et al.90 | http://subread.sourceforge.net/ |
| annotateMyIDs | Dunning91 | https://github.com/markdunning/galaxy-annotateMyIDs |
| DESeq2 | Love et al.92 | https://bioconductor.org/packages/release/bioc/html/DESeq2.html |
| EnhancedVolcano | Blighe et al.93 | https://github.com/kevinblighe/EnhancedVolcano |
| Bowtie2 | Langmead and Salzberg96 | http://bowtie-bio.sourceforge.net/bowtie2/index.shtml |
| samtools | Li et al.97 | http://www.htslib.org/ |
| bedtools | Quinlan and Hall98 | https://bedtools.readthedocs.io/en/latest/ |
| SEACR | Meers et al.99 | https://github.com/FredHutch/SEACR |
| The Integrative Genomics Viewer (IGV) | Robinson et al.105 | http://software.broadinstitute.org/software/igv/home |
| Diffbind | Stark and Brown100 Ross-Innes et al.101 | https://bioconductor.org/packages/release/bioc/html/DiffBind.html |
| ChIPseeker | Yu et al.102 | https://bioconductor.org/packages/release/bioc/html/ChIPseeker.html |
| profileplry | Carroll and Barrows103 | https://www.bioconductor.org/packages/release/bioc/html/profileplyr.html |
| GraphPad Prism | GraphPad Software | https://www.graphpad.com/ |
| Other | ||
| Biacore T100 SPR system | GE Healthcare/Cytiva | |
| Sensor Chip PEG, Series S | GE Healthcare/Cytiva | Cat#: 29239810 |
| Slide-A-Lyzer G2 Dialysis Cassettes, 20K MWCO | Thermo Scientific | Cat#: 87735 |
| Vivaspin protein concentrator, 30K MWCO | GE Healthcare/Cytiva | Cat#: 28932235 |
| SpectraMax i3x | Molecular Devices | |
| iBright FL 1500 Imaging System | Invitrogen | Cat#: A44115 |
| 8-well Chamber Slide w/ removable wells | Thermo Scientific | Cat#: 154941 |
| HybEZ II Hybridization System | Advanced Cell Diagnostics | Cat#: 321710 |
| Amersham Imager 600 RGB | GE Healthcare/Cytiva | Cat#: 29-0834-67 |