

Abstract
Treating MS has been difficult. One successful drug is Ocrelizumab (anti-CD20), used for the chronic relapsing MS (RMS) and the progressive MS (PMS) forms. TH40 cells are pathogenic effector T cells that increase in percentage and numbers during chronic inflammation. Here we show that in the earliest MS course, clinically isolated syndrome (CIS), TH40 cells expand in number. In PMS TH40 cell numbers remain expanded demonstrating sustained chronic inflammation. In RMS TH40 cells were found in CSF and express CD20. Ocrelizumab reduced TH40 cells to healthy control levels in patients. During treatment inflammatory cytokine producing TH40 cells were decreased.
Keywords: Multiple Sclerosis, T cell subset, Regulation, Ocrelizumab, Autoimmunity, Neuroinflammation
Graphical Abstract
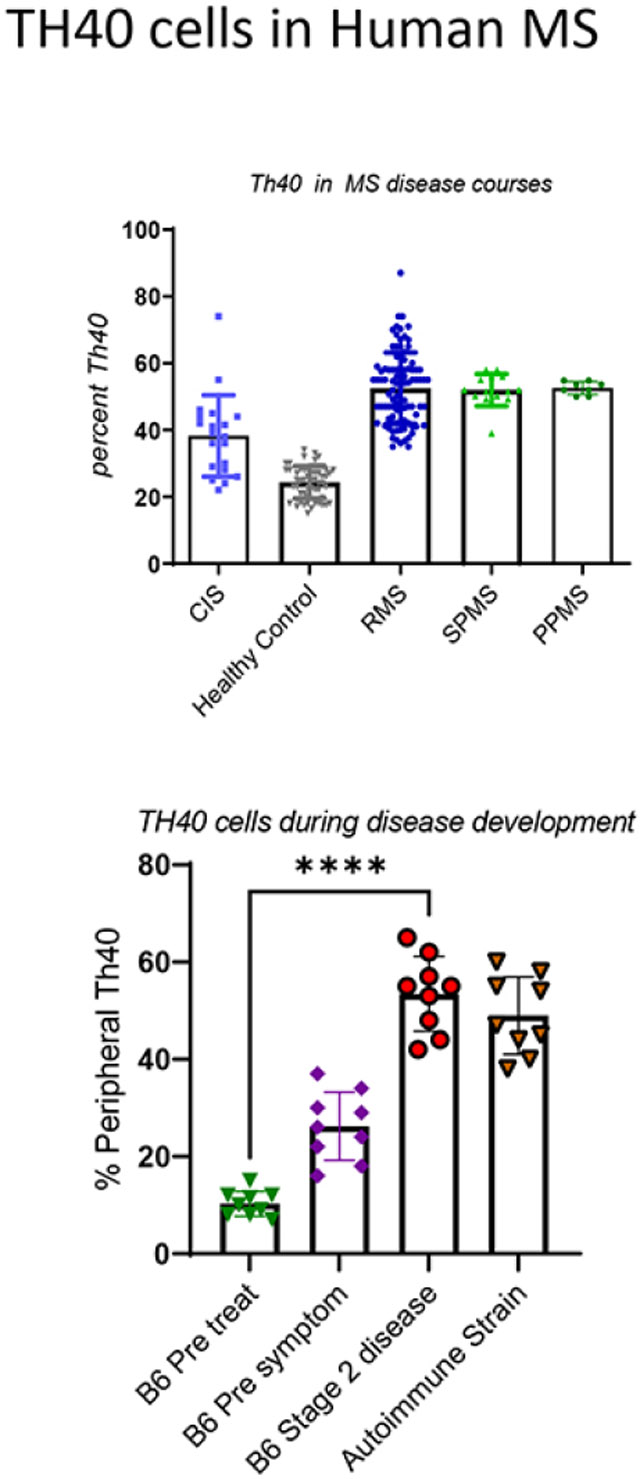
Attempts to find biomarkers for disease onset or progression in MS have been difficult. MS is a neurodegenerative disease, but the autoimmune component increases the options for an immune biomarker detectable in peripheral blood. TH40 cells are a subset of helper T cells that express the CD40 receptor that is a major player in driving inflammation. In human RMS patients TH40 cell numbers are significantly elevated above healthy controls (HC). In a subset of clinically isolated syndrome, the earliest form of MS where 50% progress to RMS after 10 years, TH40 cell numbers are equivalent to RMS; in the other cohort TH40 cells are equivalent to HC. This suggests chronic inflammation can be detected even at an early stage.
Secondary progressive (SP) MS has progressed from RMS, thus TH40 cell increases may be expected but were also observed in Primary Progressive MS, demonstrating that detectable chronic inflammation plays a role in that disease course. In longitudinal studies (up to 10 years post diagnosis) TH40 cell numbers did not decrease in SPMS or PPMS subjects.
Pathogenesis of TH40 cells in RMS was demonstrated by detection in CSF. In HC, no TH40 cells, or lymphocytes for that matter were detected.
The drug Ocrelizumab, an anti-CD20 monoclonal antibody that targets primarily B cells, also targeted TH40 cells. Some CD3+ T cells reportedly express CD20 that can now be ascribed to the TH40 cell popultion. Patients treated with a single infusion of Ocrelizumab saw a significant decline in TH40 cell numbers dropping to almost HC levels. After 12 months TH40 cell numbers returned to near pre-treatment levels. After treatment the remnant TH40 cells had lower intracellular levels of inflammatory cytokines but increased levels of IL-10 a regulatory cytokine.
1. Introduction:
Multiple sclerosis (MS) is classified both as a progressive neurodegenerative and an autoimmune disease. The primary pathology of MS is myelin loss within the central nervous system (CNS) resulting from immune cell invasion. Once the CNS is penetrated, pathogenic effector cells attack neural tissue causing neurodegeneration with subsequent multiple physical and cognitive failures. MS is progressive and while current treatments create a temporal state of immune tolerance that tolerance is not sustained. The etiology remains unknown although genetic pre-disposition, with environmental contributors and immune cell dysfunction clearly are involved [1]. During the disease process antigen-reactive T cells interact with B cells and CNS resident antigen presenting cells (microglia and resident macrophages and dendritic cells) to create a localized inflammatory cascade creating large demyelinating plaques. Scaring that involves a dense fibrous network of neuroglia (gliosis), and neuroaxonal degeneration results in impairment of neuronal signaling [2]. CNS resident cells and the infiltrating immune cells produce inflammatory cytokines that disrupt the delicate synaptic homeostasis by modulating glutamate receptor ion channels [2].
MS clinically is characterized by discrete episodes or attacks of neurologic dysfunction. The disease occurs in progressive courses. The earliest is clinically isolated syndrome (CIS) defined by limited occurrence of symptoms (usually one) and may include detection of one or more non-progressing lesions by MRI [3]. Approximately 50% of CIS will progress to relapsing MS (RMS) over a 10 year period [3]. RMS is defined by recurrent neurologic symptoms with full or partial recovery but lack of disease progression between relapses [3]. RMS accounts for approximately 80% of MS. Almost 50% of diagnosed RMS subjects will progress to secondary progressive MS (SPMS) in 15 years with approximately 90% converting after 25 years [3]. SPMS is defined by persistent neurodegeneration, continued progression i.e., lesion increases in time and space it may involve occasional remissions or plateaus but always relapses afterwards [4]. Primary progressive MS (PPMS) is rarer and more neurodegenerative at onset with occasional plateaus but no sustained remission [3]. PPMS accounts for less than 5% of MS cases.
Current treatment options include disease modulating therapies (DMT) that target specific immune pathways. Improvements including significant delay of progression and symptom relief have been reported [4-7], however no DMT has sustained remission or ultimately prevented progression. The most promising DMT at present is Ocrelizumab, a humanized monoclonal anti-CD20 antibody, resulting in depletion of mature B cells [8]. Generally, this treatment option reduces the number of gadolinium-enhancing lesions on brain MRI scans, improves expanded disability status score (EDSS), and delays progression when compared to other DMTs [9-12]. It also slows disease progression in SPMS and PPMS thus it is currently the only approved drug for those courses [13-15] [16]. Depletion of peripheral B cells was not accompanied by loss in CSF immunoglobulins, suggesting that the therapeutic impact was not related to antibody control [10]. There are reported reductions in T cells in anti-CD20 treated MS patients and an ill-defined subset of CD3+CD4+ cells in MS subjects are CD20+ [17, 18]. In mouse studies, anti-CD20 treatment rapidly reduced B cells and impacted IL-17 producing T cells [19].
We described a subset of T cells that are induced to express the CD40 receptor, referred to as TH40 [20-33]. On TH40 cells, CD40 acts as a co-stimulus driving inflammatory cytokine production among other mechanisms of action. TH40 cells proved necessary and sufficient for autoimmune disease transfer during experimental autoimmune encephalomyelitis (EAE) [20, 23], the mouse model for MS. We reported substantially increased TH40 cell numbers and percentages in peripheral blood of human RMS patients compared to non-autoimmune healthy controls (HC) [25]. The TH40 cell increase in RMS occurred regardless of age at disease onset, duration of disease (up to 25 years), or HLA haplotype [25]. Numbers of TH40 cells in HC, regardless of age (5 years to 79 years) remained under 30% but in RMS those numbers were expanded to > 55% [25]. TH40 cells from RMS subjects exhibited antigen-specific effector function by responding to CNS associated self-antigens including MBP, MOG and PLP peptides [25]. TH40 cells from RMS subjects produce pro-inflammatory cytokines including IFNγ, TNFα, IL-6, and IL-17, while reducing production of IL-10 and IL-4 when antigen challenged [25].
In the current study, we demonstrate that in peripheral blood of CIS (the earliest stage of MS) subjects a wide range of TH40 cell numbers including a subset with TH40 cell numbers equivalent to RMS were detected. We discovered that SPMS and PPMS cohorts have significantly elevated TH40 cell numbers at diagnosis and maintain those levels longitudinally, suggesting that SPMS and PPMS sustain chronic inflammatory conditions. TH40 cells are present in cerebral-spinal-fluid (CSF) of RMS patients demonstrating ability of this cell type to breach the CNS. We defined TH40 cells as the CD3+ T cell subset susceptible to Ocrelizumab treatment. Other DMT including dimethyl fumarate (DMF), glatiramer acetate and fingolimod, had varied effects on TH40 cell numbers. As a mechanism of action, we found that TH40 cells from Ocrelizumab treated patients produced significantly less inflammatory cytokines. At 12 months post treatment, TH40 cell numbers returned almost to pre-treatment levels. These data suggest that an important mechanism of action for Ocrelizumab clinical treatments is to reduce the number and function of pathogenic TH40 cells. Also, the data suggest that peripheral blood TH40 cell numbers correlate to chronic inflammation and that some DMTs, Ocrelizumab particularly, modulate chronic inflammation as represented by TH40 cell levels.
2. Materials and Methods:
2.1. Patient Data:
Patients for study were recruited from The University of Colorado Department of Neurology Multiple Sclerosis Clinic, The Department of Neurology Headache Clinic, The University of Colorado Anschutz Medical Campus, and The University of Colorado Hospital. Patients included those diagnosed with clinically isolated syndrome (CIS), relapsing/remitting multiple sclerosis (RMS), secondary progressive multiple sclerosis (SPMS), primary progressive multiple sclerosis (PPMS), and healthy controls (HC) that included no autoimmune disease, infectious disease, or chronic illness. Other controls included patients from the Department of Neurology/University of Colorado Hospital Headache Clinic; subjects included migraine and other neurological diseases that were not autoimmune. The average age in each cohort, number of subjects, age range and years differential are shown in Table 1. RMS analysis was separated into male and female, the other categories included both female and male subjects.
Table 1: Characteristics of Subjects enrolled in CD40 study.
The Average age is taking the average of participants within a defined group. Age of onset was considered only for new onset subjects. Subjects in the other categories had been diagnosed between 1 and 43 years. Ocrelizumab includes age of all participants whether just began or up to 24 months. At the time of the study, no subjects had been on Ocrelizumab longer than 24 months.
| Disease Status | Average Age | Age Range |
Years Differential | Number of Female |
Number of Male |
|---|---|---|---|---|---|
| Control | 38.7 | 22.8 – 74.4 | 51.6 | 46 | 40 |
| CIS | 32.3 | 20.1 – 39.9 | 19.9 | 4 | 3 |
| New Onset | 29.8 | 23.3 – 34.2 | 10.7 | 5 | 7 |
| RMS - Female | 47.1 | 30.4 – 70.6 | 40.6 | 84 | N/A |
| RMS - Male | 44.6 | 23.3 – 70.2 | 46.9 | N/A | 33 |
| SPMS | 50.6 | 44.7 – 61.8 | 17.8 | 4 | 1 |
| PPMS | 58.4 | 49.1 – 64.7 | 14.9 | 3 | 2 |
| Ocrelizumab | 41.67 | 23.3 – 61.7 | 38.4 | 28 | 11 |
2.2. Treatments:
As per standard of care for each MS cohort, treatments are described. Some CIS patients had been prescribed tier one disease modulating treatments (DMTs). In this analysis, RMS patients had been prescribed Gilenya (fingolimod), Copaxone (glatiramer acetate), Tecfidera (dimethyl fumarate) or Ocrelizumab (the principal concern of this study). Blood samples were collected prior to commencing treatment and then again at 3, and 12 months after treatment. Ocrelizumab treatment, relative to this study, was a single infusion; subjects receiving additional treatment were not considered. Some subjects were transitioned from a first tier DMT to Ocrelizumab. When that occurred, the patient was taken off the original DMT and no less than 2 weeks passed prior to receiving Ocrelizumab.
2.3. Lymphocyte Isolation:
Blood samples were collected in heparinized tubes. Blood was diluted 1:1 with PBS, then layered over Ficol-Hypaque that was centrifuged as per manufacturer’s instructions. The buffy coat was collected, washed in PBS then cell counts were done. Cell freezing was done in fetal calf serum made 10% DMSO then stored at −80°C.
2.4. Cerebrospinal-Fluid (CSF) cells:
The Department of Neurology at the University of Colorado Anschutz Medical Campus maintains a Biorepository. Cerebrospinal Fluid is obtained in clinic, processed, and frozen by the Neurology Biorepository. We obtained frozen CSF samples for analysis. Samples were rapidly thawed in a 37°C water bath. Cells were transferred to 15 ml of AIMS IV culture media with 10% fetal calf serum (FCS) and centrifuged. Cells were then stained for flow cytometry.
2.5. Cell Staining and Flow cytometry:
Either fresh blood samples or properly thawed frozen samples were stained and analyzed by flow cytometry. Equal numbers of cells, 1 x 10⁵, from all test cohorts were stained directly for flow cytometry analysis. Frozen samples were thawed in 37°C water bath then transferred immediately to 10 ml AIMS IV media, 5% FBS at 37°C, centrifuged and suspended in staining buffer (PBS, 5% BSA, 0.1% EDTA). Fresh samples were suspended in staining buffer after isolation. T cell antibodies: anti-CD4 (APC-Cy7, eBioscience); anti-CD8 (APC, eBioscience); anti-CD40 [G28.5 produced in house] (ViolBlue); anti-CD3 (ViolGreen, eBioscience), anti-TCRαβ (FITC, eBioscience). B cell antibodies: anti-HLA-DR (PE, eBioscience); anti-CD19 (PE-Cy5, eBioscience); anti-CD20 (PerCP, eBioscience); CD40 (ViolBlue, G28-5, produced in house). Cytokine antibodies: anti-IL-6 (PE, eBioscience); anti-17a (PE-Cy7, eBioscience); IFNγ (PE-Cy7, eBioscience); IL-2 (PE, eBioscience); and IL-10 (PE, eBioscience). Staining strategies were set up appropriately when overlapping fluors were involved. Antibodies were added at 10 μg/ml concentration. Fluorescence minus one (FMO) was performed to establish staining compensation parameters and minimal stain sets, 2 fluor, versus 3 and 4 fluor were done. No stain set involved more than 4 stains. For gating analysis, isotype controls correlating to each fluor were used as controls for appropriate staining sets. Data analysis was done using FlowJo analysis software. Stains for each patient sample were done in triplicate.
2.6. Statistics:
All statistics were performed using Graph Pad Prism programs. Appropriate comparisons including t-test and ANOVA analysis was done. Every sample included a minimum or 4 points.
3.0: Results:
In previous work, we established TH40 cell pathogenicity using the experimental autoimmune encephalomyelitis (EAE) model for chronic MS [20, 23]. TH40 cells expansion in the periphery occurred prior to symptoms, migrated to the CNS, created myelin loss, and symptoms that rapidly became severe. Modulation of TH40 cells using a peptide that targets CD40, resulted in disease delay and drastic symptom improvements [20]. In MS patients we reported that TH40 cells in peripheral blood are significantly increased in number compared to healthy controls (HC), predominantly carry a memory phenotype, and are highly reactive to CNS derived autoantigens [25]. The elevation in patient peripheral blood TH40 cells occurred regardless of HLA haplotype, including in HLA-DR15 strongly associated with MS [34]. Of interest, MS subjects who did not carry the DR15 haplotype still demonstrated elevated peripheral blood TH40 cell numbers [25]. Building on these observations, we queried whether CIS would exhibit peripheral blood TH40 cell expansions indicating autoimmune inflammation in the earliest form of the disease. T cells were differentiated within the PBMC by gating on CD3 expression (Fig. 1A). Within the CD3 T cell compartment CD4+CD40+ cells were defined (Fig. 1B) consistent with our previous report [25]. The percentage of TH40 cells is determined as CD4+CD40+ divided by total CD4+ cells [25]. In CIS, TH40 cell numbers were diverse (Fig. 1C). The TH40 cell mean in CIS was statistically elevated compared to HC, including headache clinic (OND) controls, but were statistically reduced in number compared to the RMS mean (Fig. 1C). Some CIS subjects demonstrated peripheral blood TH40 cells equivalent to percentages found in RMS (Fig. 1D), which is consistent with systemic autoimmune inflammatory conditions. Other CIS subjects demonstrated TH40 cell numbers equivalent to HC (Fig. 1D). If the CIS TH40 values below the mean (39.64) were compared to HC, there was no significant difference (Fig. 1D). If the CIS TH40 values above its mean were compared to the RMS mean, there was no significant difference (Fig. 1D).
Figure 1: TH40 cell percentages in peripheral blood of CIS, PPMS and SPMS patients relative to RMS.

PBMC were collected from CIS (n = 18), RMS (n = 88), healthy control [HC] (n = 46), other neurological disease [OND] (n = 24). CIS, RMS, HC, and OND were randomly selected; SPMS and PPMS were those enrolled in the study at the time of analysis. PBMC were isolated and stained with fluorescent antibodies and analyzed by flow cytometer. A) Representative histogram showing CD3+ cells gated in each population. Grey histogram is background (isotype) control. B) CD4 versus CD40 within the CD3+ gate is shown. TH40 percentage was determined by dividing upper right quadrant by lower right + upper right quadrants. C) PBMC TH40 percentages from CIS, RMS, HC and OND were compared. CIS was significantly p < 0.001 different from RMS and from OND. D) TH40 cell percentages from CIS were separated into those that were above the mean and TH40 cell percentages from CIS that were below the mean and statistically compared to RMS and HC respectively, and to each other. Statistics were ANOVA to address differences between and within study groups. Comparisons between individual groups were done by two-tailed, unpaired t-test.
3.1: Progressive MS courses were thought to occur independently of inflammation, however reports show that an ubiquitous secondary autoimmune response underpins progression [35]. We considered that chronic inflammation during progressive MS would be reflected by peripheral blood TH40 cell percentages. TH40 cell numbers in SPMS and PPMS were compared to RMS and HC (Fig. 2). In SPMS and PPMS, peripheral blood TH40 cell percentages were significantly elevated compared to controls including headache clinic (OND) controls (Fig. 2). There was no statistical difference in the means between SPMS, PPMS and RMS TH40 cell percentages as determined by an ANOVA summary. However, unlike in RMS, in both progressive disease courses, as demonstrated by both Bartlett’s test and Brown-Forsythe test, there was no significant difference in column variable TH40 cell numbers. The range of peripheral blood TH40 cell percentage in SPMS was 49 – 65%, in PPMS it was 50 – 66.2% compared to RRMS that was 36.0 – 87%. The CIS mean TH40 level was significantly (p = 0.0025) less than SPMS. There were two CIS samples higher than the SPMS mean (dashed line). The range in CIS was 26 - 74%.
Figure 2: TH40 cell percentages in PBMC of progressive MS.

TH40 percentages from SPMS (n = 9), and PPMS (n = 5) were compared to RMS (n = 88), CIS (n = 18), OND (n = 24) and healthy controls (n = 46). SPMS and PPMS are significantly (p < 0.0001) greater than controls, but not significantly different from each other or RMS TH40 percentage means. Statistics were ANOVA to address differences between and within study groups. Comparisons between individual groups were done by two-tailed, unpaired t-test. The demarcation line is set to the mean of RMS.
3.2: To address pathogenicity of TH40 cells in human MS demonstrated by ability to cross the CNS barriers, we examined cerebrospinal fluid (CSF) for the presence of TH40 cells. One diagnostic feature of MS is the presence of a distinct class of antibodies that contain a unique pattern of mutations in six codons along VH4 genes [36]. Another feature is the presence of immune cells within the CSF, which under normal conditions do not contain cells [37]. During EAE induction, we demonstrated that TH40 cells accumulate in the CNS prior to symptoms [20, 23]. In CSF from HC subjects, very few (less than 1000) or no cells were detected (observations). In RMS subjects a typical CSF sample would contain up to 150,000 cells (laboratory observations). We examined CSF from 6 randomly selected RMS subjects for the presence of TH40 cells. The mean CD3+ T cell population was 70.05 ± 2.38% and the mean B cell percentage determined as CD19+CD40+ was 3.95 ± 0.998% (Fig. 3A). These values are consistent with reports that CD3 cells constitute from 86% to 91% and B cells constitute from 1.7% to 5.5% in CSF [38]. The CD4:CD8 ratio average was 2.58 to 1. These numbers compare to previous reports; when the CSF from 46 RRMS subjects was examined the CD4:CD8 ratio was 2.4 – 3.5 [39]. We further examined CD40 expression within the CD3+ subsets considering CD4+CD40+ and CD8+CD40+ (Fig. 3B) cells. We discovered that in CSF of RMS subjects the majority of CD3+CD4+ cells were TH40 (Fig. 3B). The mean TH40 percentage was 60.6% and the mean CD8+CD40+ percentage was 39.4%. CD19+ B cells were uniformly CD40+ as expected.
Figure 3: TH40 cells were discovered in CSF.

Cerebral-spinal-fluid (CSF) was collected from diagnosed RMS (n = 6) and from HC (n = 12) by the Department of Neurology Clinic at the University of Colorado Anschutz Medical Center. Samples were analyzed by flow cytometry. Cell percentages from each patient are shown, the histogram represents the mean. A) Comparison of total B cells: CD19+CD40+ from CD3− HLA-DR+ gated cells; conventional T cells: CD3+CD4+; and CD3+CD8+ cells. B) Within the CD3+ population, CD4+CD40+ (definitional TH40 cells) and CD8+CD40+ subpopulations were determined. Statistics were ANOVA to address differences between and within study groups. Comparisons between individual groups were done by two-tailed, unpaired t-test.
3.3: Attempts to control MS disease development and progression involve the use of disease modulating therapies (DMT) that are immune modulatory. Anti-CD20 therapy including Rituximab a mouse/human chimeric monoclonal antibody (mAb) that later evolved to a human only mAb, Ocrelizumab, has become one of the more successful treatments. Currently Ocrelizumab is the only DMT approved for the progressive disease courses [40, 41]. Ocrelizumab is given as a single infusion, usually on a 12 to 18-month schedule. We examined peripheral blood percentages of TH40 cells prior to, during, and post Ocrelizumab treatment. We compared newly diagnosed MS subjects who had no treatment to subjects that were commencing Ocrelizumab (Fig. 4). Pre-Ocrelizumab subjects had been on a DMT but had undergone a minimal 2 week, no treatment, washout phase. Blood samples were taken on the day of infusion, there was no significant difference in mean percentages of peripheral blood TH40 cells between no DMT and pre-Ocrelizumab treatment (Fig. 4 A and B). At 3 - 6 months post treatment, peripheral blood TH40 cell percentages dropped (Fig. 4 A and B) reaching levels that were not significantly different compared to HC, (Fig. 4B). At 12-months post treatment, peripheral blood TH40 cell percentages returned to near pre-treatment levels (Fig. 4A). Mean pre-treatment was 66.04% and post treatment was 54.3%. Post treatment TH40 cell percentages in peripheral blood were still significantly reduced compared to pre-treatment percentages (Fig. 4B). We examined memory phenotype in TH40 cells from RMS patients during and post Ocrelizumab treatment. At 3 - 6 months post infusion the mean CD45RO+ number was 36.5 ± 9.9% (Fig 4 C and E). In post-Ocrelizumab treated patients the mean CD45RO% was 68 ± 9.6% (Fig. 4 D and E), thus TH40 memory cells increased significantly post Ocrelizumab treatment (Fig. 4E). We determined the impact of Ocrelizumab on B cells and CD8 cells (Supplementary Figure 1). As expected, peripheral blood B cells dropped to almost 0% between 3 and 6 months and recovered post 12 months. CD8 cells did not fluctuate comparing 3 – 6 months and post 12 months to no DMT treated subjects’ levels (Supplementary Figure 1).
Figure 4: Effect of Ocrelizumab on TH40 cells in RMS patients.

PBMC were isolated from each RMS patient prior to Ocrelizumab treatment, at 3 months post treatment and again at 12 – 18 months post treatment. The number of subjects (n) in each cohort is indicated in the graph. Each patient received a single Ocrelizumab infusion. No DMT were randomly selected new onset RMS subjects who were analyzed prior to any treatment. OND were non-autoimmune control samples. Each dot represents an individual patient sample, the mean and standard error are shown for each treatment cohort. A) Direct comparison between each time past treatment cohort. B) Statistics for each group comparison including number of subjects in each group. C) Memory TH40 cells, determined by expression of CD45ROhi, from RMS subjects at 3 – 6 months post Ocrelizumab treatment. Each TH40 percent is correlated to its corresponding CD45RO percentage. D) Memory TH40 cells determined at 12 months post treatment. Each TH40 percent is correlated to its corresponding CD45RO percentage E) Direct comparison between 3 – 6 months and post 12 -months treatment of memory TH40 cells. Each cohort was compared to another by unpaired, two-tailed t-test. P value is reported. F tests were done to compare variances, with no identifiable variances between the cohorts. ANOVA revealed variance within the Ocrelizumab group and post-Ocrelizumab groups.
3.4: We compared the effect of Ocrelizumab on TH40 peripheral blood cell percentages to that of other DMTs, including dimethyl fumarate (DMF, Tecfidera™), fingolimod (Gilenya™), and glatiramer acetate (Copaxone™) in RMS patients. Of the alternate DMTs, DMF had the more pronounced effect, reducing TH40 cell numbers significantly when compared to no DMT controls (Fig. 5A and B). DMF was still significantly higher than OND control however (Fig. 5A and B). Fingolimod treated subjects TH40 cells were not significantly different from no DMT and were significantly greater than OND (Fig. 5A and B). Reference demarcation lines set at the mean for no DMT (red) and at the mean for OND (green) are shown. A point about fingolimod is that the mechanism of action is to isolate peripheral T cells in lymph nodes, removing them from effective circulation. Fingolimod patients demonstrated a significant (p < 0.001, determined by laboratory observations) drop in PBMC, described as clinical lymphopenia. The TH40 cell numbers shown in Figure 4 demonstrate that even in lymphopenia conditions, the lower number of PBMC contain the relative same percentage of TH40 cells; fingolimod is not therefore TH40 cell specific. Glatiramer acetate subjects TH40 cell percentages were not significantly different from no DMT (Fig. 5).
Figure 5: Effect of other DMTs on TH40 cell percentages compared to Ocrelizumab:

PBMC were collected from randomly selected RMS patients who were currently taking either Ocrelizumab, dimethyl fumarate (DMF), glatiramer acetate, or fingolimod. Ocrelizumab subjects were treated for 3 – 6 months and all other subjects had been treated for at least 1 year. A) Comparison of TH40 cell percentages in No DMT, DMT, Ocrelizumab, DMF, Fingolimod, glatiramer acetate, and OND controls. Individual values are represented; The red line indicates the mean for No DMT, and the green line indicates the mean for OND B) Statistics for each group comparison and number of subjects in each treatment group is indicated in the graph. Each cohort was compared to another by unpaired, two-tailed t-test. P value is reported. F tests were done to compare variances, with no identifiable variances between the cohorts. ANOVA revealed variance within the DMT group.
3.5: Ocrelizumab is the only DMT approved for use in progressive MS, therefore we examined the effect of Ocrelizumab treatment on the percentages of TH40 cells in the progressive MS forms comparing before and after treatment (Fig. 6). In SPMS Ocrelizumab reduced TH40 cell numbers from a mean of 60.7% to 28.25% (Fig. 6A). In PPMS, Ocrelizumab reduced the mean TH40 cell percentage from 62.2% to 35% (Fig. 6A). Comparing the TH40 mean value in SPMS to PPMS, Ocrelizumab had significantly greater impact on TH40 cells from SPMS (Fig. 6B). It is of interest that Ocrelizumab impacted what are described as pathogenic effector T cells that arise due to chronic inflammation.
Figure 6: Ocrelizumab impacts TH40 cell percentages in SPMS and PPMS patients.

A) PBMC from SPMS (n = 4) and PPMS (n =4) patients were collected prior to Ocrelizumab treatment and again at 3 months post infusions. TH40 cell percentages were compared. B) Statistics for each group comparison. Each cohort was compared to another by unpaired, two-tailed t-test. P value is reported. F tests were done to compare variances, with no identifiable variances between the cohorts; ANOVA revealed variance within the PPMS and SPMS pre-treatment groups.
3.6: The Ocrelizumab mediated reduction in TH40 cells combined with reports of CD20 expression on CD3+ T cells [18, 42, 43], suggest CD20 expression occurs on TH40 cells. We compared the percentage of CD20 expressing B cells (defined as CD19+CD40+), conventional CD3+CD4+ T cells, and TH40 (defined as CD3+CD4+CD40+) cells. The mean percentage of CD20 expressing B cells in peripheral blood of randomly selected RMS subjects was 80% (Fig. 7A). For conventional T cells the mean was 29% (Fig. 7A) but for TH40 cells the mean was 49.2% (Fig. 7A). We confirmed that CD20 expressing TH40 cells align in the T cell compartment. From peripheral blood mononuclear cells, CD3+ cells were gated (Fig. 7B), and CD4+CD40+ (TH40) cells were determined (Fig. 7C). Within TH40 cells a TCRαβ+ CD20+ subset was demonstrated (Fig. 7D). Figure shows 44.2% of TCRαβ+ CD3+CD4+CD40+ cells express CD20 and is representative for all samples. For comparison, 81% of the CD3-negative subset, that are CD19+ CD40+ and HLA-DR+ cells, (B cells), were CD20+ (Fig. 7E). We determined the representative number of molecules per cell type on B cells versus TH40 cells (Fig. 7F) using mean-fluorescent-intensity measures. On a cell-by-cell basis, TH40 cells from RMS subjects had significantly higher CD20 MFI than B cells from the same individual patient (Fig. 7F).
Figure 7: CD20 expression on TH40 cells compared to B cells and overall T cells.

PBMC from randomly selected RMS subjects (n = 16) were examined for B cells (CD19+, HLA-DR+, CD3−, CD40+); overall T cells (CD3+, TCRαβ+, CD4+) and TH40 cells (CD3+, CD4+, TCRαβ+, CD40+). CD20 expression within each staining group was determined. All stains were above isotype controls and fluorescence minus one (FMO) was done for each stain set. A) Comparisons of B cell (CD19+CD40+), helper T cell (CD3+CD4+) and TH40 CD20 expression percent; individual values are shown. B) The gating strategy for TH40 CD20 expression is shown. CD3 stain is green histogram; grey histogram is isotype control. C) CD4 versus CD40 stains and gates to establish TH40; D) CD20 versus TCRαβ within gated TH40 cells; E) CD20 versus HLA-DR in CD3−CD19+ population. F) Mean fluorescent intensity was done as a statistical determination of the geometric mean for CD20 stains. MFI was determined in gated CD3+CD4+CD40+ (TH40 cells) or in CD3−CD19+HLA-DR+CD40+ (B cells). Statistics were determined by two-tailed t-test using Graph Pad Prism statistical program.
3.7: To address mechanism of action, we examined the ability of TH40 cells to synthesize the inflammatory cytokines IL-6, IL-17a, IFNγ, and IL-2 versus the regulatory cytokine IL-10 after Ocrelizumab treatment. PBMCs were examined from RMS subjects 3 months after infusion. Controls were randomly selected RMS subjects not treated with Ocrelizumab. TH40 cells, like many other immune cells store cytokines in granules prior to secretion [21, 25, 44]. Intracellular cytokines in immediately ex vivo isolated TH40 cells were measured. This analysis, as opposed to isolation, activation, and analysis by cytokine array on secreted cytokines, focuses on the inflammatory potential of the cell in question. Levels of intracellular cytokines within TH40 cells were relatively high (Fig. 8). In untreated RMS subjects TH40 cell intracellular IFNγ was highest (mean 41.62%), with IL-6 (mean 27.76%) and IL-17 (mean 20.6%) following (Fig. 8). Isolated TH40 cells from Ocrelizumab treated subjects demonstrated reduced levels of intracellular inflammatory cytokines (Fig, 8). The greatest percentage reduction was for IL-17a (69.9% reduced) followed by IL-6 (62.8% reduction) and IFNγ (56% reduction). IL-2+ TH40 cells were not altered by treatment (10.8% of TH40 cells from untreated RMS were IL-2+ compared to 11% in Ocrelizumab treated subjects). IL-10+ TH40 cells in Ocrelizumab treated subjects were higher compared to untreated subjects (Fig. 8). The increase in IL-10+ TH40 cells suggests that fewer IL-10 containing TH40 cells were depleted during Ocrelizumab treatment.
Figure 8: TH40 cell intracellular cytokine levels in Ocrelizumab treated versus non-treated subjects.

PBMC from non-Ocrelizumab (n = 18) and Ocrelizumab (n = 9) treated subjects were examined; subjects were age and sex matched. Ocrelizumab samples were collected at 3 months post initial infusion. T cells were selected by gating on CD3 and further gated for CD4 and CD40 as described in Figure 1. Samples were analyzed by intracellular staining for cytokines to show intracellular cytokine granules. Cytokines including IL-6, IL-17a, IFNγ, IL-2 and IL-10, in CD4+ cells are reported. Statistics were obtained for each group comparison. Each cohort was compared to another by unpaired, two-tailed t-test. P value is reported. F tests were done to compare variances, with no identifiable variances between the cohorts. ANOVA showed in group variance in the IL-17 and IFNγ groups.
4. Discussion:
Mice injected with anti-CD20 once weekly for 3 weeks experienced complete depletion of B cells in blood, spleen, and lymph node (LN) and 75% reduction in bone marrow [45]. After 9 weeks, B cells in spleen and bone marrow were completely restored, and at 14 weeks LN and blood were 75% restored [45]. After treatment, a subset of CD20+ cells persisted in secondary lymphoid organs, with a large percentage being CD27+, a marker associated with antigen exposure/memory. Treatment during EAE disease induction caused a statistically relevant improvement although the mean clinical scores still indicated disease, demonstrating that further control such as a combinational therapy approach is warranted [45]. Histology revealed that treatment slowed demyelination but did not improve overall myelin levels [45]. When anti-CD20 was withdrawn B cell repopulation occurred, and returning cells had a restricted BCR sequence that suggested pathogenicity [45]. In human subjects after anti-CD20, initially Rituximab (Rituxan) then Ocrelizumab (Ocrevus) treatment, peripheral B cells are dramatically reduced but over time repopulation occurs [17, 46]. Temporary cell depletion by Ocrelizumab improves clinical scores but the improvement, while statistically significant, has not yet been sustained. Thus, as in the murine model the human data demonstrate that a combinational therapy to anti-CD20 could prove highly impactful.
The CD40/CD154 dyad has been identified as important in autoimmune disease development and thus became an important therapeutic target [47-53]. The dyad has been linked to human MS [54-61], and in mouse models disrupting CD40/CD154 interaction prophylactically prevents EAE while in RR-EAE it significantly (p < 0.01) improves disease scores [51, 62, 63]. We described CD40 on a subset of CD4+ cells that concomitantly produce IFNγ and IL-17 that were defined as T Helper – 40 (TH40) [32, 33, 64-70]. We reported that peripheral blood TH40 cell percentages in RMS patients longitudinally remain significantly elevated [25]. This finding suggests that TH40 cells represent a marker of chronic autoimmune inflammation, not the presence of the cells because TH40 cells are detected in non-autoimmune healthy controls [21, 25], but the induced expansion of CD40 bearing CD3+CD4+ T cells such as is seen in MS. The finding here that TH40 cell percentages become expanded in some CIS subjects suggests that the autoimmune inflammatory process is underway early during disease development and can be measured. The discovery that expanded percentages of TH40 cells occur in SPMS and remain elevated longitudinally, suggests that the autoimmune inflammatory pathway does not diminish post progression. Another conclusion is that systemic autoimmune inflammation plays an integral part in secondary progressive MS. The discovery of elevated TH40 cells in PPMS also suggests that systemic autoimmune inflammatory pathways are present even in primary progressive disease. This observation is novel.
Analyzing CSF is a McDonald Criteria recommendation for MS diagnosis [71]. The focus of analysis has been on the B cells, immunoglobulins predominantly IgG, and kappa chain analysis [72, 73]. In the EAE model of MS, we determined that TH40 cells localize to the CNS and cause myelin loss [74]. Adoptive transfer of TH40 cells from EAE induced mice causes myelin loss in naïve recipients [74]. Here we report TH40 cells in CSF of RMS subjects. The CSF is typically cell-free but during MS, immunocytes including T cells and B cells breach the CNS [75-77]. T cell receptor (TCR) restriction of CSF resident T cells has been reported [77], suggesting focused pathogenicity. In this study, the majority of CD3+CD4+ in the RMS patients examined were TH40. As in other reports, we saw low level B cells in CSF. An interesting report found that B cells isolated from RMS patients were able to coordinate Th17 responses towards neuro antigens [78]. As we showed here, TH40 cells in MS are prominent IL-17 producers and perhaps more revealing was that the percentage of TH40 cells in CSF closely matched percentages in PBMC.
CD20 is a Ca+2 ion-channel originally described on B cells [79, 80]. Anti-CD20 antibody treatment has been done in lupus erythematosus [80], and B cell non-Hodgkin’s lymphoma [81]. Treatment resulted in depletion of mature B cells systemically. Eventually the original mouse/human chimeric monoclonal antibody (Rituximab) was expanded for treatment of MS [82]. The chimeric antibody was further developed to a humanized form (Ocrelizumab) that overlapped the same epitope that Rituximab recognizes. The primary mechanism of action is to initiate activation induced cell death (AICD) and to a lesser extent, complement mediated cytotoxicity [83, 84]. Interestingly, CD20 also was identified on a subset of CD3+ T cells [18, 19, 43, 85]. Studies showed that treatment reduced T cells [19, 43]. The current study demonstrates that pathogenic TH40 cells are the primary CD3+ population expressing CD20. While an overall greater number of B cells express CD20 compared to TH40 cells, the CD20 MFI, a flow cytometric measure to determine the relative number of molecules on a given cell, on TH40 cells was significantly greater than on B cells at every time point examined. This suggests that TH40 cell numbers would reduce quickly during Ocrelizumab treatment. At 3 months post infusion TH40 cell numbers were reduced to near HC levels and B cells were reduced to near zero percent. Not all TH40 cells were CD20+ accounting for the incomplete depletion of TH40 with Ocrelizumab. CD8 cell levels did not significantly change at any time point, showing that Ocrelizumab does not target CD8+ cells. A relatively large number of TH40 cells had a memory phenotype, and those cells were reduced at 3 months post infusion. At 12 months post infusion B cell and TH40 cell recovery had occurred and TH40 memory cells were predominant demonstrating that memory phenotype TH40 cells recover preferentailly. The data suggest that using peripheral blood TH40 cell numbers can predict when treatment re-administration should be done.
When compared to other DMTs, Ocrelizumab was preferential at regulating TH40 cell numbers. Dimethyl fumarate (DMF) reduced TH40 cells significantly compared to no DMT treatment, but significantly less than Ocrelizumab. Glatiramer acetate also had a lower trending effect, but not significant. Fingolimod did not reduce TH40 cell numbers, although it did induce lymphopenia, a known feature of this DMT. Fingolimod is a shingosine-1-phosphate receptor agonist that binds to T cells and causes retention in lymph nodes [86, 87]. While fingolimod subjects demonstrated peripheral blood lymphopenia, the percentage of TH40 cells within the remnant population was not reduced. The lymphopenia conditions mean that overall numbers of pathogenic effector TH40 cells are fewer in circulation, but post-treatment recovery suggests that TH40 total cell numbers will rebound and that rebound will correlate with further pathogenesis.
A newly discovered mechanism of action for Ocrelizumab in addition to reducing pathogenic effector TH40 cells, is to alter the overall cytokine profile of TH40 cells. TH40 cells, like other immune cells, store cytokines in intracellular granules that can be detected by intracellular staining and flow cytometry [25]. We showed previously that TH40 cells from RMS produce high levels of IFNγ, TNFα, IL-6 and IL-17 [25]. Here we show that at 3 months post treatment, the point when TH40 cell numbers are reduced, the remnant TH40 cells that express intracellular IL-6, IL-17 and IFNγ were fewer in number compared to before treatment. The percentage of IL-2+ cells was unchanged and IL-10+ cells had increased. IL-2 has been accepted as a general T cell growth cytokine but its impact as a Treg development cytokine is becoming better understood [88, 89]. The increase in IL-10+ cells suggests that while Ocrelizumab treatment reduces the pro-inflammatory, IL-17, IFNγ, IL-6 containing cells the remaining cells are more likely to be IL-10+. This data has important implications. A DMT that targets TH40 cells will reduce inflammatory contributors. Because some TH40 cells harbor IL-10, a regulatory cytokine, allowing IL-10+ cells to persist would increase regulatory conditions and reduce pathogenicity.
The data suggest a method for monitoring therapeutic efficacy of some DMTs. In new onset RMS and some CIS, TH40 cell numbers are substantially increased. TH40 cells are pathogenic in the EAE model [20, 23], and as shown here constitute a significant proportion of CSF. Ocrelizumab, and to a lesser extent DMF and glatiramer acetate reduce peripheral blood TH40 cell numbers. Fingolimod reduces numbers of total lymphocytes including TH40 cells, but fingolimod treatment clearly does not target TH40 cells specifically. By following TH40 cell numbers in PBMC over time post DMT treatment when TH40 cell levels return to higher percentages, a new course of drug should be administered. Alternatively, a new DMT could be employed. The data further suggest that mechanisms to control CD40 overall will prove highly advantageous at regulating MS pathogenesis.
Supplementary Material
Supplemental Figure 1: B cells and CD8 cell levels before, during and after Ocrelizumab treatment. PBMC from no DMT (n = 9), 3 – 9 months post Ocrelizumab infusion (n = 9), and greater than 12 months post infusion (n = 9) were examined for HLA-DR+CD19+ B cells and no DMT (n = 18), 3 – 9 months post Ocrelizumab infusion (n = 9), and greater than 12 months post infusion (n = 9) were examined for CD8+CD3+ cells. A single observation at 1 month was available for B cell versus TH40 cell; both had reduced substantially when compared to No DMT treated subjects. Statistics were one-way ANOVA, Brown-Forsythe and Welch’s, comparing B cell cohorts and comparing CD8 cohorts. There were no significant differences in mean values between any of the groups.
Funding:
NIH R41AI129571; NIH R41113977
Abbreviations:
- DMT
Disease Modulating Therapy
- RMS
Relapsing Multiple Sclerosis
- SPMS
Secondary Progressive Multiple Sclerosis
- PPMS
Primary Progressive Multiple Sclerosis
- HC
Healthy Control
- CIS
Clinically Isolated Syndrome
- CNS
Central Nervous System
- EDSS
Expanded Disability Status Score
- CSF
Cerebrospinal Fluid
- HLA
Human Leukocyte Antigen
- EAE
Experimental Autoimmune Encephalomyelitis
- OND
Other Neurological Diseases
- mAb
Monoclonal Antibody
- IFN
Interferon
- LN
Lymph Node
Footnotes
Publisher's Disclaimer: This is a PDF file of an unedited manuscript that has been accepted for publication. As a service to our customers we are providing this early version of the manuscript. The manuscript will undergo copyediting, typesetting, and review of the resulting proof before it is published in its final form. Please note that during the production process errors may be discovered which could affect the content, and all legal disclaimers that apply to the journal pertain.
Declaration of Interests: D. Wagner is Chief Scientific Officer and Co-Founder of Op-T, LLC. No funding from Op-T, LLC was used for this manuscript. All other authors have no declarations of interest to declare.
References:
- 1.Little J, Barakat-Haddad C, Martino R, Pringsheim T, Tremlett H, McKay KA, van Lieshout P, Walsh SJ, Gomes J, Krewski D: Genetic variation associated with the occurrence and progression of neurological disorders. Neurotoxicology 2017, 61:243–264. [DOI] [PubMed] [Google Scholar]
- 2.Medelin M, Giacco V, Aldinucci A, Castronovo G, Bonechi E, Sibilla A, Tanturli M, Torcia M, Ballerini L, Cozzolino F et al. : Bridging pro-inflammatory signals, synaptic transmission and protection in spinal explants in vitro. Mol Brain 2018, 11(1):3. [DOI] [PMC free article] [PubMed] [Google Scholar]
- 3.Hartung HP, Graf J, Aktas O, Mares J, Barnett MH: Diagnosis of multiple sclerosis: revisions of the McDonald criteria 2017 - continuity and change. Curr Opin Neurol 2019, 32(3):327–337. [DOI] [PubMed] [Google Scholar]
- 4.Ontaneda D: Progressive Multiple Sclerosis. Continuum (Minneap Minn) 2019, 25(3):736–752. [DOI] [PubMed] [Google Scholar]
- 5.Kolahdouzan M, Futhey NC, Kieran NW, Healy LM: Novel Molecular Leads for the Prevention of Damage and the Promotion of Repair in Neuroimmunological Disease. Front Immunol 2019, 10:1657. [DOI] [PMC free article] [PubMed] [Google Scholar]
- 6.De Giglio L, Grimaldi AE, Fubelli F, Marinelli F, Pozzilli C: Advances in preventing adverse events during monoclonal antibody management of multiple sclerosis. Expert Rev Neurother 2019, 19(5):417–429. [DOI] [PubMed] [Google Scholar]
- 7.Shirani A, Stuve O: Natalizumab for Multiple Sclerosis: A Case in Point for the Impact of Translational Neuroimmunology. J Immunol 2017, 198(4):1381–1386. [DOI] [PubMed] [Google Scholar]
- 8.Hauser SL, Waubant E, Arnold DL, Vollmer T, Antel J, Fox RJ, Bar-Or A, Panzara M, Sarkar N, Agarwal S et al. : B-cell depletion with rituximab in relapsing-remitting multiple sclerosis. N Engl J Med 2008, 358(7):676–688. [DOI] [PubMed] [Google Scholar]
- 9.Studer V, Rossi S, Motta C, Buttari F, Centonze D: Peripheral B cell depletion and central proinflammatory cytokine reduction following repeated intrathecal administration of rituximab in progressive Multiple Sclerosis. J Neuroimmunol 2014, 276(1-2):229–231. [DOI] [PubMed] [Google Scholar]
- 10.Cross AH, Waubant E: MS and the B cell controversy. Biochim Biophys Acta 2011, 1812(2):231–238. [DOI] [PubMed] [Google Scholar]
- 11.von Budingen HC, Palanichamy A, Lehmann-Horn K, Michel BA, Zamvil SS: Update on the autoimmune pathology of multiple sclerosis: B-cells as disease-drivers and therapeutic targets. Eur Neurol 2015, 73(3-4):238–246. [DOI] [PMC free article] [PubMed] [Google Scholar]
- 12.Martin Mdel P, Cravens PD, Winger R, Kieseier BC, Cepok S, Eagar TN, Zamvil SS, Weber MS, Frohman EM, Kleinschmidt-Demasters BK et al. : Depletion of B lymphocytes from cerebral perivascular spaces by rituximab. Arch Neurol 2009, 66(8):1016–1020. [DOI] [PubMed] [Google Scholar]
- 13.Prockl V, Nickel FT, Utz KS, Frohlich K, Engelhorn T, Hilz MJ, Lee DH, Linker RA, Huhn K: Real world application of ocrelizumab in multiple sclerosis: Single-center experience of 128 patients. J Neurol Sci 2020, 415:116973. [DOI] [PubMed] [Google Scholar]
- 14.Radick L, Mehr SR: The Latest Innovations in the Drug Pipeline for Multiple Sclerosis. Am Health Drug Benefits 2015, 8(8):448–453. [PMC free article] [PubMed] [Google Scholar]
- 15.Sellebjerg F, Blinkenberg M, Sorensen PS: Anti-CD20 Monoclonal Antibodies for Relapsing and Progressive Multiple Sclerosis. CNS Drugs 2020, 34(3):269–280. [DOI] [PubMed] [Google Scholar]
- 16.Castillo-Trivino T, Braithwaite D, Bacchetti P, Waubant E: Rituximab in relapsing and progressive forms of multiple sclerosis: a systematic review. PLoS One 2013, 8(7):e66308. [DOI] [PMC free article] [PubMed] [Google Scholar]
- 17.Gingele S, Jacobus TL, Konen FF, Hummert MW, Suhs KW, Schwenkenbecher P, Ahlbrecht J, Mohn N, Muschen LH, Bonig L et al. : Ocrelizumab Depletes CD20(+) T Cells in Multiple Sclerosis Patients. Cells 2018, 8(1). [DOI] [PMC free article] [PubMed] [Google Scholar]
- 18.Schuh E, Berer K, Mulazzani M, Feil K, Meinl I, Lahm H, Krane M, Lange R, Pfannes K, Subklewe M et al. : Features of Human CD3+CD20+ T Cells. J Immunol 2016, 197(4):1111–1117. [DOI] [PubMed] [Google Scholar]
- 19.Monson NL, Cravens P, Hussain R, Harp CT, Cummings M, de Pilar Martin M, Ben LH, Do J, Lyons JA, Lovette-Racke A et al. : Rituximab therapy reduces organ-specific T cell responses and ameliorates experimental autoimmune encephalomyelitis. PLoS One 2011, 6(2):e17103. [DOI] [PMC free article] [PubMed] [Google Scholar]
- 20.Vaitaitis GM, Yussman MG, Wagner DH Jr.: A CD40 targeting peptide prevents severe symptoms in experimental autoimmune encephalomyelitis. J Neuroimmunol 2019, 332:8–15. [DOI] [PMC free article] [PubMed] [Google Scholar]
- 21.Vaitaitis GM, Rihanek M, Alkanani AK, Waid DM, Gottlieb PA, Wagner DH, Type 1 Diabetes TrialNet Study G: Biomarker discovery in pre-Type 1 Diabetes; Th40 cells as a predictive risk factor. J Clin Endocrinol Metab 2019. [DOI] [PMC free article] [PubMed] [Google Scholar]
- 22.Wagner DH Jr.: Overlooked Mechanisms in Type 1 Diabetes Etiology: How Unique Costimulatory Molecules Contribute to Diabetogenesis. Front Endocrinol (Lausanne) 2017, 8:208. [DOI] [PMC free article] [PubMed] [Google Scholar]
- 23.Vaitaitis GM, Yussman MG, Waid DM, Wagner DH Jr.: Th40 cells (CD4+CD40+ Tcells) drive a more severe form of Experimental Autoimmune Encephalomyelitis than conventional CD4 T cells. PLoS One 2017, 12(2):e0172037. [DOI] [PMC free article] [PubMed] [Google Scholar]
- 24.Vaitaitis GM, Waid DM, Yussman MG, Wagner DH Jr.: CD40-mediated signalling influences trafficking, T-cell receptor expression, and T-cell pathogenesis, in the NOD model of type 1 diabetes. Immunology 2017, 152(2):243–254. [DOI] [PMC free article] [PubMed] [Google Scholar]
- 25.Waid DM, Schreiner T, Vaitaitis G, Carter JR, Corboy JR, Wagner DH Jr.: Defining a new biomarker for the autoimmune component of Multiple Sclerosis: Th40 cells. J Neuroimmunol 2014, 270(1-2):75–85. [DOI] [PMC free article] [PubMed] [Google Scholar]
- 26.Vaitaitis GM, Olmstead MH, Waid DM, Carter JR, Wagner DH Jr.: A CD40-targeted peptide controls and reverses type 1 diabetes in NOD mice. Diabetologia 2014, 57(11):2366–2373. [DOI] [PMC free article] [PubMed] [Google Scholar]
- 27.Deng G, Carter J, Traystman RJ, Wagner DH, Herson PS: Pro-inflammatory T-lymphocytes rapidly infiltrate into the brain and contribute to neuronal injury following cardiac arrest and cardiopulmonary resuscitation. J Neuroimmunol 2014, 274(1-2):132–140. [DOI] [PMC free article] [PubMed] [Google Scholar]
- 28.Vaitaitis GM, Wagner DH Jr.: CD40 interacts directly with RAG1 and RAG2 in autoaggressive T cells and Fas prevents CD40-induced RAG expression. Cell Mol Immunol 2013, 10(6):483–489. [DOI] [PMC free article] [PubMed] [Google Scholar]
- 29.Vaitaitis GM, Carter JR, Waid DM, Olmstead MH, Wagner DH Jr.: An alternative role for Foxp3 as an effector T cell regulator controlled through CD40. J Immunol 2013, 191(2):717–725. [DOI] [PMC free article] [PubMed] [Google Scholar]
- 30.Vaitaitis GM, Wagner DH Jr.: CD40 glycoforms and TNF-receptors 1 and 2 in the formation of CD40 receptor(s) in autoimmunity. Mol Immunol 2010, 47(14):2303–2313. [DOI] [PMC free article] [PubMed] [Google Scholar]
- 31.Vaitaitis G, Waid DM, Wagner DH Jr.: The expanding role of TNF-receptor super family member CD40 (tnfrsf5) in autoimmune disease: Focus on Th40 cells. Curr Immunol Rev 2010, 6(2):130–136. [Google Scholar]
- 32.Waid DM, Vaitaitis GM, Pennock ND, Wagner DH Jr.: Disruption of the homeostatic balance between autoaggressive (CD4+CD40+) and regulatory (CD4+CD25+FoxP3+) T cells promotes diabetes. J Leukoc Biol 2008, 84(2):431–439. [DOI] [PMC free article] [PubMed] [Google Scholar]
- 33.Vaitaitis GM, Wagner DH Jr.: High distribution of CD40 and TRAF2 in Th40 T cell rafts leads to preferential survival of this auto-aggressive population in autoimmunity. PLoS One 2008, 3(4):e2076. [DOI] [PMC free article] [PubMed] [Google Scholar]
- 34.Mohme M, Hotz C, Stevanovic S, Binder T, Lee JH, Okoniewski M, Eiermann T, Sospedra M, Rammensee HG, Martin R: HLA-DR15-derived self-peptides are involved in increased autologous T cell proliferation in multiple sclerosis. Brain 2013, 136(Pt 6):1783–1798. [DOI] [PubMed] [Google Scholar]
- 35.Stys PK, Tsutsui S: Recent advances in understanding multiple sclerosis. F1000Res 2019, 8. [DOI] [PMC free article] [PubMed] [Google Scholar]
- 36.Ligocki AJ, Rivas JR, Rounds WH, Guzman AA, Li M, Spadaro M, Lahey L, Chen D, Henson PM, Graves D et al. : A Distinct Class of Antibodies May Be an Indicator of Gray Matter Autoimmunity in Early and Established Relapsing Remitting Multiple Sclerosis Patients. ASN Neuro 2015, 7(5). [DOI] [PMC free article] [PubMed] [Google Scholar]
- 37.Buzzard K, Chan WH, Kilpatrick T, Murray S: Multiple Sclerosis: Basic and Clinical. Adv Neurobiol 2017, 15:211–252. [DOI] [PubMed] [Google Scholar]
- 38.Wurth S, Kuenz B, Bsteh G, Ehling R, Di Pauli F, Hegen H, Auer M, Gredler V, Deisenhammer F, Reindl M et al. : Cerebrospinal fluid B cells and disease progression in multiple sclerosis - A longitudinal prospective study. PLoS One 2017, 12(8):e0182462. [DOI] [PMC free article] [PubMed] [Google Scholar]
- 39.Grove RA, Shackelford S, Sopper S, Pirruccello S, Horrigan J, Havrdova E, Gold M, Graff O: Leukocyte counts in cerebrospinal fluid and blood following firategrast treatment in subjects with relapsing forms of multiple sclerosis. Eur J Neurol 2013, 20(7):1032–1042. [DOI] [PubMed] [Google Scholar]
- 40.Gholamzad M, Ebtekar M, Ardestani MS, Azimi M, Mahmodi Z, Mousavi MJ, Aslani S: A comprehensive review on the treatment approaches of multiple sclerosis: currently and in the future. Inflamm Res 2019, 68(1):25–38. [DOI] [PubMed] [Google Scholar]
- 41.Ciotti JR, Cross AH: Disease-Modifying Treatment in Progressive Multiple Sclerosis. Curr Treat Options Neurol 2018, 20(5):12. [DOI] [PubMed] [Google Scholar]
- 42.Chen Q, Yuan S, Sun H, Peng L: CD3(+)CD20(+) T cells and their roles in human diseases. Hum Immunol 2019. [DOI] [PubMed] [Google Scholar]
- 43.Palanichamy A, Jahn S, Nickles D, Derstine M, Abounasr A, Hauser SL, Baranzini SE, Leppert D, von Budingen HC: Rituximab efficiently depletes increased CD20-expressing T cells in multiple sclerosis patients. J Immunol 2014, 193(2):580–586. [DOI] [PMC free article] [PubMed] [Google Scholar]
- 44.Siebert JC, Inokuma M, Waid DM, Pennock ND, Vaitaitis GM, Disis ML, Dunne JF, Wagner DH Jr., Maecker HT: An analytical workflow for investigating cytokine profiles. Cytometry A 2008, 73(4):289–298. [DOI] [PubMed] [Google Scholar]
- 45.Hausler D, Hausser-Kinzel S, Feldmann L, Torke S, Lepennetier G, Bernard CCA, Zamvil SS, Bruck W, Lehmann-Horn K, Weber MS: Functional characterization of reappearing B cells after anti-CD20 treatment of CNS autoimmune disease. Proc Natl Acad Sci U S A 2018, 115(39):9773–9778. [DOI] [PMC free article] [PubMed] [Google Scholar]
- 46.Bigaut K, de Seze J, Collongues N: Ocrelizumab for the treatment of multiple sclerosis. Expert Rev Neurother 2018. [DOI] [PubMed] [Google Scholar]
- 47.Wiesemann E, Deb M, Trebst C, Hemmer B, Stangel M, Windhagen A: Effects of interferon-beta on co-signaling molecules: upregulation of CD40, CD86 and PD-L2 on monocytes in relation to clinical response to interferon-beta treatment in patients with multiple sclerosis. Mult Scler 2008, 14(2):166–176. [DOI] [PubMed] [Google Scholar]
- 48.Benveniste EN, Nguyen VT, Wesemann DR: Molecular regulation of CD40 gene expression in macrophages and microglia. Brain Behav Immun 2004, 18(1):7–12. [DOI] [PubMed] [Google Scholar]
- 49.Chitnis T, Khoury SJ: Role of costimulatory pathways in the pathogenesis of multiple sclerosis and experimental autoimmune encephalomyelitis. J Allergy Clin Immunol 2003, 112(5):837–849; quiz 850. [DOI] [PubMed] [Google Scholar]
- 50.Howard LM, Dal Canto MC, Miller SD: Transient anti-CD154-mediated immunotherapy of ongoing relapsing experimental autoimmune encephalomyelitis induces long-term inhibition of disease relapses. J Neuroimmunol 2002, 129(1-2):58–65. [DOI] [PubMed] [Google Scholar]
- 51.Howard LM, Miga AJ, Vanderlugt CL, Dal Canto MC, Laman JD, Noelle RJ, Miller SD: Mechanisms of immunotherapeutic intervention by anti-CD40L (CD154) antibody in an animal model of multiple sclerosis. J Clin Invest 1999, 103(2):281–290. [DOI] [PMC free article] [PubMed] [Google Scholar]
- 52.Mach F, Schonbeck U, Sukhova GK, Atkinson E, Libby P: Reduction of atherosclerosis in mice by inhibition of CD40 signalling. Nature 1998, 394(6689):200–203. [DOI] [PubMed] [Google Scholar]
- 53.Kornbluth RS, Kee K, Richman DD: CD40 ligand (CD154) stimulation of macrophages to produce HIV-1-suppressive beta-chemokines. Proc Natl Acad Sci U S A 1998, 95(9):5205–5210. [DOI] [PMC free article] [PubMed] [Google Scholar]
- 54.Peters AL, Stunz LL, Bishop GA: CD40 and autoimmunity: the dark side of a great activator. Semin Immunol 2009, 21(5):293–300. [DOI] [PMC free article] [PubMed] [Google Scholar]
- 55.Sakai K, Kitagawa Y, Saiki M, Saiki S, Hirose G: Binding of the ELAV-like protein in murine autoimmune T-cells to the nonameric AU-rich element in the 3' untranslated region of CD154 mRNA. Mol Immunol 2003, 39(14):879–883. [DOI] [PubMed] [Google Scholar]
- 56.Michel L, Chesneau M, Manceau P, Genty A, Garcia A, Salou M, Elong Ngono A, Pallier A, Jacq-Foucher M, Lefrere F et al. : Unaltered regulatory B-cell frequency and function in patients with multiple sclerosis. Clin Immunol 2014, 155(2):198–208. [DOI] [PubMed] [Google Scholar]
- 57.Wheway J, Latham SL, Combes V, Grau GE: Endothelial microparticles interact with and support the proliferation of T cells. J Immunol 2014, 193(7):3378–3387. [DOI] [PMC free article] [PubMed] [Google Scholar]
- 58.Wheway J, Obeid S, Couraud PO, Combes V, Grau GE: The brain microvascular endothelium supports T cell proliferation and has potential for alloantigen presentation. PLoS One 2013, 8(1):e52586. [DOI] [PMC free article] [PubMed] [Google Scholar]
- 59.Lisak RP, Benjamins JA, Nedelkoska L, Barger JL, Ragheb S, Fan B, Ouamara N, Johnson TA, Rajasekharan S, Bar-Or A: Secretory products of multiple sclerosis B cells are cytotoxic to oligodendroglia in vitro. J Neuroimmunol 2012, 246(1-2):85–95. [DOI] [PubMed] [Google Scholar]
- 60.Kalinowska-Lyszczarz A, Losy J: The role of neurotrophins in multiple sclerosis-pathological and clinical implications. International journal of molecular sciences 2012, 13(10):13713–13725. [DOI] [PMC free article] [PubMed] [Google Scholar]
- 61.Jagessar SA, Heijmans N, Oh L, Bauer J, Blezer EL, Laman JD, Migone TS, Devalaraja MN, t Hart BA: Antibodies against human BLyS and APRIL attenuate EAE development in marmoset monkeys. J Neuroimmune Pharmacol 2012, 7(3):557–570. [DOI] [PMC free article] [PubMed] [Google Scholar]
- 62.Girvin AM, Dal Canto MC, Miller SD: CD40/CD40L interaction is essential for the induction of EAE in the absence of CD28-mediated co-stimulation. J Autoimmun 2002, 18(2):83–94. [DOI] [PubMed] [Google Scholar]
- 63.Tan L, Gordon KB, Mueller JP, Matis LA, Miller SD: Presentation of proteolipid protein epitopes and B7-1-dependent activation of encephalitogenic T cells by IFN-gamma-activated SJL/J astrocytes. J Immunol 1998, 160(9):4271–4279. [PubMed] [Google Scholar]
- 64.Baker RL, Wagner DH Jr., Haskins K: CD40 on NOD CD4 T cells contributes to their activation and pathogenicity. J Autoimmun 2008, 31(4):385–392. [DOI] [PubMed] [Google Scholar]
- 65.Vaitaitis G, Wagner DH Jr.: CD40 Glycoforms and TNF-Receptors 1 and 2 in the Formation of CD40 Receptor(s) in Autoimmunity. Mol Immunol 2010, 47:2303–2313. [DOI] [PMC free article] [PubMed] [Google Scholar]
- 66.Waid DM, Wagner RJ, Putnam A, Vaitaitis GM, Pennock ND, Calverley DC, Gottlieb P, Wagner DH Jr.: A unique T cell subset described as CD4loCD40+ T cells (TCD40) in human type 1 diabetes. Clin Immunol 2007, 124(2):138–148. [DOI] [PubMed] [Google Scholar]
- 67.Waid DM, Vaitaitis GM, Wagner DH Jr.: Peripheral CD4loCD40+ auto-aggressive T cell expansion during insulin-dependent diabetes mellitus. Eur J Immunol 2004, 34(5):1488–1497. [DOI] [PubMed] [Google Scholar]
- 68.Vaitaitis GM, Poulin M, Sanderson RJ, Haskins KJ, Wagner DH Jr.: CD40-Induced Expression of Recombination Activating Gene (RAG) 1 and RAG2: A Mechanism for the Generation of Autoaggressive T Cells in the Periphery. Cutting Edge, J Immunol 2003, 170:3455–3459. [DOI] [PubMed] [Google Scholar]
- 69.Wagner DH Jr., Vaitaitis G, Sanderson R, Poulin M, Dobbs C, Haskins K: Expression of CD40 identifies a unique pathogenic T cell population in type 1 diabetes. Proc Natl Acad Sci U S A 2002, 99(6):3782–3787. [DOI] [PMC free article] [PubMed] [Google Scholar]
- 70.Wagner DH Jr.: The co-evolution of our understanding of CD40 and inflammation. Diabetologia 2009, 52(6):997–999. [DOI] [PubMed] [Google Scholar]
- 71.Thouvenot E: Update on clinically isolated syndrome. Presse Med 2015, 44(4 Pt 2):e121–136. [DOI] [PubMed] [Google Scholar]
- 72.Weber MS, Hemmer B, Cepok S: The role of antibodies in multiple sclerosis. Biochim Biophys Acta 2011, 1812(2):239–245. [DOI] [PubMed] [Google Scholar]
- 73.Fraussen J, Vrolix K, Martinez-Martinez P, Losen M, De Baets MH, Stinissen P, Somers V: B cell characterization and reactivity analysis in multiple sclerosis. Autoimmun Rev 2009, 8(8):654–658. [DOI] [PMC free article] [PubMed] [Google Scholar]
- 74.Vaitaitis GM, Yussman MG, Waid DM, Wagner DH: Th40 cells (CD4+CD40+ Tcells) drive a more severe form of Experimental Autoimmune Encephalomyelitis than conventional CD4 T cells. PLoS One 2017(12(2)): e0172037. [DOI] [PMC free article] [PubMed] [Google Scholar]
- 75.Russi AE, Brown MA: The meninges: new therapeutic targets for multiple sclerosis. Transl Res 2015, 165(2):255–269. [DOI] [PMC free article] [PubMed] [Google Scholar]
- 76.Ghezzi L, Cantoni C, Cignarella F, Bollman B, Cross AH, Salter A, Galimberti D, Cella M, Piccio L: T cells producing GM-CSF and IL-13 are enriched in the cerebrospinal fluid of relapsing MS patients. Mult Scler 2020, 26(10):1172–1186. [DOI] [PubMed] [Google Scholar]
- 77.Hoglund RA, Bremel RD, Homan EJ, Torsetnes SB, Lossius A, Holmoy T: CD4(+) T Cells in the Blood of MS Patients Respond to Predicted Epitopes From B cell Receptors Found in Spinal Fluid. Front Immunol 2020, 11:598. [DOI] [PMC free article] [PubMed] [Google Scholar]
- 78.Ireland SJ, Guzman AA, Frohman EM, Monson NL: B cells from relapsing remitting multiple sclerosis patients support neuro-antigen-specific Th17 responses. J Neuroimmunol 2016, 291:46–53. [DOI] [PubMed] [Google Scholar]
- 79.Kanzaki M, Shibata H, Mogami H, Kojima I: Expression of calcium-permeable cation channel CD20 accelerates progression through the G1 phase in Balb/c 3T3 cells. J Biol Chem 1995, 270(22):13099–13104. [DOI] [PubMed] [Google Scholar]
- 80.Sabahi R, Anolik JH: B-cell-targeted therapy for systemic lupus erythematosus. Drugs 2006, 66(15):1933–1948. [DOI] [PubMed] [Google Scholar]
- 81.Fanale MA, Younes A: Monoclonal antibodies in the treatment of non-Hodgkin's lymphoma. Drugs 2007, 67(3):333–350. [DOI] [PubMed] [Google Scholar]
- 82.Ray A, Mann MK, Basu S, Dittel BN: A case for regulatory B cells in controlling the severity of autoimmune-mediated inflammation in experimental autoimmune encephalomyelitis and multiple sclerosis. J Neuroimmunol 2011, 230(1-2):1–9. [DOI] [PMC free article] [PubMed] [Google Scholar]
- 83.Al-Zoobi L, Salti S, Colavecchio A, Jundi M, Nadiri A, Hassan GS, El-Gabalawy H, Mourad W: Enhancement of Rituximab-induced cell death by the physical association of CD20 with CD40 molecules on the cell surface. Int Immunol 2014, 26(8):451–465. [DOI] [PubMed] [Google Scholar]
- 84.Boster A, Ankeny DP, Racke MK: The potential role of B cell-targeted therapies in multiple sclerosis. Drugs 2010, 70(18):2343–2356. [DOI] [PubMed] [Google Scholar]
- 85.Holley JE, Bremer E, Kendall AC, de Bruyn M, Helfrich W, Tarr JM, Newcombe J, Gutowski NJ, Eggleton P: CD20+inflammatory T-cells are present in blood and brain of multiple sclerosis patients and can be selectively targeted for apoptotic elimination. Mult Scler Relat Disord 2014, 3(5):650–658. [DOI] [PubMed] [Google Scholar]
- 86.Pelz A, Schaffert H, Diallo R, Hiepe F, Meisel A, Kohler S: S1P receptor antagonists fingolimod and siponimod do not improve the outcome of experimental autoimmune myasthenia gravis mice after disease onset. Eur J Immunol 2018, 48(3):498–508. [DOI] [PubMed] [Google Scholar]
- 87.Fragoso YD, Spelman T, Boz C, Alroughani R, Lugaresi A, Vucic S, Butzkueven H, Terzi M, Havrdova E, Horakova D et al. : Lymphocyte count in peripheral blood is not associated with the level of clinical response to treatment with fingolimod. Mult Scler Relat Disord 2018, 19:105–108. [DOI] [PubMed] [Google Scholar]
- 88.Soares L, Yip L, Hurt CR, Fathman G: A Common Druggable Defect in Regulatory T Cells from Patients with Autoimmunity. Crit Rev Immunol 2020, 40(3):185–193. [DOI] [PubMed] [Google Scholar]
- 89.Radichev IA, Yoon J, Scott DW, Griffin K, Savinov AY: Towards antigen-specific Tregs for type 1 diabetes: Construction and functional assessment of pancreatic endocrine marker, HPi2-based chimeric antigen receptor. Cell Immunol 2020, 358:104224. [DOI] [PMC free article] [PubMed] [Google Scholar]
Associated Data
This section collects any data citations, data availability statements, or supplementary materials included in this article.
Supplementary Materials
Supplemental Figure 1: B cells and CD8 cell levels before, during and after Ocrelizumab treatment. PBMC from no DMT (n = 9), 3 – 9 months post Ocrelizumab infusion (n = 9), and greater than 12 months post infusion (n = 9) were examined for HLA-DR+CD19+ B cells and no DMT (n = 18), 3 – 9 months post Ocrelizumab infusion (n = 9), and greater than 12 months post infusion (n = 9) were examined for CD8+CD3+ cells. A single observation at 1 month was available for B cell versus TH40 cell; both had reduced substantially when compared to No DMT treated subjects. Statistics were one-way ANOVA, Brown-Forsythe and Welch’s, comparing B cell cohorts and comparing CD8 cohorts. There were no significant differences in mean values between any of the groups.