Summary
Celiac disease (CeD) is an autoimmune disorder in which gluten-derived antigens trigger inflammation. Antigenic peptides must undergo site-specific deamidation to be presentable to CD4+ T cells in an HLA-DQ2 or -DQ8 restricted manner. While the biochemical basis for this post-translational modification is understood, its localization in the patient’s intestine remains unknown. Here, we describe a mechanism by which gluten peptides undergo deamidation and concentration in the lysosomes of antigen presenting cells, explaining how the concentration of gluten peptides necessary to elicit an inflammatory response in CeD patients is achieved. A ternary complex forms between a gluten peptide, transglutaminase-2 (TG2) and ubiquitous plasma protein α2-macroglobulin, and is endocytosed by LRP-1. The covalent TG2-peptide adduct undergoes endolysosomal decoupling, yielding the expected deamidated epitope. Our findings invoke a pathogenic role for dendritic cells and/or macrophages in CeD and implicate TG2 in the lysosomal clearance of unwanted self and foreign extracellular proteins.
Keywords: Celiac Disease, Tranglutaminase-2, MHC-II, α2-macroglobulin, LRP-1, antigen presentation
Graphical Abstract
eTOC blurb:
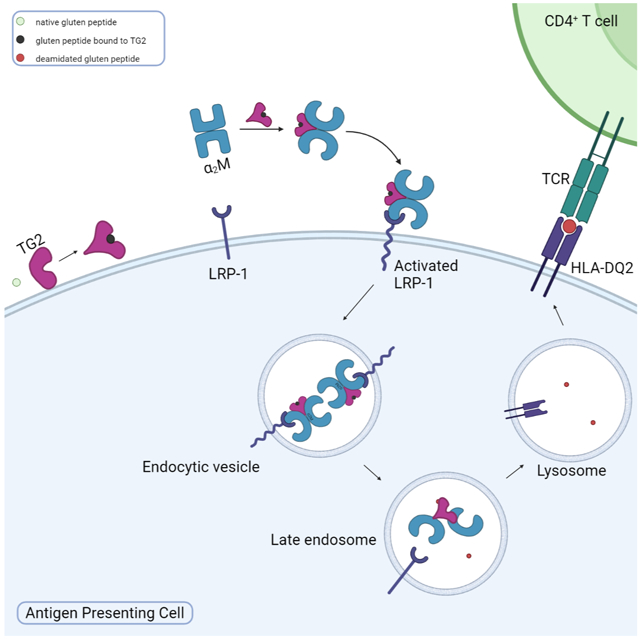
Loppinet et al demonstrate that gluten peptides bound to TG2 undergo LRP-1-mediated endocytosis in the presence of α2-macroglobulin. Deamidated gluten peptides are then concentrated in the endolysosomal system and efficiently displayed on MHC-II in HLA-DQ2 expressing cells. This invokes a pathogenic role for macrophages and dendritic cells in celiac disease.
Introduction
Celiac disease (CeD) is an autoimmune disease that affects approximately 1% of the population in most parts of the world1. Ingestion of gluten proteins from wheat, barley, or rye by a CeD patient induces widespread inflammation, including T cell inflammation in the small intestinal mucosa, leading to villous atrophy and symptoms ranging from abdominal pain and bloating to chronic fatigue, anemia, and osteopenia2. In contrast to most other autoimmune diseases, the primary environmental and genetic factors causing CeD, dietary gluten and HLA-DQ2 or -DQ8 respectively, have been identified and their pathologically relevant interactions have been characterized in considerable depth3. However, other than strict, lifelong gluten exclusion, there is currently no approved therapy for CeD4.
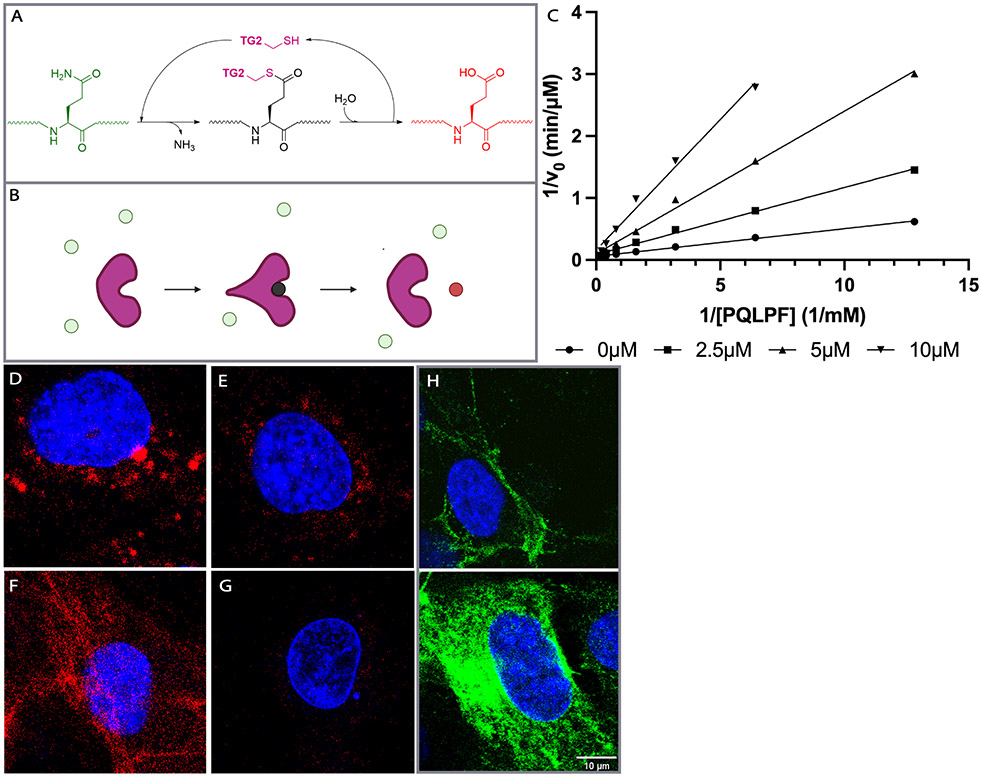
An extensive body of evidence has established that sequence-selective deamidation of gluten peptides by transglutaminase-2 (TG2; Fig. 1A-B) is necessary for their high-affinity recognition by disease-associated HLA-DQ2 or -DQ8 and subsequent presentation to CD4+ T cells5. TG2 is a ubiquitous enzyme found in intracellular as well as extracellular compartments of the mammalian intestine; its activity is upregulated in response to dietary gluten in a transgenic mouse model of CeD6. Together, these observations provide a compelling molecular rationale for the onset of gluten-dependent inflammation in CeD. For example, a 33-residue peptide, LQLQPFPQPQLPYPQPQLPYPQPQLPYPQPQPF, generated via chymotrypsin-catalyzed proteolysis of dietary gluten in the upper intestinal lumen, undergoes TG2-promoted deamidation at the boldfaced residues to reveal multiple copies of DQ2-restricted T cell epitopes7,8. Upon surface presentation by DQ2-expressing antigen presenting cells (APCs), the deamidated peptide potently activates disease-specific T-helper cells9.
Figure 1:
Relevant properties of transglutaminase 2 (TG2). (A) TG2-catalyzed conversion of a gluten peptide (green) into a high-affinity deamidated analog (red) via a transient covalently bound thioester species (black). (B) Cartoon representation of the transformation shown in (A). The covalent acyl-enzyme intermediate is anticipated to undergo a transient conformational change24. (C) Kinetic analysis of TG2 inhibition by HB225. Both substrate (PQLPF) and inhibitor concentrations were varied. Measurements were done in triplicate (n=3). (D-G) Probing mouse embryonic fibroblasts (MEFs) with HB230 and related probes of TG2 activity. (D) Treatment of wild-type MEFs with 1 μM HB230 in the presence of 10μM thioredoxin (TRX - needed to activate latent extracellular TG2 in this cell line20 - leads to a punctate staining pattern that is markedly diminished in TG2 knock-out MEFs (E). (F) The staining pattern of HB230 is distinct from that observed with 100 μM 5BP, which elicits a fibrous incorporation pattern that highlights fibronectin strands in the extracellular matrix20. (G) HB230 labeling of MEFs is fully inhibited by co-treatment with 10μM CK805, a reference TG2 inhibitor. (H) Staining using an anti-TG2 antibody uncovers localization of the protein in live (top) and fixed/permeabilized cells (bottom). TG2 is abundant on the cell surface as well as intracellular compartments. For a wide view, see Fig. S1. In all panels, blue staining is DAPI and green is TG2 protein. Red staining is 5BP in panel F and HB230 in all other panels.
However, a fundamental remaining mystery in our knowledge of CeD pathogenesis concerns how the threshold for induction of pathogenic CD4 T cell responses is reached. The need for such a threshold is supported by the presence of an HLA-gene dosage effect for CeD susceptibility10, the observation that HLA-DQ2, which has the potential to bind a higher number of gluten peptides than HLA-DQ8, is the strongest disease determinant11, and the requirement of deamidation for tissue destruction6. Simple diffusion-driven encounters between extracellular gluten peptides and MHC proteins expressed by APCs, while theoretically possible, are unlikely to result in sufficient numbers of MHC-deamidated gluten peptide complexes to induce pathology for two reasons. First, gluten peptide concentration in the sub-epithelial environment of the small intestine is expected to be significantly lower than the KM values of TG2 (10-100 μM) even for the most favored substrates. This would be especially so after relatively minor but nonetheless inflammatory dietary lapses by CeD patients, which deliver 0.1-1 g gluten (~1 μM of the aforementioned 33-residue peptide) into the duodenal lumen; from there a further concentration drop presumably results across the epithelium due to the barrier-like properties of tight junction proteins. Second, because class II MHCs are typically loaded with peptide ligands in the late endosome or lysosome12, a mechanism must exist to enrich deamidated gluten antigens in this compartment of antigen presenting cells (APCs).
Several subsets of APCs have been observed in the mucosa of CeD patients, including CD123+ and CD11+ dendritic cells and CD68+ macrophages13-16. However, their role in CeD pathogenesis remains unclear, because deamidated gluten peptides are not expected to accumulate in the lamina propria of the small intestine to be spontaneously engulfed via pinocytosis by these cells in pathologically meaningful quantities12. While it is possible that some antigen is sampled by dendritic cells at the epithelial surface or via M cell transport 17, alternative mechanisms must also be considered for APCs to selectively endocytose the deamidated gluten peptides and concentrate them in lysosomes for efficient MHC-II presentation. Here we describe a mechanism for gluten presentation which relies on high-affinity protein-protein interactions while simultaneously enabling lysosomal enrichment of deamidated gluten antigens.
Results
Our quest to elucidate the mechanistic basis for gluten antigen delivery to HLA-DQ2 or -DQ8 was initiated by engineering a high-affinity probe to directly visualize the location of active TG2 in the small intestine. Prior work has shown that a vast majority of TG2 in the extracellular matrix of the small intestine is catalytically inactive and that inflammatory signals are required to induce enzyme activity18-20 . We hypothesized that active TG2 in the CeD small intestine would be non-uniformly distributed and may thus highlight the precise location where MHC binds to deamidated gluten peptides. While small molecule probes of TG2 activity have previously been reported, none of them have the requisite selectivity to visualize the active enzyme in situ with high spatial resolution21. The most widely used example of a TG2 activity probe, 5-biotinamidopentylamine (5-BP), is a relatively weak nucleophilic substrate, which becomes attached to electrophilic Gln (Q) residues of matrix protein substrates such as fibronectin22 when dosed at high concentrations (> 100 μM in cell culture or >100 mg/kg intravenously in mice)18,23. In all experiments involving the use of 5-BP to visualize TG2, it has been assumed that the enzyme colocalizes with its substrates, but this assumption has never been experimentally tested.
Design, synthesis, and biochemical analysis of HB230:
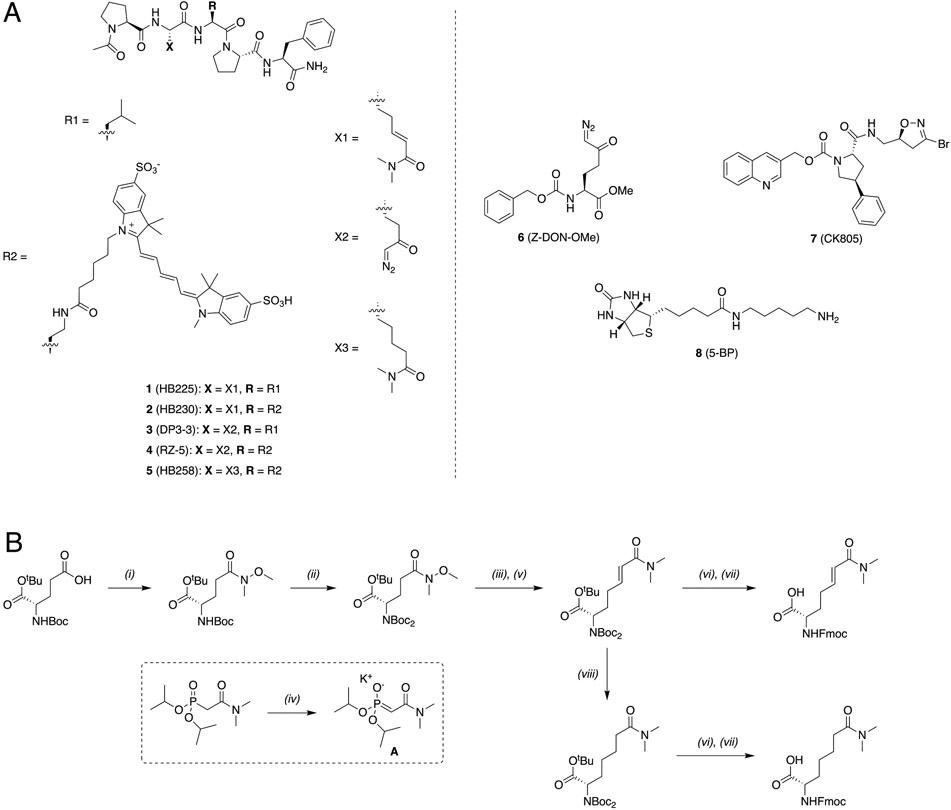
HB225 (1, Scheme 1A) is a peptidomimetic small molecule modeled after the TG2 recognition site of its preferred substrate PQLPY, three copies of which are found in the 33-residue gluten peptide cited above. Upon deamidation, each site exposes two overlapping CD4+ T cell epitopes, P(F/Y)PQPELPY and PQPELPYPQ, known to be immunodominant in HLA-DQ2 expressing CeD patients. Three key features were central to the design of HB225. First, the reactive Gln residue of PQLPY was replaced with an isosteric unnatural amino acid harboring an α,β-unsaturated dimethylamide “soft” electrophile, which was expected to result in irreversible covalent attachment of this small molecule inhibitor to the active site Cys residue (C277) of TG2 via a Michael addition. (This unnatural amino acid will hereafter be referred to as HWE in recognition of the Horner-Wadsworth-Emmons reaction that was central to its gram-scale synthesis.) Second, the terminal Tyr (Y) residue was replaced with proteinogenic Phe (F) for synthetic convenience, as the phenolic substituent of Tyr was also not predicted to be relevant to TG2 or HLA-DQ28,24 recognition based on co-crystal structures of both proteins solved previously in our laboratory. And finally, the N- and C-termini of HB225 harbored acetyl and amide protecting groups, respectively, to mimic the context of a longer peptide while also mitigating amino- and carboxy-peptidase catalyzed destruction of the probe in the proteolytically harsh gastrointestinal lumen.
Scheme 1:
(A) Structures of key small molecules used in this study. (B) Synthesis of HB230 and HB258.
(i) HNMeOme·HCl, IBCF, NMM, DCM, 0°C→RT, 3 hrs (93%) (ii) Boc2O, NEt3, DMAP, DCM, reflux, 3 hrs (97%) (iii) DIBAL-H, THF, −78°C→RT, 1 hr (iv) KOtBU, THF, 30 mins, RT (v) A, THF, RT, 1.5 hrs (78%, >40:1 E:Z, 2 steps) (vi) 1:1 TFA/DCM, RT, 4 hrs (vii) Fmoc-OSu, DIPEA, DCM, 30 mins (88%, 2 steps) (viii) NaBH4, CoCl2·6H2O, MeOH, 0°C→RT, 30 mins (96%)
IBCF: isobutyl chloroformate, NMM: N-methylmorpholine, DIBAL-H: diisobutylaluminum hydride, DMAP: 4-dimethylaminopyridine, Boc2O: ditertbutyl dicarbonate, DCM: dichloromethane, THF: tetrahydrofuran
Synthesis of HB225 is outlined in Scheme 1B and described in the STAR Methods section. Steady-state kinetic analysis (Fig. 1C) revealed that HB225 inactivated human TG2 with high specificity (ki = 0.04 min−1, Ki = 1.3 μM), comparable to the most potent irreversible inhibitor reported to date, DP3-3 (2; Scheme 1A) which harbors a 6-diazo-5-oxo-norleucine (DON) warhead in place of a reactive Gln24. Encouraged by this finding, we went on to design and synthesize our target fluorescent probe, HB230 (3; Scheme 1A), in which a second unnatural amino acid residue, diaminobutyrate (DAB), was installed in place of Leu (L) in HB225. This residue was also predicted to not be recognized by TG2. Attachment of a Sulfo-Cy5 fluorophore via NHS-ester linkage to the DAB residue yielded the desired probe. As anticipated, HB230 had comparable potency to HB225 (IC50=4.9 μM versus 5.1 μM respectively, under equivalent assay conditions, Fig. S1A). We also synthesized a small quantity of RZ-5 (4; Scheme 1A), an analog of HB230 harboring the DON residue in place of HWE. RZ-5 was comparably potent to HB230 but was not subjected to extensive biological evaluation due to its lack of synthetic scalability and lability under simulated acidic conditions of the stomach.
HB230 reveals a novel pattern of active TG2 localization:
Incubation of mouse embryonic fibroblasts (MEFs) with HB230 for 3 h led to labeling of these cells in a manner that was not observed with control MEFs derived from TG2-knockout mice (Fig. 1D-G). Similar results were also obtained when treating with RZ-5 (Fig. S1B). Notably, both probes revealed a hitherto unprecedented labeling pattern that was markedly different from equivalent experiments in which 5-BP was used to visualize TG2 activity (Fig. 1F); whereas the latter samples showed the label bound to extracellular matrix proteins (e.g., fibronectin) in a predictably fibrous pattern, the former samples showed predominantly punctate, intracellular labeling that was primarily located near the nucleus. Labeling was strongly dependent in all cases upon addition of recombinant human thioredoxin (TRX) to the culture medium for the duration of the HB230 treatment20; TRX activates extracellular TG2 via reduction of a disulfide bond between C370 and C371 that allosterically maintains the enzyme in an inactive state. TG2 is ubiquitously expressed and found in both intracellular and extracellular spaces (Fig. 1H). While it is not clear what the distribution is between membrane bound and diffusible free TG2 in the extracellular environment, there appears to be sufficient TG2 near the membrane (Fig. 1H, top) to generate the activity observed in Fig. 1D, F. As expected, addition of the TG2-selective inhibitor CK80525 led to a sharp reduction in fluorescent labeling of HB230 (Fig. 1G). Together, these preliminary results suggested that, whereas activated TG2 predominantly recognized and modified protein substrates localized to the extracellular matrix of cells, the active enzyme itself was efficiently internalized via an endocytic process. Our data were uncannily reminiscent of reports from Pastan and coworkers over four decades ago, who concluded that TG2 activity is essential in receptor-mediated endocytosis of certain physiologically important proteins such as α2-macroglobulin (α2M), insulin, and epidermal growth factor26,27 . To our knowledge however, those authors’ remarkable observations have not been subsequently followed up in detail.
HB230 induces α2-macroglobulin-dependent endocytosis of catalytically active TG2:
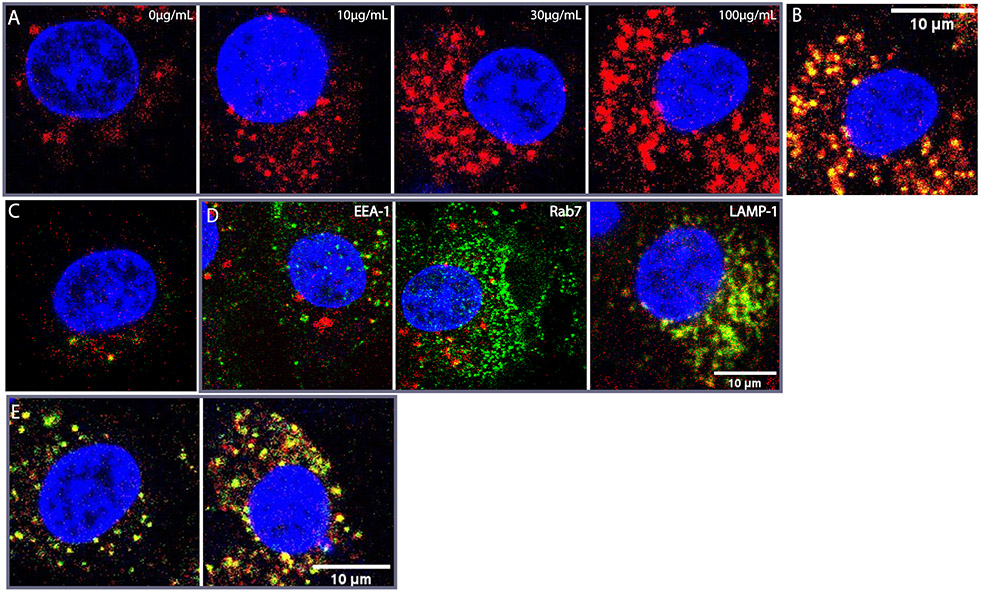
The ~800 kDa homotetrameric pan-protease inhibitor, α2-macroglobulin (α2M), is present at high concentrations in human plasma (1-5 mg/mL) and presumably also in the extracellular environments of most cells28. Rather than directly inhibiting enzyme activity, α2M acts by collapsing around its target proteases through a large-scale conformational change, in turn becoming recognizable by low density lipoprotein receptor-related protein 1 (LRP-1) and undergoing canonical receptor-mediated endocytosis29, eventually leading to endolysosomal protease destruction and receptor recycling. Because serum-containing culture media invariably contains a low and variable amount of α2M, we systematically investigated the effect of α2M supplementation on HB230-mediated endocytosis of TG2. Natural rat kidney (NRK) cells were used in these and several subsequent experiments, because earlier work by Pastan and coworkers26,27 had predominantly relied on the use of this non-cancerous cell line. As seen in Fig. 2A, NRK cells showed robust uptake of 1 μM exogenous HB230 in 90 min. Uptake was independent of exogenous TRX addition, suggesting the existence of a relatively high innate extracellular TG2 activity level in cultures of this cell line. Puncta of two distinct sizes were observed. Supplementation of NRK cell cultures with α2M led to a strong dose-dependent increase in uptake of HB230 up to ~100 μg/mL, indicative of a saturable mechanism. (Note that the physiological concentration of α2M in human plasma typically exceeds 1 mg/mL30.) The addition of α2M predominantly appeared to affect the size and number of the larger puncta, which are indicative of receptor mediated endocytosis uptake.
Figure 2:
(A) Dose-response of HB230 puncta to exogenous α2M in cultures of NRK cells. In all panels HB230 is present at a concentration of 1 μM. Uptake of TG2 bound-HB230 increased with increasing doses of α2M. When fluorescent α2M is used, the overlap between HB230 (red) and α2M (green) is strong (B). (C) HB258 (1 μM) is internalized significantly less than HB230 even at saturating α2M and the overlap between HB258 and the fluorescent α2M is minimal. (D) A labeled antibody (green) against the early endosome marker EEA-1 (left) shows non-overlapping localization in NRK cells relative to the compartment represented by large red puncta containing the HB230/TG2/α2M complex. Rab7 (middle, green) also does not colocalize strongly with HB230. In contrast RFP-tagged LAMP-1 (lysosomal marker, green) strongly colocalizes with the same large red puncta (right). (E) To assess the effect of lysosomal protease inhibition on probe clearance, HB230 (red) and labeled α2M (green) were added to cultured NRK cells in the absence (left) or presence (right) of a cathepsin B inhibitor. After 90 min, the culture medium was replaced, and cells were incubated for an additional 30min before visualizing via confocal microscopy. Inhibition of cathepsin B leads to an increase in the HB230/a2M ratio, implying rapid proteolytic degradation of the peptidic TG2 inhibitor in the lysosome. For wide views of all panels in this Figure, see Fig. S2. In all panels, blue staining is DAPI and red staining is HB230. Green staining is as indicated in panel D and α2M in panels B and E.
To obtain definitive evidence for co-endocytosis of HB230 and α2M, a fluorescent batch of α2M was prepared as described in the Materials and Methods section. Using this probe, a strong overlap was observed between the fluorescent signals of HB230 (green) and α2M (red) in the larger, but not smaller, puncta (Fig. 2B). Pearson’s colocalization coefficient was calculated to quantify the overlap between the red and green channels and was found to be PCC=0.79 indicating a strong correlation.
To verify that HB230 internalization was dependent on TG2 activity, HB258 (5; Scheme 1A) was designed and synthesized as a control probe. This dihydro-analog is otherwise identical to HB230 but lacks its electrophilic warhead and is therefore unable to irreversibly bond to the active site C277 residue of TG2. The synthesis and biochemical characterization of HB258 are detailed in Fig. 1B and the supplemental information. As seen in Fig. 2C, HB258 does not undergo significant uptake by NRK cells even at high concentrations of both the probe and α2M in the culture medium. Notably, this fluorescent probe only appears as small intracellular puncta; the larger puncta formed by HB230 are absent.
Characterizing the large puncta harboring colocalized TG2 and α2M:
To establish the identity of the large intracellular puncta harboring both α2M and TG2 bound to HB230 (Fig. 2A), NRK cells were transfected with a gene encoding lysosomal-associated membrane protein (LAMP-1) tagged to RFP. Wild-type and transfected cells were co-incubated with α2M and HB230 for 90 min prior to fixation. To further characterize the large puncta containing both α2M and TG2, fixed NRK cells were stained with an antibody against early endosome antigen-1 (EEA-1) and Rab7, a late endosomal marker. As observed in Fig. 2D, EEA-1 and HB230 appear in distinct sub-cellular compartments for the most part (PCC=0.01), implying that vesicles derived from internalization of the HB230/TG2/α2M complex did not fuse with early endosomes. Similarly, Rab7 (Fig. 2D, middle) also did not colocalize strongly with HB230 in the late endosomes (PCC=0.03). In contrast, HB230 strongly co-localized with RFP-tagged LAMP-1 in the large puncta (Fig. 2D, right, PCC=0.426), implying that internalized vesicles harboring the ternary complex comprised of HB230, TG2 and α2M were efficiently escorted to the lysosome. Antigen processing prior to cell surface presentation occurs in different compartments, from early endosomes to lysosomes depending on the antigen and the cell type, and antigens containing vesicles are not necessarily fused with endosomes31 Additionally, NRK cells are not professional APCs, and as a result may not have mature MHC-II presentation systems. Thus, it is likely that in these cells the substrate bound TG2 and α2M complex is shuttled directly to lysosomal compartments without prior interaction with early or late endosomes.
Further evidence that the HB230/TG2/α2M ternary complex is trafficked to the lysosome was derived by treating NRK cells with a cell-permeable cathepsin B inhibitor or vehicle along with HB230 and labeled α2M (Fig. 2E). Inhibition of this major lysosomal protease results in a prolonged lifespan of HB230 in this sub-cellular compartment, implying that the stable adduct formed between TG2 and this peptidic inhibitor is susceptible to proteolytic clearance from the lysosome.
Recognition of TG2 by α2M:
TG2 activity is regulated by multiple allosteric mechanisms32,33. Most notably, while binding of multiple Ca2+ ions is required for transamidation or deamidation activity34,35, enzymatic activity is fully inhibited by either guanine nucleotide binding or the reversible formation of an allosteric C370-C371 disulfide bond36. Independently, X-ray crystallographic analysis has identified at least two markedly distinct conformational states of the 78 kDa protein – a “closed” GTP-bound form and an “open” state revealed through inactivation of the enzyme with DP3-324. Whereas the latter state allowed direct visualization of the C370-C371 disulfide bond, this bond was reduced in the GTP-bound state. A parsimonious model for TG2 catalysis assumes that the active enzyme is in the open state or a closely related conformation, although limitations of this model have been noted37.
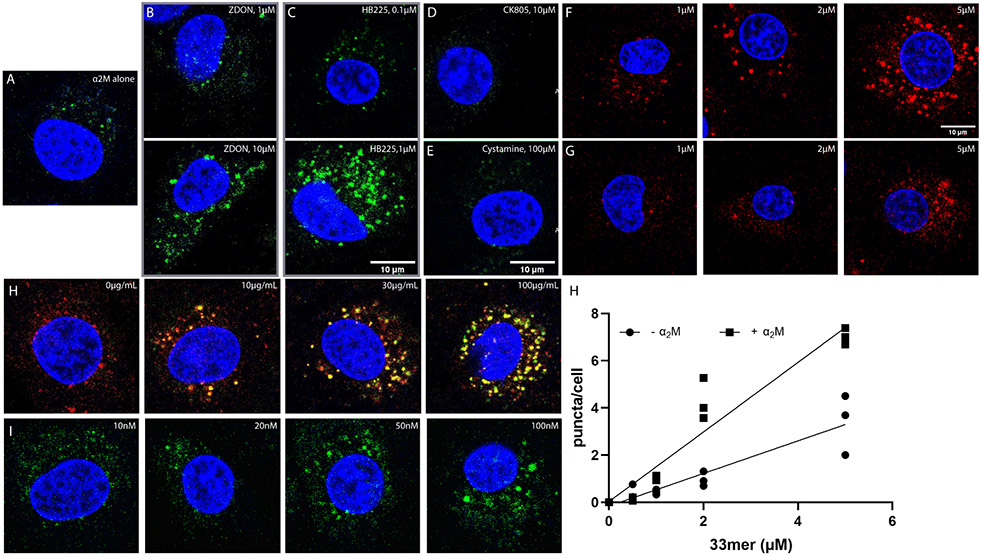
To identify the conformational requirements for high-affinity recognition of TG2 by α2M, fluorescently labeled α2M was added to NRK cell cultures in the presence of a representative set of (unlabeled) TG2 inhibitors whose biochemical mechanisms have been previously analyzed in our laboratory24. As shown in Fig. 3A, in the absence of any exogenous TG2 probe, labeled α2M was only internalized as small puncta, analogous to those observed with HB258 (Fig. 2B). In contrast, both HB225, and Z-DON-OMe (6, a commercially available weaker analog of DP3-3; Scheme 1A) promoted dose-dependent formation of larger α2M-labeled puncta. As expected, a higher concentration of Z-DON-OMe was required to elicit this behavior (Fig. 3B versus Fig. 3C), consistent with its lower inhibitory potency against TG2. Together, these observations suggested that TG2 recognition by α2M requires active site occupancy. Two additional small molecule probes were evaluated. First, CK805 (7, Scheme 1A) is a non-peptidic irreversible inhibitor of TG225. Notwithstanding its ability to covalently bind to the active site C277 residue of the enzyme, it does not induce a crystallizable open conformation (unpublished results). Addition of CK805 to NRK cell cultures in conjunction with fluorescent α2M did not stimulate fluorophore internalization (Fig. 3D). Second, cystamine is a small molecule oxidant that inactivates TG2 by promoting C370-C371 disulfide bond formation even in the absence of active site occupancy36; it too was unable to promote rapid internalization of fluorescent α2M by itself (Fig. 3E). Together, our data suggest that α2M-promoted endocytosis requires active site occupancy by a substrate or inhibitor that can stabilize the structurally characterized open conformer of TG2.
Figure 3:
Dependence of α2M endocytosis on the mechanism of TG2 inhibition. (A) Fluorescent α2M (green) undergoes limited endocytosis in the absence of any exogenous TG2 probe; labeled α2M is predominantly internalized as small puncta comparable in size to the smaller puncta observed in Fig. 2. (B) Co-treatment with Z-DON-OMe shows a dose-dependent increase in the appearance of larger labeled puncta in the 1-10 μM concentration range of this TG2 inhibitor. (C) HB225 has an analogous, more pronounced effect, albeit at lower concentrations of the probe. Two unrelated TG2 inhibitors, CK805 (D, 10 μM) and cystamine (E, 100 μM) do not yield the larger puncta at saturating concentrations, although small α2M-labeled puncta are observed. In all samples, α2M was added at 100μg/mL concentrations. (F-G) Co-incubation of 100 μg/mL α2M causes increased uptake of a fluorescent analogue of the native 33mer gluten derived peptide (F) compared to its deamidated counterpart (G) which is not significantly internalized by NRK cells. (H) Increasing the concentrations of exogenous α2M in the presence of 1μM 33mer increases uptake of both the 33mer (fluorescently labeled with Sulfo-Cy5) and α2M. Under all conditions, co-localization of the two labeled probes appears to be restricted to the large puncta. (I) Co-incubation of 100 μg/mL fluorescently labeled α2M in the presence of increasing concentrations of exogenously added fibronectin results in a dose-dependence increase in the abundance of large but not small puncta. (J) Quantification of large 33mer-containing puncta in the presence (F) and absence of exogenously added α2M. For wide views of all panels in this Figure, see Fig. S3. Measurements done in triplicates (n=3) different wells. Blue staining is DAPI, green staining is α2M, and red staining is Cy5-33mer.
Direct biochemical evidence for ligand-dependent recognition of TG2 by α2M was obtained using purified recombinant human TG2 expressed in E. coli and α2M expressed recombinantly in mammalian cells, as detailed in the Materials and Methods section. In the presence of α2M, a decrease was measured in the kcat of TG2 for AC-PQLPF-NH2 (the substrate analog of HB225; 35 ± 1 min−1 versus 29 ± 1 min−1) but not CBz-QG (a commonly used albeit lower-affinity reference substrate; 21 ± 2 min−1 versus 21 ± 1 min−1), consistent with a non-competitive inhibition mechanism of TG2 by α2M (Fig. S4A). Whereas TG2-mediated activation of α2M does not require concomitant enzyme inhibition, its observation is indicative of physical interaction between the two proteins. Inhibition was abolished when truncated but catalytically active TG2 derivatives lacking the C-terminal β-barrel domain were assayed (Fig. S4B). Specifically, the kcat values of a derivative lacking the C-terminal β-barrel domain38 were 9 ± 1 min−1 and 8 ± 1 min−1 in the absence or presence, respectively, of α2M. Similarly, the kcat values of a derivative harboring the N-terminal and catalytic domains but lacking both β-barrel domains38 were 7 ± 0.2 min−1 and 7± 0.3 min−1 in the absence or presence, respectively, of α2M (Fig. S4C). Together, these findings support a mechanistic model in which α2M interacts directly with the C-terminal β-barrel domain of TG2 but only in the presence of a high-affinity substrate.
Endocytosis of antigenic gluten peptides via ternary complex formation:
Thus far, endocytosis of the TG2-α2M complex has exclusively been visualized using peptidic probes that irreversibly label the active site of TG2. However, in the context of CeD, gluten peptides undergo transient attachment to C277 via a thioester linkage that is subsequently hydrolyzed (Fig 1B). To investigate whether this transient enzyme-substrate complex can be recognized by α2M under physiologically re6levant conditions, NRK cells were co-incubated with fluorescent α2M and the aforementioned 33-residue gluten peptide (33mer) tagged with a Cy5 fluorophore. The native 33mer was taken up in a dose-dependent manner (Fig. 3F) whereas internalization of its deamidated counterpart was substantially less efficient (Figs. 3F, 3J), underscoring the importance of forming the thioester bond between TG2 and its substrate in this process. Increasing the concentration of fluorescently labeled α2M led to a corresponding increase in endocytosis of the 33mer peptide. An entirely analogous pattern of co-localized endocytosis was observed between these two fluorescent probes (Fig. 3I) as between α2M and HB230. Notably, while both probes underwent independent uptake as small puncta, their colocalization was restricted to the large puncta. Even more remarkably, the dose-dependent effect of the 33mer saturates at low micromolar concentrations, considerably below the KM of TG2 for this peptide7.
Fibronectin is generally considered as a prototypical extracellular substrate of TG239,40. We therefore sought to establish whether a ternary complex between fibronectin, TG2 and α2M could also be internalized analogously to the 33mer gluten peptide. As seen in Fig. 3H, endocytosis of extracellular fibronectin via this pathway implies that a range of high-affinity TG2 substrates can induce the association of α2M and TG2.
LRP-1 is responsible for receptor-mediated endocytosis of ternary complexes:
Low density lipoprotein (LDL) receptor-related protein 1 (LRP-1, a.k.a., α2M receptor or CD91), a member of the LDL receptor family, is responsible for receptor-mediated endocytosis of α2M. Although this receptor is expressed on the surface of a wide range of cell types within the body, α2M endocytosis by LRP-1 is only triggered when α2M undergoes a conformational change upon binding to protease or non-protease ligands41. We sought to establish whether endocytosis of the ternary α2M-TG2-peptide complex was mediated by LRP-1. Indeed, an earlier report showed that fibronectin binding to TG2 leads to its endocytosis through an LRP-1 mediated pathway; however, those investigators did not investigate the intermediacy of α2M in this process42. Verification of a receptor mediated endocytic pathway was first derived via the use of pharmacologic inhibitors of clathrin mediated endocytosis. In comparison to untreated NRK cells (Fig. 4A), cells treated with methyl-β-cyclodextrin (MβCD; Fig. 4B), Pitstop-2 (Fig. 4C) or Dyno-4a (Fig. 4D) showed strong inhibition of α2M and peptide colocalization as large endocytic puncta.
Figure 4:
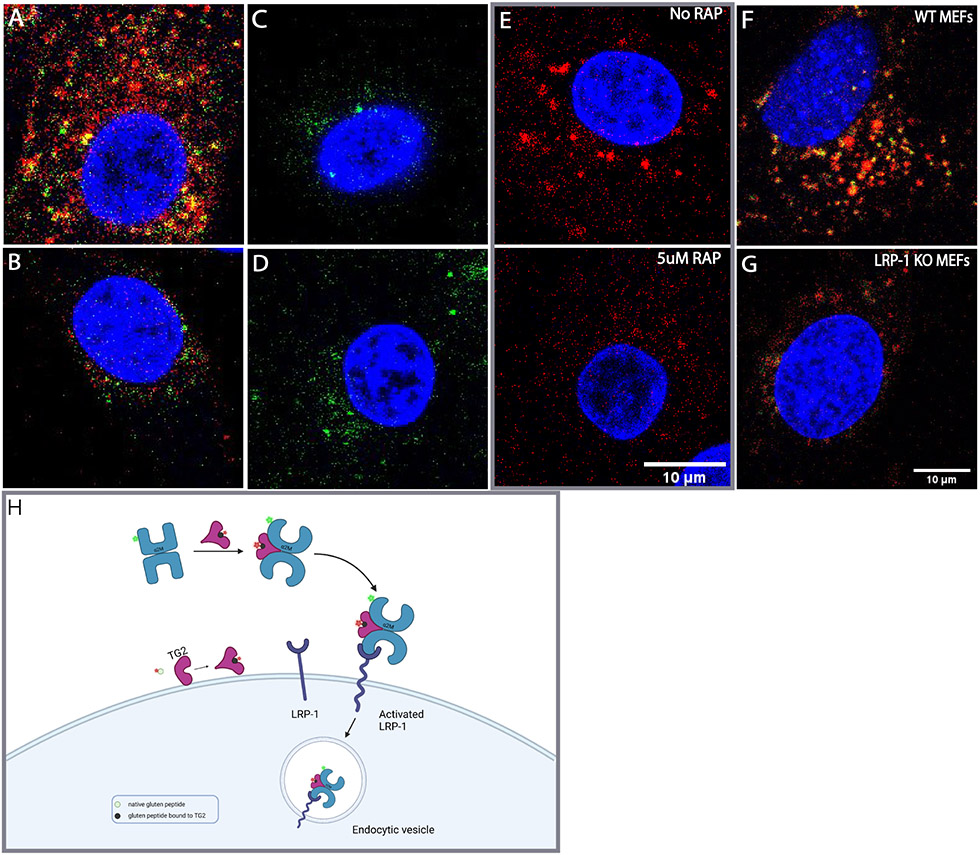
α2M and 33mer endocytosis is clathrin dependent and involves the LRP-1 receptor. (A) Endocytosis of α2M (green) and 33mer gluten peptide (red) by NRK cells. Inhibitors of clathrin mediated endocytosis including (B)12.5 mM MβCD, (C) 20 μM Dyno-4a, or (D) 25 μM Pitstop abrogate the appearance of large puncta harboring both fluorescently labeled probes. (E) The potent LRP-1 antagonist RAP inhibits the formation of large 33mer-containing puncta. (F) Wild-type MEFs also readily internalize HB230 and a2M in the presence of exogenous TRX and betamethasone. (G) Under the same conditions LRP-1 knock-out MEFs show markedly reduced uptake of either probe in the form of large puncta. α2M and HB230 were used at concentrations of 100 μg/mL and 10μM, respectively. For wide views of all panels in this Figure, see Fig. S5. (H) Schematic of mechanism of LRP-1 mediated endocytosis of the ternary gluten/TG2/α2M complex. The native peptide is shown in green, whereas the TG2/gluten intermediate is represented in black. Conjugated fluorophores are shown as green and red stars. Blue staining is DAPI, green staining is α2M, and red staining is Cy5-33mer.
To demonstrate that LRP-1 is the primary receptor for this pathway, a potent endogenous antagonist of α2M binding to LRP-1, receptor associated protein (RAP)43 was recombinantly expressed and purified, and NRK cells were treated with RAP (Fig. 4E) prior to treatment with Cy5-33mer and α2M. Stable RAP tightly binds LRP-1 at the same site as activated α2M and triggers receptor mediated endocytosis, however it does not dissociate from LRP-1 in the lysosomal compartment, thus inhibiting the recycling of the receptor43. RAP addition fully ablated the formation of large puncta, providing additional evidence that TG2 and its substrates undergo LRP-1 mediated endocytosis. Previous studies44 have shown that LDL-type receptors such as LRP-1 are preferentially sorted into late endosomes and lysosomes rather than early endosomes. This aligns with the localization of the TG2-substrate complex described in Fig. 2D, offering further evidence that the observed endocytosis is LRP-1 mediated and that the complex is directly trafficked to the lysosome.
Genetic evidence for the role of LRP-1 in this receptor-mediated endocytic process was obtained by comparing wild-type MEFs to their LRP-1 knockout counterparts. Whereas wild-type MEFs internalized the ternary complex generated by the addition of HB230 and α2M (Fig. 4F), knockout MEFs showed a marked defect in their ability to form large co-stained puncta under the same conditions (Fig. 4G). Overall, the following sequence of events can be proposed (Fig. 4H): TG2 binds its substrate at or near the cell surface. The resulting covalent complex binds to α2M, leading to LRP-1 mediated endocytosis of the ternary complex. Inside the endolyosomal compartment, the deamidated product of TG2 is released and made available for antigen presentation.
Relevance to CeD:
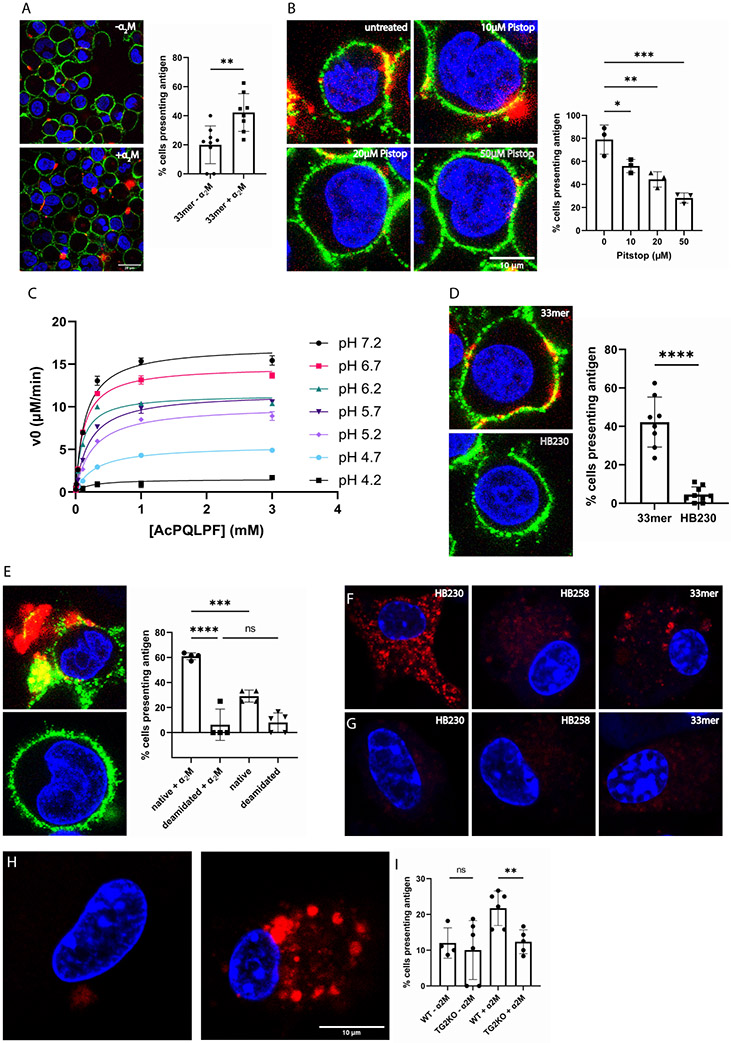
To test the relevance of this novel lysosomal uptake pathway in the context of CeD, an EBV immortalized human B-cell line (designated 9022) derived from an HLA-DQ2 homozygous individual was used45. In the presence of a low concentration (100 nM) of exogenously added recombinant human TG2, 9022 cells exposed to fluorescently labeled 33mer display this peptide in a class II MHC-restricted manner, as evidenced by a markedly clustered colocalization of HLA-DQ2 and the labeled 33mer on the surface of live cells (Fig. 5A). Cell surface abundance of the labeled 33mer is enhanced upon addition of exogenous α2M, implying that endocytosis precedes deamidative release of the gluten peptide from extracellular TG2. To confirm this, 9022 cells were treated with Pitstop for 20 min prior to addition of α2M and 33mer. As expected, inhibition of clathrin-mediated endocytosis resulted in a dose-dependent reduction of cell-surface 33mer labeling (Fig. 5B). Direct evidence for the ability of the TG2-peptide thioester adduct to undergo endosomal turnover was obtained by evaluating the pH-dependence of TG2 activity. Under steady-state conditions, the catalytic activity of TG2 is preserved upon acidification until at least pH 5 (Fig. 5C). The requirement of HLA-DQ2 for this dual surface labeling phenomenon was confirmed by verifying that HB230 did not localize to the cell surface under equivalent conditions (Fig. 5D). The potency of this pathway for gluten antigen presentation is evident from a comparison of labeling intensity of the surface of 9022 cells in response to addition of equivalent concentrations of labeled 33mer or its deamidated analog. Although the latter peptide has higher affinity for HLA-DQ246, stronger cell surface labeling was observed upon addition of the former peptide (Fig. 5E), highlighting the power of the LRP-1 pathway defined in this study to concentrate low levels of gluten antigens while simultaneously delivering them to HLA-DQ2.
Figure 5:
HLA-DQ2 expressing B-cells (9022) present gluten peptides on the cell surface in an α2M dependent manner. (A) In the presence of α2M (right) the number of cells displaying gluten peptides on their surface increases compared to treating with peptide alone (left). The bar graph shows quantification over 150 cells from 2-4 frames of 3-6 experimental replicates. (B) Inhibition of clathrin mediated endocytosis with the tool compound Pitstop decreases cell surface presentation of gluten peptides in a dose-dependent manner. (C) Steady-state kinetic analysis of TG2-catalyzed deamidation of Ac-PQLPF-NH2 in response to increasing acidification in the pH 4.2-7.2 range. Measurements done in triplicates. (D) The TG2 inhibitor HB230 is not recognized by HLA-DQ2, and therefore does not appear on the cell surface. (E) Under conditions where the native 33mer strongly labels the cell surface (top), its deamidated analog is less active (bottom) despite that the latter peptide has higher affinity for HLA-DQ2. In all experiments 9022 cells were treated with 100nM recombinant TG2. (F) Bone marrow derived dendritic cells (BMDCs) take up HB230 and 33mer, as previously described, whereas (G) no uptake is observed in BMDCs from TG2-knockout mice. (H) Macrophages from TG2- knockout mice also do not internalize 33mer (left) whereas macrophages from wild-type mice show robust uptake in the presence of α2M (right). (I) Quantification of 33mer uptake in wild-type and TG2-knockout bone marrow derived macrophages. Measurements done in triplicates. For wide views of all panels in this Figure, see Fig. S6. Blue staining is DAPI, green staining is HLA-DQ2, and red staining is Cy5-33mer or HB230 as indicated. In all bar graphs data are represented as mean ± SD.
To verify the physiological relevance of the LRP-1 pathway for the uptake of TG2 substrates by professional APCs, bone marrow-derived dendritic cells (BMDCs) were isolated from wild-type (Fig. 5F) or TG2-knockout (Fig. 5G) mice. Both HB230 and Cy5-33mer were readily taken up by wild-type BMDCs whereas neither probe was taken up by TG2-knockout BMDCs. Furthermore, significant cellular uptake of HB258 was not observed in either BMDC culture. Similarly, bone marrow derived macrophages (BMM) also robustly internalized the 33mer in the presence, but not absence, of α2M. Finally, TG2-knockout BMM did not show significant uptake of the 33mer (Fig. 5H-I). These findings are consistent with the observed elevated expression of the lrp1 gene in mouse dendritic cells and macrophages, but not B cells (Fig. S6).
Discussion
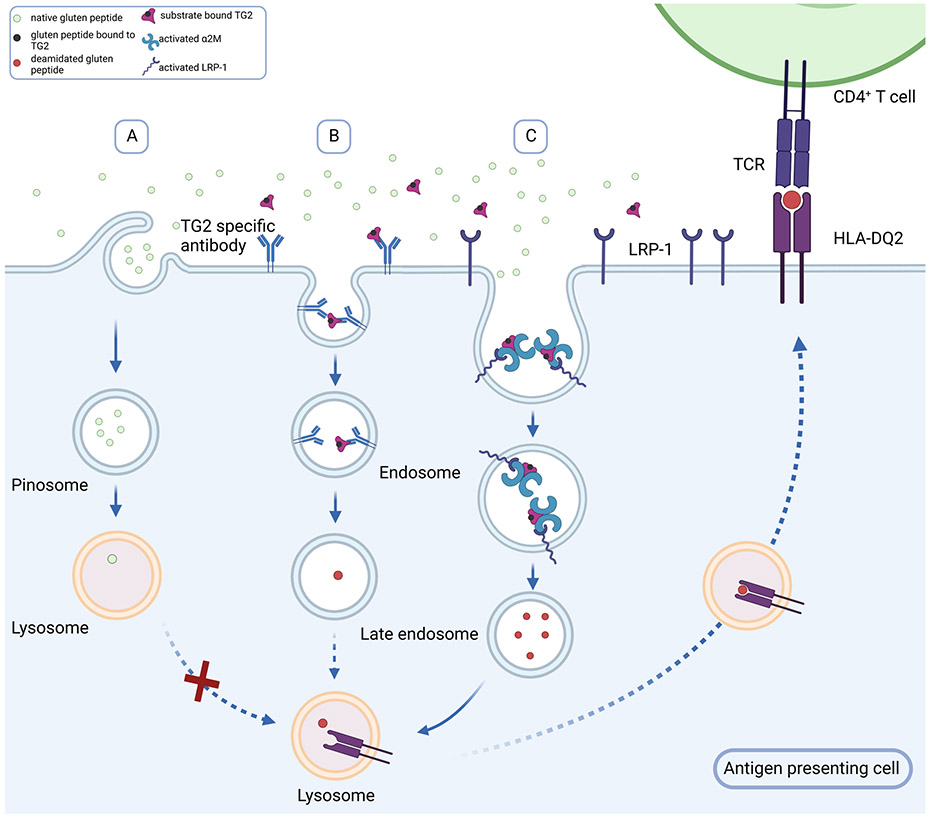
Celiac disease (CeD) is a widespread autoimmune disorder in which the primary environmental trigger, dietary gluten, supplies antigens that elicit an inflammatory response from disease specific CD4+ T cells. Two additional human proteins play essential roles in the pathogenic cascade5. Extracellular transglutaminase 2 (TG2) catalyzes sequence-specific deamidation of one or more Gln residues in antigenic gluten peptides, while HLA-DQ2 (or -DQ8) binds tightly to the resulting acidic (Glu-harboring) peptides thereby enabling their presentation to T cell receptors. While the biochemical logic of these enzyme-substrate and ligand-receptor interactions are well understood, their physiological context remains to be defined. Specifically, given that small amounts of dietary gluten can trigger inflammation in CeD patients, a non-specific pinocytotic mechanism for antigen uptake and presentation (Fig. 6A) is unlikely to achieve the requisite threshold for inducing pathogenic CD4 T cell responses.
Figure 6:
Alternative mechanisms for gluten antigen uptake and presentation in APC. Given that small amounts of dietary gluten can induce inflammatory T cell activity in CeD patients, the typical concentrations of antigenic deamidated gluten peptides in the extracellular matrix is expected to be low. (A) While pinocytosis may lead to some non-specific uptake of the native gluten peptides, it is unlikely to result in deamidated gluten peptide uptake and presentation above a requisite threshold. (B) A prevalent model for gluten antigen presentation to CeD-specific inflammatory T cells invokes a role for TG2-specific autoreactive B cells as the principal type of antigen presenting cell. In this model B cells with autoreactive receptors recognize the acyl-enzyme intermediate formed between TG2 and an antigenic gluten peptide. This intermediate dissociates upon undergoing endocytosis, leading to lysosomal delivery and class II MHC presentation of deamidated gluten peptides by autoreactive B cells. (C) Our studies have revealed a new mechanism for gluten antigen presentation wherein the ternary TG2-gluten-α2M complex undergoes potent LRP-1 dependent endocytosis. Subsequent endosomal release of the deamidated peptide also leads to class II MHC presentation; however, this pathway can operate in other professional antigen presenting cells such as dendritic cells and macrophages.
The prevalent model for gluten antigen presentation to CeD-specific inflammatory T cells invokes a role for TG2-specific autoreactive B cells as the principal type of antigen presenting cell (APC)47 (Fig. 6B). The elegance of this mechanism stems from three features: (i) the ability of these cells to take up TG2-bound gluten peptides via high-affinity interaction with their B cell receptors; (ii) the ability of internalized gluten peptides to undergo deamidation (via the second half-reaction catalyzed by TG2; Fig. 1A) and be presented to disease-specific T cell receptors in a DQ2/8-restricted manner; and (iii) the ability of these mutually reinforcing B cell/T cell interactions to induce B cell maturation into plasmablasts capable of secreting anti-TG2 autoantibodies.
A major limitation of this model for gluten-mediated inflammation is that it cannot be readily extrapolated to professional APCs lacking a B cell receptor. To that end our findings reported in this study shine light on an unprecedented and potent pathway for gluten antigen presentation that likely operates in dendritic cells and/or macrophages of CeD patients (Fig. 6C). Because this pathway involves recognition of some (but not all) TG2-gluten complexes by α2-macroglobulin (α2M), it selects the corresponding peptides as preferred sources of T cell antigens. In turn, the ternary complex undergoes LRP-1 mediated endocytosis. Two features of our proposed mechanism are especially noteworthy.
First, because LRP-1 is unable to engage free TG2 or α2M, a vast fraction of each ubiquitous extracellular protein remains pathogenically inert. As such, this is a gluten-induced “gain-of-function” mechanism with respect to both TG2 and α2M. Our data (Fig. S4) suggests that the C-terminal β-barrel domain of TG2 plays a critical role in this interaction, although the domain of α2M on which gluten-bound TG2 docks remains to be determined in further studies. Interestingly, others have reported that TG2 can bind to LRP-1 without the intermediacy of α2M 42. However, due to the abundance of α2M in serum-containing cell culture media, the functional implications of constitutive TG2-LRP1 interaction are unclear. Direct biochemical analyses are warranted to compare the physical and functional characteristics of gluten peptide-induced TG2- α2M-LRP1 interactions with those of the interaction of LRP1 with unliganded TG2.
Second, because LRP-1 is expressed on many but not all cells in the human body and is highly expressed in certain populations of macrophages and dendritic cells (Fig. S7), this pathway has the potential to internalize antigenic gluten peptides in APCs endowed with both LRP-1 and catalytically active TG2 on their surfaces. Indeed, our fluorescent molecular probe HB230 offers a direct glimpse into the potency of this receptor-mediated endocytosis pathway for antigen uptake relative to constitutive micropinocytosis, which engulfs soluble extracellular macromolecules through small vesicles and presumably corresponds to the small puncta in Fig. 2. Further definition of cell types in the celiac and control intestine that display robust surface TG2 activity as well as LRP-1 mediated endocytosis activity is expected to be important for fully understanding the implications of this pathway in the onset and persistence of celiac disease. Other examples of potent receptor-mediated endocytic processes for antigen uptake by professional APCs include those mediated by C-type lectin receptors of dendritic cells such as the mannose receptor48,49, langerin50, and DEC20551.
The evolutionary logic of this new receptor-mediated endocytic pathway for antigen presentation remains to be explored. Previous studies have shown the role of LRP-1 in complex with receptor tyrosine kinase AXL and Ran-binding protein 9 in cross presentation by promoting efforocytosis52. Here we show that by taking advantage of forming a complex with two other ubiquitous extracellular proteins TG2 and α2M, LRP-1 offers a covalent ligation strategy for a variety of self and non-self substrates of TG2 to be removed from the extracellular environment of a range of cells. In the case of gluten peptides in CeD patients, the TG2 substrate then progresses to be presented to T cells in a class II MHC-restricted manner. We speculate that the evolutionary origins of this pathway lie in processes that play a critical role in extracellular matrix remodeling, but that it has been coopted for antigen presentation by LRP-1-expressing APCs. Interestingly, extracellular proteins associated with neurodegenerative diseases have been identified as TG2 substrates53. For example, the microtubule-associated protein tau, which has a central role in several forms of dementias known as taupathies54, is a TG2 substrate55 and has also been shown to undergo LRP-1-dependent endocytosis56. As such, the pathogenic role of this pathway may extend beyond CeD.
Limitations of the study:
While the kinetic data presented here supports an allosteric interaction between alpha-2-macroglobulin (α2M) and transglutaminase-2 (TG2), our data falls short of providing physical evidence for direct binding between these two proteins. Preliminary efforts to detect this protein-protein interaction through bio-layer interferometry have proven unsuccessful, and further efforts are warranted using complementary methods.
Significance:
While the environmental and genetic factors necessary for celiac disease pathogenesis are well defined, the mechanisms for gluten antigen processing have not been well characterized. In order to reach a pathogenic threshold, gluten peptides must be concentrated in the lysosome prior to DQ2 restricted MHC-II presentation. Here we describe a potent mechanism for lysosomal concentration of deamidated gluten peptides based on highly specific protein-protein interactions between three widely expressed proteins, transglutaminase-2, alpha-2 macroglobulin and LRP-1. Since this pathway is active in many cell types, our work invokes a pathogenic role for dendritic cells and macrophages as antigen presenting cells in the context of celiac disease. This pathway also leads to efficient lysosomal clearance of transglutaminase-2 substrates, several of which are disease associated, pointing toward a role for transglutaminase-2 in the pathogenesis of diseases beyond celiac disease.
STAR METHODS
Resource availability
Lead contact
Further information and requests for resources and reagents should be directed to and will be fulfilled by the lead contact, Chaitan Khosla (khosla@stanford.edu).
Materials availability
All of the materials that support the conclusions relevant to this manuscript are available upon reasonable request from the lead contact without restriction.
Data and code availability:
All data reported in this paper will be shared by the lead contact upon request. This paper does not include original code.
Any additional information required to reanalyze the data reported in this paper is available from the lead contact upon request.
Experimental model and subject details
Cells and reagents
Cell lines:
NRK (ATCC®, CRL-6509™). LRP-1 KO MEF (ATCC®, CRL-2216™). The sex of these cell lines is not listed by the vendor. 9022 cells are part of the reference table generated in the Tenth International Histocompatibility Workshop, and were generously shared with us by the Sollid lab at the University of Oslo. The were derived from a male patient.
Media:
High Glucose DMEM (Corning®, 10-017-CV), RPMI 1640 (Corning®, 10-040-CV), Expi293™ Expression Medium (Gibco™, A1435101), OptiMEM (Gibco™, 31985070).
Fetal Bovine Serum:
BenchMark™ Fetal Bovine Serum (GeminiBio™, 100-106-500)
Cell culture antibiotics:
Penicillin-Streptomycin (Corning®, 30-002-CI)
Assay materials:
half area 96-well plates (Greiner, 675001)
Enzymes and proteins:
Alpha-2 Macroglobulin (Athens Research and technology, 16-16-012013), Glutamate Dehydrogenase (BBI solutions), chicken egg-white lysozyme (Thermo-Fischer, 12650-88-3).
Chemicals:
All chemicals used are from Sigma-Aldrich or TCI with the following exceptions: Buffer components and LB granulated media (Fisher). IPTG (Gold Bio, I12481), Ni-NTA resin (Qiagen, 30210), HiTrap Q HP anion exchange columns (GE Healthcare, 17115301), Sulfo-Cy5 (Lumiprobe, 63320), Alexa Fluor™ 555-NHS Ester (Invitrogen™, A20009), SuperDex 200 SEC Column (Cytiva, 28-9909-44), ExpiFectamine™ 293 Transfection Kit (Gibco™, A14525), HiTrap Chelating HP column (Cytiva, 17040801), Sephacryl S-400-HR (17060910).
Method details
Synthesis of inhibitors:
(Abbreviated synthesis route in Scheme 1B).
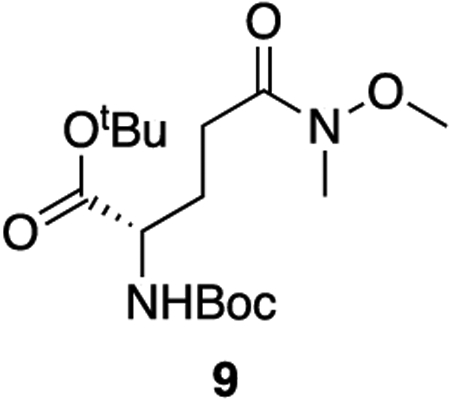
9: To a solution of boc-L-glutamic acid 1-tert-butyl ester (2.565 g, 8.46 mmol, 1 equiv) in dry DCM (0.3 M) was added N-methyl morpholine (2.32 mL, 21.1 mmol, 2.5 equiv). The resulting solution was cooled to 0°C and isobutyl chloroformate (1.37 mL, 10.6 mmol, 1.25 equiv) was added dropwise. After 30 minutes, N,O-dimethylhydroxylamine hydrochloride (989 mg, 10.1 mmol, 1.2 equiv) was added in a single addition. The solution was allowed to come to room temperature and stir for 3 hours. The reaction was diluted with DCM and quenched with 1 M HCl. The aqueous phase was extracted three times with DCM and the combined organic phase was washed once with saturated NaHCO3 and dried over sodium sulfate. The solvent was removed en vacuo and the crude product was purified with column chromatography (45% ethyl acetate : hexanes, Rf = 0.40) to provide 9 as a colorless oil (2.74 g, 93% yield).
1H NMR (400 MHz, CDCl3) δ 5.19 (d, J = 8.3 Hz, 1H), 4.10 (h, J = 4.5 Hz, 1H), 3.60 (s, 3H), 3.09 (s, 3H), 2.54 – 2.34 (m, 2H), 2.13 – 2.00 (m, 1H), 1.85 (dtd, J = 14.2, 8.8, 6.0 Hz, 1H), 1.38 (s, 9H), 1.36 (s, 9H).
13C NMR (101 MHz, CDCl3) δ 173.50, 171.48, 155.41, 81.72, 79.38, 61.10, 53.68, 32.13, 28.22, 27.95, 27.88, 27.42.
HRMS (ESI) (m/z): calculated for C16H30N2O6 [M+H]+: 347.2177, found: 347.2181
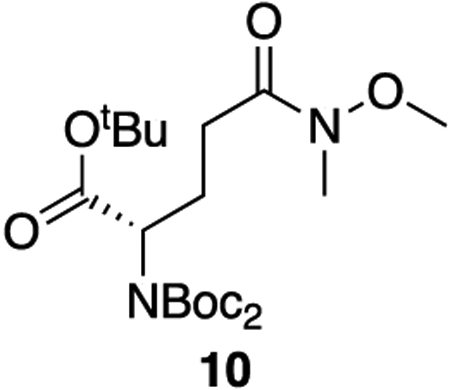
10: To a solution of 9 (2.74 g, 7.90 mmol, 1 equiv) and DMAP (97 mg, 0.79 mmol, 0.1 equiv) in dry DCM (0.4 M) was added triethylamine (22 mL, 158 mmol, 20 equiv) and di-tert-butyl dicarbonate (9.1 mL, 39.5 mmol, 5 equiv). The solution was brought to reflux and allowed to stir for 3 hours. The mixture was cooled to room temperature, diluted with DCM, and quenched with 1 M HCl. The aqueous phase was extracted three times with DCM. The combined organics were washed twice with 1 M HCl, dried over sodium sulfate, and concentrated en vacuo. The crude product was purified by column chromatography (35% ethyl acetate : hexanes, Rf = 0.50) to provide 10 as a colorless oil (3.43 g, 97% yield).
1H NMR (400 MHz, CDCl3) δ 4.83 – 4.67 (m, 1H), 3.62 (s, 3H), 3.12 (s, 3H), 2.57 – 2.33 (m, 3H), 2.17 – 2.02 (m, 1H), 1.46 (s, 18H), 1.40 (s, 9H).
13C NMR (101 MHz, CDCl3) δ 173.62, 169.41, 152.30, 82.76, 81.19, 61.14, 58.40, 32.20, 28.61, 27.99, 27.97, 24.36.
HRMS (ESI) (m/z): calculated for C21H38N2O8 [M+Na]+: 469.2520, found: 469.2522
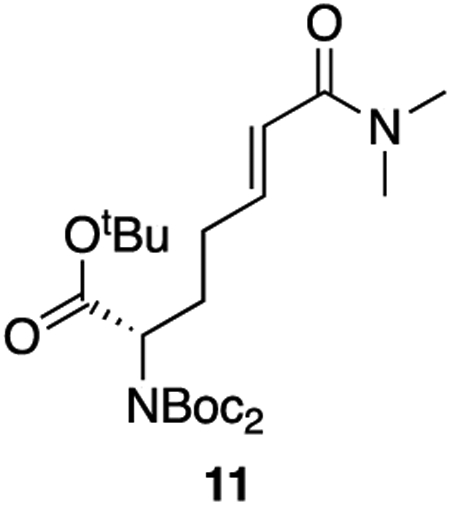
11: To a solution of 10 (3.43 g, 7.68 mmol, 1 equiv) in dry THF (0.25 M) cooled to −78°C was added DIBAL-H (1 M in hexanes, 8.45 mL, 8.45 mmol, 1.1 equiv) dropwise. The solution was allowed to warm to room temperature and stir for 1 hour. The reaction was quenched with 0.35 M NaHSO4 and the aqueous phase was extracted twice with diethyl ether. The combined organics were washed twice with 1 N HCl, twice with saturated NaHCO3, and twice with saturated NaCl. The solution was then dried over sodium sulfate and concentrated en vacuo to afford the crude aldehyde (2.93 g, 98% crude yield) which was used in the subsequent step without further purification.
To a solution of A (2.02 g, 8.04 mmol, 1.05 equiv) in dry THF (0.4 M) was added potassium tert-butoxide (1 M in THF, 7.7 mL, 7.7 mmol, 1 equiv). The base was allowed to react for 30 minutes at room temperature after which the aldehyde dissolved in THF (20 mL) was added to the stirring ylide dropwise. The solution was allowed to stir for 1.5 hours at room temperature. The reaction was diluted with ethyl acetate and quenched with saturated NH4Cl. The aqueous phase was extracted twice with ethyl acetate and the combined organics were washed once with saturated NaCl, dried over sodium sulfate, and concentrated en vacuo. The crude product was purified by column chromatography (60% ethyl acetate : hexanes, Rf = 0.30) to provide the product as a colorless oil (2.74 g, 78% yield).
1H NMR (400 MHz, CDCl3) δ 6.83 (dt, J = 15.1, 6.6 Hz, 1H), 6.26 (dt, J = 15.1, 1.4 Hz, 1H), 4.75 – 4.65 (m, 1H), 3.04 (s, 3H), 2.97 (s, 3H), 2.29 – 2.13 (m, 3H), 2.07 – 1.94 (m, 1H), 1.48 (s, 18H), 1.42 (s, 9H).
13C NMR (101 MHz, CDCl3) δ 169.60, 166.73, 152.49, 144.52, 121.06, 82.93, 81.39, 58.39, 37.35, 35.70, 29.31, 28.08, 28.06, 27.98.
HRMS (ESI) (m/z): calculated for C23H40N2O7 [M+Na]+: 479.2728, found: 479.2749
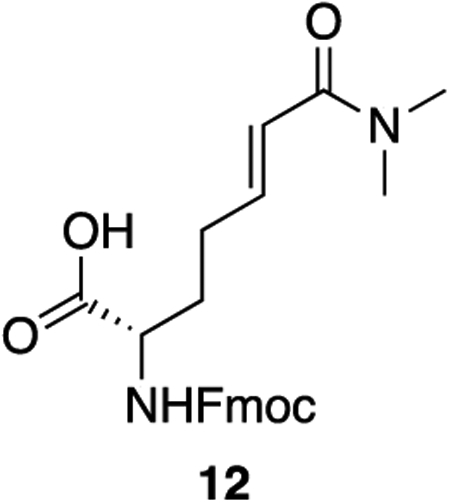
12: To 11 (495 mg, 1.08 mmol, 1 equiv) was added 10 mL of a 1:1 mixture of trifluoroacetic acid and DCM. The solution was allowed to stir at room temperature for 2 hours, after which the solvents were removed en vacuo. The resulting orange oil was taken up again in 10 mL of a 1:1 mixture of trifluoroacetic acid and DCM and allowed to stir for 2 hours more at room temperature. After 4 hours total, the solvents were removed en vacuo and the crude oil was taken up in 10 mL of DCM. The solution was cooled to 0°C after which DIPEA (755 uL, 4.34 mmol, 4 equiv) was added in a single addition. To the solution was added fmoc-N-hydroxysuccinimide ester (731 mg, 2.17 mmol, 2 equiv). The solution was warmed to room temperature and allowed to stir for 30 minutes. The reaction was quenched with 1 M HCl and extracted three times with DCM. The combined organics were washed twice with 1 M HCl and once with saturated NaCl, dried over sodium sulfate, and concentrated en vacuo. The crude product was purified by column chromatography (5% methanol : DCM + 1% acetic acid, Rf = 0.32) to provide 12 as a white powder (403 mg, 88% yield).
1H NMR (500 MHz, DMSO) δ 12.65 (s, 1H), 7.90 (d, J = 7.5 Hz, 2H), 7.76 – 7.70 (m, 2H), 7.68 (d, J = 8.1 Hz, 1H), 7.42 (t, J = 7.4 Hz, 2H), 7.33 (td, J = 7.5, 1.2 Hz, 2H), 6.61 (dt, J = 15.1, 7.0 Hz, 1H), 6.38 (dt, J = 15.0, 1.5 Hz, 1H), 4.32 – 4.27 (m, 2H), 4.23 (t, J = 7.0 Hz, 1H), 3.94 (ddd, J = 9.9, 8.1, 4.4 Hz, 1H), 2.99 (s, 3H), 2.84 (s, 3H), 2.28 – 2.18 (m, 2H), 1.90 – 1.70 (m, 2H).
13C NMR (126 MHz, DMSO) δ 173.73, 165.32, 156.14, 143.85, 143.77, 143.22, 140.73, 140.71, 127.64, 127.07, 125.26, 121.73, 120.13, 65.59, 53.09, 46.66, 36.66, 35.03, 29.56, 28.17.
HRMS (ESI) (m/z): calculated for C24H26N2O5 [M+H]+: 423.1914, found: 423.1921
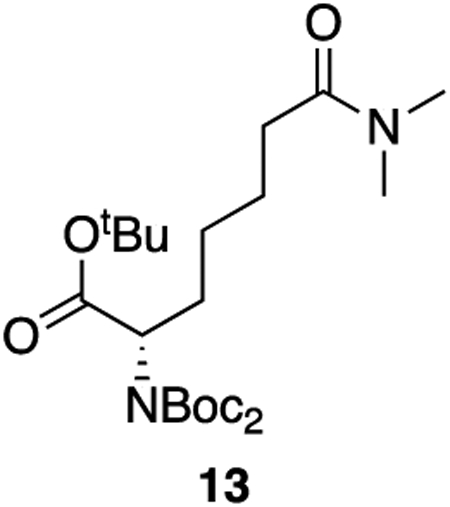
13: A solution of 11 (237 mg, 0.52 mmol, 1 equiv) and cobalt (II) chloride hexahydrate in dry methanol (0.10 M) was cooled to 0°C. To the solution was added solid sodium borohydride (98 mg, 2.60 mmol, 5 equiv) in three additions. The solution was allowed to come to room temperature and stir for 30 minutes. The reaction was diluted with DCM and quenched with 1 N HCl. The aqueous layer was extracted three times with DCM and the combined organics were dried over sodium sulfate and concentrated. The crude product was purified by column chromatography (60% ethyl acetate : hexanes, Rf = 0.35) to afford 13 as a colorless oil (229 mg, 96% yield).
1H NMR (400 MHz, CDCl3) δ 4.68 (dd, J = 9.6, 5.2 Hz, 1H), 2.97 (s, 3H), 2.91 (s, 3H), 2.28 (t, J = 7.8 Hz, 2H), 2.12 – 1.98 (m, 1H), 1.84 (dtd, J = 14.2, 9.5, 6.4 Hz, 1H), 1.73 – 1.57 (m, 2H), 1.48 (s, 18H), 1.42 (s, 9H), 1.40 – 1.32 (m, 2H).
13C NMR (101 MHz, CDCl3) δ 172.94, 169.95, 152.53, 82.75, 81.15, 58.85, 37.31, 35.39, 33.26, 29.08, 28.07, 28.00, 26.36, 24.92.
HRMS (ESI) (m/z): calculated for C23H42N2O7 [M+Na]+: 481.2884, found: 481.2908
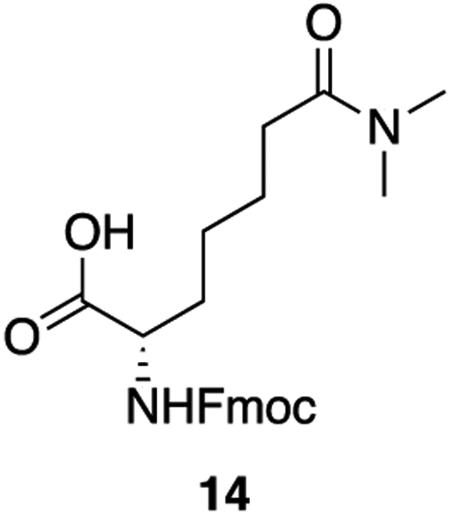
14: To 13 (300 mg, 0.65 mmol, 1 equiv) was added 6 mL of a 1:1 mixture of trifluoroacetic acid and DCM. The solution was allowed to stir at room temperature for 2 hours, after which the solvents were removed en vacuo. The resulting orange oil was taken up again in 6 mL of a 1:1 mixture of trifluoroacetic acid and DCM and allowed to stir for 2 hours more at room temperature. After 4 hours total, the solvents were removed en vacuo and the crude oil was taken up in 6 mL of DCM. The solution was cooled to 0°C after which DIPEA (420 uL, 2.40 mmol, 4 equiv) was added in a single addition. To the solution was added fmoc-N-hydroxysuccinimide ester (441 mg, 1.31 mmol, 2 equiv). The solution was warmed to room temperature and allowed to stir for 30 minutes. The reaction was quenched with 1 M HCl and extracted three times with DCM. The combined organics were washed twice with 1 M HCl and once with saturated NaCl, dried over sodium sulfate, and concentrated en vacuo. The crude product was purified by column chromatography (5% methanol : DCM + 1% acetic acid, Rf = 0.34) to provide 14 as a white powder (261 mg, 94% yield).
1H NMR (500 MHz, DMSO) δ 12.57 (s, 1H), 7.89 (d, J = 7.6 Hz, 2H), 7.73 (d, J = 7.8 Hz, 2H), 7.63 (d, J = 8.2 Hz, 1H), 7.42 (t, J = 7.5 Hz, 2H), 7.33 (q, J = 7.1 Hz, 2H), 4.33 – 4.25 (m, 2H), 4.25 – 4.16 (m, 1H), 3.93 (ddd, J = 9.6, 8.2, 4.8 Hz, 1H), 2.93 (s, 3H), 2.79 (s, 3H), 2.26 (t, J = 7.5 Hz, 2H), 1.77 – 1.66 (m, 1H), 1.61 (dtd, J = 14.5, 9.5, 5.1 Hz, 1H), 1.55 – 1.41 (m, 2H), 1.41 – 1.27 (m, 2H).
13C NMR (126 MHz, DMSO) δ 174.00, 171.79, 156.17, 143.84, 140.73, 127.64, 127.07, 125.31, 120.12, 65.60, 53.78, 46.67, 36.68, 34.77, 32.22, 30.69, 25.48, 24.22.
HRMS (ESI) (m/z): calculated for C23H42N2O7 [M+H]+: 425.2071 found: 425.2078
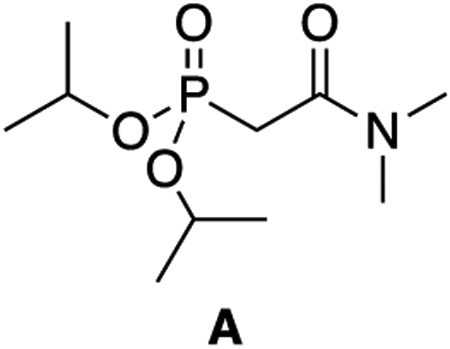
A: A 50 mL round-bottom flask was charged with triisopropyl phosphite (3.19 mL, 13.9 mmol, 1 equiv) and 2-bromo-N,N-dimethyl acetamide (1.50 mL, 13.9 mmol, 1 equiv). The flask was affixed with a condenser and heated in an oil bath to 130°C for 22 hours. The reaction was cooled to room temperature and the crude product was purified directly by column chromatography (4% MeOH:DCM, Rf = 0.30) to give A as a pale yellow oil (2.34 g, 66% yield).
1H NMR (500 MHz, CDCl3) δ 4.64 (dhept, J = 7.9, 6.2 Hz, 2H), 3.02 (s, 3H), 2.90 (d, J = 22.3 Hz, 2H), 2.86 (d, J = 1.5 Hz, 3H), 1.23 (dd, J = 6.3, 3.4 Hz, 12H).
13C NMR (126 MHz, CDCl3) δ 164.87 (d, J = 5.7 Hz), 71.23 (d, J = 6.8 Hz), 38.50, 35.69, 34.55 (d, J = 133.9 Hz), 23.95 (d, J = 4.0 Hz), 23.77 (d, J = 5.1 Hz).
31P NMR (202 MHz, CDCl3) δ 19.25 (tt, J = 22.2, 7.8 Hz).
HRMS (ESI) (m/z): calculated for C19H22NO4P [M+H]+: 252.1359 found: 252.1362
General Peptide Synthesis Protocol
Peptides were synthesized using standard Fmoc chemistry on a CSBio instrument. For peptides with C-terminal amides, Fmoc-Rink resin was used (CSBio), and for peptides with C-terminal acids, Wang resin with the appropriate C-terminal amino acid conjugated to it was used (Novabiochem). Synthesis was performed with 250 μmol of resin and 1 mmol of the Fmoc amino acids. Fmoc deprotection was carried out with 20% piperidine in DMF and coupling was performed using 1 mmol of HBTU over 1 hour at room temperature. N-terminal acetylation was performed with 11 mL of 7:2:2 DMF:acetic anhydride:DIPEA (v/v/v) overnight at room temperature. Resins were dried over vacuum for 2 hours before cleavage. Dry peptide resin was cleaved with 95% TFA, 2.5% H2O, 2.5% triisopropylsilane over 3 hours at room temperature. The cleavage cocktail was evaporated under a stream of nitrogen and the crude peptide was precipitated with cold diethyl ether. The precipitate was centrifuged (3500g for 4 minutes), diethyl ether was decanted, and the crude solid was triturated twice more with cold diethyl ether. The resulting white solid was lyophilized from H2O/ACN before purification with preparative RP-HPLC (A = H2O + 0.1% TFA, B = ACN + 0.1% TFA). The identity and purity of the fractions were confirmed by LCMS analysis and those corresponding to the peptide of interested were pooled and lyophilized.
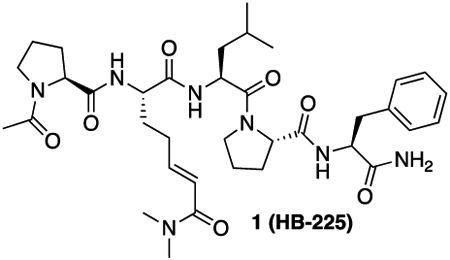
1 (HB-225): 1 was synthesized using the general peptide synthesis protocol described above using Fmoc-Pro-OH, Fmoc-Leu-OH, Fmoc-Phe-OH, and 12. The crude peptide was purified by RP-HPLC (C18 preparative column, 35% B isocratic over 30 minutes) to yield a white solid (130 mg, 75% yield).
HRMS (ESI) (m/z): calculated for C36H53N7O7 [M+H]+: 696.4079 found: 696.4099
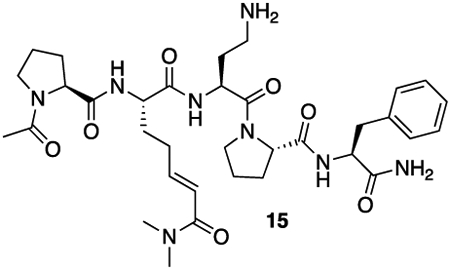
15: 15 was synthesized using the general peptide synthesis protocol described above using Fmoc-Pro-OH, Fmoc-Dab(Boc)-OH, Fmoc-Phe-OH, and 12. After cleavage, the material was taken on to the next step without further purification.
HRMS (ESI) (m/z): calculated for C34H50N8O7 [M+H]+: 683.3875 found: 683.3890
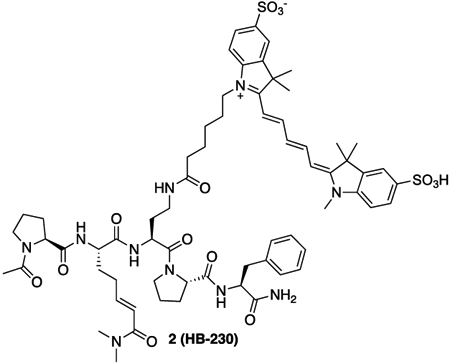
2 (HB-230): 15 (7.5 mg, 11.0 μmol, 1 equiv) was dissolved in 1 mL of 100 mM NaHCO3 buffer (pH = 8.4). Solid SulfoCy5-N-hydroxysuccinimide ester (16.2 mg, 22.0 μmol, 2 equiv) was added. The solution was protected from light and allowed to stand overnight at room temperature. After 18 hours, the crude mixture was lyophilized. The resulting crude solid was purified by RP-HPLC (C18 preparative column, 25% B to 40% B over 30 minutes). The appropriate fractions were combined and lyophilized to yield a blue solid (7.0 mg, 49% yield).
HRMS (ESI) (m/z): calculated for C66H86N10O14S2 [M+2H]2+: 654.2956 found: 654.2970
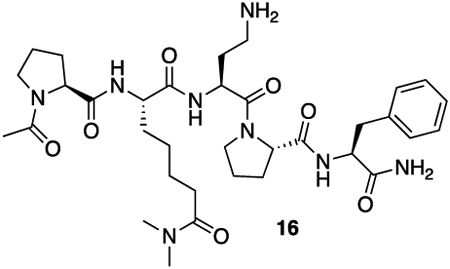
16: HB-02-057 was synthesized using the general peptide synthesis protocol described above using Fmoc-Pro-OH, Fmoc-Dab(Boc)-OH, Fmoc-Phe-OH, and 14. The crude peptide was purified by RP-HPLC (C18 preparative column, 25% B isocratic over 30 minutes) to yield a white solid (70 mg, 41% yield).
HRMS (ESI) (m/z): calculated for C34H52N8O7 [M+H]+: 685.4032 found: 685.4055
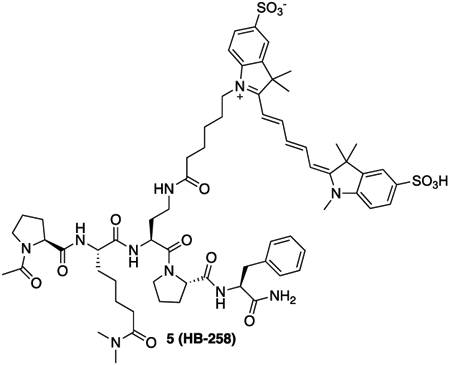
5 (HB-258): 16 (9.4 mg, 13.7 μmol, 1 equiv) was dissolved in 1 mL of 100 mM NaHCO3 buffer (pH = 8.4). Solid SulfoCy5-N-hydroxysuccinimide ester (20.3 mg, 27.4 μmol, 2 equiv) was added. The solution was protected from light and allowed to stand overnight at room temperature. After 18 hours, the crude mixture was lyophilized. The resulting crude solid was taken up purified by RP-HPLC (C18 preparative column, 25% B to 40% B over 30 minutes). The appropriate fractions were combined and lyophilized to yield a blue solid (9.0 mg, 50% yield).
HRMS (ESI) (m/z): calculated for C66H88N10O14S2 [M+2H]2+: 655.3034 found: 655.3039
Native-33mer (H-LQLQPFPQPQLPYPQPQLPYPQPQLPYPQPQPF-NH2):
The native-33mer peptide was synthesized according to the general peptide synthesis protocol above with one modification; the coupling steps were performed at 60°C for 15 minutes (rather than room temperature for 1 hour).
HRMS (ESI) (m/z): calculated for C190H274N44O46 [M+3H]3+: 1304.3577 found: 1304.3590
Deamidated-33mer (H-LQLQPFPQPELPYPQPELPYPQPELPYPQPQPF-NH2):
The deamidated-33mer peptide was synthesized according to the general peptide synthesis protocol above with one modification; the coupling steps were performed at 60°C for 15 minutes (rather than room temperature for 1 hour).
HRMS (ESI) (m/z): calculated for C190H274N44O46 [M+3H]3+: 1305.3471 found: 1305.3443
SulfoCy5-native-33mer:
Native-33mer peptide (H-LQLQPFPQPQLPYPQPQLPYPQPQLPYPQPQPF-Rink resin) bound to Rink resin (150 mg, 20 mmol) was swollen in 10 mL of a 1:1 mixture of DMF and DCM for 15 minutes (note: all tyrosine residues are protected as their tert-butyl ethers and all glutamine residues are protected as their trityl amides before cleavage). Meanwhile, SulfoCy5-carboxylic acid (27.2 mg, 40 mmol, 2 equiv) and HBTU (15.2 mg, 40 mmol, 2 equiv) were taken up in 2 mL of 1:1 DMF:DMSO and allowed to stand, protected from light, at room temperature for 15 minutes. The swelling solution was drained from the resin and the activated SulfoCy5 carboxylic acid was added on top. Immediately after, DIPEA (17.4 mL, 100 mmol, 5 equiv) was added to the resin slurry. The resin was allowed to rock, protected from light, at room temperature for 21 hours. Subsequently, the coupling solution was filtered off and the resin was allowed to dry over vacuum for 2 hours. Peptide cleavage from the resin was carried out as described in the general peptide synthesis protocol above. The product was purified by RP-HPLC (C18 preparative column, 31% B to 51% B over 30 minutes). The appropriate fractions were combined and lyophilized to yield a blue solid (13.7 mg, 15% yield).
HRMS (ESI) (m/z): calculated for C222H310N46O53S2 [M+3H]3+: 1512.4231 found: 1512.4227
SulfoCy5-deadmiated-33mer:
Deamidated-33mer peptide (H-LQLQPFPQPELPYPQPELPYPQPELPYPQPQPF-Rink resin) bound to Rink resin (150 mg, 20 mmol) was swollen in 10 mL of a 1:1 mixture of DMF and DCM for 15 minutes (note: all tyrosine residues are protected as their tert-butyl ethers, all glutamine residues are protected as their trityl amides, and all glutamate residues are protected as their tert-butyl esters before cleavage). Meanwhile, SulfoCy5-carboxylic acid (27.2 mg, 40 mmol, 2 equiv) and HBTU (15.2 mg, 40 mmol, 2 equiv) were taken up in 2 mL of 1:1 DMF:DMSO and allowed to stand, protected from light, at room temperature for 15 minutes. The swelling solution was drained from the resin and the activated SulfoCy5 carboxylic acid was added on top. Immediately after, DIPEA (17.4 mL, 100 mmol, 5 equiv) was added to the resin slurry. The resin was allowed to rock, protected from light, at room temperature for 20 hours. Subsequently, the coupling solution was filtered off and the resin was allowed to dry over vacuum for 2 hours. Peptide cleavage from the resin was carried out as described in the general peptide synthesis protocol above. The product was purified by RP-HPLC (C18 preparative column, 30% B to 50% B over 30 minutes). The appropriate fractions were combined and lyophilized to yield a blue solid (13.0 mg, 14% yield).
HRMS (ESI) (m/z): calculated for C222H307N43O56S2 [M+3H]3+: 1513.4071 found: 1513.3274
Preparation of recombinant human thioredoxin (TRX):
Human TRX was expressed and purified as previously described33. Briefly, E. coli BL21(DE3) cells harboring a pQE-T7 derivative encoding N-terminally His6-tagged TRX were induced by adding 200 μM IPTG and grown further for 16 h at 18 °C. Cultures were centrifuged at 5000g. Cell pellets were flash-frozen and stored at −80°C overnight. Upon thawing, cells were resuspended in lysis buffer (50 mM NaH2PO4, 500 mM NaCl, 10 mM imidazole, pH 7.2). Following sonication, clarified lysates were centrifuged at 20,000g and supernatants were incubated with Ni-NTA resin with 0.5 mL resin per liter culture. Ni-NTA eluates were diluted with MilliQ water, filtered, and purified by anion exchange chromatography with a linear gradient from FPLC Buffer A (20 mM Tris, 1 mM EDTA, 1 mM EGTA, 1 mM DTT, pH 7.2) to FPLC Buffer B (FPLC A + 1 M NaCl) at 4 °C. The desired fractions were pooled, concentrated on a 7.5K MWCO Amicon spin concentrator, brought to 20% glycerol, flash frozen, and stored at −80 °C.
Preparation of recombinant human transglutaminase 2 (TG2):
Human TG2 was expressed and purified as before33. Briefly, E. coli BL21(DE3) cells harboring a pET-28a derivative encoding N-terminally His6-tagged TG2 were induced by adding 200 μM IPTG and grown further for 16 h at 18 °C. Cultures were centrifuged at 5000g. Cells were resuspended in lysis buffer (50 mM NaH2PO4, 500 mM NaCl, 10 mM imidazole, pH 7.6) and incubated in chicken egg-white lysozyme at a final concentration of 1 mg/mL for 1 h. Following sonication, clarified lysates were centrifuged at 20,000g and supernatants were incubated with Ni-NTA resin with 0.5 mL resin per liter culture. Ni-NTA eluates were diluted with FPLC Buffer A (20 mM Tris, 1 mM EDTA, 1 mM EGTA, 1 mM DTT, pH 7.6), filtered, and purified by anion exchange chromatography with a linear gradient in FPLC Buffer B (FPLC A + 1 M NaCl) at 4 °C. The protein eluted at ~30% FPLC B. The desired fractions were pooled, concentrated on a 30K MWCO Amicon spin concentrator, brought to 20% glycerol, flash frozen, and stored at −80 °C.
Purification of truncated TG2 derivatives:
Truncations of TG2 with N terminal his-tags were created: TG2-Cβ1 (containing residues 1-586, lacking β2 domain), TG2-Cβ1β2 (containing residues 1-460, lacking β1 and β2 domains)38. WT and Truncated TG2 were purified as previously discussed57. Briefly, TG2 variants were extracted from Rosetta2 cells and purified via a nickel column. Eluant from the nickel column was anion exchanged on a HiTrapQ column using TG2 Anion exchange buffer (20mM Tris HCl, 1mM DTT, and 1mM EDTA, pH 7.2) with a 0-1 M NaCl gradient. Finally, size exclusion chromatography was performed on a Superdex™ 200 pg column using TG2 SEC buffer (20mM Tris, 150mM NaCl, pH 8).
Preparation of recombinant human a2-macroglobulin (a2M) from mammalian cells:
Plasmid for recombinant WT α2M expression was prepared by synthesizing a sequence based on human α2M reference sequence NM_000014.4 and cloning it into pcDNA3.1(+) backbone using NheI and XbaI restriction sites. WT α2M was expressed in Expi293F cells using recommended protocol for the Expi293™ Expression System. Briefly, WT α2M plasmid was transfected into 2.5 x 10⁶ Expi293F cells in 100 mL Expression Medium by using the ExpiFectamine 293 Transfection Kit and Opti-MEM. After 18-22 hours, 600μL of Transfection Enhancer 1 and 6 mL of Transfection Enhancer 2 were added. The cultures were expanded for 5 days to allow for protein expression. 1M HEPES at pH 7.4 was added to the cultured supernatant to a final concentration of 50 mM HEPES. WT α2M was purified from supernatant in a two-step process. First, a Zinc based ion affinity chromatography was performed on a HiTrap Chelating HP column previously loaded with 10 mL of 100mM Zinc. The binding buffer for the zinc-based affinity chromatography (50 mM NaCl, 20 mM sodium Acetate, pH 7.4) and eluting buffer (50mM EDTA, 150mM NaCl, 100mM Sodium Acetate, pH7.4). This is followed by SEC purification using a 30mL Sephacryl 400-HR in α2M running buffer (20 mM HEPES, 350 mM NaCl, pH 7.4).
Preparation of recombinant human receptor associated protein (RAP):
E. coli BL21(DE3) cells were transformed with a pET-21 plasmid encoding C-terminally His6-tagged RAP construct43. A single colony was picked and inoculated into 20mL of LB medium supplemented with 100 mg/mL carbenicillin and grown at 37C at 200rpm overnight. 5 mL of this starter culture was inoculated into 1 L of LB medium supplemented with 100 mg/mL carbenicillin, and the cultures were grown at 37 °C at 200rpm until OD600 reached 0.3 at which point the temperature was decreased to 18 °C. The cultures were grown further at this temperature until OD600 reached 0.6 at which point protein expression was induced with 200 mm IPTG. The cultures were incubated for 18 h at 18 °C at 200 rpm before the cells harvested by centrifugation (5000g x 20 min, 4 °C). The pellets were flash-frozen and stored at −80 °C. Cell pellets were thawed and resuspended in 30 mL of lysis/wash buffer (20 mM HEPES, 150 mM NaCl, 25 mM imidazole, 10% glycerol [m/v], pH 8.0) and lysed on ice by sonication. The lysate was clarified by centrifugation (25000g x 75 min, 4 °C). The supernatant was decanted onto Ni-NTA resin (3 mL of resin for 4 L of culture) that had been pre-equilibrated to the lysis/wash buffer and allowed to incubate at 4 °C for 1 h. The resin was washed three times with 35 mL of lysis/wash buffer each time. Resin-bound protein was eluted twice with 5 mL of Ni elution buffer (20 mM HEPES, 150 mM NaCl, 300 mM imidazole, 10% glycerol [m/v], pH 8.0). The eluate was concentrated using a 10kDa Amicon concentrator. The protein was further purified by size-exclusion chromatography with SEC buffer (20 mM HEPES, 150 mM NaCl, pH 8.0). Fractions containing the protein of interest were confirmed by SDS-PAGE analysis and were concentrated using a 10kDa Amicon concentrator, supplemented with glycerol (10% v/v), aliquoted, flash frozen, and stored at −80C. Protein concentration was determined by NanoDrop A280 (extinction coefficient 35075 M−1 cm−1, MW 39163.15 Da).
Kinetic assays:
TG2 activity was assayed as previously described58. Briefly, a reaction mixture containing 200 mM MOPS (pH 7.2), 5 mM CaCl2, 10 mM α-ketoglutarate, 18 U/mL glutamate dehydrogenase, 0.5 mM NADH, and the indicated concentration of substrate (AC-PQLPF-NH2, unless otherwise specified) was prepared. To assess inhibitory potency, the final concentration of substrate was held constant at the indicated concentration and the concentration of inhibitor was varied. Reactions were initiated with the addition of reduced TG2 that had been freshly desalted into PBS. The final concentration of TG2 in the assay was 1 μM and total reaction volumes were 100 μL. Reactions were monitored spectrophotometrically by following the consumption of NADH (340 nm, ε = 6220 cm−1 M−1) for 60 min at 25 °C. Progress curves were fit to linear equations and the calculated slopes were used to extrapolate steady state reaction rates. All measurements were performed in triplicate.
Cell culture:
Mouse embryonic fibroblasts (MEFs) were grown in DMEM and split 1:4-1:6 every 2-3 days. These cells were propagated in 10 cm plates, then seeded into 12- or 24-well glass bottom plates and grown for 3 days prior to treatment. NRK cells were grown in DMEM media and split 1:4 to 1:10 every 2-4 days depending on confluency. 9022 cells were grown in RPMI media supplemented with 10% FBS and 1% PenStrep and split every 1-3 days depending on confluency.
Generation of MEF−/−−cell line:
Primary mouse embryonic fibroblasts (MEFs) were isolated from E14.5 embryos derived from TG2−/− mice59. To generate a homogenous, proliferative cell line, passage 0 MEFs were transformed with lentivirus encoding the simian virus 40 (SV40) large T antigen.
Conjugation a2M with an NHS-linked fluorophore:
A 5mg/mL solution of purified α2M was incubated with a 10x molar excess of 555- Alexa fluorophore NHS-ester for 1h at RT, rocking continuously. The solution was then desalted twice using 7MWKO Zeba spin columns.
Cellular assays – adherent cells:
At the start of each experiment involving NRK or MEF cells, media was replaced with fresh media, and TG2 substrate, α2M and TRX were added as specified. When using non-peptidic inhibitors (CK805, cystamine, Pitstop), compounds were added to the cell culture 30min prior to other treatments unless otherwise indicated. After treatment for 1.5h, cells were washed three times with HBSS and then fixed with 2% paraformaldehyde (PFA) solution in PBS for 10 min at room temperature. The cells were washed 2x with PBS and incubated for 12 min in a 1:1000 DAPI solution, then washed again three times in PBS. If no antibody staining was used, the same protocol was followed starting at the PBST washes. All operations were carried out under low light to minimize photobleaching.
Generation of NRK RFP-LAMP-1 cell line:
RFP-LAMP-1 expressing cells were generated as previously described (Birsoy et al, 2015). Briefly, the plasmid carrying RFP-LAMP-1, lentivirus and VSVg DNA was mixed with Bring X-tremeGENE™ 9 DNA Transfection Reagent (Roche Diagnostics GmbH, #06365779001) and the mixture added to HEK293T cells to generate an RFP-LAMP-1 lentivirus. NRK cells were treated with the virus and spun at 2200rpm for 45 min at 37°C. Cells expressing the desired construct were selected using FACS. The clonal populations were grown in DMEM at 5% CO2 and 37°C until confluent.
Cellular assays – suspension cells:
For experiments involving 9022 cells, 20 mL of cell suspension at ~107 cells/mL were pelleted at 400g for 5 min. The cells were resuspended in 5mL fresh RPMI media and 200μL of the suspension was added to each well in a poly-l-lysine coated 24-well glass bottom plate. The cells were allowed to settle and adhere for 20 min at 37°C. HB230 or Cy5-33mer, α2M, and 100nM TG2 were then added, as specified, and incubated for 2.5h. Cells were washed gently with RT PBS and stained with SVL-3 mouse anti-human antibody at a 1:50 dilution and/or a custom anti-TG2 rabbit anti-mouse (cross-reactive with human TG2) polyclonal antibody at a 1:100 dilution, for 20min on ice. After washing with PBS, the cells were stained with a secondary antibody (488-Alexa Fluor conjugated rabbit anti-mouse secondary antibody and/or 555-Alexa Fluor conjugated goat anti-rabbit secondary antibody) for 20min on ice. Cells were washed again, fixed, and stained with DAPI, as described for adherent cells.
Isolation and differentiation of BMDC and BMM:
The tibia and femur were removed from female C57BL6 or TG2KO mice, and the bone marrow cells were flushed out using a 1 mL syringe with a 26G needle filled with PBS. Red blood cells were removed, and BM cells were resuspended in 6 mL complete media (RPMI supplemented with 10% FBS and 1% PenStrep) and plated in a petri dish at a density of 8x10⁶ cells in complete medium with 20 ng/mL M-CSF per plate for BMM differentiation. To generate BMM, added 3 mL of complete medium plus 20 ng/mL MCSF on day 2 and day 4, then harvested adherent cells using 5 mM EDTA on day 5. To generate BMDC, bone marrow cells were resuspended in 10 mL complete media with 10 ng/mL GM-CSF at a density of 2x10⁶ cells per 10-cm Petri dish. Added 10 mL of 10 ng/mL GM-CSF-containing complete media on day 3 and 6, then harvested suspension cells on day 8.
Confocal immunofluorescent microscopy:
Cells were imaged on an LSM780 confocal fluorescence microscope using up to 4 channels. The microscope was equipped with a 63x oil immersion lens. HB230 and Cy5-33mer was detected on the red channel (647 nm), whereas α2M was observed on the green channel as was the secondary antibody for TG2 (555 nm). HLA-DQ2 was visualized using an SPV-L3 mouse antibody (Novus Biologicals) and a secondary rabbit anti-mouse secondary antibody conjugated to an Alexa Fluor (488 nm). The nuclear stain DAPI was visualized on the blue channel (405 nm).
Quantification and statistical analysis
Calculation of kinetic parameters:
Progress curves were fitted to linear equations and the calculated slopes were used to extrapolate steady state reaction rates by fitting to the Michaelis-Menten equation in GraphPad Prism 9. All measurements were performed in triplicate.
Colocalization analysis:
Colocalization analysis was performed using __ colocalization tool in Fiji (ImageJ).
HB230-containing vesicles quantification in NRK cells:
Using the particle analysis tool in Fiji (ImageJ) the number of particles in the HB230 (647nm) channel were quantified. Circularity cutoff was set at 0.3 and minimum size of particles was 0.1 μM. The number of vesicles was normalized to the number of cells as measured by DAPI staining and plotted in GraphPad Prism 9.
Quantification of antigen presentation by 9022 cells:
2-4 frames of 3-6 experimental replicates were analyzed for each condition. Cells were counted if they had a well-defined nucleus and clearly defined expression of HLA-DQ2. Cells with overlay of HLA-DQ2 antibody and Cy5-33mer in at least one section of the cell surface counted as presenting Cy5-33mer on MHC-II.
Statistical analysis:
For all datasets, data from different samples was compared using students t-test pairwise comparison when comparing two conditions, or one-way ANOVA when comparing multiple conditions. Statistical significance: * p<0.05, ** p<0.01, *** p<0.001, **** p<0.0001. Comparisons generated in GraphPad Prism 9. Points were plotted as mean ± SD. No additional methods were used to determine whether data met the assumptions of the statistical approach beyond the built-in methods in the GraphPad Prism 9 analysis tools.
Statistical details of experiments can be found in the figure legends.
Supplementary Material
Key resources table
| REAGENT or RESOURCE | SOURCE | IDENTIFIER |
|---|---|---|
| Antibodies | ||
| α-transglutaminase 2 polyclonal antibody (raised in rabbit) | Custom made by Pacific Immunology | N/A |
| Bacterial and virus strains | ||
| Biological samples | ||
| Chemicals, peptides, and recombinant proteins | ||
| Recombinant transglutaminase 2 | This paper | N/A |
| Alpha-2 macroglobulin (from plasma) | Athens Research and Technology | 16-16-012013 |
| Alpha-2 macroglobulin (recombinant) | This paper | N/A |
| HB230 | This paper | N/A |
| HB225 | This paper | N/A |
| Cy5-33mer (native) | This paper | N/A |
| Cy5-33mer (deamidated) | This paper | N/A |
| Critical commercial assays | ||
| Deposited data | ||
| Experimental models: Cell lines | ||
| Rat:Natural Rat Kidney Cells | ATCC | CRL-6509 |
| Mouse: LRP-1 knock-out MEFs | ATCC | CRL-2216 |
| Mouse: TG2 knock-out MEFs | Generated from TG2 KO mice | N/A |
| Mouse: MEF | Generated from wild type mice | N/A |
| Human male: 9022 B cells | International Histocompatibility Workshop | https://www.fredhutch.org/en/research/institutes-networks-ircs/international-histocompatibility-working-group.html |
| Experimental models: Organisms/strains | ||
| TG2 knockout mice | De Laurenzi and Melino (2001)59 | N/A |
| Oligonucleotides | ||
| Recombinant DNA | ||
| TG2 plasmid (in pET vector) | Palanski and Khosla, 201836 | pBAP3 |
| Alpha-2 Macroglobulin | This paper | pASS1 |
| RAP | This paper | RAP-pET21 |
| Software and algorithms | ||
| Fiji (ImageJ) | NIH | https://imagej.nih.gov/ij/download.html |
| GraphPad Prism 9 | Dotmatics | https://www.graphpad.com/ |
| ChemDraw | Perkin Elmer Informatics | https://perkinelmerinformatics.com/products/research/chemdraw |
| Other | ||
Highlights:
Endocytosis of gluten antigens depends on transglutaminase-2 and α2-macroglobulin
LRP-1 mediates uptake, causing lysosomal concentration of deamidated gluten peptides
Peptidomimetic active TG2 probes allow tracking of TG2 through the endolysosome
Antigens taken up through this pathway are presented on MHC-II in a DQ2 restricted way
Acknowledgements:
This work was supported by a grant from the NIH (R01 DK063158 to C.K. and B.J.). H.A.B was supported by the National Institutes of Health (F30DK132903) and the Stanford University Medical Scientist Training Program (T32GM007365 and T32GM145402). The authors thank Uche Medoh and Dr. Monther Abu-Remaileh for providing the RFP-LAMP-1 lentivirus construct, and Dr. Satyajit Mayor for helpful feedback on the manuscript.
Footnotes
Publisher's Disclaimer: This is a PDF file of an unedited manuscript that has been accepted for publication. As a service to our customers we are providing this early version of the manuscript. The manuscript will undergo copyediting, typesetting, and review of the resulting proof before it is published in its final form. Please note that during the production process errors may be discovered which could affect the content, and all legal disclaimers that apply to the journal pertain.
Declaration of interests: C.K. serves as a consultant to GSK and ImmunogenX. A patent application has been filed by Stanford University based on aspects of this work.
References
- 1.Lionetti E, Gatti S, Pulvirenti A, and Catassi C (2015). Celiac disease from a global perspective. Best Pract Res Clin Gastroenterol 29, 365–379. 10.1016/j.bpg.2015.05.004. [DOI] [PubMed] [Google Scholar]
- 2.Leffler DA, Green PHR, and Fasano A (2015). Extraintestinal manifestations of coeliac disease. Nat Rev Gastroenterol Hepatol 12, 561–571. 10.1038/nrgastro.2015.131. [DOI] [PubMed] [Google Scholar]
- 3.Sollid LM, and Jabri B (2013). Triggers and drivers of autoimmunity: lessons from coeliac disease. Nat Rev Immunol 13, 294–302. 10.1038/nri3407. [DOI] [PMC free article] [PubMed] [Google Scholar]
- 4.Rubin JE, and Crowe SE (2020). Celiac Disease. Ann Intern Med 172, ITC1. 10.7326/aitc202001070. [DOI] [PubMed] [Google Scholar]
- 5.Sollid LM (2017). The roles of MHC class II genes and post-translational modification in celiac disease. Immunogenetics 69, 605–616. 10.1007/s00251-017-0985-7. [DOI] [PubMed] [Google Scholar]
- 6.Abadie V, Kim SM, Lejeune T, Palanski BA, Ernest JD, Tastet O, Voisine J, Discepolo V, Marietta E. v., Hawash MBF, et al. (2020). IL-15, gluten and HLA-DQ8 drive tissue destruction in coeliac disease. Nature 578, 600–604. 10.1038/s41586-020-2003-8. [DOI] [PMC free article] [PubMed] [Google Scholar]
- 7.Shan L, Molberg Ø, Parrot T, Hausch F, Filiz F, Gray GM, Sollid LM, and Khosla C (2002). Structural Basis for Gluten Intolerance in Celiac Sprue. Science (1979) 297, 2275–2279. 10.1126/science.1074129. [DOI] [PubMed] [Google Scholar]
- 8.Kim C-Y, Quarsten H, Bergseng E, Khosla C, and Sollid LM (2004). Structural basis for HLA-DQ2-mediated presentation of gluten epitopes in celiac disease. Proceedings of the National Academy of Sciences 101, 4175–4179. 10.1073/pnas.0306885101. [DOI] [PMC free article] [PubMed] [Google Scholar]
- 9.Qiao S-W, Bergseng E, Molberg Ø, Xia J, Fleckenstein B, Khosla C, and Sollid LM (2004). Antigen Presentation to Celiac Lesion-Derived T Cells of a 33-Mer Gliadin Peptide Naturally Formed by Gastrointestinal Digestion. The Journal of Immunology 173, 1757–1762. 10.4049/jimmunol.173.3.1757. [DOI] [PubMed] [Google Scholar]
- 10.Vader W, Stepniak D, Kooy Y, Mearin L, Thompson A, van Rood JJ, Spaenij L, and Koning F (2003). The HLA-DQ2 gene dose effect in celiac disease is directly related to the magnitude and breadth of gluten-specific T cell responses. Proceedings of the National Academy of Sciences 100, 12390–12395. 10.1073/pnas.2135229100. [DOI] [PMC free article] [PubMed] [Google Scholar]
- 11.Jabri B, and Sollid LM (2009). Tissue-mediated control of immunopathology in coeliac disease. Nat Rev Immunol 9, 858–870. 10.1038/nri2670. [DOI] [PubMed] [Google Scholar]
- 12.Trombetta ES, and Mellman I (2005). CELL BIOLOGY OF ANTIGEN PROCESSING IN VITRO AND IN VIVO. Annu Rev Immunol 23, 975–1028. 10.1146/annurev.immunol.22.012703.104538. [DOI] [PubMed] [Google Scholar]
- 13.Raki M, Tollefsen S, Molberg Ø, Lundin KEA, Sollid LM, and Jahnsen FL (2006). A Unique Dendritic Cell Subset Accumulates in the Celiac Lesion and Efficiently Activates Gluten-Reactive T Cells. Gastroenterology 131, 428–438. 10.1053/j.gastro.2006.06.002. [DOI] [PubMed] [Google Scholar]
- 14.di Sabatino A, Pickard KM, Gordon JN, Salvati V, Mazzarella G, Beattie RM, Vossenkaemper A, Rovedatti L, Leakey NAB, Croft NM, et al. (2007). Evidence for the Role of Interferon-alfa Production by Dendritic Cells in the Th1 Response in Celiac Disease. Gastroenterology 133, 1175–1187. 10.1053/j.gastro.2007.08.018. [DOI] [PubMed] [Google Scholar]
- 15.Hudec M, Riegerová K, Pala J, Kútna V, Černá M, and O′Leary VB (2021). Celiac Disease Defined by Over-Sensitivity to Gliadin Activation and Superior Antigen Presentation of Dendritic Cells. Int J Mol Sci 22, 9982. 10.3390/ijms22189982. [DOI] [PMC free article] [PubMed] [Google Scholar]
- 16.Arranz E, de Prado Á, Fiz-López A, Arribas E, Garrote JA, and Bernardo D (2021). Human intestinal dendritic cell and macrophage subsets in coeliac disease. Int Rev Cell Mol Biol 358, 85–104. 10.1016/BS.IRCMB.2020.09.006. [DOI] [PubMed] [Google Scholar]
- 17.Neutra MR, Pringault E, and Kraehenbuhl J-P (1996). ANTIGEN SAMPLING ACROSS EPITHELIAL BARRIERS AND INDUCTION OF MUCOSAL IMMUNE RESPONSES. Annu Rev Immunol 14, 275–300. 10.1146/annurev.immunol.l4.1.275. [DOI] [PubMed] [Google Scholar]
- 18.Siegel M, Strnad P, Watts RE, Choi K, Jabri B, Omary MB, and Khosla C (2008). Extracellular Transglutaminase 2 Is Catalytically Inactive, but Is Transiently Activated upon Tissue Injury. PLoS One 3, e1861. 10.1371/journal.pone.0001861. [DOI] [PMC free article] [PubMed] [Google Scholar]
- 19.Klöck C, DiRaimondo TR, and Khosla C (2012). Role of transglutaminase 2 in celiac disease pathogenesis. Semin Immunopathol 34, 513–522. 10.1007/s00281-012-0305-0. [DOI] [PMC free article] [PubMed] [Google Scholar]
- 20.Plugis NM, Palanski BA, Weng CH, Albertelli M, and Khosla C (2017). Thioredoxin-1 selectively activates transglutaminase 2 in the extracellular matrix of the small intestine: Implications for celiac disease. Journal of Biological Chemistry 292, 2000–2008. 10.1074/jbc.Ml16.767988. [DOI] [PMC free article] [PubMed] [Google Scholar]
- 21.Zhuang R, and Khosla C (2020). Substrates, inhibitors, and probes of mammalian transglutaminase 2. Anal Biochem 591, 113560. 10.1016/j.ab.2019.113560. [DOI] [PMC free article] [PubMed] [Google Scholar]
- 22.Jeon WM, Lee KN, Birckbichler PJ, Conway E, and Patterson MK (1989). Colorimetric assay for cellular transglutaminase. Anal Biochem 182, 170–175. 10.1016/0003-2697(89)90737-9. [DOI] [PubMed] [Google Scholar]
- 23.DiRaimondo TR, Klöck C, Warburton R, Herrera Z, Penumatsa K, Toksoz D, Hill N, Khosla C, and Fanburg B (2013). Elevated Transglutaminase 2 Activity Is Associated with Hypoxia-Induced Experimental Pulmonary Hypertension in Mice. ACS Chem Biol 9, 266–275. 10.1021/cb4006408. [DOI] [PMC free article] [PubMed] [Google Scholar]
- 24.Pinkas DM, Strop P, Brunger AT, and Khosla C (2007). Transglutaminase 2 Undergoes a Large Conformational Change upon Activation. PLoS Biol 5, e327. 10.1371/journal.pbio.0050327. [DOI] [PMC free article] [PubMed] [Google Scholar]
- 25.Klöck C, Herrera Z, Albertelli M, and Khosla C (2014). Discovery of Potent and Specific Dihydroisoxazole Inhibitors of Human Transglutaminase 2. J Med Chem 57, 9042–9064. 10.1021/jm501145a. [DOI] [PMC free article] [PubMed] [Google Scholar]
- 26.Levitzki A, Willingham M, and Pastan I (1980). Evidence for participation of transglutaminase in receptor-mediated endocytosis. Proceedings of the National Academy of Sciences 77, 2706–2710. 10.1073/pnas.77.5.2706. [DOI] [PMC free article] [PubMed] [Google Scholar]
- 27.Davies PJA, Davies DR, Levitzki A, Maxfield FR, Milhaud P, Willingham MC, and Pastan IH (1980). Transglutaminase is essential in receptor-mediated endocytosis of α2-macroglobulin and polypeptide hormones. Nature 283, 162–167. 10.1038/283162a0. [DOI] [PubMed] [Google Scholar]
- 28.Vandooren J, and Itoh Y (2021). Alpha-2-Macroglobulin in Inflammation, Immunity and Infections. Front Immunol 12. 10.3389/fimmu.2021.803244. [DOI] [PMC free article] [PubMed] [Google Scholar]
- 29.Mikhailenko I, Battey FD, Migliorini M, Ruiz JF, Argraves K, Moayeri M, and Strickland DK (2001). Recognition of α2-Macroglobulin by the Low Density Lipoprotein Receptor-related Protein Requires the Cooperation of Two Ligand Binding Cluster Regions. Journal of Biological Chemistry 276, 39484–39491. 10.1074/jbc.m104382200. [DOI] [PubMed] [Google Scholar]
- 30.Ganrot PO, and Scherstén B (1967). Serum α2-macroglobulin concentration and its variation with age and sex. Clinica Chimica Acta 15, 113–120. 10.1016/0009-8981(67)90333-6. [DOI] [Google Scholar]
- 31.Roche PA, and Furuta K (2015). The ins and outs of MHC class II-mediated antigen processing and presentation. Nat Rev Immunol 15, 203–216. 10.1038/nri3818. [DOI] [PMC free article] [PubMed] [Google Scholar]
- 32.Stamnaes I, Pinkas DM, Fleckenstein B, Khosla C, and Sollid LM (2010). Redox Regulation of Transglutaminase 2 Activity. Journal of Biological Chemistry 285, 25402–25409. 10.1074/jbc.m109.097162. [DOI] [PMC free article] [PubMed] [Google Scholar]
- 33.Yi MC, Melkonian A. v, Ousey JA, and Khosla C (2018). Endoplasmic reticulum–resident protein 57 (ERp57) oxidatively inactivates human transglutaminase 2. Journal of Biological Chemistry 293, 2640–2649. 10.1074/jbc.ra117.001382. [DOI] [PMC free article] [PubMed] [Google Scholar]
- 34.Melkonian A. v, Loppinet E, Martin R, Porteus M, and Khosla C (2021). An Unusual “OR” Gate for Allosteric Regulation of Mammalian Transglutaminase 2 in the Extracellular Matrix. J Am Chem Soc 143, 10537–10540. 10.1021/jacs.1c04616. [DOI] [PMC free article] [PubMed] [Google Scholar]
- 35.Király R, Csősz É, Kurtán T, Antus S, Szigeti K, Simon-Vecsei Z, Korponay-Szabó IR, Keresztessy Z, and Fésüs L (2009). Functional significance of five noncanonical Ca2+-binding sites of human transglutaminase 2 characterized by site-directed mutagenesis. FEBS Journal 276, 7083–7096. 10.1111/j.1742-4658.2009.07420.x. [DOI] [PubMed] [Google Scholar]
- 36.Palanski BA, and Khosla C (2018). Cystamine and Disulfiram Inhibit Human Transglutaminase 2 via an Oxidative Mechanism. Biochemistry 57, 3359–3363. 10.1021/acs.biochem.8b00204. [DOI] [PMC free article] [PubMed] [Google Scholar]
- 37.Hnida K, Stamnaes J, du Pré MF, Mysling S, Jørgensen TJD, Sollid LM, and Iversen R (2016). Epitope-dependent Functional Effects of Celiac Disease Autoantibodies on Transglutaminase 2. Journal of Biological Chemistry 291, 25542–25552. 10.1074/jbc.m116.738161. [DOI] [PMC free article] [PubMed] [Google Scholar]
- 38.Liu S, Cerione RA, and Clardy J (2002). Structural basis for the guanine nucleotide-binding activity of tissue transglutaminase and its regulation of transamidation activity. Proceedings of the National Academy of Sciences 99, 2743–2747. 10.1073/pnas.042454899. [DOI] [PMC free article] [PubMed] [Google Scholar]
- 39.Soluri MF, Boccafoschi F, Cotella D, Moro L, Forestieri G, Autiero I, Cavallo L, Oliva R, Griffin M, Wang Z, et al. (2018). Mapping the minimum domain of the fibronectin binding site on transglutaminase 2 (TG2) and its importance in mediating signaling, adhesion, and migration in TG2-expressing cells. The FASEB Journal 33, 2327–2342. 10.1096/fj.201800054rrr. [DOI] [PubMed] [Google Scholar]
- 40.Sima LE, Yakubov B, Zhang S, Condello S, Grigorescu AA, Nwani NG, Chen L, Schiltz GE, Arvanitis C, Zhang Z-Y, et al. (2019). Small Molecules Target the Interaction between Tissue Transglutaminase and Fibronectin. Mol Cancer Ther 18, 1057–1068. 10.1158/1535-7163.mct-18-1148. [DOI] [PMC free article] [PubMed] [Google Scholar]
- 41.Bres EE, and Faissner A (2019). Low Density Receptor-Related Protein 1 Interactions With the Extracellular Matrix: More Than Meets the Eye. Front Cell Dev Biol 7. 10.3389/fcell.2019.00031. [DOI] [PMC free article] [PubMed] [Google Scholar]
- 42.Zemskov EA, Mikhailenko T, Strickland DK, and Belkin AM (2007). Cell-surface transglutaminase undergoes internalization and lysosomal degradation: An essential role for LRP1. J Cell Sci 120, 3188–3199. 10.1242/jcs.010397. [DOI] [PubMed] [Google Scholar]
- 43.Prasad JM, Migliorini M, Galisteo R, and Strickland DK (2015). Generation of a Potent Low Density Lipoprotein Receptor-related Protein 1 (LRP1) Antagonist by Engineering a Stable Form of the Receptor-associated Protein (RAP) D3 Domain. Journal of Biological Chemistry 290, 17262–17268. 10.1074/jbc.M115.660084. [DOI] [PMC free article] [PubMed] [Google Scholar]
- 44.Lakadamyali M, Rust MJ, and Zhuang X (2006). Ligands for Clathrin-Mediated Endocytosis Are Differentially Sorted into Distinct Populations of Early Endosomes. Cell 124, 997–1009. 10.1016/j.cell.2005.12.038. [DOI] [PMC free article] [PubMed] [Google Scholar]
- 45.Shiina T, Ota M, Shimizu S, Katsuyama Y, Hashimoto N, Takasu M, Anzai T, Kulski JK, Kikkawa E, Naruse T, et al. (2006). Rapid Evolution of Major Histocompatibility Complex Class I Genes in Primates Generates New Disease Alleles in Humans via Hitchhiking Diversity. Genetics 173, 1555–1570. 10.1534/genetics.106.057034. [DOI] [PMC free article] [PubMed] [Google Scholar]
- 46.Xia J, Sollid LM, and Khosla C (2005). Equilibrium and Kinetic Analysis of the Unusual Binding Behavior of a Highly Immunogenic Gluten Peptide to HLA-DQ2. Biochemistry 44, 4442–4449. 10.1021/bi047747c. [DOI] [PubMed] [Google Scholar]
- 47.Iversen R, Roy B, Stamnaes J, Høydahl LS, Hnida K, Neumann RS, Korponay-Szabó IR, Lundin KEA, and Sollid LM (2019). Efficient T cell–B cell collaboration guides autoantibody epitope bias and onset of celiac disease. Proc Natl Acad Sci U S A 116, 15134–15139. 10.1073/pnas.1901561116. [DOI] [PMC free article] [PubMed] [Google Scholar]
- 48.Stahl PD, and Ezekowitz RAB (1998). The mannose receptor is a pattern recognition receptor involved in host defense. Curr Opin Immunol 10, 50–55. 10.1016/s0952-7915(98)80031-9. [DOI] [PubMed] [Google Scholar]
- 49.Zehner M, Chasan AI, Schuette V, Embgenbroich M, Quasi T, Kolanus W, and Burgdorf S (2011). Mannose receptor polyubiquitination regulates endosomal recruitment of p97 and cytosolic antigen translocation for cross-presentation. Proceedings of the National Academy of Sciences 108, 9933–9938. 10.1073/pnas.1102397108. [DOI] [PMC free article] [PubMed] [Google Scholar]
- 50.Ng WC, Londrigan SL, Nasr N, Cunningham AL, Turville S, Brooks AG, and Reading PC (2016). The C-type Lectin Langerin Functions as a Receptor for Attachment and Infectious Entry of Influenza A Virus. J Virol 90, 206–221. 10.1128/jvi.01447-15. [DOI] [PMC free article] [PubMed] [Google Scholar]
- 51.Gully BS, Venugopal H, Fulcher AJ, Fu Z, Li J, Deuss FA, Llerena C, Heath WR, Lahoud MH, Caminschi T, et al. (2021). The cryo-EM structure of the endocytic receptor DEC-205. Journal of Biological Chemistry 296, 100127. 10.1074/jbc.ra120.016451. [DOI] [PMC free article] [PubMed] [Google Scholar]
- 52.Subramanian M, Hayes CD, Thome JJ, Thorp E, Matsushima GK, Herz J, Farber DL, Liu K, Lakshmana M, and Tabas I (2014). An AXL/LRP-1/RANBP9 complex mediates DC efferocytosis and antigen cross-presentation in vivo. Journal of Clinical Investigation 124, 1296–1308. 10.1172/JCI72051. [DOI] [PMC free article] [PubMed] [Google Scholar]
- 53.Min B, and Chung KC (2018). New insight into transglutaminase 2 and link to neurodegenerative diseases. BMB Rep 51, 5–13. 10.5483/bmbrep.2018.51.1.227. [DOI] [PMC free article] [PubMed] [Google Scholar]
- 54.Kovacs GG (2018). Tauopathies. In, pp. 355–368. 10.1016/B978-0-12-802395-2.00025-0. [DOI] [Google Scholar]
- 55.Halverson RA (2005). Tau Protein Is Cross-Linked by Transglutaminase in P301L Tau Transgenic Mice. Journal of Neuroscience 25, 1226–1233. 10.1523/jneurosci.3263-04.2005. [DOI] [PMC free article] [PubMed] [Google Scholar]
- 56.Rauch JN, Luna G, Guzman E, Audouard M, Challis C, Sibih YE, Leshuk C, Hernandez I, Wegmann S, Hyman BT, et al. (2020). LRP1 is a master regulator of tau uptake and spread. Nature 580, 381–385. 10.1038/s41586-020-2156-5. [DOI] [PMC free article] [PubMed] [Google Scholar]
- 57.Piper JL, Gray GM, and Khosla C (2002). High Selectivity of Human Tissue Transglutaminase for Immunoactive Gliadin Peptides: Implications for Celiac Sprue. Biochemistry 41, 386–393. 10.1021/bio11715x. [DOI] [PubMed] [Google Scholar]
- 58.Hausch F, Halttunen T, Mäki M, and Khosla C (2003). Design, Synthesis, and Evaluation of Gluten Peptide Analogs as Selective Inhibitors of Human Tissue Transglutaminase. Chemistry & Biology 10, 225–231. 10.1016/s1074-5521(03)00045-0. [DOI] [PubMed] [Google Scholar]
- 59.de Laurenzi V, and Melino G (2001). Gene Disruption of Tissue Transglutaminase. Mol Cell Biol 21, 148–155. 10.1128/mcb.21.1.148-155.2001. [DOI] [PMC free article] [PubMed] [Google Scholar]
Associated Data
This section collects any data citations, data availability statements, or supplementary materials included in this article.
Supplementary Materials
Data Availability Statement
All data reported in this paper will be shared by the lead contact upon request. This paper does not include original code.
Any additional information required to reanalyze the data reported in this paper is available from the lead contact upon request.


