

SUMMARY
The mono-ADP-ribosyltransferase PARP7 has emerged as a key negative regulator of cytosolic nucleic acid (NA)-sensors of the innate immune system. We apply a rational design strategy for converting a pan-PARP inhibitor into a potent selective PARP7 inhibitor (KMR-206). Consistent with studies using structurally distinct PARP7 inhibitor RBN-2397, co-treatment of mouse embryonic fibroblasts with KMR-206 and NA-sensor ligands synergistically induced the expression of the type I interferon, IFN-β. In mouse colon carcinoma (CT-26) cells, KMR-206 alone induced IFN-β. Both KMR-206 and RBN-2397 increased PARP7 protein levels in CT-26 cells, demonstrating that PARP7’s catalytic activity regulates its own protein levels. Curiously, saturating doses of KMR-206 and RBN-2397 achieved different levels of PARP7 protein, which correlated with the magnitude of type I interferon gene expression. These latter results have important implications for the mechanism of action of PARP7 inhibitors and highlights the utility of having structurally distinct chemical probes for the same target.
Keywords: PARPs, PARP7, MARylation, RBN-2397, KMR-206, type I interferon (IFN-I), IFN-β, STING, cGAMP, RIG-I, 3pRNA
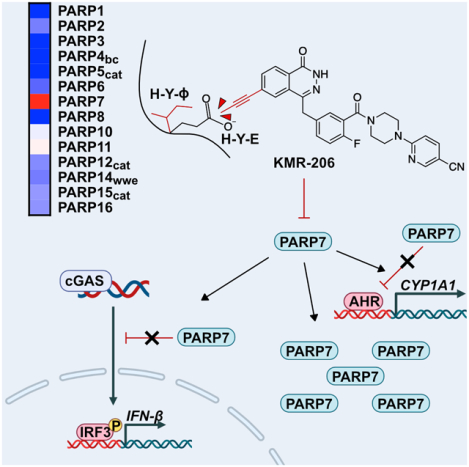
Graphical Abstract
eTOC Blurb
Sanderson et al. describe a potent and selective inhibitor of PARP7. Cellular investigations using this inhibitor confirm PARP7s roles in AHR signaling regulation and Type I interferon signaling. This inhibitor will be a useful tool for further studies into PARP7 biology.
INTRODUCTION
Cytosolic nucleic acid (NA)-sensing serves as the first line of defense against pathogens. When viruses and bacteria enter cells, they release their NAs into the cytoplasm, which are promptly detected by cytosolic NA sensors. DNA derived from viruses and bacteria is recognized by cytosolic NA sensors, namely cyclic cGMP-AMP (cGAMP) synthase (cGAS). Binding of pathogen-derived DNA to cGAS stimulates the production of cGAMP, which binds to and activates stimulator of interferon genes protein (STING)1. RNA derived from viruses is recognized by a different set of cytosolic NA sensors, the most well-studied being retinoic acid-inducible gene I (RIG-I)2. While the activation mechanisms of STING and RIG-I are distinct, they both converge on common signal transducers, such as TANK binding kinase 1 (TBK1) and its target interferon regulatory factor 3 (IRF3), the activation of which leads to type I interferon (IFN-I) production3. IFN-I functions as both an autocrine and paracrine factor to activate the Janus kinase (JAK)-signal transducer and activator of transcription (STAT) pathway and subsequently induce interferon stimulated genes or (ISGs), which enhance the innate response and orchestrate an adaptive immune response (e.g., activation of cytotoxic T cells to kill infected cells)3. While essential for host defense against pathogens, overactivation of cytosolic NA-sensing can lead to autoimmune and inflammatory disorders. Thus, repressors of cytosolic NA-sensing are crucial for attenuating innate immunity.
PARP7 (also known as TiPARP) has emerged as a critical repressor of cytosolic NA-sensing4. PARP7 is a member of a family of 17 enzymes in humans called PARPs5. PARP7, like most PARP family members, catalyzes the transfer of ADP-ribose (ADPr) from nicotinamide adenine dinucleotide (NAD+) to amino acids on protein targets, a post-translational modification (PTM) known as mono-ADP-ribosylation (MARylation)6. PARP7 was initially identified as a gene strongly upregulated by synthetic agonists7 (e.g., the carcinogen 2,3,7,8-tetrachlorodibenzo-p-dioxin or TCDD) of the aryl hydrocarbon receptor (AHR). In some cell types, for example mouse embryonic fibroblasts (MEFs), expression of PARP7 is completely dependent on AHR4. Intriguingly, PARP7 itself acts a negative regulator of AHR-ligand induced transcription8. This repressor function of PARP7 is dependent on its catalytic activity, and it is postulated that this is due to MARylation of AHR, although the consequences of MARylation on AHR function are not understood.
Recently, PARP7 was identified as the major AHR regulated gene that represses IFN-I signaling in response to cytosolic NA-sensor ligands and several types of RNA viruses4. In MEFs, knockout (KO) of PARP7 in the presence of cytosolic NA-sensor ligands (i.e., the synthetic RIG-I ligand 3pRNA and the STING agonist cGAMP) synergistically induced IFN-β expression. Expression of wild-type (WT) PARP7, but not a catalytically inactive PARP7 mutant, in PARP7 KO MEFs rescued these effects. This suggests that the catalytic activity of PARP7 is required for repressing cytosolic NA sensing and downstream IFN-β signaling.
Beyond host defense against pathogens, cytosolic NA-sensing—in particular the cGAS/STING pathway—is critical to prevent an inappropriate immune response to cytosolic self-DNA1. Cancer cells contain cytosolic self-DNA (e.g., due to defects in DNA repair) and must repress cGAS/STING to evade detection and elimination by adaptive immune responses. Therefore, repressors of cGAS/STING, like PARP7, are potential therapeutic targets in the burgeoning area of immune-oncology1. Indeed, a recently disclosed a pyridazinone-based PARP7 inhibitor (RBN-2397)9, has entered clinical trials (NCT04053673). RBN-2397 treatment induced STING-dependent, IFN-I signaling in mouse colorectal cancer (CT-26) cells and human lung adenocarcinoma (NCI-H1373) cells, resulting in immune-cell dependent killing in vivo. This study not only validates the role of PARP7 as a repressor of cGAS/STING signaling, but also demonstrates the therapeutic potential of PARP7 inhibitors as immunomodulatory agents.
Here, we used rational drug design to convert a PARP1/2/7 inhibitor into a selective PARP7 inhibitor (KMR-206). KMR-206 achieves exquisite selectivity for PARP7 over PARP1/2 by exploiting a hydrophobic sub-pocket adjacent to the NAD+ binding site present in PARP7. Cell-based studies using KMR-206 validate the requirement of catalytic activity for PARP7 repressor functions in both AHR and IFN-I signaling. KMR-206, as well as RBN-2397, increase PARP7 protein levels in the nucleus of CT-26 cells, suggesting that PARP7 stability is regulated by its activity. Despite being equipotent against PARP7 catalytic activity in vitro, RBN-2397 leads to a two-fold higher increase in PARP7 protein levels at saturating doses compared to KMR-206. This difference correlated with a two-fold higher induction of an IFN-I-responsive luciferase reporter by RBN-2397 compared to KMR-206, potentially suggesting that, in addition to serving as de-repressors of IFN-I-mediated transcription via MARylation inhibition, PARP7 inhibitors may induce cGAS/STING signaling via a PARP7—inhibitor complex.
RESULTS
Parlaying a PARP1/2/7 inhibitor into a selective PARP7 inhibitor
MARylating PARPs—like PARP7—are the largest sub-group of the PARP family but are the least understood. This is because unlike PARylating PARPs, namely PARP1 and PARP2, there is a dearth of highly selective MARylating PARP inhibitors. A major obstacle toward the development of a selective inhibitor of PARP7, or any PARP, is the high structural conservation among PARP catalytic domains10; while the sequence homology is only ~50%, their structures are highly conserved, especially in the NAD+ binding site (the main binding site for most PARP inhibitors). To address this challenge, we previously identified a unique hydrophobic cavity abutting the nicotinamide sub-pocket of the NAD+ binding site in MARylating PARPs that can be exploited for the development of selective inhibitors of MARylating PARPs11. Crystal structure analysis of one of our MARylating PARP inhibitors, ITK6, bound to PARP14 (PDB: 6FZM) shows that Leu1782 (human PARP14) acts as a “gatekeeper” (a term we borrow from the protein kinase field12, allowing hydrophobic substituents emanating from the inhibitor scaffold to access the hydrophobic cavity. A hydrophobic amino acid at the gatekeeper position is conserved across the MARylating PARP sub-group. Critically, PARylating PARPs have a conserved glutamate at the gatekeeper position, and analysis of multiple structures of PARP1 and PARP2 shows that this glutamate occludes access to the hydrophobic cavity, consistent with previous studies showing that MARylating PARP inhibitors containing substituents that access the hydrophobic cavity show remarkable selectivity over PARylating PARPs.
Key to our rational design strategy is the identification of an NAD+-competitive inhibitor scaffold that contains a position that can be easily derivatized with a substituent that will interact favorably with the unique hydrophobic cavity in MARylating PARPs. In recent work, we found that the NAD+-competitive inhibitor Phthal0113 (Figure 1A), which is based on a phthalazinone scaffold, is a potent, but non-specific inhibitor of PARP7. Using our PARP inhibitor screening platform, PARP activity screening and inhibitor testing assay (PASTA)14, we found that Phthal01 exhibited double-digit nanomolar potency against three PARPs: PARP1, PARP2, and PARP7, but was at least 12-fold more potent against PARP7 compared to all other PARP family members (Figure 1B). To parlay Phthal01 into a more selective inhibitor of PARP7, we designed and synthesized a Phthal01 analogue (KMR-206) that contains a propynyl group at the C-6 position of the phthalazinone scaffold (Figure 1A, Scheme S1, and STAR Methods). We hypothesized that the C-6 propynyl would occupy the hydrophobic cavity in PARP7 but would clash with the glutamate gatekeeper in PARylating PARPs. We chose a propynyl because our previous studies suggested11 that this was a privileged substituent for generating selective MARylating PARP inhibitors.
Figure 1. Rational design of KMR-206, a potent membrane-permeable PARP7 inhibitor.

A) Chemical structures of Phthal01, KMR-206, and RBN-2397. KMR-206 contains a propynyl group (shown in yellow) at the C-6 of the phthalazinone scaffold design to impart PARP7-selectivity by interacting with a unique hydrophobic cavity in PARP7. RBN-2397 is a recently published PARP7 inhibitor.
B) A family-wide PARP inhibitor screening assay reveals that KMR-206 is selective for PARP7. Selectivity data (IC50 values) are represented as a heat map (red = more potent and blue = less potent). IC50 values can be found in Supplementary Table 1 and individual dose response curves in Supplementary Figure 1.
C) An induced fit homology model of KMR-206 (orange) bound to PARP7 shows the propynyl group occupying the hydrophobic cavity formed by Ile631 and hydrophobic amino acids in the D-loop (Blue).
D) KMR-206 inhibits GFP-PARP7 auto-MARylation in a dose-dependent manner in HEK 293T cells. GFP-PARP7 levels and MARylation were detected by western blot analysis using an anti-GFP antibody and an anti-MAR/PAR antibody, respectively. Replicates are shown in Supplementary Figure 2.
E) Quantification of replicates in D and Supplementary Figure 2 using Bio-Rad Image Lab software. Curves were fit in GraphPad Prism using four parameter nonlinear regression.
We used PASTA to profile the selectivity of KMR-206, as well as the recently described PARP7 inhibitor RBN-2397 (Figure 1A), across the PARP family. Similar to Phthal01, we found that KMR-206 potently inhibits PARP7 with an IC50 = 13.7 nM (Figure 1B, Figure S1, and Table S1); however unlike Pthal01, KMR-206 displays ~75-fold selectivity for PARP7 over PARP2 and it does not inhibit PARP1 up to 3 μM. Consistent with the previous study9 that described RBN-2397, we found that RBN-2397 potently inhibits PARP2 (IC50 = 30.3 nM), but does not inhibit most other PARP family members up to 3 μM. However, we did identify two discrepancies: using PASTA, we found that RBN-2397 weakly inhibits PARP1 (IC50 = 2639 nM) and PARP12 (IC50 = 716 nM) whereas the previous study found that RBN-2397 was more potent (i.e., double digit nanomolar inhibition) against these PARPs. While the PARP inhibitor screening assay used in the previous study is similar to PASTA, there are a few differences that could account for this variance. Our in vitro IC50 values for RBN-2397 against PARP1 and PARP12 are congruent with previously obtained cellular IC50 values for RBN-2397 against PARP1 and PARP129, suggesting PASTA accurately predicates the cellular efficacy of PARP inhibitors. KMR-206 is >50-fold selective for PARP7 over most PARP family members beyond PARP1 and PARP2; two exceptions are PARP10 and PARP11, however, KMR-206 still exhibits ~10-fold selectivity for PARP7 over these MARylating PARPs. The excellent family-wide selectivity of KMR-206 for PARP7 over other PARP family members makes it a useful chemical tool for probing PARP7-specific functions in physiological and pathophysiological contexts.
PASTA showed that the addition of the propynyl group at the C-6 position of KMR-206 dramatically improved its selectivity for PARP7 over PARP1 and PARP2 compared to Phthal01. To gain insight into this improved selectivity, we used an induced-fit docking (IFD) approach to predict the binding mode of KMR-206 to a homology model of PARP7 (see STAR Methods). IFD showed that the propynyl group at the C-6 position of KMR-206 occupies the hydrophobic cavity, the entrance to which is controlled by the isoleucine (Ile631, human PARP7 numbering) gatekeeper in PARP7 (Figure 1C). Overlay of the crystal structure of PARP2 bound to olaparib (PDB: 4TVJ) shows that the glutamate (Glu558, human PARP2 numbering) gatekeeper prevents access to the hydrophobic cavity, and thus we predict that it would clash with the C-6 propynyl group of KMR-206. Taken together these modeling studies support the notion that KMR-206 achieves exquisite selectivity for PARP7 over PARP2 (and by extension all PARylating PARPs) by exploiting the hydrophobic cavity in PARP7.
We next sought to determine if KMR-206 inhibits the catalytic activity of PARP7 in cells. In previous studies we showed that that overexpression of GFP-PARP7 in HEK 293T cells leads to MARylation of PARP713, which can be assessed by western blot using an antibody that recognizes MARylation. We found that treatment of GFP-PARP7 expressing HEK 293T cells with KMR-206 lead to a dose-dependent decrease in PARP7 MARylation (EC50 = 8 nM) (Figure 1D,E and Figure S2). These results not only show that KMR-206 is active in cells, but also provides definitive evidence that the MAR signal detected on PARP7 is due to PARP7 alone and not trans-MARylation by another PARP. We also observed that KMR-206 increases GFP-PARP7 protein levels in a dose dependent manner. This is consistent with our previous studies using Phthal0113, as well as studies using a catalytically inactive PARP7 mutant6.
KMR-206 validates the necessity of PARP7 catalytic activity for its repressor function on AHR activity
Having established that KMR-206 inhibits PARP7 catalytic activity in cells, we wanted to determine the effects of KMR-206 on endogenous PARP7 function. For these initial studies, we focused on the role of PARP7 in ligand-mediated AHR transcriptional regulation in mouse embryonic fibroblasts (MEFs)8,15. We treated wild type (WT) MEFs with increasing concentrations of KMR-206 in the presence or absence of the synthetic AHR agonist TCDD, and subsequently measured the expression of a major AHR target gene, CYP1A1, by quantitative reverse transcription PCR (RT-qPCR). Treatment of WT MEFs with KMR-206 in the presence of 1 nM TCDD dramatically increased CYP1A1 mRNA levels in a dose-dependent manner (saturating effects observed at 100 nM KMR-206) (Figure 2A). In the absence of TCDD, KMR-206 had no effect on CYP1A1 mRNA levels (Figure 2A). Likewise, TCDD treatment alone did not induce CYP1A1. In contrast to WT MEFs, PARP7−/− MEFs treated with 1 nM TCDD showed a robust induction of CYP1A1 (Figure 2B). KMR-206 treatment did not further enhance the effects of TCDD treatment on CYP1A1 mRNA levels in PARP7−/− MEFs (Figure 2B). Treatment of WT MEFs with increasing concentrations of TCDD in the presence of 100 nM KMR-206 (saturating dose) led to a strong, dose-dependent induction of CYP1A1 mRNA (Figure 2C). In PARP7−/− MEFs TCDD treatment alone increased the levels of CYP1A1 in a dose-dependent manner (Figure 2D). Treatment of PARP7−/− MEFs with 100 nM KMR-206 did not further increase TCDD-mediated CYP1A1 induction (Figure 2D). Our results with KMR-206 are congruent with recent studies showing that treatment with RBN-2397, or replacement of endogenous PARP7 with a catalytically inactive variant (H532A PARP7), profoundly enhanced TCDD-mediated AHR transcription8. Taken together, these results strongly support the hypothesis that PARP7-mediated MARylation represses AHR activity in a TCDD-dependent manner.
Figure 2. Inhibition of PARP7 catalytic activity by KMR-206 derepresses AHR ligand-mediated gene transcription in mouse embryonic fibroblasts (MEFs).

A) CYP1A1 mRNA levels assessed by qPCR after treatment of wild type (WT) MEFs with increasing concentrations of KMR-206 in the presence (gray bars) or absence (black bars) of the AHR agonist TCDD (1 nM). Error bars represent SEM, n=4.
B) Same as in A except using PARP7−/− MEFs.
C) CYP1A1 mRNA levels assessed by qPCR after treatment of wild type (WT) MEFs with increasing concentrations of TCDD in the presence (gray bars) or absence (black bars) of 100 nM KMR-206.
D) Same as in C, except using PARP7−/− MEFs.
KMR-206 synergistically induces IFN-β expression in the presence of cytosolic NA-sensor ligands
Replacement of WT PARP7 with a catalytically inactive mutant (H532A PARP7) induces the IFN-I, IFN-β4. Consistent with these studies, treatment of MEFs with 100 nM KMR-206 alone induced a 3-fold increase in the IFN-I IFN-β mRNA as determined by RT-qPCR (Figure 3A). Strikingly, when MEFs were stimulated with the RIG-I agonist 3pRNA we observed a synergistic induction of IFN-β mRNA (Figure 3B). Similar results were obtained with the STING agonist cGAMP (Figure 3C). Our results support the hypothesis that the repressor function of PARP7 on IFN-I expression is dependent on its catalytic activity.
Figure 3. Inhibition of PARP7 by KMR-206 stimulates IFN-β transcription and acts synergistically with 3pRNA and cGAMP.

A) MEFs were treated with 100 nM KMR-206 (gray bar) or DMSO (black bar) for 24 h. IFN-β mRNA levels were measured using quantitative RT-PCR. IFN-β levels were normalized to expression of TBP mRNA levels. Error bars represent SEM (n=6).
B) MEFs were treated with the RIG-I ligand 3pRNA (100 ng/ml) in the presence (gray bar) or absence (black bar) of 100 nM KMR-206 for 4 h. IFN-β mRNA levels were assessed as in A.
C)MEFs were treated with the STING ligand cGAMP (5 mg/ml) in the presence (gray bar) or absence (black bar) of 100 nM KMR-206 for 4 h. IFN-β mRNA levels were assessed as in A.
Structurally distinct PARP7 inhibitors with non-intersecting PARP family-wide selectivity profiles induce IFN-I signaling in cancer cells
Treatment of cancer cells (e.g., CT-26 and NCI-H1373) with RBN-2397 induced IFN-β expression and downstream signaling, suggesting that inhibition of PARP7 catalytic activity is responsible for this effect9. Given that other PARP family members have been implicated in IFN-I signaling (e.g., PARP1/2 and PARP1116,17), we reasoned that the non-overlapping selectivities of KMR-206 and RBN-2397 across the PARP family would prove advantageous in studies aimed at validating PARP7 inhibition as the sole driver of IFN-β signaling in cancer cells. To evaluate the effects of these PARP7 inhibitors on IFN-β signaling in CT-26 cells, we monitored changes in STAT1 and STAT1 Tyr701 phosphorylation (pSTAT1) by western blot. Treatment of CT-26 cells with increasing concentrations of either KMR-206 or RBN-2397 for 16 h dose-dependently increased STAT1 and pSTAT1 levels (Figure 4A). Quantification of the STAT1 and pSTAT1 western blot data showed a nearly indistinguishable response between RBN-2397 and KMR-206 (Figure 4B). Moreover, the increase in STAT1 and pSTAT1 by 300 nM (saturating dose) KMR-206 and RBN-2397 showed the same time dependence; noticeable increases in pSTAT1 and STAT1 occurred at 4 h and 16 h, respectively (Figure S4A). Together, these results provide strong evidence the induction of IFN-β signaling in CT-26 cells by KMR-206 and RBN-2397 is due to PARP7 inhibition, and not inhibition of other PARP family members.
Figure 4. Inhibition of PARP7 catalytic activity induces a STING-dependent type I interferon response and PARP7 protein accumulation in CT-26 cells.

A) KMR-206 and RBN-2397 increase STAT1 and phospho-Tyr701-STAT1 (pSTAT1) in a dose-dependent manner. CT-26 cells were treated with increasing concentrations of KMR-206 or RBN-2397 for 16 h.
B) Quantification of the western blots presented in A. Quantification was performed using Bio-Rad Image Lab software. Curves were fit using the four-parameter nonlinear regression in GraphPad Prism. STAT1 and pSTAT1 levels were normalized to tubulin. Error bars represent SD, n=2.
C) KMR-206 and RBN-2397 induce STING degradation and signaling, but not to the same extent as a STING agonist. Treatment as described in A. Note: the tubulin blot is the same as shown in A since the samples were run on the same nitrocellulose membrane for western blot analysis. SE = short exposure; LE = long exposure.
D) KMR-206 and RBN-2397 increase PARP7 levels in a dose-dependent manner. Treatment as in A. Note: the tubulin blot is the same as in A since samples were run on the same nitrocellulose membrane for western blot analysis.
E) Quantification of western blots in D. Quantification performed using Bio-Rad Image Lab software. Curves were fit using the four-parameter nonlinear regression in GraphPad Prism. PARP7 levels were normalized to tubulin. Error bars represent SD, n=2.
F) KMR-206 and RBN-2397 increase IFN-β levels in a STING-dependent manner. CT-26 cells were treated with 300 nM KMR-206 (dark gray) or 300 nM RBN-2397 (light gray) in the presence or absence of the covalent STING inhibitor H-151 (500 nM) for 16 h. IFN-β levels were determined by ELISA (PBL Assay Science). Statistical analysis was performed as one-way ANOVA in GraphPad Prism. **** = p<0.001. Error bars represent SD, n=2.
G) KMR-206 and RBN-2397 increase type I interferon reporter levels in a dose-dependent manner. CT-26 cells stably expressing an IRSE luciferase reporter were treated with increasing concentrations of KMR-206 or RBN-2397 for 18 h. Luciferase levels were measured using a luciferase assay reagent (Promega). Error bars represent SD, n=7.
Previous studies9 showed that RBN-2397-mediated induction of IFN-β is dependent on a functional STING pathway; however, it is unclear if PARP7 acts upstream or downstream of STING. STING activation leads to auto-phosphorylation (Ser172) and activation of TBK1, followed by TBK1-mediated phosphorylation of IRF3 on Ser396. This leads to IRF3 dimerization and nuclear translocation where IRF3 regulates the transcription of IFN-I and other cytokines. Activation of STING by various ligands promotes its ubiquitylation and subsequent degradation by autophagy, attenuating the IFN-I response. Consistent with this, we found that the mouse-specific STING agonist DMXAA18 substantially decreased STING levels and induced the appearance of a higher molecular weight band (Figure 4C). In contrast, both PARP7 inhibitors only slightly decreased STING levels in a dose-dependent (Figure 4C) and time-dependent (Figure S4B) manner. Although this is inconsistent with canonical STING activation, it is possible that PARP7 inhibition activates STING in a non-canonical manner. We therefore examined pTBK1 and pIRF3. In contrast to DMXAA, which robustly induced both pTBK1 and pIRF3, PARP7 inhibition did not induce pTBK1 and only slightly increased pIRF3 (Figure 4C and Supplementary Figure 3). Taken together, these results suggest that PARP7 inhibition regulates IFN-β signaling downstream of TBK1/IRF3.
In certain cancer cells (e.g., NCI-H1373), RBN-2397 decreases cellular viability in a cell-autonomous manner9. Consistent with this finding, KMR-206 dose-dependently decreased the viability of NCI-H1373 cells (Figure S3), but did not decrease viability in CT-26 cells (data not shown). The EC50 for KMR-206 is 104 nM whereas the EC50 for RBN-2397 is 17.8 nM. Why KMR-206 is ~6-fold less potent than RBN-2397 is not clear considering their similar potencies against PARP7 in vitro and their similar efficacies in inducing IFN-I in CT-26 cells. Nevertheless, these results strengthen the notion that the loss of PARP7 catalytic activity decreases viability in NCI-H1373 cells.
PARP7 inhibitors increase endogenous PARP7 levels, and the extent of this increase correlates with the magnitude of the IFN-I transcriptional response
Since we observed an increase in the protein levels of ectopically expressed GFP-PARP7 upon treatment with KMR-206, we hypothesized that KMR-206 and RBN-2397 would increase the levels of endogenous PARP7 in CT-26 cells. In the absence of inhibitor, the levels of endogenous PARP7 were nearly undetectable; however, increasing concentrations of KMR-206 and RBN-2397 dramatically increased PARP7 levels (Figure 4D). Quantification of the western blot data revealed that RBN-2397 caused an unexpected 2-fold increase in PARP7 protein abundance compared to KMR-206 at saturating doses (Figure 4E). Given this difference, we sought to determine if the increase in PARP7 protein levels occurred on similar timescales. The time-dependent increase in PARP7 protein levels was similar for both inhibitors, with maximal PARP7 protein levels occurring ~16 h after the addition of KMR-206 or RBN-2397 (Figure S4C).
Although both PARP7 inhibitors induced similar levels of pSTAT1/STAT1 (Figure 4B), we wondered if the levels of PARP7 inhibitor-induced secreted IFN-β were different between KMR-206 and RBN-2397. Using ELISA, we found that RBN-2397 increased significantly the levels of secreted IFN-β to a greater extent than KMR-206 at saturating doses (Figure 4F). As expected, the PARP7 inhibitor-induced induction of IFN-β was completely blocked by the covalent STING inhibitor H-151 (Figure 4F). Since PARP7 induces IFN-β and given that many PARPs are interferon stimulated genes (ISGs), questioned if IFN-β alone increased PARP7 levels. In contrast to PARP7 inhibitors, recombinant IFN-β did not increase PARP7 levels despite strong induction of pSTAT1/STAT1 (Figure S4D); hence, the PARP7-inhibitor induced stabilization of PARP7 levels is independent of IFN-β.
To determine if the higher levels of RBN-2397-induced IFN-β compared to KMR-206 correlated with higher levels of IFN-β-dependent transcription, we generated an interferon-sensitive response element (ISRE)-firefly luciferase (Luc)—CT-26 cell line using lentiviral transduction. We treated ISRE-Luc—CT-26 cells with increasing concentrations of either KMR-206 or RBN-2397 for 18 h, and then measured Luc-generated luminesce in lysates. While the EC50 values for the two inhibitors were similar, the magnitude of the response was greater (~2-fold) for RBN-2397 compared to KMR-206 at saturating doses (Figure 4G). The extent of the ISRE increases is well correlated with the extent of the PARP7 protein level increases in the presence of saturating inhibitors. Taken together, these results hint at additional mechanisms—beyond catalytic inhibition—by which PARP7 inhibitors regulate IFN-I signaling.
PARP7 inhibition increases PARP7 abundance in the nucleus
To gain insight into how PARP7 inhibitor-mediated increases in PARP7 protein levels could influence IFN-I transcriptional output, we next determined (i) the endogenous PARP7 localization, which is currently unknown, and (ii) if PARP7 localization changes upon inhibitor treatment, as we have observed for other PARPs11. Unfortunately, there is only one validated PARP7 antibody, which in our hands did not work for immunofluorescence (IF). We therefore sought a strategy in which endogenous PARP7 could be replaced with an epitope-tagged variant. We envisioned that the epitope tag would be small enough to not perturb endogenous PARP7 function or localization.
Recently, a versatile, small epitope tag, termed HiBiT19, was developed. Importantly, an antibody against HiBiT has been used in IF applications. Another feature of the HiBiT tag is that it binds with high affinity to LgBiT, the binding of which reconstitutes a luminescent protein akin to Nano luciferase. Critically, the small size of the HiBiT allows for efficient knock-in using CRISPR/Cas9. We therefore generated CT-26 cells in which endogenous PARP7 was replaced with HiBiT-PARP7. HiBiT-PARP7—CT-26 cells were treated with 300 nM KMR-206 or RBN-2397, or vehicle control (DMSO) for 18 h. HiBiT-PARP7 localization was assessed by IF using an anti-HiBiT antibody. In the absence of PARP7 inhibitors, we could not detect HiBiT-PARP7, preventing us for asking if PARP7 localization changes upon inhibitor treatment (Figure 5A). In the presence of KMR-206 and RBN-2397, a nuclear HiBiT signal that colocalized with DAPI could be detected (Figure 5B, C and Figure S5). The HiBiT-PARP7 signal was stronger for RBN-2397 compared to KMR-206, consistent with western blot analysis of endogenous, untagged PARP7. Importantly, no signal was detected in WT CT-26 cells treated with 300 nM RBN-2397, demonstrating the specificity of the HiBiT-PARP7 signal in HiBiT-PARP7—CT-26 cells (Figure 5A). To confirm our localization studies, we biochemically fractionated lysates from WT CT-26 cells treated with or without PARP7 inhibitors (300 nM). Using western blot with a validated PARP7 antibody, PARP7 was not detected in either the cytoplasmic or nuclear fractions; in contrast, PARP7 was detected robustly in the nuclear fraction (Figure 5C). A very faint signal could be detected in the cytoplasmic fraction (Figure 5C). Together, these results show that in CT-26 cells, the PARP7—inhibitor complex is localized predominately to the nucleus.
Figure 5. PARP7 catalytic activity controls its protein abundance in the nucleus.

A) Inhibition of PARP7 with either KMR-206 or RBN-2397 increases nuclear PARP7 protein levels. HiBiT-PARP7 knockin (KI) CT-26 cells were treated with 300 nM KMR, 300 nM RBN-2397, or DMSO for 18 h. WT CT-26 cells were used as a control. HiBiT-PARP7 levels were determined by immunofluorescence staining with an anti-HiBiT antibody followed by an anti-mouse AlexaFluor647 antibody. Nuclei were stained with DAPI. Scale bar = 25 μm.
B) Quantification of DAPI and AlexaFluor647 fluorescence in A across a linear trace of nuclei. Replicate traces across RBN-2397- and KMR-206-treated cells presented in Supplementary Figure 5.
C) PARP7 levels are only detected in the nucleus of CT-26 cells treated with PARP7 inhibitors. CT-26 cells were treated with 300 nM KMR-206 or 300 nM RBN-2397 for 18 h. Cells were fractioned and PARP7 levels were detected by western blot using an anti-PARP7 antibody. An anti-PARP-1 antibody was used a nuclear marker whereas an anti-GAPDH was used as a cytosolic marker.
D) Increases in nuclear PARP7 levels can be detected within 30 min of PARP7 inhibitor treatment. HeLa cells overexpressing GFP-PARP7 and mRuby2-Nup90 (nuclear pore marker) were treated with 300 nM KMR-206, 300 nM RBN-2397, or DMSO and live cell images were taken at 0, 30, and 120 min. Representative images are shown. Scale bar = 20 μm.
Because we could not detect HiBiT-PARP7 in the absence of PARP7 inhibitors, we could not determine if PARP7 inhibitors altered the localization of PARP7. We therefore turned to live-cell imaging experiments using ectopically expressed GFP-PARP7 in HeLa cells, which are commonly used for these types of studies. HeLa cells were transfected with GFP-PARP7 as well as mRuby2-Nup90, which was used as a nuclear marker. These transfected cells were treated with 300 nM RBN-2397, 300 nM KMR-206, or DMSO and localization was monitored via live-cell imaging over a period of 2 h. In the absence of PARP7 inhibitors, GFP-PARP7 localized to the nucleus, consistent with our IF studies using HiBiT-PARP7. In some cells, GFP-PARP7 was found in large puncta in the nucleus (Figure 5D). Strikingly, within 30 min of PARP7 inhibitor treatment, these nuclear puncta disappeared, and GFP-PARP7 was instead localized in a diffuse, pan-nuclear pattern (Figure 5D). The pan-nuclear localization of GFP-PARP7 in the presence of inhibitors is similar to the localization of GFP-tagged, catalytically inactive PARP7. Taken together, these results suggest that PARP7 catalytic activity controls its localization in cells.
DISCUSSION
Considerable attention—both in terms of fundamental research and therapeutic development—has been given to PARylating PARPs (i.e., PARP1, PARP2, and PARP5a/b (Tankyrase1/2)) in large part because multiple classes of potent and selective inhibitors based on distinct chemotypes are available. While genetic tools, such as RNAi and CRISPR/Cas9, have been powerful means to study the biology of the lesser known MARylating PARPs, selective small molecule inhibitors offer unique advantages over genetic strategies, chiefly among them is their ability to directly assess the functional role of PARP catalytic activity in cells. Compared to PARylating PARPs, there is a dearth of inhibitors selective for individual MARylating PARPs, which has hampered studies focused on elucidating the physiological and pathophysiological roles of their catalytic activity. Previously, we uncovered a hydrophobic cavity in MARylating PARPs, the accessibility of which is controlled by a hydrophobic gatekeeper amino acid. The hydrophobic cavity is not accessible in PARylating PARPs because a glutamate in the gatekeeper position blocks the entrance to the hydrophobic cavity. In this study, we exploited differences in the gatekeeper position between PARylating PARPs and MARylating PARPs to rationally convert a pan-PARP inhibitor into a selective PARP7 inhibitor, KMR-206. KMR-206 joins a small, but growing class of selective MARylating PARP inhibitors developed by our group and others that achieve their selectivity, in large part, by accessing the hydrophobic pocket in MARylating PARPs9,11,20,21.
KMR-206 is structurally distinct from the previously described PARP7 inhibitor RBN-2397. KMR-206 is based on a phthalazinone scaffold whereas RBN-2397 is based on a pyridazinone scaffold. When profiled in our PARP inhibitor screening platform, PASTA, KMR-206 and RBN-2397 inhibited PARP7 with similar efficacy, but showed different selectivity across the family. Of particular note, KMR-206 showed better selectivity for PARP7 compared to the PARylating PARP, PARP2. Modeling suggests that the improved PARP7 to PARP2 selectivity is due to a greater engagement of the hydrophobic cavity by KMR-206 versus RBN-2397.
KMR-206 was used to investigate the role of PARP7 catalytic activity in regulating AHR transcription and IFN-I signaling driven by RIG-I and STING in MEFs. KMR-206 synergized with an AHR agonist to enhance AHR-mediated transcription. Similarly, KMR-206 synergized with RIG-I/STING ligands to dramatically induce the expression the IFN-I, IFN-β. Knockout of PARP7 in CT-26 cells ablates the effects of RBN-2397 on STAT1 phosphorylation9, highlighting an on-target effect of PARP7 inhibitors in IFN-I signaling. Collectively, these results strongly support the hypothesis that the catalytic activity (i.e. MARylation) of PARP7 underlies its function as a repressor of AHR transcription and RIG-I/STING-mediated IFN-I signaling.
An open question is how does PARP7-mediated MARylation repress AHR and RIG-I/STING-mediated IFN-I signaling. PARP7 catalyzes both auto- and trans-MARylation of protein substrates, predominately on cysteine13, but other nucleophilic amino acids as well22,23. In principle, auto- and/or trans-MARylation could underlie the repressor activity of PARP7. In the case of trans-MARylation, PARP7 has been shown to MARylate AHR24 as well as regulators of RIG-I/STING-mediated IFN-I signaling22,25. Yet how trans-MARylation of protein targets regulates their function remains an enigma—not just for PARP7, but for many PARP family members that catalyze MARylation.
Another question is whether the repressor activity of PARP7 in AHR transcription is related to its role in RIG-I/STING-mediated IFN-I signaling. While one model suggests that PARP7 can regulate AHR transcription directly via MARylation of AHR, it is also possible that PARP7 regulates AHR transcription indirectly via IFN-I signaling. Indeed, IFN-β can regulate the expression of AHR26 and STING activation can lead to AHR-dependent transcription27. One challenge in deciphering the direct versus indirect effects of PARP7 on AHR signaling is the fact that PARP7 itself is an AHR regulated gene. Uncovering the mechanism by which PARP7 represses RIG-I/STING-mediated IFN-I signaling is a first step toward understanding how PARP7 could potentially regulate AHR transcription indirectly via IFN-I signaling.
It is intriguing that in some cancer cells (e.g., NIH-1373 cells), but not others (CT-26 cells), inhibition of PARP7 by either RBN-2397 or KMR-206 decreases viability in the absence of immune cells. To investigate the mechanism by which RBN-2397 decreases cell viability in a cell-autonomous manner, genome-wide CRISPR interference (CRISPRi) and CRISPR activation (CRISPRa) screens were performed28. Several genes in the IFN-I signaling pathway were identified as either sensitivity or resistance hits, demonstrating the critical role of autocrine IFN-I signaling mediating the effects of RBN-2397 on viability in NIH-1373 cells. The top resistance hit identified was AHR. A recently published genome-wide CRISPR KO screen performed in NIH-1373 cells also identified AHR as one of the top resistance hits29. Interestingly, treatment of certain cancer cells (e.g., MDA-MB-468) with the AHR agonist tapinarof (recently FDA approved for the treatment of severe plaque psoriasis) conferred sensitivity to RBN-239729. Together, these results show that AHR activation is necessary and sufficient for RBN-2397-mediated cancer cell growth inhibition. This is likely due to the regulation of PAPR7 expression levels by AHR, but further studies are needed to further test this idea. Beyond AHR and players in the IFN-I signaling pathway, components of the cohesion complex (e.g., NIPBL) were identified as top resistance hits29. Given the critical role of the cohesion complex for chromosome segregation during cell division, these results show the manifold ways PARP7 inhibition by RBN-2397 can abrogate growth in a cell-autonomous manner in some (NCI-H1373), but not other (CT-26) cancer cells.
Curiously, we found that the RBN-2397 and KMR-206 increased endogenous PARP7 protein levels in CT-26 cells specifically in the nucleus. Previous studies found that a catalytically inactive GFP-PARP7 mutant is expressed at a higher level than WT GFP-PARP7. Additionally, the expression levels of WT GFP-PARP7 could be increased using MG13230. Our results presented here, together with the aforementioned studies, support the hypothesis that PARP7 stability is regulated by its catalytic activity in a ubiquitin-dependent manner. The mechanism by which PARP7 catalytic activity regulates its stability is unclear; however, we and others have identified several ubiquitin E3 ligases that interact with PARP7, including HUWE1 and DTX222,29,31. HUWE1 contains a WWE domain that binds PAR32, whereas DTX2 was recently shown to bind to M/PAR33. In the case of HUWE1 it was shown that PARP7 interacts with WT but not catalytically inactive PARP731, suggesting that the interaction between HUWE1 and PARP7 is dependent on PARP7-mediated MARylation; however, since HUWE1 binds PAR it is possible that another PARP that catalyzes PARylation is also involved. Further studies are needed to elucidate the potential crosstalk between PARP7-mediated MARylation and ubiquitylation, and the potential role this has in regulating PARP7 stability.
Finally, we found that the magnitude of IFN-I-dependent transcription correlated with the levels of PARP7 protein levels in the presence of PARP7 inhibitors. This finding suggests the intriguing possibility that PARP7 inhibitors impact PARP7 function in cells beyond inhibition of MARylation. This phenomenon is not foreign to PARP inhibitor mechanism of action. Indeed, PARP1 inhibitors have been shown to induce “trapping” of PARP1 onto chromatin34. This trapped PARP1 inhibitor:PARP1 complex is thought to drive cancer cell cytoxicity. Intriguingly, the extent of PARP1 trapping varies widely among NAD+-competitive PARP1 inhibitors, and it does not seem to correlate with the potency of inhibition of catalytic activity34. In an analogous way, the PARP7 inhibitor:PARP7 complex —independent of inhibition of catalytic activity—drives IFN-I signaling. This may explain the differences we observed between KMR-206 and RBN-2397 on the magnitude of IFN-I transcriptional activation. Given the clinical relevance of targeting PARP7, a deeper investigation into the mechanism of action of PARP7 inhibitors is paramount.
SIGNIFICANCE
PARP7—an NAD+-consumer that catalyzes the post-translational modification known as mono-ADP-ribosylation (MARylation) — is a potent, negative regulator of the type I interferon (IFN-I) response in cancer cells. In this capacity, PARP7 has garnered attention as a new target in immune-oncology. To date, only one PARP7 inhibitor (RBN-2397) has been reported. In this study, we describe the structure-guided design of a potent and PARP family-wide selective inhibitor of PARP7, KMR-206. KMR-206 potently inhibits auto-MARylation of PARP7 in cells, and together with cytosolic nucleic acid sensor ligands, synergistically induces the expression of the IFN-I IFN-β. In mouse colon carcinoma (CT-26) cells, KMR-206 treatment alone induces IFN-β signaling in a STING-dependent manner. Comparative studies of KMR-206 and RBN-2397 in CT-26 cells suggests the intriguing possibility that the PARP7 inhibitor:PARP7 complex drives IFN-I signaling. Collectively, our results not only validate the role of PARP7 as a repressor of IFN-I signaling, but also show how structurally distinct inhibitors can reveal unanticipated findings with important implications for the mechanism action of PARP7 inhibitors.
LIMITATIONS OF STUDY
This study describes the development of the selective PARP7 inhibitor, KMR-206. The main unexpected finding is that KMR-206 and RBN-2397 differentially affect PARP7 protein levels and IFN-β production in cells despite having similar in vitro potency against PARP7 catalytic activity. We postulate that the PARP7 inhibitor:PARP7 complex may drive the IFN-I response. Of course, we do not have direct evidence supporting this hypothesis, and it is certainly possible that alternative models could explain the differential cellular effects between KMR-206 and RBN-2397. One possibility is that KMR-206 and RBN-2397 have different off-rates, which would impact the duration of PARP7 inhibition in cells. Another possibility is that KMR-206 or RBN-2397 has an unknown off-target that either dampens or enhances the effects of these compounds on IFN-I signaling. Proteome-wide off-target profiling of KMR-206 or RBN-2397 would be necessary to explore this possibility.
STAR Methods
RESOURCE AVAILABILITY
Lead Contact
Further information and requests for resources and reagents should be directed to the lead contact, Michael S. Cohen, PhD (cohenmic@ohsu.edu)
Materials Availability
Materials generated in this study are available upon request to the lead contact.
Data and Code Availability
Raw data is available upon request to the lead contact.
This paper does not report original code.
Any additional information required to reanalyze the data reported in this paper is available from the lead contact upon request
EXPERIMENTAL MODELS AND SUBJECT DETAILS
Mammalian Cell Culture
The following mammalian cell lines were used: HEK 293T (origin: human; age: fetus; cell-type: epithelial; tissue: kidney), NCI-H1373 (origin: human; age: 56 years; ethnicity: Black; gender: male; cell-type: epithelial-like; tissue: lung, adenocarcinoma, stage 3A), CT-26 (origin: mouse; strain: BALB/c; cell-type: fibroblast, N-nitroso-N-methylurethane (NNMU)-induced; tissue: large intestine, colon), HeLa (origin: human; age: 31 years; ethnicity: Black; gender: female; cell-type: epithelial; tissue: uterus, cervix, adenocarcinoma), Mouse embryonic fibroblasts8 (origin: mouse; cell-type: fibroblasts; tissue: skin).
All mammalian cells were cultured at 37°C with 5% CO2. HEK 293T cells were cultured in DMEM + 1X Glutamax + 10% FBS. CT-26 and NCI-H1373 cells were cultured in RPMI-1640 + 10% FBS. ISRE-Luc expressing CT-26 cells were cultured in RPMI-1640 + 10% FBS + 20 μg/mL puromycin (Sigma).
Bacterial Cell Culture
Escherichia coli BL21 (DE3) competent cells.
METHOD DETAILS
CHEMISTRY
General chemistry methods.
1H NMR spectra were recorded on a Bruker DPX spectrometer at 400 MHz. Chemical shifts are reported as parts per million (ppm) downfield from an internal tetramethylsilane standard or solvent references. For air- and water-sensitive reactions, glassware was flame- or oven-dried prior to use and reactions were performed under argon. Dimethylformamide was dried using the solvent purification system manufactured by Glass Contour, Inc. (Laguna Beach, CA). All other solvents were of ACS chemical grade (Fisher Scientific) and used without further purification unless otherwise indicated. Commercially available starting reagents were used without further purification. Analytical thin-layer chromatography was performed with silica gel 60 F254 glass plates (SiliCycle). Flash column chromatography was conducted self-packed columns containing 200–400 mesh silica gel (SiliCycle) on a Combiflash Companion purification system (Teledyne ISCO). High performance liquid chromatography (HPLC) was performed on a Varian Prostar 210 (Agilent) using Polaris 5 C18-A columns (Analytical: 150 × 4.6 mm, 3 μm; Preparative: 150 × 21.2 mm, 5 μm) (Agilent). Low-resolution mass spectra (LR-MS) were acquired on an Advion Mass-express.
Synthesis of KMR-206
See also Data S1: Scheme S1 and NMR spectra.

Compound 1. 5-bromo-phthalide (2 g, 9.44 mmol) was heated to reflux in carbon tetrachloride (CCl4) with Azobisisobutyronitrile (AIBN) (160 mg, 0.944 mmol) and N-Bromosuccinimide, (1.9 g, 10.7 mmol) for 4 h until reaction was completed. The reaction was then filtered and the filtrate was concentrated. The crude mixture was then purified via column purification using combiflash ISCO purification system using a mobile phase gradient from 0 to 30% ethyl acetate in hexanes. 2.35 g of compound 1 was obtained (86% yield). 1H NMR (400 MHz, CDCl3) δ 7.82 − 7.76 (m, 3H), 7.35 (s, 1H).

Compound 2. Under dry conditions, in a clean, oven dried flask, compound 1 (white solid) (2 g, 6.9 mmol) was heated slightly (50°C) under vacuum pressure with dry triphenyl phosphine (1.81 g, 6.9 mmol) for 30 mins. Triphenyl phosphine and compound 1 were both dried over P2O5 overnight prior to starting the reaction. To the dry starting materials, dry THF was added and the reaction was allowed to stir under reflux overnight. A white precipitate formed quickly after reaction started. The white precipitate, compound 2, was filtered out and dried under vacuum. (2.6 g, 80% yield) 1H NMR (400 MHz, CDCl3) δ 10.34 (s, 1H), 8.01 − 7.78 (m, 10H), 7.69 (td, J = 8.0, 3.7 Hz, 7H), 7.59 (d, J = 8.2 Hz, 1H).

Compound 3. Compound 2 (0.475 g, 1.0 mmol) and 2-fluoro-5-formylbenzonitrile (0.180 g, 1.2 mmol) were dissolved DCM (4.0 mL), to this was added triethylamine (0.18 mL, 1.3 mmol) and the reaction was stirred overnight. The reaction mixture was quenched with water (5 mL), extracted with DCM (2 × 10 mL), the organic layer was dried over MgSO4, filtered and evaporated the solvent to yield a pale white solid (0.335 g, 98%). To the crude were added water (2.5 mL), EtOH (2.5 mL) and DMF (0.25 mL). Refluxed the mixture and added Hydrazine hydrate (0.3 mL, 9.7 mmol) and left to reflux overnight. The reaction was cooled and the precipitate was collected by filtration, washed with EtOH (5 mL) and dried under high vacuum to afford compound 3 as a white solid (0.2 g, 60%) 1H NMR (400 MHz, DMSO) δ 12.65 (s, 1H), 8.22 (d, J = 1.9 Hz, 1H), 8.17 (d, J = 8.5 Hz, 1H), 8.02 (dd, J = 8.5, 1.8 Hz, 1H), 7.90 (dd, J = 6.3, 2.3 Hz, 1H), 7.77 − 7.68 (m, 1H), 7.48 (t, J = 9.1 Hz, 1H), 4.38 (s, 2H).

Compound 3 (0.20 g, 0.57 mmol) and potassium hydroxide (0.323 g, 5.75 mmol) were added to ethanol (2 mL) and water (7 mL) and heated at 100° C for 4.5 h. The ethanol was evaporated off and the aqueous was extracted with ethyl acetate (2 × 5mL). The aqueous was then acidified to pH=1 with conc. HCI to form a precipitate which was sonicated, filtered, washed with water and dried under high vacuum to afford a beige solid (0.2 g, 94 % yield). 1H NMR (400 MHz, DMSO) δ 13.23 (s, 1H), 12.69 (s, 1H), 8.24 − 8.14 (m, 2H), 8.00 (d, J = 8.1 Hz, 1H), 7.81 (d, J = 6.8 Hz, 1H), 7.66 − 7.45 (m, 1H), 7.25 (t, J = 9.7 Hz, 1H), 4.37 (s, 2H).

Compound 5. Compound 4 (100 mg, 0.266 mmol) and 6-(piperizino)pyridine-3-carbonitrile (50 mg, 0.266 mmol) were dissolved in 700 uL DMF in a small scintillation vile. 1-propane phosphoric acid cyclic anhydride (338 uL, 0.532 mmol) and DIPEA (140uL, 0.798mmol) were added via syringe and the reaction was stirred until complete conversion of the starting material was observed (2.5 h). The reaction was monitored via TLC using 5% MeOH in DCM with 1–2drops glacial acetic acid (to separate the starting material acid from product). The reaction was then dissolved in ethyl acetate (5mL) and washed with saturated NaCO3, ddH2O, and brine. The organic layer was then concentrated to yield 102mg of compound 5 (70% yield) 1H NMR (400 MHz, DMSO) δ 12.70 (s, 1H), 8.51 (d, J = 2.4 Hz, 1H), 8.20 − 8.13 (m, 2H), 8.00 (dd, J = 8.6, 1.8 Hz, 1H), 7.89 (dd, J = 9.0, 2.5 Hz, 1H), 7.47 − 7.38 (m, 2H), 7.26 (t, J = 9.0 Hz, 1H), 6.92 (d, J = 9.2 Hz, 1H), 4.34 (s, 2H), 3.86 − 3.75 (m, 2H), 3.75 − 3.68 (m, 2H), 3.64 − 3.59 (m, 2H), 3.31 − 3.21 (m, 2H).

Compound 6 (KMR-206). In a clean, oven dried 15mL round bottom flask, Compound 5 (50 mg, 0.092 mmol) was co-evaporated with dry toluene (5 mL) and allowed to sit under high vacuum for 20 min. Dry toluene (1 mL) was added and argon was bubbled through the solution for 10 mins. Under argon pressure, Palladium Tetrakis (10.4 mg, 0.009 mmol) and Tributyl (1-propynyl) tin (30.4 uL, 0.1 mmol) were added and the reaction was refluxed under argon pressure for 3 hours until reaction had reached completion. The crude reaction was purified via dry loading method (1 g silica) on a 4 g silica manual column. The column was initially washed with 100% ethyl acetate to elute excess triphenyl phosphine, followed by 5% MeOH in ethyl acetate to separate impurities and elute desired compound. Fractions containing desired compound were pooled and concentrated to yield 22 mg of compound 6 (KMR-206) (47% yield).
1H NMR (400 MHz, DMSO) δ 12.63 (s, 1H), 8.51 (d, J = 2.2 Hz, 1H), 8.19 (d, J = 8.3 Hz, 1H), 7.96 − 7.86 (m, 2H), 7.78 (dd, J = 8.3, 1.5 Hz, 1H), 7.46 − 7.37 (m, 2H), 7.25 (t, J = 9.3 Hz, 1H), 6.92 (d, J = 8.3 Hz, 1H), 4.33 (s, 2H), 3.83 − 3.75 (m, 2H), 3.75 − 3.64 (m, 2H), 3.64 − 3.57 (m, 2H), 3.33 − 3.28 (m, 2H), 2.08 (s, 3H).
13C NMR (101 MHz, DMSO) δ 164.09, 158.91, 157.63, 155.20, 152.45, 144.25, 140.17, 134.76, 133.98, 131.70, 129.28, 128.36, 127.80, 126.78, 126.50, 123.64, 123.46, 118.58, 116.11, 115.89, 106.59, 95.68, 91.11, 78.87, 45.89, 44.10, 43.55, 41.06, 36.17, 4.02.
HRMS: m/z calculated for [C29H24FN6O2] = 507.1939, observed = 507.1927 ([M+H])
BIOLOGY
Stable Cell Line Production
ISRE-Luc CT-26 cells were produced by lentiviral transduction. 4.0 × 10⁵ CT-26 cells in 800 μL of media were incubated with 200 μL of ISRE Luciferase Reporter Lentivirus (BPS Biosciences, #79824) with 8 μg/mL polybrene. The mixture was centrifuged at 800 xg for 30 min at 25°C. Media was removed and cells were plated in 2 mL of fresh media. 48 h post transduction, cells were selected for with 20 μg/mL puromycin. Following selection, cells were continuously cultured in 20 μg/mL puromycin as described above.
HiBiT-PARP7 CT-26 cells were generated by Synthego via CRISPR/Cas9 knock-in of GTGAGCGGCTGGCGGCTGTTCAAGAAGATTAGC to the PARP7 N-Terminus. The knock-in cell pool was cultured as previously described for CT-26 cells.
PASTA Biochemical PARP screening Assay
N-Terminal 6x His-tagged PARPs and SRPK2 were expressed and purified as previously described35. Proteins were quantified against an in-gel standard curve of bovine serum albumin (BSA) (Bio-Rad) using ImageLab (BioRad).
PARPs 1, 2, 5cat, 6, 8, 10, 11, 12cat, 14wwe, 15cat plate assays were performed as described previously14. 50 μL of 1 μM SRPK2 in PARP Buffer for reaction (PBR) (50 mM HEPES pH 7.5, 100 mM NaCl, 4 mM MgCl2, 0.2 mM TCEP) was added to wells of a Ni-NTA coated 96-well plate (Thermo Scientific) and incubated at room temperature (RT) for 1 h. The solution was removed, and the plate was washed three times with PBST (1X PBS (137 mM NaCl, 2.7 mM KCl, 10mM Na2HPO4, 1.8 mM KH2PO4), 0.1% Tween-20), once with 1X PBS, and once with PBR. Each wash was incubated for 3 min. After washing, varying concentrations of each inhibitor was pre-incubated with 20 μM (2X) 6-a-NAD+. 25 μL of the 2X 6-a-NAD+/inhibitor mixture was added to the plate with 25 μL of 2X PARP. For PARP1 and PARP2, 0.1 mg/mL Activated DNA (Sigma) was supplemented. The reaction mixture was incubated at 30°C for 1 h. The plate was then washed 3 times with PBST and once with PBS. The wells were subjected to a 50 μL click reaction consisting of 100 μM biotin-PEG3-azide, 100 μM Tris[(1-benzyl-1H-1,2,3-triazol-4-yl)methyl] amine (TBTA), 1 mM CuSO4 and 1 mM TCEP in 1X PBS at RT for 30 min. The plate was then washed 3 times with PBST before blocking in 100 μL of 1% milk (Carnation) in PBST at RT for 30 min. The plate was again washed 3 times with PBST and once with PBS before incubation with Strep-HRP (0.05 ng/μL Strep-HRP (Fisher Scientific), 300 ng/μL BSA, 1X PBS) for 30 min at RT. The plate was washed 3 times in PBST and once with PBS before development with QuantaRed (Pierce) per manufacturer directions. The plate was immediately read for fluorescence (Excitation 550 nm, Emission 620 nm) on Spectra Max i3 (Molecular Devices) following development. Three parameter nonlinear regression was performed with GraphPad Prism 9 to obtain IC50 values.
For PARP3, PARP4bc, and PARP16, 200–350 ng of PARP was directly adhered to Ni-NTA coated 96-well plates for 60 min at RT in PBR. PARP3 was activated by Dnick 5’P as previously described36. The plate was washed three times with PBST, once with PBS, and once with PBR. Varying concentrations of inhibitor were pre-incubated with NAD+ and added to the plate (final NAD+ concentration: 100 μM for PARP3, PARP4bc; 400 μM for PARP16). The plate was incubated at 30°C for 60 min, then washed three times with PBST before blocking with 5% milk in PBST. The plate was washed three times with PBST and then incubated with 1:5000 (PARP3) or 1:25000 (PARP4bc, PARP16) Poly/Mono-ADP-ribose antibody (Cell Signaling Technology) in PBST with 2% BSA and 0.05% NaN3 for 30 min at RT. The plate was washed three times with PBST before incubation with 1:5000 (PARP3) or 1:25000 (PARP4bc, PARP16) anti-Rabbit HRP (Jackson ImmunoResearch) in 5% milk in PBST for 30 min at RT. The plate was then washed three times with PBST and once with PBS before developing as described previously.
GST-tagged PARP7 was expressed and purified as previously described37. Proteins were quantified by an in-gel standard curve of BSA (Bio-Rad).
For PARP7, 250 ng of PARP7 was adhered to glutathione coated 96-well plates (Thermo Scientific) in PBR for 60 min at RT. The plate was washed three times with PBST (1X PBS + 0.1% Tween-20), once with PBS, and once with PBR. After washing, varying concentrations of each inhibitor was pre-incubated with 20 μM (2X) 6-a-NAD+. 25 μL of the 2X 6-a-NAD+ was added to wells with 25 μL PBR and incubated at 30°C for 60 min. The plate was washed three times with PBST and once with PBS before performing click conjugation (100 μM biotin-PEG3-Azide, 100 μM TBTA, 1 mM CuSO4, 1 mM TCEP, 1X PBS) for 30 min at RT. The plate was then washed three times with PBST and blocked with 1% milk in PBST. The plate was subsequently washed three times in PBST and once in PBS before incubation with Strep-HRP (300 ng/μL BSA, 0.05 ng/μL Strep-HRP, 1X PBS) for 30 min at RT. The plate was washed three time in PBST and once in PBS before development with QuantaRed as described previously.
Modeling
Due to the lack of experimental structure of PARP7, a homology model was built based on the sequence alignment. 6V3W is the PDB code of PARP12 complex with a small molecule RBN-2397 and used as the template to develop the homology model of the PARP7 catalytic domain. A pharmacophore model was developed and used to place the RBN-2397 and KMR-206 efficiently in the pocket followed by binding affinity assessment in the process of docking. Both the pharmacophore development and docking were carried out by MOE software package from CCG (https://www.chemcomp.com/).
Western Blotting
CT26 cells at 75% confluency were treated with PARP7 inhibitors from 0.01–1 μM for 16 h for the dose-response or at 0.3 μM for the time-course (0–24 hours). As a positive control, cells were treated with DMXAA (10 μg/ml) for 1 h. At the end of treatment, cells were washed once with cold PBS and the plate was frozen in −80°C prior to lysis. For lysis, the plate was thawed on ice, and lysed using a cytosolic lysis buffer (50 mM HEPES pH 7.4, 150 mM NaCl, 1 mM MgCl2, 1% triton X-100) supplemented with 100 μM TCEP, 1X protease inhibitor (Roche), 1X phosphatase inhibitors (Sigma cocktail 2&3), and 30 μM Pan-PARP inhibitor Pthtal01. Lysates were clarified by centrifugation at 14,000 xg at 4°C for 10 minutes. Supernatants were transferred into a new tube and protein concentration was determined using the Bradford assay (Bio-Rad). 4X sample buffer (40% glycerol, 200 mM Tris-HCl (pH 6.8), 8% SDS, 4% β-mercaptoethanol, 0.02% bromophenol blue) was added to normalized lysates and samples were boiled at 95°C for 5 min. Total protein was separated by SDS-PAGE and transferred to nitrocellulose membrane using Trans-Blot Turbo Transfer System (BioRad). Membranes were blocked with 5% milk (Carnation) in TBS (10 mM Tris-HCl pH 7.5, 150 mM NaCl) containing 0.1% Tween-20 (TBST). Membranes were probed overnight at 4°C against the following antibodies (Cell Signaling Technology): STING (1:000, D2P2F), Rig-I (1:1000, D14G6), phospho-STAT1 (Tyr701) (1:000, D4A7), STAT1 (1:000, 9172), phospho-IRF3 (Ser396) (1:1000, 4D4G), IRF3 (1:1000, D6I4C), phospho-TBK1 (Ser172) (1:1000, D52C2), TBK1 (1:1000, D1B4), and tubulin (1:2000, DM1A). PARP7 was detected using an in-house mouse anti-PARP7 antibody38. After TBST washes, blots were incubated with a goat anti-rabbit (1:10000, Jackson Immuno Reseach Labs) or goat anti-mouse (1:5000, Invitrogen) HRP-conjugated secondary antibody in 5% milk in TBST for 1 h at room temperature. Blots were washed with TBST and developed using SuperSignal™ West Pico or Femto chemiluminescent substrate (Thermo Scientific) and imaged on a ChemiDoc Gel Imaging System (BioRad).
MEFs isolated from C57BL/6 mice were plated at a density of 1.0 × 10⁵ cells per mL in a 6-well plate. The following day, cells were treated with DMSO, 100 nM RBN-2397 or 100 nM KMR-206 for 6 hours. Two wells were pooled, and pellets were resuspended in 20 μL of PBST. The cells were lysed in 200 μL of SDS lysis buffer (1% SDS, 100 mM Tris-HCl pH 7.5, 200 mM NaCl, 10% glycerol) supplemented with 1X protease inhibitors cocktail (Merck) and 2 mM DTT. Samples were sonicated using a Bioruptor at low intensity for 2 × 30 s on/off cycles then centrifuge at 20,000 xg for 10 min at 4°C. Protein concentration was determined, and sample diluted with Laemmli buffer and incubated at 95°C for 5 min. 20 μg of protein were separated by SDS-PAGE and transferred to a PVDF membrane. Membranes were blocked for 1 h at room temperature in 5% non-fat milk dissolved in TBST. Membranes were then incubated overnight at 4°C with an in-house generated anti-PARP738 followed by incubation with the appropriate secondary antibodies. PVDF membranes were stripped and incubated with anti-β-actin antibody 1:4000 (Sigma-Aldrich; A-2228).
RNA Extraction and Gene Expression Analysis
CT26 cells, MEFs isolated PARP7+/+ or PARP7−/− mice8 were plated at a density of 1.0 × 10⁵ cells per mL in a 12-well plate. The following day, cells were treated for 24 h with DMSO, 2,3,7,8-tetrachlorodibenzo-p-dioxin (TCDD) (Accustandard; New Haven, CT, USA), KMR-206 or TCDD + KMR-206 at the doses indicated in the figure captions. For the 3pRNA and cGAMP studies, PARP7+/+ MEFs were plated at a density of 1.0 × 10⁵ cells/mL in a 12-well plate. The following day, the cells were transfected with 100 ng/mL 3p-hpRNA (Invivogen) or 5 mg/ml 2’3’-cGAMP (Invivogen) using Lipofectamine 2000 and immediately treated with 100 nM KMR-206 for 4 h. Total RNA was isolated using Aurum™ Total RNA isolation kit (BioRad), and 1 mg of RNA was reverse transcribed using High-Capacity cDNA Reverse Transcription Kit according to the manufacturer’s instructions (Applied Biosystems). Each RT-qPCR reaction consisted of 0.1 μL forward primer, 0.1 μL reverse primer, 5 μL 2X SsoAdvanced Universal SYBR Green Supermix (BioRad), 1 μL of cDNA and dH2O to a total volume of 10 μL. The primers used for TATA-binding protein (TBP) were forward 5’-TTGTACCGCAGCTGCAAAAT-3’ and reverse 5’-TATATTCGGCGTTTCGGGCA-3’, for Cytochrome P450 family 1 subfamily A member 1 (CYP1A1) were forward 5’-TGGTCTCCCTTCTCTACACTCTTGT-3’ and reverse 5’-ATTTTCCCTATTACATTAAATCAATGGTTCT-3’, and for IFN-β were forward 5’-TGGGAGATGTCCTCAACTGC-3’ and reverse 5’-CCAGGAGTAGCTGTTGTACT-3’. All target transcripts were normalized to TBP and analyzed using the comparative cycle threshold (CT) (ΔΔCT) method.
ISRE Luciferase Assay
1.0 × 10⁴ ISRE-Luc CT-26 or WT CT-26 cells were seeded into wells of a white 96-well plate and grown overnight. Compounds were serial diluted at 1000X concentration in DMSO. For dosing, compound dose response curves were dilute 1:100 in culture media, then added at 1:10 dilution to cell culture. Cells were incubated in treatment for 18 h. Following treatment, the plates were developed using ONE-Glo Luciferase Assay system (Promega) per manufacturer directions. The luminescence signal was read on a Spectra Max i3 (Molecular Devices) plate reader with a 2 s integration time. WT CT-26 signal was background subtracted and curves were fit using a four-parameter linear regression in GraphPad Prism 9.
Interferon-β ELISA
CT-26 cells were seeded into a 6-well plate. After 24 h, the growth media was replaced, and cells were treated with inhibitors. After treatment, growth media was harvested and assayed with PBL Verikine Mouse IFN-β ELISA kit following the manufacturer protocol.
HiBiT Staining
5.0 × 10⁵ HiBiT-PARP7 CT-26 or WT CT-26 cells were plated onto coverslips. After 24 h, the cells were treated with PARP7 inhibitors or DMSO for 18 h. The cells were then washed once with cold PBS and fixed with 4% PFA in PBS at RT for 10 min. The coverslips were washed three times in PBS over a 5-minute period. The HiBiT antibody (Promega) was then added at 1:1000 dilution in antibody incubation buffer (3% Horse Serum, 0.5% Triton X-100, 0.025% NaN3, PBS) for 2 h at RT. The coverslips were washed three times in PBST (PBS, 0.1% Tween-20) for 5 min per wash. Subsequently, the coverslips were incubated with 1:1000 AlexaFluor657 anti-Mouse in antibody incubation buffer for 1 h at RT protected from light. Finally, the coverslips were counterstained with 1:5000 DAPI in PBS for 10 min before washing three times in PBST. The coverslips were then mounted onto slides with Citifluor CFMR2 Antifade (Electron Microscopy Sciences) and sealed with CoverGrip (Biotium). Imaging was performed on a Ziess LSM880 confocal laser scanning microscope with Airyscan with a 63x oil objective at 2048×2048 resolution DAPI excitation was performed with a 405 nm laser at low (≤ 1%) laser power. Red fluorophores were excited with a 559 nm laser at 7.5% laser power.
Cellular Fractionation
CT26 cells were culture as described above. Cells were treated with RBN-2397 or KMR-206 for 18h before harvest. Nuclear–cytoplasmic fractionation was carried out using the NE-PER™ Nuclear and Cytoplasmic Extraction Reagents kit (Thermo Fisher Scientific) according to the manufacturer’s protocol.
Live Cell Imaging
Hela cells were seeded and grown in 8-well chambered glass slides (Lab-Tek, Nunc, Cat No. 177402). Cells were subsequently transfected with 100 ng DNA of each of the plasmid constructs (GFP-PARP7 and mRuby2-Nup50-N-10 (Addgene plasmid 55908) using jetOptimus DNA transfection reagent (Polyplus, Cat No. 117–07), according to manufacturer protocol. 10 h after transfection, media containing transfection mixture was removed. Live cell imaging was performed on the Olympus FV1200 microscope equipped with an environmental box. Cells were kept at 37°C and 5% CO2 during the whole course of imaging. All images were taken with the 63x oil objective NA=1,35, sequential acquisition. Acquired images were analyzed using ImageJ software.
Cell Viability Assays
NCI-H1373 cells were seeded in a white 96-well plate (Corning) at a density of 1 × 10³ cells per well. After 24 h, cells were treated with PARP7 inhibitors and incubated at 37°C for 6 days. Cell viability was assessed using CellTiter-Glo (CTG) 2.0 (Promega). After addition of the CTG reagent (following manufacturer protocol), the plate was incubated on an orbital shaker for 15 min (protected from light) at room temperature. Chemiluminescence was measured on a Spectra Max i3 (Molecular Devices), normalized to DMSO-treated wells, and IC50 values were calculated by non-linear regression (three-parameter fit) analysis using Prism 9 (GraphPad).
QUANTIFICATION AND STATISTICAL ANALYSIS
Gene expression data is presented as standard error of the mean from at least three trials. All other data is presented as mean ± standard deviation. All data fitting and statistical analysis was performed using GraphPad Prism software (Version 9.3.1).
Supplementary Material
KEY RESOURCES TABLE
| REAGENT or RESOURCE | SOURCE | IDENTIFIER |
|---|---|---|
| Antibodies | ||
| GFP | Chromotek | Cat# PABG1-100 |
| Tubulin | Cell Signaling Technologies | Cat# 3873 |
| Poly/Mono-ADP Ribose | Cell Signaling Technologies | Cat# 8372 |
| IRF3 | Cell Signaling Technologies | Cat# 11904 |
| p-IRF3 | Cell Signaling Technologies | Cat# 4947 |
| STAT1 | Cell Signaling Technologies | Cat# 9172 |
| p-STAT1 | Cell Signaling Technologies | Cat# 7649 |
| TBK-1 | Cell Signaling Technologies | Cat# 3504 |
| p-TBK-1 | Cell Signaling Technologies | Cat# 5483 |
| STING | Cell Signaling Technologies | Cat# 13647 |
| PARP7 | Rasmussen et al, 202138 | N/A |
| PARP1 | Cell Signaling Technologies | Cat# 9532 |
| GAPDH | Cell Signaling Technologies | Cat# 5174 |
| Actin | Santa Cruz Biotechnology | Cat# sc-47778 |
| His-Tag | Invitrogen | Cat# MA1135A647 |
| Rabbit-HRP | Jackson Immuno Research Labs | Cat# 111035144 |
| Mouse-HRP | Fisher Scientific | Cat# 62-6520 |
| Goat anti-Mouse IgG (H+L) Cross-Adsorbed Secondary Antibody, Alexa Fluor™ 647 | Invitrogen | Cat# A-21235 |
| Bacterial and Virus Strains | ||
| Escherichia coli BL21 (DE3) competent cells | New England BioLabs | Cat# C2527H |
| ISRE Luciferase Reporter Lentivirus | BPS Bioscience | Cat# 79824 |
| HiBiT-Tag | Promega | N/A |
| Chemicals, Peptides, and Recombinant Proteins | ||
| 2’3’-cGAMP | Invivogen | tlrl-nacga23-02 |
| 3p-hp-RNA | Invivogen | tlrl-hprna |
| 6-alkyne-nicotinamide adenine dinucleotide (N-6 alkyne-NAD+) | Jiang et al, 201039; also commercially available from Biolog Life Science Institute | N/A; Biolog Cat# N051 |
| Ampicillin | Fisher Scientific | Cat# BP1760-5 |
| Bacto Tryptone | BD Biosciences | Cat# 211699 |
| Biotin-PEG3-azide | Click chemistry tools | Cat# AZ104 |
| Chloramphenicol | Fisher Scientific | Cat# BP904-100 |
| Deoxyribonucleic acid from calf thymus | Sigma-Aldrich | Cat# D4522 |
| Dextrose | Fisher Scientific | Cat# D16500 |
| DNAse I | Roche | Cat# 10104159001 |
| Dnick 5’P for PARP3 activation36 | IDT | Custom |
| Glycine | Fisher Scientific | Cat# BP381-1 |
| HEPES | Fisher Scientific | Cat# BP310-1 |
| Kanamycin | Fisher Scientific | Cat# BP9065 |
| NP-40 Substitute | Fisher Scientific | Cat# 507517565 |
| Phosphatase inhibitor cocktails 2 and 3 | Sigma | Cat# P5726-1ML, Cat# P0044-1ML |
| Potassium phosphate dibasic | Sigma-Aldrich | Cat# P3786-500g |
| Potassium phosphate monobasic | Sigma-Aldrich | Cat# P9791-100G |
| Sodium phosphate dibasic | Fisher Scientific | Cat# S472-500 |
| Strep-HRP | Fisher Scientific | Cat# NC9705430 |
| TCEP | Fisher Scientific | Cat# PI-20490 |
| Tris[(1-benzyl-1H-1,2,3-triazol-4- yl)methyl]amine (TBTA) | Click chemistry tools | Cat# 1061-100 |
| Triton X-100 | Fisher Scientific | Cat# BP151-500 |
| Yeast extract | Fisher Scientific | Cat# DF0127-07-1 |
| Yeast extract | Fisher Scientific | Cat# DF0127-07-1 |
| β-mercaptoethanol | Sigma-Aldrich | Cat# M3148-100mL |
| β-Nicotinamide adenine dinucleotide | Fisher Scientific | Cat# AAJ6163803 |
| 2,3,7,8-Tetrachlorodibenzo-p-dioxin (TCDD) | Accustandard | Cat# D-404N |
| RBN-2397 | Custom Synthesis | N/A |
| DMSO | Fisher Scientific | Cat# BP231-100 |
| Paraformaldehyde | Fisher Scientific | Cat# 15713S |
| Sodium Azide | Fisher Scientific | Cat# S227I-25 |
| Horse Serum | Thermo Fisher | Cat# 16050122 |
| Citifluor CFMR2 Antifade | Fisher Scientific | Cat# 50-192-7400 |
| CoverGrip | Biotium | Cat# 23005 |
| KMR-206 | This Paper | N/A |
| Critical Commercial Assays | ||
| Aurum™ Total RNA isolation kit | BioRad | Cat# 7326820 |
| QuantaRed™ Enhanced Chemifluorescent HRP Substrate | Thermo-Fisher | Cat# 15159 |
| Mouse IFN Beta ELISA Kit | Fisher Scientific | Cat# 424001 |
| CalPhos Mammalian transfection kit | Fisher Scientific | Cat# NC9567834 |
| ONE-Glo Luciferase Assay System | Promega | Cat# E6110 |
| CellTiter-Glo™ 2.0 Assay | Promega | Cat# G9242 |
| jetOptimus DNA Transfection reagent | Polyplus | Cat# 117-07 |
| SuperSignal West Pico | Fisher Scientific | Cat# PI34080 |
| SuperSignal West Femto | Fisher Scientific | Cat# PI34095 |
| Experimental Models: Cell Lines | ||
| CT-26 | ATCC | Cat# CRL-2683 |
| MEFs | MacPherson et al, 20138 | N/A |
| HEK293T | ATCC | Cat# CRL-3216 |
| HeLa | ATCC | Cat# CCL-2 |
| NCI-H1373 | ATCC | Cat# CRL-5866 |
| Oligonucleotides | ||
| TBP FWD: 5’-TTGTACCGCAGCTGCAAAAT-3’ | MacPherson et al, 20138 | N/A |
| TBP REV: 5’-TATATTCGGCGTTTCGGGCA-3’ | MacPherson et al, 20138 | N/A |
| CYP1A1 FWD: 5’-TGGTCTCCCTTCTCTACACTCTTGT-3’ | MacPherson et al, 20138 | N/A |
| CYP1A1 REV: 5’-ATTTTCCCTATTACATTAAATCAATGGTTCT-3’ | MacPherson et al, 20138 | N/A |
| IFN-B FWD: 5’-TGGGAGATGTCCTCAACTGC-3’ | MacPherson et al, 20138 | N/A |
| IFN-B REV: 5’-CCAGGAGTAGCTGTTGTACT-3’ | MacPherson et al, 20138 | N/A |
| Recombinant DNA | ||
| GFP-PARP7 | Rodriguez et al, 202113 | N/A |
| mRuby2-Nup50-N-10 | Addgene | Plasmid# 55908 |
| Software and Algorithms | ||
| GraphPad Prism 9 | GraphPad | N/A |
| Other | ||
| Ni-NTA Agarose | Qiagen | Cat# 30210 |
| 96-well Ni-NTA coated plate | Thermo Scientific | Cat# 15242 |
| 96-well Glutathione coated plate | Thermo Scientific | Cat# 15240 |
HIGHLIGHTS.
Structure-based design leads to a highly potent and selective PARP7 inhibitor (KMR-206)
KMR-206 synergizes with AHR ligands to induce CYP1A1 expression
KMR-206 synergizes with nucleic acid-sensor ligands to induce IFN-I signaling
The extent of PARP7 inhibitor-mediated IFN-I induction correlates with PARP7 abundance
Acknowledgements
We thank current and past members of the Cohen lab for many fruitful discussions regarding experimental design, data analysis, and preparation of this manuscript. This work was funded by the NIH (NIH 2R01NS088629).
Footnotes
Publisher's Disclaimer: This is a PDF file of an unedited manuscript that has been accepted for publication. As a service to our customers we are providing this early version of the manuscript. The manuscript will undergo copyediting, typesetting, and review of the resulting proof before it is published in its final form. Please note that during the production process errors may be discovered which could affect the content, and all legal disclaimers that apply to the journal pertain.
Declaration of Interests
M.S.C, D.J.S, K.M.R, and S.S are co-inventors on a provisional patent describing the inhibitors in this study.
Inclusion and Diversity
One or more authors of this paper self-identifies as an underrepresented ethnic minority in science. One or more authors of this paper self-identifies as a member of the LGBTQIA+ community.
References
- 1.Decout A, Katz JD, Venkatraman S, and Ablasser A (2021). The cGAS–STING pathway as a therapeutic target in inflammatory diseases. Nat Rev Immunol 21, 548–569. 10.1038/s41577-021-00524-z. [DOI] [PMC free article] [PubMed] [Google Scholar]
- 2.Rehwinkel J, and Gack MU (2020). RIG-I-like receptors: their regulation and roles in RNA sensing. Nat Rev Immunol 20, 537–551. 10.1038/s41577-020-0288-3. [DOI] [PMC free article] [PubMed] [Google Scholar]
- 3.Borden EC (2019). Interferons α and β in cancer: therapeutic opportunities from new insights. Nat Rev Drug Discov 18, 219–234. 10.1038/s41573-018-0011-2. [DOI] [PubMed] [Google Scholar]
- 4.Yamada T, Horimoto H, Kameyama T, Hayakawa S, Yamato H, Dazai M, Takada A, Kida H, Bott D, Zhou AC, et al. (2016). Constitutive aryl hydrocarbon receptor signaling constrains type I interferon–mediated antiviral innate defense. Nat Immunol 17, 687–694. 10.1038/ni.3422. [DOI] [PubMed] [Google Scholar]
- 5.Lüscher B, Ahel I, Altmeyer M, Ashworth A, Bai P, Chang P, Cohen M, Corda D, Dantzer F, Daugherty MD, et al. (2021). ADP-ribosyltransferases, an update on function and nomenclature. Febs J. 10.1111/febs.16142. [DOI] [PMC free article] [PubMed] [Google Scholar]
- 6.Gomez A, Bindesbøll C, Satheesh SV, Grimaldi G, Hutin D, MacPherson L, Ahmed S, Tamblyn L, Cho T, Nebb HI, et al. (2018). Characterization of TCDD-inducible poly-ADP-ribose polymerase (TIPARP/ARTD14) catalytic activity. Biochem J 475, 3827–3846. 10.1042/bcj20180347. [DOI] [PMC free article] [PubMed] [Google Scholar]
- 7.Ma Q, Baldwin KT, Renzelli AJ, McDaniel A, and Dong L (2001). TCDD-Inducible Poly(ADP-ribose) Polymerase: A Novel Response to 2,3,7,8-Tetrachlorodibenzo-p-dioxin. Biochem Bioph Res Co 289, 499–506. 10.1006/bbrc.2001.5987. [DOI] [PubMed] [Google Scholar]
- 8.MacPherson L, Tamblyn L, Rajendra S, Bralha F, McPherson JP, and Matthews J (2013). 2,3,7,8-Tetrachlorodibenzo-p-dioxin poly(ADP-ribose) polymerase (TiPARP, ARTD14) is a mono-ADP-ribosyltransferase and repressor of aryl hydrocarbon receptor transactivation. Nucleic Acids Res 41, 1604–1621. 10.1093/nar/gks1337. [DOI] [PMC free article] [PubMed] [Google Scholar]
- 9.Gozgit JM, Vasbinder MM, Abo RP, Kunii K, Kuplast-Barr KG, Gui B, Lu AZ, Molina JR, Minissale E, Swinger KK, et al. (2021). PARP7 negatively regulates the type I interferon response in cancer cells and its inhibition triggers antitumor immunity. Cancer Cell. 10.1016/j.ccell.2021.06.018. [DOI] [PubMed] [Google Scholar]
- 10.Kirby IT, and Cohen MS (2018). Small-Molecule Inhibitors of PARPs: From Tools for Investigating ADP-Ribosylation to Therapeutics. Curr Top Microbiol, 211–231. 10.1007/82_2018_137. [DOI] [PMC free article] [PubMed] [Google Scholar]
- 11.Kirby IT, Kojic A, Arnold MR, Thorsell A-G, Karlberg T, Vermehren-Schmaedick A, Sreenivasan R, Schultz C, Schüler H, and Cohen MS (2018). A Potent and Selective PARP11 Inhibitor Suggests Coupling between Cellular Localization and Catalytic Activity. Cell Chem Biol 25, 1547–1553.e12. 10.1016/j.chembiol.2018.09.011. [DOI] [PubMed] [Google Scholar]
- 12.Knight ZA, and Shokat KM (2005). Features of Selective Kinase Inhibitors. Chem Biol 12, 621–637. 10.1016/j.chembiol.2005.04.011. [DOI] [PubMed] [Google Scholar]
- 13.Rodriguez KM, Buch-Larsen SC, Kirby IT, Siordia I, Hutin D, Rasmussen M, Grant DM, David LL, Matthews J, Nielsen ML, et al. (2021). Chemical genetics and proteome-wide site mapping reveal cysteine MARylation by PARP-7 on immune-relevant protein targets. Elife 10, e60480. 10.7554/elife.60480. [DOI] [PMC free article] [PubMed] [Google Scholar]
- 14.Kirby IT, Sanderson DJ, and Cohen MS (2021). PASTA: PARP activity screening and inhibitor testing assay. Star Protoc 2, 100344. 10.1016/j.xpro.2021.100344. [DOI] [PMC free article] [PubMed] [Google Scholar]
- 15.Grimaldi G, Rajendra S, and Matthews J (2018). The aryl hydrocarbon receptor regulates the expression of TIPARP and its cis long non-coding RNA, TIPARP-AS1. Biochem Bioph Res Co 495, 2356–2362. 10.1016/j.bbrc.2017.12.113. [DOI] [PubMed] [Google Scholar]
- 16.Fehr AR, Singh SA, Kerr CM, Mukai S, Higashi H, and Aikawa M (2020). The impact of PARPs and ADP-ribosylation on inflammation and host–pathogen interactions. Gene Dev 34, 341–359. 10.1101/gad.334425.119. [DOI] [PMC free article] [PubMed] [Google Scholar]
- 17.Guo T, Zuo Y, Qian L, Liu J, Yuan Y, Xu K, Miao Y, Feng Q, Chen X, Jin L, et al. (2019). ADP-ribosyltransferase PARP11 modulates the interferon antiviral response by mono-ADP-ribosylating the ubiquitin E3 ligase β-TrCP. Nat Microbiol 4, 1872–1884. 10.1038/s41564-019-0428-3. [DOI] [PubMed] [Google Scholar]
- 18.Prantner D, Perkins DJ, Lai W, Williams MS, Sharma S, Fitzgerald KA, and Vogel SN (2012). 5,6-Dimethylxanthenone-4-acetic Acid (DMXAA) Activates Stimulator of Interferon Gene (STING)-dependent Innate Immune Pathways and Is Regulated by Mitochondrial Membrane Potential*. J Biol Chem 287, 39776–39788. 10.1074/jbc.m112.382986. [DOI] [PMC free article] [PubMed] [Google Scholar]
- 19.Schwinn MK, Machleidt T, Zimmerman K, Eggers CT, Dixon AS, Hurst R, Hall MP, Encell LP, Binkowski BF, and Wood KV (2017). CRISPR-Mediated Tagging of Endogenous Proteins with a Luminescent Peptide. Acs Chem Biol 13, 467–474. 10.1021/acschembio.7b00549. [DOI] [PubMed] [Google Scholar]
- 20.Morgan RK, Kirby IT, Vermehren-Schmaedick A, Rodriguez K, and Cohen MS (2018). Rational Design of Cell-Active Inhibitors of PARP10. Acs Med Chem Lett 10, 74–79. 10.1021/acsmedchemlett.8b00429. [DOI] [PMC free article] [PubMed] [Google Scholar]
- 21.Schenkel LB, Molina JR, Swinger KK, Abo R, Blackwell DJ, Lu AZ, Cheung AE, Church WD, Kunii K, Kuplast-Barr KG, et al. (2021). A potent and selective PARP14 inhibitor decreases protumor macrophage gene expression and elicits inflammatory responses in tumor explants. Cell Chem Biol 28, 1158–1168.e13. 10.1016/j.chembiol.2021.02.010. [DOI] [PubMed] [Google Scholar]
- 22.Rodriguez KM, Buch-Larsen SC, Kirby IT, Siordia I, Hutin D, Rasmussen M, Grant DM, David LL, Matthews J, Nielsen ML, et al. (2021). Chemical genetics and proteome-wide site mapping reveal cysteine MARylation by PARP-7 on immune-relevant protein targets. Elife 10, e60480. 10.7554/elife.60480. [DOI] [PMC free article] [PubMed] [Google Scholar]
- 23.Parsons LHP, Challa S, Gibson BA, Nandu T, Stokes MS, Huang D, Lea JS, and Kraus WL (2021). Identification of PARP-7 substrates reveals a role for MARylation in microtubule control in ovarian cancer cells. Elife 10, e60481. 10.7554/elife.60481. [DOI] [PMC free article] [PubMed] [Google Scholar]
- 24.Gomez A, Bindesbøll C, Somisetty VS, Grimaldi G, Hutin D, MacPherson L, Ahmed S, Tamblyn L, Cho T, Nebb HI, et al. (2018). Characterization of TCDD-Inducible Poly-ADP-Ribose Polymerase (TIPARP/ARTD14) Catalytic Activity. The Biochemical journal, BCJ20180347. 10.1042/bcj20180347. [DOI] [PMC free article] [PubMed] [Google Scholar]
- 25.Yamada T, Horimoto H, Kameyama T, Hayakawa S, Yamato H, Dazai M, Takada A, Kida H, Bott D, Zhou AC, et al. (2016). Constitutive aryl hydrocarbon receptor signaling constrains type I interferon–mediated antiviral innate defense. Nature Immunology 17, 687–694. 10.1038/ni.3422. [DOI] [PubMed] [Google Scholar]
- 26.Rothhammer V, Mascanfroni ID, Bunse L, Takenaka MC, Kenison JE, Mayo L, Chao C-C, Patel B, Yan R, Blain M, et al. (2016). Type I interferons and microbial metabolites of tryptophan modulate astrocyte activity and central nervous system inflammation via the aryl hydrocarbon receptor. Nature medicine 22, 586–597. 10.1038/nm.4106. [DOI] [PMC free article] [PubMed] [Google Scholar]
- 27.Damasceno LEA, Cebinelli GCM, Fernandes MF, Nascimento DC, Públio GA, Vinolo MAR, Oliveira SC, Sparwasser T, Cunha TM, Cunha FQ, et al. (2022). STING is an intrinsic checkpoint inhibitor that restrains the TH17 cell pathogenic program. Cell Reports 39, 110838. 10.1016/j.celrep.2022.110838. [DOI] [PMC free article] [PubMed] [Google Scholar]
- 28.Gozgit JM, Vasbinder MM, Abo RP, Kunii K, Kuplast-Barr KG, Gui B, Lu AZ, Molina JR, Minissale E, Swinger KK, et al. (2021). PARP7 negatively regulates the type I interferon response in cancer cells and its inhibition triggers antitumor immunity. Cancer Cell. 10.1016/j.ccell.2021.06.018. [DOI] [PubMed] [Google Scholar]
- 29.Chen H, Diolaiti ME, O’Leary PC, Rojc A, Krogan NJ, Kim M, and Ashworth A (2022). A Whole-Genome CRISPR Screen Identifies AHR Loss as a Mechanism of Resistance to a PARP7 Inhibitor. Mol Cancer Ther 21, 1076–1089. 10.1158/1535-7163.mct-21-0841. [DOI] [PMC free article] [PubMed] [Google Scholar]
- 30.Lu AZ, Abo R, Ren Y, Gui B, Mo J-R, Blackwell D, Wigle T, Keilhack H, and Niepel M (2019). Enabling drug discovery for the PARP protein family through the detection of mono-ADP-ribosylation. Biochem Pharmacol 167, 97–106. 10.1016/j.bcp.2019.05.007. [DOI] [PubMed] [Google Scholar]
- 31.Zhang L, Cao J, Dong L, and Lin H (2020). TiPARP forms nuclear condensates to degrade HIF-1α and suppress tumorigenesis. P Natl Acad Sci Usa 117, 13447–13456. 10.1073/pnas.1921815117. [DOI] [PMC free article] [PubMed] [Google Scholar]
- 32.Wang Z, Michaud GA, Cheng Z, Zhang Y, Hinds TR, Fan E, Cong F, and Xu W (2012). Recognition of the iso-ADP-ribose moiety in poly(ADP-ribose) by WWE domains suggests a general mechanism for poly(ADP-ribosyl)ation-dependent ubiquitination. Genes & development 26, 235–240. 10.1101/gad.182618.111. [DOI] [PMC free article] [PubMed] [Google Scholar]
- 33.Ahmed SF, Buetow L, Gabrielsen M, Lilla S, Chatrin C, Sibbet GJ, Zanivan S, and Huang DT (2020). DELTEX2 C-terminal domain recognizes and recruits ADP-ribosylated proteins for ubiquitination. Sci Adv 6, eabc0629. 10.1126/sciadv.abc0629. [DOI] [PMC free article] [PubMed] [Google Scholar]
- 34.Murai J, Huang SN, Das BB, Renaud A, Zhang Y, Doroshow JH, Ji J, Takeda S, and Pommier Y (2012). Trapping of PARP1 and PARP2 by Clinical PARP Inhibitors. Cancer Res 72, 5588–5599. 10.1158/0008-5472.can-12-2753. [DOI] [PMC free article] [PubMed] [Google Scholar]
- 35.Carter-O’Connell I, Jin H, Morgan RK, David LL, and Cohen MS (2014). Engineering the Substrate Specificity of ADP-Ribosyltransferases for Identifying Direct Protein Targets. J Am Chem Soc 136, 5201–5204. 10.1021/ja412897a. [DOI] [PMC free article] [PubMed] [Google Scholar]
- 36.Langelier M-F, Riccio AA, and Pascal JM (2014). PARP-2 and PARP-3 are selectively activated by 5′ phosphorylated DNA breaks through an allosteric regulatory mechanism shared with PARP-1. Nucleic Acids Res 42, 7762–7775. 10.1093/nar/gku474. [DOI] [PMC free article] [PubMed] [Google Scholar]
- 37.Hutin D, Grimaldi G, and Matthews J (2018). Methods to Study TCDD-Inducible Poly-ADP-Ribose Polymerase (TIPARP) Mono-ADP-Ribosyltransferase Activity. Methods Mol Biology 1813, 109–124. 10.1007/978-1-4939-8588-3_8. [DOI] [PubMed] [Google Scholar]
- 38.Rasmussen M, Tan S, Somisetty VS, Hutin D, Olafsen NE, Moen A, Anonsen JH, Grant DM, and Matthews J (2021). PARP7 and Mono-ADP-Ribosylation Negatively Regulate Estrogen Receptor α Signaling in Human Breast Cancer Cells. Cells 10, 623. 10.3390/cells10030623. [DOI] [PMC free article] [PubMed] [Google Scholar]
- 39.Jiang H, Kim JH, Frizzell KM, Kraus WL, and Lin H (2010). Clickable NAD Analogues for Labeling Substrate Proteins of Poly(ADP-ribose) Polymerases. J Am Chem Soc 132, 9363–9372. 10.1021/ja101588r. [DOI] [PMC free article] [PubMed] [Google Scholar]
Associated Data
This section collects any data citations, data availability statements, or supplementary materials included in this article.
Supplementary Materials
Data Availability Statement
Raw data is available upon request to the lead contact.
This paper does not report original code.
Any additional information required to reanalyze the data reported in this paper is available from the lead contact upon request