Abstract
Background
The Bayesian penalized likelihood PET reconstruction (BPL) algorithm, Q.Clear (GE Healthcare), has recently been clinically applied to clinical image reconstruction. The BPL includes a relative difference penalty (RDP) as a penalty function. The β value that controls the behavior of RDP determines the global strength of noise suppression, whereas the γ factor in RDP controls the degree of edge preservation. The present study aimed to assess the effects of various γ factors in RDP on the ability to detect sub-centimeter lesions.
Methods
All PET data were acquired for 10 min using a Discovery MI PET/CT system (GE Healthcare). We used a NEMA IEC body phantom containing spheres with inner diameters of 10, 13, 17, 22, 28 and 37 mm and 4.0, 5.0, 6.2, 7.9, 10 and 13 mm. The target-to-background ratio of the phantom was 4:1, and the background activity concentration was 5.3 kBq/mL. We also evaluated cold spheres containing only non-radioactive water with the same background activity concentration. All images were reconstructed using BPL + time of flight (TOF). The ranges of β values and γ factors in BPL were 50–600 and 2–20, respectively. We reconstructed PET images using the Duetto toolbox for MATLAB software. We calculated the % hot contrast recovery coefficient (CRChot) of each hot sphere, the cold CRC (CRCcold) of each cold sphere, the background variability (BV) and residual lung error (LE). We measured the full width at half maximum (FWHM) of the micro hollow hot spheres ≤ 13 mm to assess spatial resolution on the reconstructed PET images.
Results
The CRChot and CRCcold for different β values and γ factors depended on the size of the small spheres. The CRChot, CRCcold and BV increased along with the γ factor. A 6.2-mm hot sphere was obvious in BPL as lower β values and higher γ factors, whereas γ factors ≥ 10 resulted in images with increased background noise. The FWHM became smaller when the γ factor increased.
Conclusion
High and low γ factors, respectively, preserved the edges of reconstructed PET images and promoted image smoothing. The BPL with a γ factor above the default value in Q.Clear (γ factor = 2) generated high-resolution PET images, although image noise slightly diverged. Optimizing the β value and the γ factor in BPL enabled the detection of lesions ≤ 6.2 mm.
Keywords: β value, BPL, BSREM, γ factor, Q.Clear, Sub-centimeter lesion
Introduction
18F-fluoro-2-deoxy-d-glucose (18F-FDG) positron emission tomography/computed tomography (PET/CT) has become an important imaging tool for detecting, localizing, characterizing, staging and determining the therapeutic response of cancer [1]. However, conventional PET images have limitations due to relative low spatial image resolution and a generally poor signal-to-noise ratio (SNR) [2]. Recent advances in PET image reconstruction have improved detectability [3, 4]. Image reconstruction methods and their conditions can improve spatial image resolution and the SNR of 18F-FDG PET images [5].
Regularization is desirable for PET image reconstruction, and one of the most powerful regularization techniques for achieving this is the penalized likelihood reconstruction algorithm [6]. Q.Clear (GE Healthcare, Milwaukee, WI, USA) is a Bayesian penalized likelihood reconstruction algorithm that has been clinically applied [7]. This algorithm provides accurately reconstructed images using a penalty function to suppress noise and point spread function (PSF) modeling [8]. The BPL enhances spatial resolution and image quality and augments the standardized uptake value (SUV) of small lesions compared with conventional reconstruction using ordered subset expectation maximization (OSEM) [8–13].
Q.Clear includes a relative difference penalty (RDP) as a penalty function, which is a function of the relative difference between neighboring voxels that avoids excessive smoothing over large edges [14]. The behavior of this penalty function is controlled by a penalization factor (β value), which determines the global strength of noise suppression and is the only user-input variable in Q.Clear. We previously found that an optimized β value in BPL allowed the detection of micro hollow spheres ≤ 10 mm [15]. Howard et al. reported that a BPL with β = 150 was advantageous when evaluating small pulmonary nodules with a diameter of ~ 8 mm [9]. The BPL with a low β value can detect sub-centimeter lesions.
The RDP of the penalty function is defined as [16]:
where Nj is a set of voxels neighboring voxel j, wjk is weight depending on the distance between voxels j and k, and βj is a penalty modulation factor. The γ factor is a penalty parameter that controls the degree of edge preservation. Q.Clear has a fixed γ factor of 2 for the RDP [7, 8]. However, the ability of the γ factor to detect small lesions has not yet been determined. We postulated that BPL with a higher γ factor in the RDP could achieve high-resolution PET images, despite the possibility of apparently unnatural, blocky images [14, 17]. Therefore, the present study aimed to determine the relationship between the β value and γ factor in the penalty function and to quantify the ability of the γ factor in BPL reconstruction to generate high-resolution PET images. To our knowledge, this is the first attempt to investigate the basic characteristics of the γ factor of Q.Clear from a user perspective.
Materials and methods
PET/CT systems
We acquired PET data using a Discovery MI PET/CT system (GE Healthcare, Milwaukee, WI, USA) with a PET scanner comprising a lutetium-based scintillator (LBS) a silicon photomultiplier (SiPM)-PET and 64-slice CT scanners and a LightBurst digital detector with four axially arranged blocks of detectors contained 19,584 Lutetium Yttrium Orthosilicate (LYSO) scintillator crystals of 3.95 × 5.3 × 25 mm in a 4 × 9 matrix.
Phantoms
We used a National Electrical Manufacturers Association International Electrotechnical Commission (NEMA IEC) body phantom (9.84 L capacity) containing spheres with inner diameters of 10, 13, 17, 22, 18, 37 mm and 4.0, 5.0, 6.2, 7.9, 10, 13 mm (NEMA IEC Body Phantom Set™ and Micro Hollow Sphere Set, respectively; Data Spectrum Corp., Durham, NC, USA) (4). The target-to-background ratio (TBR) in the phantom was 4:1 with a background activity concentration of 5.3 kBq/mL. We also evaluated a NEMA IEC phantom with six cold spheres (10–37 mm) containing only non-radioactive water on the same background activity concentration.
Data acquisition and image reconstruction
We acquired three-dimensional PET data for 10 min. All images were reconstructed using BPL + TOF that consisted of 2 iterations of non-TOF OSEM and 3 iterations of the modified block sequential regularized expectation maximization algorithm (BSREM) followed by 8 iterations of BSREM + TOF, all with 28 subsets. The ranges of β values and γ factors in BPL were 50–600 and 2–20, respectively. Gaussian-filtering was not applied to the BPL images. The matrix size was 384 × 384 pixels with sizes of 1.04 × 1.04 mm. The PET images were reconstructed on a workstation running the PET Duetto reconstruction toolbox (GE Healthcare) for MATLAB R2017b (The MathWorks Inc., Natick, MA, USA) available from GE Healthcare through a research collaboration agreement.
Image analyses
The relationship between the β value and the γ factor in BPL was revealed by the results generated by standard NEMA body phantom. We then investigated phantoms containing sub-centimeter spheres were subsequently investigated. All PET datasets were analyzed using PMOD ver. 3.8 software (PMOD Technologies LLC, Zurich, Switzerland).
A circular region of interest (ROI) with the same diameter as a hot sphere was placed on the central slice of each hot sphere under CT imaging guidance. Twelve circular ROIs (diameter, 10 mm) were placed on central slices of each sphere and on slices located ± 1 and ± 2 cm distant from the central slice (total, 60 ROI) as background ROI [15]. The activity concentrations in the all ROIs were recorded. We then calculated the % hot contrast recovery coefficient (CRChot) of the hot spheres, the cold CRC (CRCcold) for the cold spheres [18], background variability (BV) and residual lung error (LE) [19] as follows:
| 1 |
| 2 |
| 3 |
| 4 |
where AChot is the mean measured activity concentration (Bq/mL) of the each hot sphere ROI, ACBG is the average measured activity concentration of the background calculated from the circular ROIs (n = 12) of each sphere size, AH is the activity concentration in the hot sphere (Bq/mL), and AB is the background activity concentration. ACcold is the mean measured activity concentration (Bq/mL) in each cold sphere ROI. SDB,10 mm is the SD of the activity concentration in the background ROI for a hot sphere with a diameter of 10 mm, and ACBG,10 mm is the average activity concentration of the background calculated from each circular ROI (n = 12). AClung is the mean measured activity concentration in a circular ROI with a diameter of 30 mm drawn down the middle of the lung insert in the central slice, and ACBG,37 mm is the average activity concentration of 12 background ROIs with a diameter of 37 mm.
We drew profile curves on the micro-hollow hot spheres ≤ 13 mm and measured the full width at half maximum (FWHM) to assess the spatial resolution of reconstructed PET images.
Results
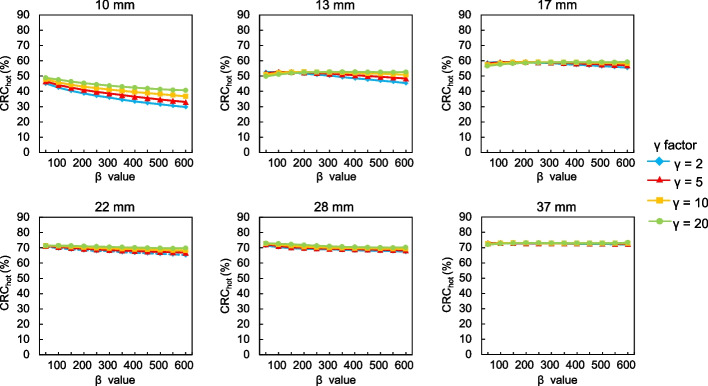
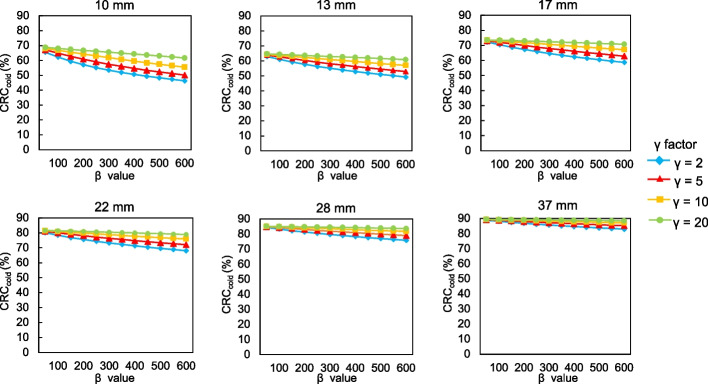
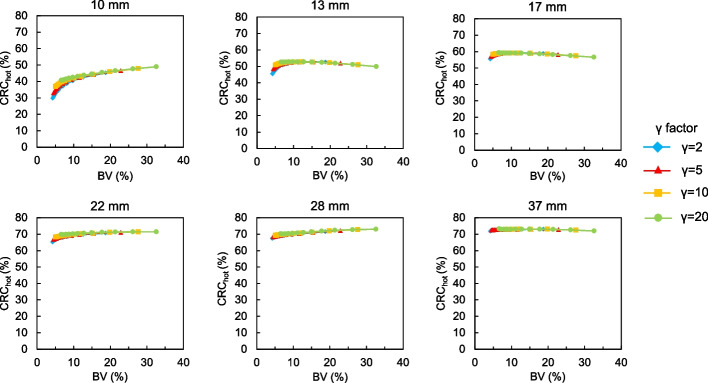
Figures 1 and 2 show CRChot and CRCcold, respectively, as a function of the β values for each γ factor. The trends of CRChot and CRCcold were similar. The CRChot and CRCcold increased as a function of decreasing β values. The CRChot for different β values and γ factors depended on sphere sizes ≤ 13 mm. The CRChot and CRCcold were less affected by differences in the β values and remained stable as the γ factor increased, and CRCcold was particularly remarkable. Figure 3 shows the BV of 10 mm spheres as a function of the β value for each γ factor. The BV decreased as the β value increased. In contrast, the BV increased along with the γ factor for all β values. Figure 4 shows the relationship between the CRChot and BV of hot spheres with diameters of 10, 13, 17, 22, 28 and 37 mm using BPL reconstructions with each γ factor. The curves of CRChot and BV were almost independent of the γ factor for spheres ≥ 17 mm. As the β value increased in 10-mm spheres, CRChot and the BV decreased for all γ factors.
Fig. 1.
Percent hot contrast recovery coefficient (CRChot) of hot spheres as function of β 50–600 for each γ factor
Fig. 2.
Percent cold contrast recovery coefficients (CRCcold) of cold spheres as function of β 50–600 for each γ factor
Fig. 3.
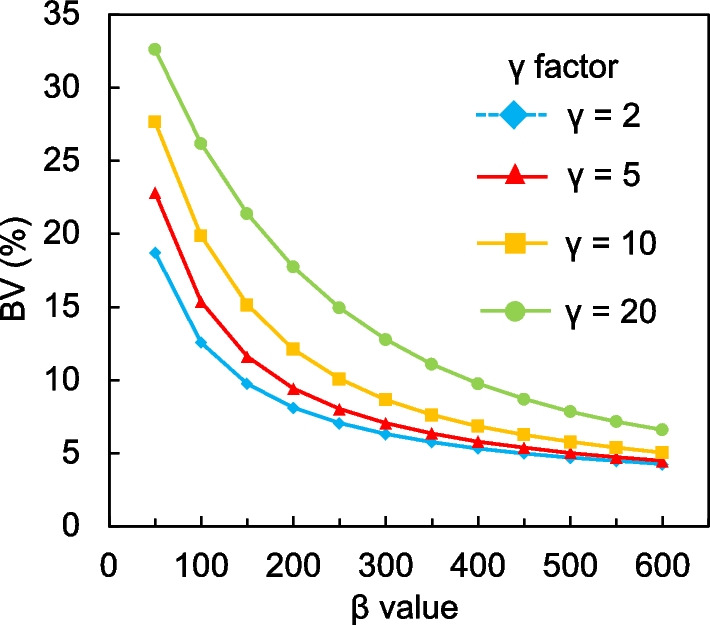
Background variability as a function of β 50–600 for each γ factor
Fig. 4.
Relationship between CRChot and BV curves of hot spheres with diameters of 10, 13, 17, 22, 28 and 37 mm using BPL reconstructions with different γ factors. Curves for BPL run from left to right as β values decrease
Figure 5 shows CRChot as a function of sphere size with different γ factors in BPL images reconstructed using a β value of 200. The CRChot in all γ factors improved as the sphere sizes increased. The CRChot among γ factors were compatible. Table 1 shows the residual LE (%) for different β values and γ factors. The LE of BPL had low (range 4.3‒5.3%) and similar values for β and γ factors. The LE slightly increased as the β value and γ factor, respectively, increased and decreased.
Fig. 5.
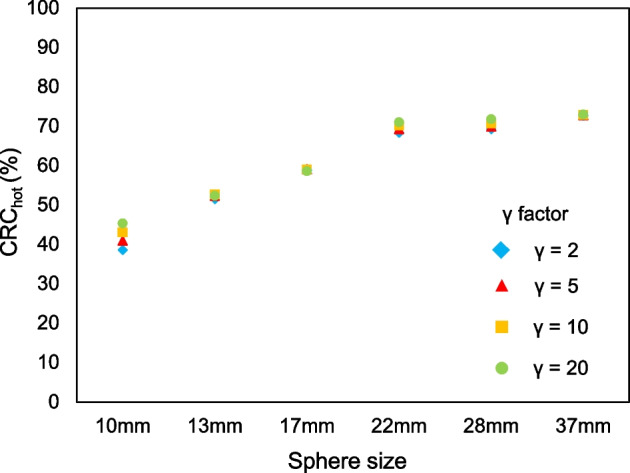
Percent hot contrast recovery coefficient as a function of sphere size with different γ factors in images reconstructed using BPL and β = 200
Table 1.
Residual lung effects (LE %) of different β values and γ factors
| β value | γ factor | |||
|---|---|---|---|---|
| 2 | 5 | 10 | 20 | |
| B50* | 4.4 | 4.3 | 4.3 | 4.3 |
| B100 | 4.5 | 4.4 | 4.4 | 4.3 |
| B150 | 4.6 | 4.5 | 4.4 | 4.3 |
| B200 | 4.7 | 4.6 | 4.5 | 4.4 |
| B250 | 4.8 | 4.7 | 4.5 | 4.4 |
| B300 | 4.8 | 4.7 | 4.6 | 4.5 |
| B350 | 4.9 | 4.7 | 4.6 | 4.5 |
| B400 | 5.0 | 4.8 | 4.7 | 4.5 |
| B450 | 5.0 | 4.9 | 4.7 | 4.6 |
| B500 | 5.1 | 4.9 | 4.8 | 4.6 |
| B550 | 5.2 | 4.9 | 4.8 | 4.6 |
| B600 | 5.3 | 5.0 | 4.8 | 4.7 |
*Bn indicates BPL reconstruction with β value of n
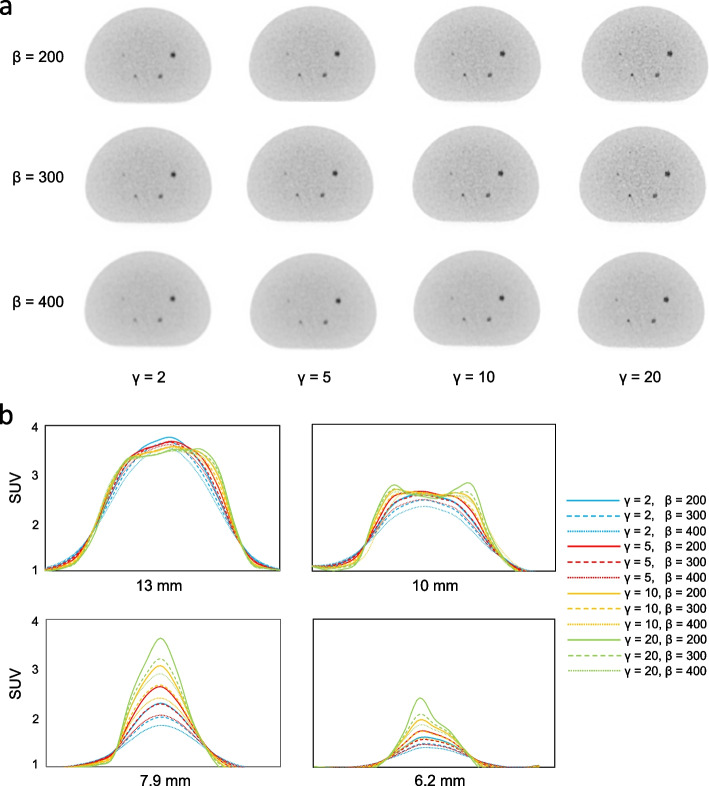
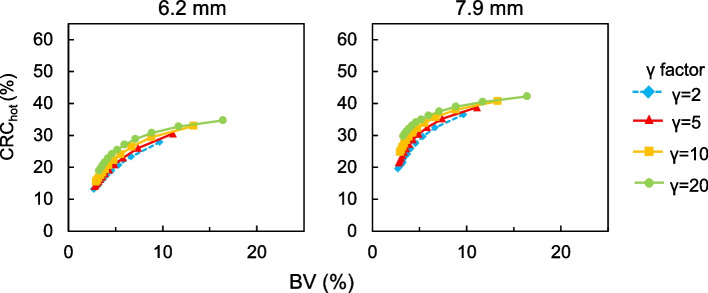
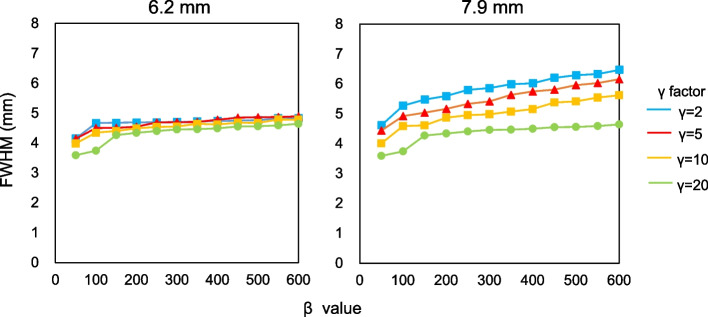
Figure 6 shows representative axial images reconstructed using various β values and γ factors in the phantom study of the sub-centimeter spheres and their profile curves of each spheres. The 6.2-mm hot sphere was clearly recognized at a lower β value and a higher γ factor in images reconstructed using BPL, whereas a γ factor ≥ 10 resulted in increased background noise on images. Figure 7 shows the relationship between CRChot and BV of hot spheres with inner diameters of 6.2 and 7.9 mm determined using BPL reconstruction with each γ factor. As the β value increased, the CRChot and BV of all γ factors decreased. The CRChot was better at comparable noise levels when the γ factor was > 2 than fixed at 2 (the default value in Q.Clear). Figure 8 shows the FWHM determined from a profile curve of hot spheres as a function of the β value (50–600) for each γ factor. The FWHM considerably improved when the β value decreased and the γ factor increased.
Fig. 6.
Representative PET images reconstructed using various β values and γ factors (a) and profile curves of spheres (b). All images are shown as standard uptake values on a scale from 0 to 4
Fig. 7.
Relationships between CRChot and BV curves of hot spheres with inner diameters of 6.2 and 7.9 mm determined using BPL reconstruction with various γ factors. Values for BPL curve run from left to right as β values decrease
Fig. 8.
Full width at half maximum determined by profile curves of 6.2- and 7.9-mm hot spheres as function of β 50–600 for each γ factor
Discussion
We evaluated the relationships between β values and γ factors in BPL reconstruction using a NEMA IEC body phantom and assessed the effects of varying γ factors in RDP on the ability to detect sub-centimeter hot spheres. We found that a γ factor above the default value of 2 in Q.Clear was appropriate and that optimizing these parameters in BPL enabled the detection of sub-centimeter lesions.
The CRChot and CRCcold increased as β values and γ factors, respectively, decreased and increased, but depended on the size of the small spheres (Figs. 1, 2). This might have been due to higher spatial resolution when the β value was low and/or the γ factor is high. The RDP in BPL reconstruction combines activity-dependent quadratic smoothing with a controlled level of edge preservation [17]. Activity-dependent quadratic smoothing ensures that regions of low activity have a larger penalty and are smoother. This property smoothed out sub-centimeter hot spheres with low activity as a function of increasing β values. Since the potential can blur lesions into the background, the β value in BPL should be cautiously applied to smaller lesions [20]. In addition, the spatial resolution reconstructed with BPL is better when the β value is low. This exerts positive effects on the CRChot and CRCcold of small spheres [12, 15]. In contrast, higher γ factors provide better contrast recovery and more accurate quantitation due to improved edge preservation. However, this can be accompanied by undesirably higher noise levels (Figs. 3, 4). We therefore believe that improving contrast using a higher γ factor and controlling concomitant image noise using an adequate β value is more effective.
The CRChot values among γ factors were almost identical (Fig. 5). The BPL, namely Q.Clear, can reach full convergence of image quantitation while suppressing noise using the penalty function [5, 16] and improves the penalty function by suppressing the amplitude of a limiting cycle using BSREM [15, 21–23]. Q.Clear also gives significantly better cold contrast recovery than OSEM reconstruction [24]. Thus, these characteristics of Q.Clear are considered to guarantee improved contrast and quantitation regardless of different γ factors. Slight differences among CRChot were caused by the spatial resolution becoming higher as the γ factor increased. The LE of BPL remained low (range 4.3%‒5.3%) for all β values and γ factors (Table 1). This indicated that corrections using BPL reconstruction were accurate [25]. The LE slightly increased as the β value and γ factor, respectively, increased and decreased [8, 26]. This might have been caused by spillover from the hot uniform area to the lung cold region as a result of smoothing under conditions of higher β values and/or lower γ factors.
The developers of Q.Clear empirically selected a γ factor of 2 as a reasonable trade-off between visual image quality and lesion quantitative accuracy [7, 14]. However, this default value was determined to detect lesions ≥ 10 mm because the supposed detection limit for other PET/CT scanners is ~ 1 cm [27]. The recent replacement of photomultiplier tubes (PMT) with SiPM has led to PET detectors with smaller crystals, better timing resolution and higher photon-detection efficiency [28]. A SiPM-PET/CT system combined with BPL reconstruction can detect of lesions < 1 cm [15, 29, 30]. Thus, the optimal γ factor of BPL in a SiPM-PET/CT scanner should be determined to detect sub-centimeter lesions as described herein. Enhanced BPL capability is critical, especially in oncology where identifying early metastases < 1 cm is essential to selecting optimal patient management strategies [4].
The 6.2-mm hot sphere was recognizable with BPL using higher γ factors (Fig. 6). This is mainly due to the effects of the RDP on BPL. The RDP with intermediate values for the γ factor operates in two modes [31]. A lower γ factor in RDP works as a quadratic mode for smoothing, whereas a higher γ factor works as a linear mode for edge-preserving. Thus, we consider that the edge-preserving effect of the linear function is superior to smoothing under conditions of higher γ values when the BPL yielded a higher contrast for sub-centimeter spheres. Asma et al. reported that a higher γ factor provided more accurate quantitation capacity (measured as contrast and recovery coefficient) due to improved spatial resolution [17]. Ahn et al. also described that as the parameter γ increases, the RDP approaches the total variation penalty, which yields sharper edges, resulting in less bias in quantitation and less partial volume errors, particularly for small lesions [7].
Contrast and image noise in PET images increased together with the γ factor (Fig. 7). This result was consistent with the findings of the Q.Clear developers [7, 14]. A balance between the high contrast and low image noise is needed to determine optimal β values and γ factors [32, 33]. These points should preferably be located in the top left of the plot [8, 32]. The balance between CRChot and BV improved as the γ factor increased. The better contrast/noise trade-offs were β = 200, 250 and 300 when γ factors were 5, 10 and 20, respectively. Setting a γ factor > 2 is appropriate for detecting sub-centimeter lesions. However, very large γ factors produce blocky images [14, 17, 31]. Here, we did not have such visual problems even on PET images with γ factors > 5, although image noise was slightly diverged. The FWHM became smaller when the γ factor increased (Fig. 8). Optimization of a higher γ factor in RDP improved the FWHM and spatial resolution. These results facilitated the detection of sub-centimeter lesions by varying γ factors in RDP.
The present study has several limitations. We generated data based on a phantom that represented a patient with small lesions. Patients with tumor states such as transitioning and lymph node metastases should be investigated. The optimal β value and γ factor in BPL for detecting lesions < 1 cm might differ among PET/CT scanners. Therefore, each PET system should be considered before the present findings could be applied to other image acquisition conditions. Furthermore, the optimal parameter values that we found were valid only for the level of noise and the applied concentration ratio. Tumor and background activity concentrations might be quite variable even within individual patients.
Conclusions
We investigated the effects of different γ factor values for the RDP in BPL reconstruction on the ability to detect sub-centimeter hot spheres in PET images. High and low γ factors, respectively, preserved the edges of reconstructed PET images and promoted image smoothing. The BPL with a γ > 2 provides high-resolution PET images, although image noise slightly diverged. Optimization of the β value and γ factor in BPL enable the detection of lesions ≤ 6 mm.
Acknowledgements
We thank Mr. Hirofumi Kawakami and Mr. Akira Hirayama from GE Healthcare for valuable contributions to the data collection process for this publication. This work was supported in part by a KAKENHI Grant-in-Aid for Young Scientists (No. 21K18097) and from the Ministry of Education, Culture, Sports, Science and Technology (MEXT), the Japanese Government.
Abbreviations
- 18F-FDG
18F-fluoro-2-deoxy-d-glucose
- BSREM
Block sequential regularized expectation maximization
- BV
Background variability
- CRCcold
Cold contrast recovery coefficient
- CRChot
Hot contrast recovery coefficient
- FWHM
Full width at half maximum
- LBS
Lutetium-based scintillator
- LE
Residual lung error
- LYSO
Lutetium Yttrium Orthosilicate
- NEMA IEC
National Electrical Manufacturers Association International Electrotechnical Commission
- OSEM
Ordered subset expectation maximization
- PET/CT
Positron emission tomography/computed tomography
- PMT
Photomultiplier tube
- PSF
Point spread function
- RDP
Relative difference penalty
- ROI
Region of interest
- SiPM
Silicon photomultiplier
- SNR
Signal-to-noise ratio
- SUV
Standardized uptake value
- TBR
Target-to-background ratio
Author contributions
KM, TY and KW designed the study. KW, YK and KI collected the data. TY, SN, TY, RK, SF and YY processed the data. KM, TY, KW and NM interpreted the data. KM, TY and KM drafted and revised the manuscript. All authors read and approved the final version of the manuscript.
Funding
None.
Availability of data and materials
The datasets used and/or analyzed during the current study are available from the corresponding author upon reasonable request.
Declarations
Ethics approval and consent to participate
This article does not contain any studies with human participants performed by any of the authors.
Consent for publication
Not applicable.
Competing interests
Dr. Kei Wagatsuma and Dr. Kenji Ishii were supported by a research Grant from GE Healthcare.
Footnotes
Publisher's Note
Springer Nature remains neutral with regard to jurisdictional claims in published maps and institutional affiliations.
References
- 1.Nishiyama Y, Kinuya S, Kato T, Kayano D, Sato S, Tashiro M, et al. Nuclear medicine practice in Japan: a report of the eighth nationwide survey in 2017. Ann Nucl Med. 2019;33:725–732. doi: 10.1007/s12149-019-01382-5. [DOI] [PubMed] [Google Scholar]
- 2.Soret M, Bacharach SL, Buvat I. Partial-volume effect in PET tumor imaging. J Nucl Med. 2007;48:932–945. doi: 10.2967/jnumed.106.035774. [DOI] [PubMed] [Google Scholar]
- 3.van der Vos CS, Koopman D, Rijnsdorp S, Arends AJ, Boellaard R, van Dalen JA, et al. Quantification, improvement, and harmonization of small lesion detection with state-of-the-art PET. Eur J Nucl Med Mol Imaging. 2017;44:4–16. doi: 10.1007/s00259-017-3727-z. [DOI] [PMC free article] [PubMed] [Google Scholar]
- 4.Aide N, Lasnon C, Kesner A, Levin CS, Buvat I, Iagaru A, et al. New PET technologies: embracing progress and pushing the limits. Eur J Nucl Med Mol Imaging. 2021;48:2711–2726. doi: 10.1007/s00259-021-05390-4. [DOI] [PMC free article] [PubMed] [Google Scholar]
- 5.Miwa K, Wagatsuma K, Iimori T, Sawada K, Kamiya T, Sakurai M, et al. Multicenter study of quantitative PET system harmonization using NIST-traceable 68Ge/68Ga cross-calibration kit. Phys Med. 2018;52:98–103. doi: 10.1016/j.ejmp.2018.07.001. [DOI] [PubMed] [Google Scholar]
- 6.Karaoglanis K, Polycarpou I, Efthimiou N, Tsoumpas C. Appropriately regularized OSEM can improve the reconstructed PET images of data with low count statistics. Hell J Nucl Med. 2015;18:140–145. doi: 10.1967/s002449910209. [DOI] [PubMed] [Google Scholar]
- 7.Ahn S, Ross SG, Asma E, Miao J, Jin X, Cheng L, et al. Quantitative comparison of OSEM and penalized likelihood image reconstruction using relative difference penalties for clinical PET. Phys Med Biol. 2015;60:5733–5751. doi: 10.1088/0031-9155/60/15/5733. [DOI] [PubMed] [Google Scholar]
- 8.Teoh EJ, McGowan DR, Macpherson RE, Bradley KM, Gleeson FV. Phantom and clinical evaluation of the Bayesian penalized likelihood reconstruction algorithm Q.Clear on an LYSO PET/CT system. J Nucl Med. 2015;56:1447–1452. doi: 10.2967/jnumed.115.159301. [DOI] [PMC free article] [PubMed] [Google Scholar]
- 9.Howard BA, Morgan R, Thorpe MP, Turkington TG, Oldan J, James OG, et al. Comparison of Bayesian penalized likelihood reconstruction versus OS-EM for characterization of small pulmonary nodules in oncologic PET/CT. Ann Nucl Med. 2017 doi: 10.1007/s12149-017-1192-1. [DOI] [PubMed] [Google Scholar]
- 10.Teoh EJ, McGowan DR, Bradley KM, Belcher E, Black E, Gleeson FV. Novel penalised likelihood reconstruction of PET in the assessment of histologically verified small pulmonary nodules. Eur Radiol. 2016;26:576–584. doi: 10.1007/s00330-015-3832-y. [DOI] [PMC free article] [PubMed] [Google Scholar]
- 11.Schwyzer M, Martini K, Benz DC, Burger IA, Ferraro DA, Kudura K, et al. Artificial intelligence for detecting small FDG-positive lung nodules in digital PET/CT: impact of image reconstructions on diagnostic performance. Eur Radiol. 2019 doi: 10.1007/s00330-019-06498-w. [DOI] [PubMed] [Google Scholar]
- 12.Rogasch JM, Suleiman S, Hofheinz F, Bluemel S, Lukas M, Amthauer H, et al. Reconstructed spatial resolution and contrast recovery with Bayesian penalized likelihood reconstruction (Q.Clear) for FDG-PET compared to time-of-flight (TOF) with point spread function (PSF) EJNMMI Phys. 2020;7:2. doi: 10.1186/s40658-020-0270-y. [DOI] [PMC free article] [PubMed] [Google Scholar]
- 13.Kurita Y, Ichikawa Y, Nakanishi T, Tomita Y, Hasegawa D, Murashima S, et al. The value of Bayesian penalized likelihood reconstruction for improving lesion conspicuity of malignant lung tumors on 18F-FDG PET/CT: comparison with ordered subset expectation maximization reconstruction incorporating time-of-flight model and point spread function correction. Ann Nucl Med. 2020 doi: 10.1007/s12149-020-01446-x. [DOI] [PubMed] [Google Scholar]
- 14.Asma E, Ahn S, Ross SG, Chen A, Manjeshwar RM. Accurate and consistent lesion quantitation with clinically acceptable penalized likelihood images. In: 2012 IEEE nuclear science symposium and medical imaging conference record (NSS/MIC); 2012. p. 4062–6.
- 15.Miwa K, Wagatsuma K, Nemoto R, Masubuchi M, Kamitaka Y, Yamao T, et al. Detection of sub-centimeter lesions using digital TOF-PET/CT system combined with Bayesian penalized likelihood reconstruction algorithm. Ann Nucl Med. 2020 doi: 10.1007/s12149-020-01500-8. [DOI] [PubMed] [Google Scholar]
- 16.Yamaguchi S, Wagatsuma K, Miwa K, Ishii K, Inoue K, Fukushi M. Bayesian penalized-likelihood reconstruction algorithm suppresses edge artifacts in PET reconstruction based on point-spread-function. Phys Med. 2018;47:73–79. doi: 10.1016/j.ejmp.2018.02.013. [DOI] [PubMed] [Google Scholar]
- 17.Asma E, Ahn S, Qian H, Gopalakrishnan G, Thielemans K, Ross SG, et al. Quantitatively accurate image reconstruction for clinical whole-body PET imaging. In: Proceedings of The 2012 Asia Pacific signal and information processing association annual summit and conference; 2012. p. 1–9.
- 18.Bettinardi V, Presotto L, Rapisarda E, Picchio M, Gianolli L, Gilardi MC. Physical performance of the new hybrid PETCT Discovery-690. Med Phys. 2011;38:5394–5411. doi: 10.1118/1.3635220. [DOI] [PubMed] [Google Scholar]
- 19.National Electrical Manufacturers Association . NEMA standards publication NU 2–2018: performance measurements of positron emission tomographs (PET) National Electrical Manufacturers Association: Rosslyn; 2018. p. 41. [Google Scholar]
- 20.Wangerin KA, Ahn S, Wollenweber S, Ross SG, Kinahan PE, Manjeshwar RM. Evaluation of lesion detectability in positron emission tomography when using a convergent penalized likelihood image reconstruction method. J Med Imaging (Bellingham) 2017;4:011002. doi: 10.1117/1.JMI.4.1.011002. [DOI] [PMC free article] [PubMed] [Google Scholar]
- 21.Aljared A, Alharbi AA, Huellner MW. BSREM reconstruction for improved detection of in-transit metastases with digital FDG-PET/CT in patients with malignant melanoma. Clin Nucl Med. 2018;43:370–371. doi: 10.1097/RLU.0000000000002024. [DOI] [PubMed] [Google Scholar]
- 22.Ahn S, Fessler JA. Globally convergent image reconstruction for emission tomography using relaxed ordered subsets algorithms. IEEE Trans Med Imaging. 2003;22:613–626. doi: 10.1109/tmi.2003.812251. [DOI] [PubMed] [Google Scholar]
- 23.Gnesin S, Kieffer C, Zeimpekis K, Papazyan JP, Guignard R, Prior JO, et al. Phantom-based image quality assessment of clinical (18)F-FDG protocols in digital PET/CT and comparison to conventional PMT-based PET/CT. EJNMMI Phys. 2020;7:1. doi: 10.1186/s40658-019-0269-4. [DOI] [PMC free article] [PubMed] [Google Scholar]
- 24.Lantos J, Mittra ES, Levin CS, Iagaru A. Standard OSEM vs. regularized PET image reconstruction: qualitative and quantitative comparison using phantom data and various clinical radiopharmaceuticals. Am J Nucl Med Mol Imaging. 2018;8:110–118. [PMC free article] [PubMed] [Google Scholar]
- 25.Hsu DFC, Ilan E, Peterson WT, Uribe J, Lubberink M, Levin CS. Studies of a next-generation silicon-photomultiplier-based time-of-flight PET/CT system. J Nucl Med. 2017;58:1511–1518. doi: 10.2967/jnumed.117.189514. [DOI] [PubMed] [Google Scholar]
- 26.te Riet J, Rijnsdorp S, Roef MJ, Arends AJ. Evaluation of a Bayesian penalized likelihood reconstruction algorithm for low-count clinical 18F-FDG PET/CT. EJNMMI Phys. 2019 doi: 10.1186/s40658-019-0262-y. [DOI] [PMC free article] [PubMed] [Google Scholar]
- 27.Hashimoto N, Morita K, Tsutsui Y, Himuro K, Baba S, Sasaki M. Time-of-flight information improved the detectability of subcentimeter spheres using a clinical PET/CT scanner. J Nucl Med Technol. 2018;46:268–273. doi: 10.2967/jnmt.117.204735. [DOI] [PubMed] [Google Scholar]
- 28.Zimmermann PA, Houdu B, Cesaire L, Nakouri I, De Pontville M, Lasnon C, et al. Revisiting detection of in-transit metastases in melanoma patients using digital (18)F-FDG PET/CT with small-voxel reconstruction. Ann Nucl Med. 2021;35:669–679. doi: 10.1007/s12149-021-01608-5. [DOI] [PubMed] [Google Scholar]
- 29.Wu Z, Guo B, Huang B, Hao X, Wu P, Zhao B, et al. Phantom and clinical assessment of small pulmonary nodules using Q.Clear reconstruction on a silicon-photomultiplier-based time-of-flight PET/CT system. Sci Rep. 2021;11:10328. doi: 10.1038/s41598-021-89725-z. [DOI] [PMC free article] [PubMed] [Google Scholar]
- 30.Wu Z, Guo B, Huang B, Zhao B, Qin Z, Hao X, et al. Does the beta regularization parameter of bayesian penalized likelihood reconstruction always affect the quantification accuracy and image quality of positron emission tomography computed tomography? J Appl Clin Med Phys. 2021;22:224–233. doi: 10.1002/acm2.13129. [DOI] [PMC free article] [PubMed] [Google Scholar]
- 31.Nuyts J, Michel C, Brepoels L, Ceuninck LD, Deroose C, Goffin K, et al. Performance of MAP reconstruction for hot lesion detection in whole-body PET/CT: an evaluation with human and numerical observers. IEEE Trans Med Imaging. 2009;28:67–73. doi: 10.1109/TMI.2008.927349. [DOI] [PubMed] [Google Scholar]
- 32.Yoshii T, Miwa K, Yamaguchi M, Shimada K, Wagatsuma K, Yamao T, et al. Optimization of a Bayesian penalized likelihood algorithm (Q.Clear) for (18)F-NaF bone PET/CT images acquired over shorter durations using a custom-designed phantom. EJNMMI Phys. 2020;7:56. doi: 10.1186/s40658-020-00325-8. [DOI] [PMC free article] [PubMed] [Google Scholar]
- 33.Reynes-Llompart G, Gamez-Cenzano C, Vercher-Conejero JL, Sabate-Llobera A, Calvo-Malvar N, Marti-Climent JM. Phantom, clinical, and texture indices evaluation and optimization of a penalized-likelihood image reconstruction method (Q.Clear) on a BGO PET/CT scanner. Med Phys. 2018;45:3214–22. doi: 10.1002/mp.12986. [DOI] [PubMed] [Google Scholar]
Associated Data
This section collects any data citations, data availability statements, or supplementary materials included in this article.
Data Availability Statement
The datasets used and/or analyzed during the current study are available from the corresponding author upon reasonable request.


