

Abstract
Background:
Patients receiving maintenance hemodialysis frequently require ambulance transport to the emergency department (ambulance-ED transport). Identifying predictors of outcomes after ambulance-ED transport, especially the need for timely dialysis, is important to health care providers.
Objective:
The purpose of this study was to derive a risk-prediction model for urgent dialysis after ambulance-ED transport.
Design:
Observational cohort study
Setting and Patients:
All ambulance-ED transports among incident and prevalent patients receiving maintenance hemodialysis affiliated with a regional dialysis program (catchment area of approximately 750 000 individuals) from 2014 to 2018.
Measurements:
Patients’ vital signs (systolic blood pressure, oxygen saturation, respiratory rate, and heart rate) at the time of paramedic transport and time since last dialysis were utilized as predictors for the outcome of interest. The primary outcome was urgent dialysis (defined as dialysis in a monitored setting within 24 hours of ED arrival or dialysis within 24 hours with the first ED patient blood potassium level >6.5 mmol/L) for an unscheduled indication. Secondary outcomes included, hospitalization, hospital length of stay, and in-hospital mortality.
Methods:
A logistic regression model to predict outcomes of urgent dialysis. Discrimination and calibration were assessed using the C-statistic and Hosmer-Lemeshow test.
Results:
Among 878 ED visits, 63 (7.2%) required urgent dialysis. Hypoxemia (odds ratio [OR]: 4.04, 95% confidence interval [CI]: 1.75-9.33) and time from last dialysis of 24 to 48 hours (OR: 3.43, 95% CI: 1.05-11.9) and >48 hours (OR: 9.22, 95% CI: 3.37-25.23) were strongly associated with urgent dialysis. A risk-prediction model incorporating patients’ vital signs and time from last dialysis had good discrimination (C-statistic 0.8217) and calibration (Hosmer-Lemeshow goodness of fit P value .8899). Urgent dialysis patients were more likely to be hospitalized (63% vs 34%), but there were no differences in inpatient mortality or length of stay.
Limitations:
Missing data, requires external validation.
Conclusion:
We derived a risk-prediction model for urgent dialysis that may better guide appropriate transport and care for patients requiring ambulance-ED transport.
Keywords: ambulance, transport, paramedic, emergency health services, dialysis
Abrégé
Contexte:
Les patients sous hémodialyse chronique doivent souvent être transportés au service des urgences par ambulance (transport ambulance-SU). Il est important pour les prestataires de soins de santé que l’on détermine les facteurs prédictifs des résultats après un transport ambulance-SU, en particulier le besoin de dialyze d’urgence.
Objectifs:
Cette étude visait à établir un modèle de prédiction du risque pour une dialyze d’urgence après un transport ambulance-SU.
Type d’étude:
Étude de cohorte observationnelle.
Participants et cadre de l’étude:
Tous les transports ambulance-SU de patients incidents et prévalents recevant une hémodialyse chronique affiliée à un program régional de dialyze (zone desservant environ 750 000 personnes) entre 2014 et 2018.
Prédicteurs:
Les signes vitaux du patient (pression artérielle systolique, saturation en oxygène, fréquence respiratoire et fréquence cardiaque) au moment du transport par ambulance et le temps écoulé depuis la dernière dialyze.
Résultats:
La dialyze d’urgence (définie comme une dialyze en environnement monitoré dans les 24 heures suivant l’arrivée aux urgences ou une dialyze dans les 24 heures avec une première mesure du taux de potassium sanguin aux urgences supérieure à 6,5 mmol/L) pour une indication non programmée. Résultats secondaires: hospitalization, durée du séjour à l’hôpital et mortalité à l’hôpital.
Méthodologie:
Un modèle de régression logistique a servi à prédire le résultat de dialyze d’urgence. La discrimination et la calibration ont été évalués à l’aide de la statistique C et du test Hosmer-Lemeshow.
Résultats:
Parmi les 878 visites aux urgences, 63 (7,2 %) ont nécessité une dialyze d’urgence. L’hypoxémie (rapport de cote [RC]: 4,04; IC à 95 %: 1,75-9,33) et des périodes de 24 à 48 heures (RC: 3,43; IC à 95 %: 1,05-11,9) et de plus de 48 heures (RC: 9,22; IC à 95 %: 3,37-25,23) depuis la dernière dialyze sont les facteurs qui ont été les plus fortement associés à une dialyze d’urgence. Un modèle de prédiction du risque intégrant les signes vitaux du patient et le temps depuis la dernière dialyze a présenté une bonne discrimination (statistique C: 0,8217) et une bonne calibration (qualité de l’ajustement selon Hosmer-Lemeshow: P =,8899). Les patients qui avaient reçu une dialyze d’urgence étaient plus susceptibles d’être hospitalisés (63% contre 34%), mais aucune différence n’a été observée pour le taux de mortalité ou la durée du séjour en milieu hospitalier.
Limites:
Données manquantes, validation externe requise.
Conclusion:
Nous avons dérivé un modèle de prédiction du risque de dialyze d’urgence susceptible de mieux guider le transport et les soins appropriés pour les patients nécessitant un transport ambulance-SU.
Key Points
Predicting outcomes after emergency health services (EHS) transport in dialysis patients is a useful tool for balancing health care resource use with safety for patients.
We developed a risk-prediction model to predict urgent dialysis after ambulance transport to the emergency department using EHS vital signs.
Our model had good calibration and discrimination abilities and found hypoxemia and increased time from last dialysis to be predictors.
Introduction
Dialysis patients frequently present to the emergency department (ED) and utilize emergency medical services (EMS).1 -5 In a study of a large EMS provider, we previously identified that a dialysis population had a near-20-fold higher use of EMS call volume than the general population of the catchment area.4
Given the increased use of EMS by dialysis patients,1,3,4,6 identifying predictors of ED presentations and the need for ambulance transport to the ED (ambulance-ED) is important for ensuring timely patient care and guiding optimal transport trip destination policies for EMS providers. While the transport destination is often based on hospital proximity, other factors such as availability of resources at receiving facilities and ED overcrowding can impact transport decisions and patients’ outcomes.7 -11 A risk-prediction tool to identify those requiring emergent dialysis may help to redirect patients to a dialysis care center who need it, while minimizing the risk of overwhelming select EDs by transporting low-risk patients. To be useful to paramedics, such a tool should only use patients’ historical and clinical information readily available at the time of EMS transport.
In a previous study, we created a risk-prediction model showing that a presenting complaint of weakness, increased time since last dialysis, and certain vital signs were associated with urgent dialysis (monitored dialysis within 24 hours of ED arrival) in a cohort of incident patients receiving hemodialysis.12 While informative, the study did not accurately capture missed dialysis sessions (relying instead on a patient’s general dialysis schedule), nor did it consider specific dialysis indications when determining urgent dialysis. Therefore, the primary objective of this study was to create and internally validate a risk-prediction model for “urgent dialysis” in a contemporary cohort of patients receiving maintenance hemodialysis. Secondary objectives were to compare outcomes following urgent dialysis, including hospitalization, length of stay, and in-hospital death. We hypothesized that vital sign parameters, such as hypoxemia, increased respiratory rate, and increased time from last dialysis, would predict the need for urgent dialysis.
Methods
Study Design and Setting
We analyzed a cohort of all incident and prevalent adult patients receiving maintenance hemodialysis affiliated with a large regional dialysis program (the Nova Scotia Health [NSH] Central Zone Renal Program) from January 2014 to June 2018. The program follows up >500 in-center patients receiving maintenance hemodialysis annually from a catchment population of 700 000 to 750 000 individuals. All patients requiring at least 1 ambulance-ED transport were included and followed up until either death, loss to follow-up, transplantation, transfer to a facility outside the NSH central zone, or the end of the study period. The Strengthening the Reporting of Observational Studies in Epidemiology (STROBE) reporting guidelines were used in the development of this article.13
Selection of Participants
We identified maintenance dialysis patients using an established clinical database at our regional program which uses standardized administrative data.14,15 This method of identification of maintenance dialysis patients has been used by our group in previous work.14,15 To identify initial transport events, the dialysis cohort was linked to EMS data collected from emergency health services (EHS), the sole provider of EMS in Nova Scotia, using 3 of the following 4 pieces of information: patients’ first name, last name, date of birth, and health card number; after this, the exclusion criteria were applied. EHS transports that were interfacility transfers, scheduled outpatient visits, or encounters resulting in nontransport were not included in the analysis. Not all ambulance transport events occurred while patients were actively on maintenance hemodialysis; some occurred before patients were started on maintenance hemodialysis or when they were on peritoneal dialysis before switching to hemodialysis. These events were still captured in our initial linkage but were excluded (as they do not represent ambulance-transport events of patients receiving maintenance hemodialysis at the time of transport). Occasionally, patients were transported to facilities outside the Nova Scotia Health Authority (NSHA) central zone, which was captured in our initial linkage. These events were excluded from the study as we did not have access to electronic medical records for those facilities to collect outcome information.
Outcomes
The primary outcome of interest was “urgent dialysis” after ambulance-ED. Urgent dialysis was defined as (1) either dialysis within 24 hours of presentation to the ED in a monitored setting (intensive care unit, intermediate care unit, ED) or (2) dialysis within 24 hours with the first ED patient blood potassium level >6.5 mmol/L, regardless of whether a patient required monitoring. Our outcome of urgent dialysis used a 24-hour window to better account for time delays around potential retransport of patients and delays in receiving urgent dialysis that would have been of clinical importance but missed with a shorter time window. Therefore, a 24-hour window allowed us to collect more data on outcomes of urgent dialysis. We included urgent dialysis using a 12-hour cutoff as a sensitivity analysis. Monitored dialysis could only be provided in 2 facilities in the NSHA central zone region. In the primary analysis, specific to definition (1), we only included urgent dialysis events whereby there was a clear indication; routinely scheduled dialysis sessions were excluded as outcome events. We chose this definition given the resources required to support patients requiring monitoring and the need to transfer to the only 2 facilities noted above; however, in a sensitivity analysis, we included all events irrespective of indication. For the primary analysis, dialysis indication was collected from electronic medical records and included routine dialysis, hyperkalemia, and fluid overload. This collected indication was based on clinician chart documentation at the time of patient assessment by the consulting nephrologist. In addition, routine indications that had potassium levels above our specified thresholds were included as hyperkalemia events to account for potential missed recordings and to acknowledge that these are generally situations where urgent dialysis would be indicated. Fluid-overloaded patients were not included in our definition of urgent dialysis unless they required cardiac monitoring during that session. In addition to capturing urgent dialysis, we reviewed electronic records to identify patients who were initially transported to a peripheral ED and required retransport to a tertiary urgent-dialysis-capable facility. Secondary outcomes included hospitalization after ambulance-ED transport and in-hospital mortality.
Measurements
Our analysis focused on using clinical thresholds for vital sign parameters that were defined in our previous study and collected from the EMS database.12 These included systolic blood pressure (>160 mm Hg, 100-160 mm Hg and <100 mm Hg), heart rate (>100 beats/min, 100-60 beats/min, and <60 beats/min), respiratory rate (≥20 breaths/min and <20 breaths/min), and oxygen saturation (≥90% and <90%).12
Electronic medical records were reviewed to identify the date and time of the last dialysis received by patients before ambulance-ED transport. This data were then combined with each ambulance-ED transport’s dispatch date and time to determine the time interval from last dialysis to ambulance-ED transport. Canadian Triage and Acuity Scale (CTAS) score was used as a measure of patients’ overall clinical acuity at ED presentation.
Dialysis cohort data were used to describe patient characteristics. The variables collected included dialysis vintage, dialysis type, demographics (age, sex, race), patient comorbidities (coronary artery disease, diabetes, peripheral vascular disease, congestive heart failure), and dialysis access at dialysis initiation (central venous catheter, fistula, peritoneal dialysis catheter). Of note, patients whose initial access was through a peritoneal dialysis catheter represented patients who received peritoneal dialysis before switching to maintenance hemodialysis after which they experienced an ED transport.
Analysis
Baseline characteristics of the patient cohort were described using counts and percentages for categorical data; means and standard deviation for normally distributed continuous data; and medians and first/third quartile for nonnormally distributed continuous data.
Variables in the risk-prediction model included time from the last dialysis (<24 hours, 24-48 hours, and >48 hours), systolic blood pressure, heart rate, respiratory rate, and oxygen saturation. The variables to be included in the risk-prediction model were chosen as an extension of our previous work on risk prediction of urgent dialysis outcomes, and pragmatically, we were interested in variables and information that would be readily available to paramedics at the time of transport. Similar to the previous analysis, patients’ vital signs were the first set of vital signs measured by paramedics, prior to transport. We used only the first measurement of vital sign parameters appreciating that these would have been done prior to any intervention and that a repeat measurement of vitals was inconsistently captured in this data set.12 There were a few differences in the variables we chose to include in this current study. Time since last dialysis was found to be an important predictor in our prior study, although it was categorized as less than 24 hours and greater than 24 hours. In our current study, we extended the time categories to include a time interval of >48 hours to separately capture those with more prolonged time since the last dialysis treatment (including the long dialysis interval). Finally, in the current study, we no longer examined patient complaint due to the variability in event capture and the possibility of misclassification (given the inherent subjectivity of this variable).
For each variable, we reported odds ratios (ORs) and 95% confidence intervals (CIs) for the outcome of urgent dialysis; adjusted ORs were also reported (inclusive of all variables in the model). Analysis was clustered on the individual to account for multiple ED transports associated with a single patient. Logistic regression modeling assumptions were tested, and several internal validity measures were performed.16 Model discrimination was assessed using the C-statistic.17 Model calibration was calculated using the Hosmer-Lemeshow goodness-of-fit test.18 Bootstrapping with 1000 repetitions was used to validate our model internally, and an adjusted C-statistic was calculated using Harrell’s bias-correction method.19 These measures of model performance were also repeated for each of several sensitivity analyses used to test the robustness of our model. Model sensitivity, specificity, positive predictive value, and negative predictive value were calculated for different positive predictive thresholds of 5%, 10%, 15%, and 20%. In addition, the optimal positive predictive threshold that maximized models’ sensitivity and specificity was calculated. Finally, flow charts outlining how patients were transported to facilities based on the predicted need for urgent dialysis were created using positive predictive thresholds of 5% and 10%.
We performed several sensitivity analyses to evaluate how our model performed in different settings:
Using time since last dialysis thresholds of <24 hours and ≥24 hours.
Including EMS clinical impression and CTAS.
Using a shorter time since the last dialysis threshold of <12 hours and ≥12 hours.
Including only those patients receiving maintenance hemodialysis on a thrice-weekly schedule.
Including only incident patients receiving maintenance hemodialysis.
Inclusive of all urgent dialysis outcomes.
Including ED-potassium thresholds >6 mmol/L in the definition of urgent dialysis.
Shortening the time until urgent dialysis criteria from 24 hours to 12 hours.
Missing data were handled using list-wise deletion, and all statistical analyses were performed using Stata version 13.1 (Stata Corp, College Station, Texas). The NSH Research Ethics Board provided institutional ethics approval for this study. The NSHA Research Ethics Board approved this study (research ethics board number 1024060).
Secondary Outcomes
Secondary outcomes included hospitalization, hospital length of stay, and in-hospital mortality and were compared to those of patients requiring urgent dialysis (vs not) using Fisher’s exact test for proportions and the rank sum test for length of stay. Hospital admission and length of stay were also examined in patients who were retransported to the urgent-dialysis-capable facility within 24 hours of ambulance-ED transport. A logistic regression model was developed for predicting the need for hospitalization using vital sign parameters measured during ambulance-ED transport. The model was constructed and evaluated using the same variables and procedures as the study’s primary model predicting the need for urgent dialysis.
Results
Participants
From January 1, 2014, to December 31, 2018, 1970 EMS transport events were identified. After applying the inclusion and exclusion criteria, we obtained a final cohort of 878 ambulance-ED transports from a population of 271 patients receiving maintenance hemodialysis. Details on exclusions are noted in Figure 1.
Figure 1.

Cohort flow chart outlining inclusions and exclusions used to form the ambulance-ED transport event cohort.
Note. ED = emergency department; EHS = emergency health services; NSHA = Nova Scotia Health Authority.
Population Characteristics
The median number of ambulance-ED transports for each patient was 2 (Q1-Q3, 1-4). One hundred fifty-six (58%) patients were male; 115 (42%) were female. The most common cause of end-stage kidney disease was diabetes (N = 105, 38.7%). Additional demographics and comorbidities are noted in Table 1.
Table 1.
Baseline Characteristics of Patients With at Least 1 Ambulance-ED Event During the Study Period (N = 271).
| Variable | N (%) unless specified |
|---|---|
| Age at first ambulance-ED transport (mean years ± SD) | 61.1 ± 15.2 |
| Dialysis vintage at first ambulance-ED transport (median years [Q1-Q3]) | 0.79 [0.18-2.66] |
| Patient race | |
| White | 235 (86.7%) |
| Non-white | 36 (13.3%) |
| Patient sex | |
| Male | 156 (57.6%) |
| Female | 115 (52.4%) |
| Cause of kidney failure | |
| Diabetes | 105 (38.7%) |
| Glomerulonephritis/immune | 41 (15.1%) |
| Polycystic kidney disease | 16 (5.9%) |
| Vascular | 25 (9.2%) |
| Other | 36 (13.3%) |
| Unknown | 48 (17.7%) |
| Comorbidities | |
| Diabetes mellitus | 150 (55.3%) |
| Coronary artery disease | 103 (38.0%) |
| Peripheral vascular disease | 59 (21.8%) |
| Chronic obstructive pulmonary disease | 55 (20.3%) |
| Cerebrovascular disease | 47 (17.3%) |
| Malignancy | 34 (12.5%) |
| Dialysis access at dialysis initiation | |
| Dialysis catheter | 626 (75.7%) |
| Arteriovenous fistula | 164 (19.8%) |
| Peritoneal dialysis catheter | 37 (4.5%) |
Note. ED = emergency department; SD = standard deviation.
Characteristics of EHS Transport Events
Of the 878 ambulance-ED transports, 365 (41.6%) were initially transported to a center capable of urgent dialysis. A total of 239 ambulance-ED transport events occurred >48 hours since the patient’s last dialysis sessions. Of those who received dialysis >48 hours prior, 67 (28.0%) were due to a missed dialysis session, and the remainder were related to the long-dialysis interval. Finally, 108 patients received their last dialysis on a day outside their regular schedule. Characteristics of patients at each ambulance-ED event are noted in Table 2.
Table 2.
Characteristics of Each Ambulance-ED Transport Event (n = 878).
| Variable | N (%) unless otherwise specified |
|---|---|
| Transport to facility capable of urgent dialysis | 365 (41.6) |
| Presenting complaint of patient | |
| Weakness/malaise | 138 (15.7%) |
| Neurological/psychological | 124 (14.1%) |
| Respiratory | 120 (13.7%) |
| Cardiac | 113 (12.9%) |
| Gastrointestinal | 104 (11.9%) |
| Musculoskeletal/trauma | 63 (7.2%) |
| Other | 215 (24.5%) |
| Last dialysis session | |
| On schedule | 679 (79.5%) |
| Missed last session | 67 (7.8%) |
| Last session outside dialysis schedule | 108 (12.5%) |
| Time since last hemodialysis | |
| <24 hours | 327 (42.1%) |
| 24-48 hours | 211 (27.2%) |
| >48 hours | 239 (30.8%) |
| Vital sign parameters (at the time of initial paramedic assessment) | |
| Systolic blood pressure (mm Hg) | |
| >160 | 199 (23.0%) |
| 100-160 | 558 (65.3%) |
| <100 | 97 (11.4%) |
| Heart rate (beats/min) | |
| <60 | 49 (5.6%) |
| 60-100 | 602 (68.8%) |
| >100 | 224 (25.6%) |
| Respiratory rate (breaths/min) | |
| <20 | 487 (55.6%) |
| ≥20 | 389 (44.4%) |
| Oxygen saturation (%) | |
| ≥90 | 760 (89.41%) |
| <90 | 90 (10.59%) |
| Systolic blood pressure (median mm Hg, [Q1-Q3]) | 138 [116-160] |
| Heart rate (median beats/min, [Q1-Q3]) | 86 [74-102] |
| Respiratory rate (median breaths/min, [Q1-Q3]) | 18 [18-22] |
| Oxygen saturation (median %, [Q1-Q3]) | 97 [95-98] |
Note. ED = emergency department.
Primary Outcome
Overall, 94 ambulance-ED events required subsequent urgent dialysis, of which 31 ambulance-ED events were excluded from the primary analysis as they involved treatment for a routine indication on a scheduled dialysis day. In the primary analysis, 63 (7.2%) ambulance-ED events resulted in urgent dialysis (Table 3). A breakdown of indications for urgent dialysis is provided in Table 4.
Table 3.
Primary and Secondary Outcomes of Interest (n = 878).
| Variable | N = 878 (%) |
|---|---|
| Required urgent dialysis | |
| Yes | 63 (7.2%) |
| No | 815 (92.8%) |
| Indications for dialysis <24 hours after ED arrival | |
| Routine dialysis | 298 (82.5%) |
| Hyperkalemia | 37 (10.2%) |
| Fluid overload | 22 (6.1%) |
| Fluid overload and hyperkalemia | 4 (1.1%) |
| Admitted to hospital after ED arrival | |
| Yes | 299 (34.0%) |
| No | 579 (66.0%) |
| Hospital length of stay (median days, [Q1-Q3]) | 7 [4-13] |
| Death in hospital | 20 (6.7%) |
| Location where dialysis was received after ED arrival | |
| Satellite center hemodialysis unit | 315 (37.5%) |
| Urban center hemodialysis unit | 393 (46.8%) |
| ICU, IMCU, or ED | 132 (15.7%) |
| Retransported to ED, ICU, or IMCU <24 hours after satellite ED arrival | n = 81 |
| Admitted to hospital after ED arrival | 43 (53.1%) |
| Hospital length of stay (median days, [Q1-Q3]) | 6 [4-10] |
Note. ED = emergency department; ICU = intensive care unit; IMCU = intermediate care unit.
Table 4.
Secondary Outcomes Stratified by Whether the Patient Received Urgent Dialysis.
| Variable | Required urgent dialysis (n = 63) | Did not require urgent dialysis (n = 815) | P value |
|---|---|---|---|
| Indications for dialysis after ED arrival | N/A | ||
| Scheduled dialysis | 800 (98.1%) | ||
| Hyperkalemia | 37 (58.7%) | 11 (1.3%)a | |
| Fluid overload | 22 (34.9%) | 3 (0.4%)a | |
| Fluid overload and hyperkalemia | 4 (6.3%) | 1 (0.1%)a | |
| Admitted to hospital after ED arrival | |||
| Yes | 38 (60.3%) | 261 (32.0%) | <.001 |
| No | 25 (39.7%) | 554 (68.0%) | |
| Hospital length of stay (median days, [Q1-Q3]) | 4.5 [2-9] | 7 [4-14] | .1 |
| Death in hospital | 1 (1.6%) | 19 (2.3%) | .9 |
Dialysis for indication as noted, but >24 hours from initial presentation.
Note. ED = emergency department; N/A = not available.
Logistic Regression Model
Of the variables included in our logistic model, hypoxemia (OR: 4.04, 95% CI: 1.75-9.33), dialysis interval of 24 to 48 hours (OR: 3.43, 95% CI: 1.05-11.9), and dialysis interval >48 hours (OR: 9.22, 95% CI: 3.37-25.23) were associated with urgent dialysis after an ambulance-ED event (Table 5). The model had good calibration (Hosmer-Lemeshow goodness of fit: P value .8899), and the adjusted C-statistic was 0.8217 consistent with good model discrimination (Figure 2). Model probability cutoff, sensitivity, and specificity for predicting urgent dialysis can be seen in Figure 3. Table 6 provides a full breakdown of positive predictive value, negative predictive value, sensitivity, specificity, and percent correctly classified for different positive probability cutoffs. A total of 157 (17.9%) ambulance-ED events had a predicted probability of requiring urgent dialysis of >10%; 32 (20.4%) of these events required urgent dialysis. Complete flow charts of patient transport destinations and outcomes using predictive probability thresholds of 5% and 10% can be seen in Figures 4 and 5.
Table 5.
Baseline Multivariable Logistic Regression Model Predicting Urgent Dialysis Using Vital Signs Measured During Ambulance-ED Transport and Time Since Last Dialysis (n = 739).
| Variable | Odds ratio | 95% Confidence interval |
|---|---|---|
| Time since last hemodialysis | ||
| <24 hours | Reference | — |
| 24-48 hours | 3.43 | 1.05-11.9 |
| >48 hours | 9.22 | 3.37-25.23 |
| Vital sign parameters | ||
| Systolic blood pressure (mm Hg) | ||
| >160 | 1.81 | 0.82-4.00 |
| 100-160 | Reference | — |
| <100 | 0.58 | 0.71-4.73 |
| Heart rate (beats/min) | ||
| <60 | 1.38 | 0.34-5.56 |
| 60-100 | Reference | — |
| >100 | 1.27 | 0.65-2.49 |
| Respiratory rate (breaths/min) | ||
| <20 | Reference | — |
| ≥20 | 1.48 | 0.73-3.03 |
| Oxygen saturation (%) | ||
| ≥90 | Reference | — |
| <90 | 4.04 | 1.75-9.33 |
Note. Total amount of complete ambulance-ED events = 739. Missing data: systolic blood pressure = 24; heart rate = 3; respiratory rate = 2; oxygen saturation = 28; time since last hemodialysis = 101. Model evaluation: Hosmer-Lemeshow statistic = 0.8899; adjusted C-statistic = 0.8217. ED = emergency department.
Figure 2.
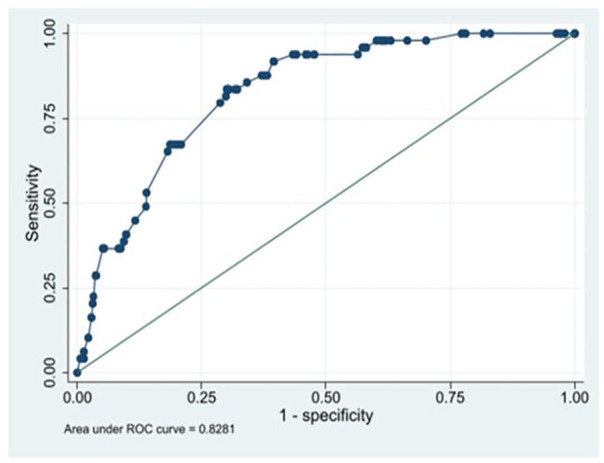
ROC curve showing model discrimination (AUC) for the baseline multivariable logistic regression model used to predict urgent dialysis.Note. ROC = receiver operating characteristic; AUC = area under the curve.
Figure 3.
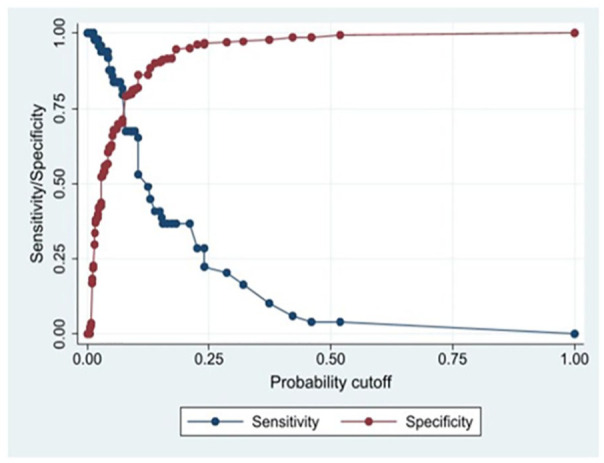
Sensitivity and specificity of the baseline multivariable logistic regression model used to predict urgent dialysis at different positive probability cutoffs.
Table 6.
Sensitivity, Specificity, Positive Predictive Value, Negative Predicative Value, and Percent Correctly Classified by Varying the Model Probability Cut Point From 5% to 25%.
| Probability cutoff, % | Correctly classified, % | Sensitivity, % | Specificity, % | PPV, % | NPV, % |
|---|---|---|---|---|---|
| 5 | 64.5 | 87.76 | 62.90 | 14.38 | 98.64 |
| 10 | 80.78 | 65.31 | 81.88 | 20.38 | 97.08 |
| 15 | 87.28 | 38.78 | 90.72 | 22.89 | 95.43 |
| 20 | 91.07 | 36.73 | 94.93 | 33.95 | 95.48 |
| 25 | 91.88 | 20.41 | 96.96 | 32.26 | 94.49 |
Note. PPV = Positive predictive value; NPV = Negative predictive value.
Figure 4.

Flow chart detailing urgent dialysis outcomes and transport destinations for ambulance-ED events using a probability cutoff of 10%.
Note. ED = emergency department.
Figure 5.

Flow chart detailing urgent dialysis outcomes and transport destinations for ambulance-ED events using a probability cut off of 5%.
Note. ED = emergency department.
Sensitivity Analysis
Sensitivity analyses performed similarly to the baseline model (Supplemental Tables 1–5). Sensitivity analyses using adjusted definitions of urgent dialysis found hypoxemia and time since last dialysis >48 hours to be significant predictors of urgent dialysis (Supplemental Tables 6 and 7). Sensitivity analysis, including routine dialysis indications in urgent dialysis outcomes, performed similarly to the baseline model, although hypertension was found to be an additional significant predictor of urgent dialysis (Supplemental Table 8).
Secondary Outcomes
Overall, 299 (34%) ambulance-ED transports resulted in admission to hospital with a median length of stay of 7 days (4-13) (Table 3). Of the admitted patients, 20 (2.3%) patients died in hospital. A total of 38 (63.3%) admissions occurred among those needing urgent dialysis versus 261 (32%) among those who did not (P < .001) (Table 4). There were no significant differences in either in-hospital mortality or hospital length of stay. Overall, 81 (9.2%) patients who required ambulance-ED transports were retransported to an urgent-dialysis-capable facility within 24 hours of ED arrival. A model designed to predict hospitalization is shown in Table 7, which had good calibration (Hosmer-Lemeshow test = 0.7436) but was below the threshold for modest discrimination (C-statistic = 0.6675).
Table 7.
Logistic Model Predicting Hospitalization Using Vital Signs Measured During Ambulance-ED Transport and Time Since Last Dialysis (n = 739).
| Variable | Odds ratio | 95% Confidence interval |
|---|---|---|
| Time since last hemodialysis | ||
| <24 hours | Reference | — |
| 24-48 hours | 1.28 | 0.86-1.91 |
| >48 hours | 1.93 | 1.30-2.86 |
| Vital sign parameters | ||
| Systolic blood pressure (mm Hg) | ||
| >160 | 0.75 | 0.49-1.15 |
| 100-160 | Reference | — |
| <100 | 1.83 | 1.15-2.95 |
| Heart rate (beats/min) | ||
| <60 | 1.02 | 0.47-2.23 |
| 60-100 | Reference | — |
| >100 | 2.38 | 1.59-3.58 |
| Respiratory rate (breaths/min) | ||
| <20 | Reference | — |
| ≥20 | 1.29 | 0.90-1.85 |
| Oxygen saturation (%) | ||
| ≥90 | Reference | — |
| <90 | 1.64 | 0.91-2.95 |
Note. Total amount of complete ambulance-ED events = 739. Missing data: systolic blood pressure = 24; heart rate = 3; respiratory rate = 2; oxygen saturation = 28; time since last hemodialysis = 101. Model evaluation: Hosmer-Lemeshow statistic = 0.7436; C-statistic = 0.6675. ED = emergency department.
Discussion
While there is existing literature on the use of EMS by patients receiving hemodialysis, there is limited research on risk-prediction models to optimize transport decisions. Previous studies have evaluated prediction tools to plan health care approaches for patients20,21; however, many do not specifically deal with transport decisions made by paramedics based on whether a patient will need monitored dialysis. Our previous study aimed to address this gap in the literature by developing a risk-prediction model for urgent dialysis.12
This current study differs from our previous analysis. Here, we included the indication for dialysis as a component of our definition of urgent dialysis. In addition, our current study included prevalent and incident patients receiving maintenance hemodialysis and those individuals not on a thrice-weekly schedule. This latter inclusion ensures that our risk-prediction model is more widely generalizable to clinical practice, where different schedules and frequencies are common. Our study also manually collected information on the last dialysis session before ambulance-ED transport, which allowed us to account for missed dialysis treatments and generate more accurate thresholds when determining the time since last dialysis for each event. This allowed us to broaden our time from last dialysis thresholds to include 24 to 48 hours and >48 hours, which are more reflective of the long dialysis intervals. In addition, while frequently missed dialysis sessions have been shown to have negative consequences on patient outcomes such as all-cause mortality and hospitalization,22,23 the adverse effects of extended dialysis intervals due to single missed sessions have not often been examined.
Although our previous study identified more factors associated with the need for urgent dialysis, in both studies, hypoxemia was a strong predictor of urgent dialysis. Not unexpectedly, we hypothesize that hypoxemia represents fluid overload and a marker of the need for timely dialysis.24 Similarly, in a small study examining the presentation of dialysis patients at EDs, shortness of breath was significantly associated with subsequent need for dialysis.25
In this study, a longer interval since last dialysis was associated with an increased risk of urgent dialysis. Interestingly, the risk was dramatically increased using a threshold of >48 hours compared to 24 to 48 hours. We hypothesize that this associates with the known morbidity and mortality associated with the long-dialysis interval. It is well established that a long-dialysis break is associated with several poor health outcomes such as increased risk of death,26,27 ED visits,28 and hospitalizations.29
Analysis of our secondary outcomes showed that there were differences in hospital admission between those patients requiring urgent dialysis and those who did not. Interestingly, urgent dialysis patients had a reduced median length of stay compared to other patients, which may be a result of the acute nature of events such as hyperkalemia that can be quickly treated without the need for prolonged stay. The risk-prediction model we developed predicting hospitalization using patients’ vital signs had good calibration but poor discrimination. We hypothesize that this may be partly due to the high rate of hospitalization after ED presentation (making it harder to discriminate for this event) and the fact that variability in vital signs would be expected in an admitted dialysis cohort, making it difficult for any 1 “threshold” in an individual vital sign to be predictive.
In areas where monitored dialysis may not be available at all health care centers, patients receiving maintenance hemodialysis may require additional secondary interfacility transport by EMS if they are first sent to a center incapable of monitored dialysis. Only a few studies, showing mixed results, have examined the effect of delayed treatment due to transportation and interfacility transfers on patient outcomes.8,11,30,31 A study examining the impact of expedited dialysis treatment pathways after ED presentation found decreased median hospital length of stay,32 suggesting a benefit in avoiding delayed dialysis treatment. However, the benefits of patient diversion to primary dialysis care centers must be weighed against the risk of overcrowding the EDs of those centers with patients who do not require urgent dialysis, as ED overcrowding is associated with negative outcomes for all ED patients.7,9,10 A risk-prediction model should identify patients treated with maintenance hemodialysis requiring urgent dialysis to better inform their transport decisions with an acceptable level of overtriage.
Our study builds on our previous work on risk prediction for patients transported to the ED. Our model included details of last dialysis, dialysis schedules, and the reasons behind the need for urgent dialysis. Finally, our findings were tested in several additional sensitivity analyses, which increases the robustness of our primary clinical findings. Future study of our risk-prediction model would involve external validation prior to clinical implementation. In practice, our model could be implemented as an online point-of-care assessment tool available to paramedics that would generate a risk score based on the parameters used in our model. This would provide paramedics with additional information around transport destinations of patients receiving maintenance hemodialysis. Importantly, this would serve as a complement to other existing triaging decisions (ie, pathways for ST-elevation myocardial infarction or stroke that already exist), that would take precedence in dictating transport destination on the basis of urgency.
Our study does have some limitations. We acknowledge that the findings may not be as applicable where dialysis center practices differ from those in our region. For example, in areas where monitored dialysis may be supported by more peripheral centers, transport decisions based on the need for urgent dialysis would be less applicable. However, identifying patients who may require monitored dialysis before transport is still important for patient flow after transport and resource planning. Other possible limitations of our study include the small outcome count of urgent dialysis and the limited single geographic region. We acknowledge that before the findings from our study can be incorporated into clinical practice, they must be externally validated. Finally, the majority of missing data occurred due to a lack of information of the day of last dialysis prior to EHS presentation for patients located at a satellite facility. It is possible that inclusion of these patients may have modified the results. However, we feel the biggest impact of this would have been that an even higher proportion of patients who needed urgent dialysis would have been transported to a facility incapable of providing it. Therefore, our analysis is likely a more conservative estimate of this scenario. An additional limitation of our study is the potential of an immortal time bias as a very small number of patients (N = 5) died after ambulance-ED transport before receiving dialysis. However, in real-world implementation of our model, these patients represent situations where transport decisions by paramedics would likely be driven by competing issues such as cardiac arrest rather than our risk-prediction model due to the severe acute presentation of patients.
Conclusion
EMS use among patients receiving maintenance hemodialysis is high and can increase the burden on both the patient and the health care system. Our risk-prediction model found that hypoxemia and time from last dialysis were positively associated with urgent dialysis and performed well in several sensitivity analyses. Predicting the need for urgent dialysis based on historical and clinical data available to paramedics before ambulance-ED transport can improve patient care and optimize the use of EMS and ED health care resources.
Supplemental Material
Supplemental material, sj-pdf-1-cjk-10.1177_20543581221149707 for Predictors of Urgent Dialysis Following Ambulance Transport to the Emergency Department in Patients Treated With Maintenance Hemodialysis by Aran Thanamyooran, Megi Nallbani, Amanda J. Vinson, David A. Clark, Patrick T. Fok, Judah Goldstein, Keigan M. More, Janel Swain, Hana Wiemer and Karthik K Tennankore in Canadian Journal of Kidney Health and Disease
Footnotes
Authors’ Note: K.K.T. has conducted consultancy and advisory board work for Otsuka, Astra Zeneca, Bayer, GSK, and Vifer pharmaceuticals and has received unrestricted grant funding for investigator-initiated research from Otsuka.
Ethics Approval and Consent to Participate: This study was approved by the Nova Scotia Health Research Ethics Board. As this was a retrospective study, patient consent was not required.
Consent for Publication: All authors agreed to the publication of the manuscript.
Availability of Data and Materials: The data for this study cannot be shared due to data confidentiality requirements of the institution.
The author(s) declared no potential conflicts of interest with respect to the research, authorship, and/or publication of this article.
Funding: The author(s) received no financial support for the research, authorship, and/or publication of this article.
ORCID iDs: Aran Thanamyooran  https://orcid.org/0000-0003-3902-6833
Amanda J. Vinson
https://orcid.org/0000-0002-9345-5252
David A. Clark
https://orcid.org/0000-0003-1105-3418
Karthik K Tennankore
https://orcid.org/0000-0002-7919-6709
Supplemental Material: Supplemental material for this article is available online.
References
- 1. Lovasik BP, Zhang R, Hockenberry JM, et al. emergency department use and hospital admissions among patients with end-stage renal disease in the United States. JAMA Intern Med. 2016;176(10):1563-1565. [DOI] [PubMed] [Google Scholar]
- 2. Molnar AO, Moist L, Klarenbach S, et al. Hospitalizations in dialysis patients in Canada: a national cohort study. Can J Kidney Health Dis. 2018;5:2054358118780372. [DOI] [PMC free article] [PubMed] [Google Scholar]
- 3. Komenda P, Tangri N, Klajncar E, et al. Patterns of emergency department utilization by patients on chronic dialysis: a population-based study. PLoS ONE. 2018;13(4):e0195323. [DOI] [PMC free article] [PubMed] [Google Scholar]
- 4. Bartolacci J, Goldstein J, Kiberd B, et al. Burden of emergency medical services usage by dialysis patients. Prehosp Emerg Care. 2018;22(6):698-704. [DOI] [PubMed] [Google Scholar]
- 5. Harel Z, Wald R, McArthur E, et al. Rehospitalizations and emergency department visits after hospital discharge in patients receiving maintenance hemodialysis. J Am Soc Nephrol. 2015;26(12):3141-3150. [DOI] [PMC free article] [PubMed] [Google Scholar]
- 6. Golestaneh L, Bellin E, Neugarten J, Lo Y. Avoidable visits to the emergency department(ED) and their association with sex, age and race in a cohort of low socio-economic status patients on hemodialysis in the Bronx. PLoS ONE. 2018;13(8):e0202697. [DOI] [PMC free article] [PubMed] [Google Scholar]
- 7. Richardson DB. Increase in patient mortality at 10 days associated with emergency department overcrowding. Med J Aust. 2006;184(5):213-216. [DOI] [PubMed] [Google Scholar]
- 8. Pham JC, Patel R, Millin MG, Kirsch TD, Chanmugam A. The effects of ambulance diversion: a comprehensive review. Acad Emerg Med. 2006;13(11):1220-1227. [DOI] [PubMed] [Google Scholar]
- 9. Bernstein SL, Aronsky D, Duseja R, et al. The effect of emergency department crowding on clinically oriented outcomes. Acad Emerg Med. 2009;16(1):1-10. [DOI] [PubMed] [Google Scholar]
- 10. Hwang U, Richardson L, Livote E, Harris B, Spencer N, Sean Morrison R. Emergency department crowding and decreased quality of pain care. Acad Emerg Med. 2008;15(12):1248-1255. [DOI] [PMC free article] [PubMed] [Google Scholar]
- 11. Singh JM, MacDonald RD. Pro/con debate: do the benefits of regionalized critical care delivery outweigh the risks of interfacility patient transport. Crit Care. 2009;13(4):219. [DOI] [PMC free article] [PubMed] [Google Scholar]
- 12. Vinson AJ, Bartolacci J, Goldstein J, et al. optimizing ambulance transport of hemodialysis patients to the emergency department: a cohort study. Can J Kidney Health Dis. 2019;6:2054358119848127. [DOI] [PMC free article] [PubMed] [Google Scholar]
- 13. von Elm E, Altman DG, Egger M, Pocock SJ, Gøtzsche PC, Vandenbroucke JP. The Strengthening the Reporting of Observational Studies in Epidemiology (STROBE) statement: guidelines for reporting observational studies. Ann Intern Med. 2007;147(8):573-577. [DOI] [PubMed] [Google Scholar]
- 14. Gomez AT, Kiberd BA, Royston JP, et al. Comorbidity burden at dialysis initiation and mortality: a cohort study. Can J Kidney Health Dis. 2015;2:34. [DOI] [PMC free article] [PubMed] [Google Scholar]
- 15. Alfaadhel TA, Soroka SD, Kiberd BA, Landry D, Moorhouse P, Tennankore KK. Frailty and mortality in dialysis: evaluation of a Clinical Frailty Scale. Clin J Am Soc Nephrol. 2015;10(5):832-840. [DOI] [PMC free article] [PubMed] [Google Scholar]
- 16. Stoltzfus JC. Logistic regression: a brief primer. Acad Emerg Med. 2011;18(10):1099-1104. [DOI] [PubMed] [Google Scholar]
- 17. Pencina MJ, D’Agostino RB, Sr. Evaluating discrimination of risk prediction models: the C statistic. JAMA. 2015;314(10):1063-1064. [DOI] [PubMed] [Google Scholar]
- 18. Paul P, Pennell ML, Lemeshow S. Standardizing the power of the Hosmer–Lemeshow goodness of fit test in large data sets. Stat Med. 2013;32(1):67-80. [DOI] [PubMed] [Google Scholar]
- 19. Iba K, Shinozaki T, Maruo K, Noma H. Re-evaluation of the comparative effectiveness of bootstrap-based optimism correction methods in the development of multivariable clinical prediction models. BMC Med Res Methodol. 2021;21(1):9. [DOI] [PMC free article] [PubMed] [Google Scholar]
- 20. Ronksley PE, Wick JP, Elliott MJ, et al. Derivation and internal validation of a clinical risk prediction tool for hyperkalemia-related emergency department encounters among hemodialysis patients. Can J Kidney Health Dis. 2020;7:2054358120953287. [DOI] [PMC free article] [PubMed] [Google Scholar]
- 21. Karaboyas A, Zee J, Brunelli SM, et al. Dialysate potassium, serum potassium, mortality, and arrhythmia events in hemodialysis: results from the Dialysis Outcomes and Practice Patterns Study (DOPPS). Am J Kidney Dis. 2017;69(2):266-277. [DOI] [PMC free article] [PubMed] [Google Scholar]
- 22. Al Salmi I, Larkina M, Wang M, et al. Missed hemodialysis treatments: international variation, predictors, and outcomes in the Dialysis Outcomes and Practice Patterns Study (DOPPS). Am J Kidney Dis. 2018;72(5):634-643. [DOI] [PubMed] [Google Scholar]
- 23. Balhara KS, Fisher L, El Hage N, Ramos RG, Jaar BG. Social determinants of health associated with hemodialysis non-adherence and emergency department utilization: a pilot observational study. BMC Nephrol. 2020;21(1):4. [DOI] [PMC free article] [PubMed] [Google Scholar]
- 24. Venkat A, Kaufmann KR, Venkat K. Care of the end-stage renal disease patient on dialysis in the ED. Am J Emerg Med. 2006;24(7):847-858. [DOI] [PubMed] [Google Scholar]
- 25. Sacchetti A, Harris R, Patel K, Attewell R. Emergency department presentation of renal dialysis patients: indications for EMS transport directly to dialysis centers. J Emerg Med. 1991;9(3):141-144. [DOI] [PubMed] [Google Scholar]
- 26. Bleyer AJ, Hartman J, Brannon PC, Reeves-Daniel A, Satko SG, Russell G. Characteristics of sudden death in hemodialysis patients. Kidney Int. 2006;69(12):2268-2273. [DOI] [PubMed] [Google Scholar]
- 27. Foley RN, Gilbertson DT, Murray T, Collins AJ. Long interdialytic interval and mortality among patients receiving hemodialysis. N Engl J Med. 2011;365(12):1099-1107. [DOI] [PubMed] [Google Scholar]
- 28. Zhang S, Morgenstern H, Albertus P, Nallamothu BK, He K, Saran R. Emergency department visits and hospitalizations among hemodialysis patients by day of the week and dialysis schedule in the United States. PLoS ONE. 2019;14(8):e0220966. [DOI] [PMC free article] [PubMed] [Google Scholar]
- 29. Fotheringham J, Fogarty DG, El Nahas M, Campbell MJ, Farrington K. The mortality and hospitalization rates associated with the long interdialytic gap in thrice-weekly hemodialysis patients. Kidney Int. 2015;88(3):569-575. [DOI] [PubMed] [Google Scholar]
- 30. Fan E, MacDonald RD, Adhikari NK, et al. Outcomes of interfacility critical care adult patient transport: a systematic review. Crit Care. 2005;10(1):R6. [DOI] [PMC free article] [PubMed] [Google Scholar]
- 31. Sethi D, Subramanian S. When place and time matter: how to conduct safe inter-hospital transfer of patients. Saudi J Anaesth. 2014;8(1):104-113. [DOI] [PMC free article] [PubMed] [Google Scholar]
- 32. O’Donnell C, Molitch-Hou E, James K, et al. Fast track dialysis: improving emergency department and hospital throughput for patients requiring hemodialysis. Am J Emerg Med. 2021;45:92-99. [DOI] [PubMed] [Google Scholar]
Associated Data
This section collects any data citations, data availability statements, or supplementary materials included in this article.
Supplementary Materials
Supplemental material, sj-pdf-1-cjk-10.1177_20543581221149707 for Predictors of Urgent Dialysis Following Ambulance Transport to the Emergency Department in Patients Treated With Maintenance Hemodialysis by Aran Thanamyooran, Megi Nallbani, Amanda J. Vinson, David A. Clark, Patrick T. Fok, Judah Goldstein, Keigan M. More, Janel Swain, Hana Wiemer and Karthik K Tennankore in Canadian Journal of Kidney Health and Disease