

Abstract
Background:
Potentially traumatic events (PTEs) are common and associated with detrimental outcomes over the life-course. Previous studies exploring the causes and consequences of PTE-exposure profiles are often from high-income settings and fail to explore the implications of sample selection (i.e., population-representative versus PTE-restricted).
Methods:
Among individuals in the Nepal Chitwan Valley Family Study, latent class analyses (LCA) were performed on 11 self-reported PTEs collected by the Nepali version of the World Mental Health Consortium’s Composite International Diagnostic Interview 3.0 from 2016 to 2018, in a population-representative sample (N = 10,714), including a PTE-restricted subsample (N = 9183). Multinomial logistic regressions explored relationships between sociodemographic factors and class membership. Logistic regressions assessed relationships between class membership and psychiatric outcomes.
Results:
On average, individuals were exposed to 2 PTEs in their lifetime. A five-class solution showed optimal fit for both samples; however, specific classes were distinct. No single sociodemographic factor was universally associated with PTE class membership in the population-representative sample; while several factors (e.g., age, age at incident PTE, education, marital status, and migration) were consistently associated with class membership in the PTE-subsample. PTE class membership differentiated psychiatric outcomes in the population-representative sample more than the PTE-subsample.
Limitations:
Primary limitations are related to the generalizability to high-income settings, debate on LCA model fit statistic usage for final class selection, and cross-sectional nature of data collection.
Conclusions:
Although population-representative samples provide information applicable to large-scale, population-based programming and policy, PTE-subsample analyses may provide additional nuance in PTE profiles and their consequences, important for specialized prevention efforts.
Keywords: Trauma, Global mental health, Latent class analysis
1. Introduction
Potentially traumatic events (PTEs) – defined as exposure to death (actual or threatened), serious injury or harm, including sexual violence (American Psychological Association, 2013) – represent a nearly ubiquitous experience (Benjet et al., 2016). Seventy percent of World Mental Health Survey respondents from 24 countries reported exposure to at least one PTE in their lifetime (Kessler et al., 2017). PTE exposure increases the risk of developing deleterious health outcomes, such as posttraumatic stress disorder (PTSD) (Dursa et al., 2014; Lowe et al., 2014; McCutcheon et al., 2010; Wolf et al., 2015), anxiety (Benjet et al., 2020; Gill et al., 2014; McCutcheon et al., 2010; Schweininger et al., 2015), major depressive disorder (MDD) (Giordano et al., 2014; McCutcheon et al., 2010), binge drinking and substance use disorders (Giordano et al., 2014; Ziobrowski et al., 2020), psychosis (Duhig et al., 2015), suicidal ideation (Jankovic et al., 2013), borderline personality disorder (Westphal et al., 2013), sexually transmitted infections (Walsh et al., 2012), and other chronic diseases (Schweininger et al., 2015; Sumner et al., 2015).
Prevalence estimates of PTE exposure and its deleterious consequences vary substantially across sociodemographic and contextual factors. The literature has predominantly focused on high-income settings (O’Donnell et al., 2017), although PTE exposure burden is generally higher in low- and middle-income countries (LMICs) (Atwoli et al., 2017; Kessler et al., 2017). For instance, women in LMICs face a greater burden of exposure to certain PTEs (e.g., intimate partner violence) than women residing in high-income countries (Esie et al., 2019). Experiencing a natural disaster in a LMIC further increases the risk of physical injury, loss of shelter, and death, due to factors such as delayed emergency response, poor infrastructure, and displacement (Gill et al., 2014; Pollack et al., 2016). Additional research in LMIC contexts is essential to both better understand the universality of previously identified PTE profiles and to better understand the unique experiences of those in LMIC settings.
Beyond a simple focus on individual PTEs in high-burden settings, examining the heterogeneity of PTE exposures profiles can yield a deeper understanding of overlapping traumas (O’Donnell et al., 2017), providing insight into patterns of specific health outcomes in different subgroups, that can be leveraged to improve prevention and treatment efforts. PTE profiles may reveal how exposures may cluster in ways that have particular mental health consequences above and beyond individual PTEs, and tell us which PTEs require the greatest attention. Exposure to multiple PTEs (i.e., polytraumatization) can increase the risk of poor outcomes more than exposure to any single event (Sullivan et al., 2017). The potentially compounding short- and long-term effects of polytraumatization also differ by type of PTE, duration of exposure, age at exposure, and concurrent and historic trauma exposures (Esie et al., 2019; O’Donnell et al., 2017; Tang et al., 2018; Ziobrowski et al., 2020). Given higher burden of polytraumatization in LMIC, additional research into understanding PTE profiles is an important public health question.
Latent class analysis (LCA) is well suited to explore polytraumatization patterns, and has been used extensively to do so (Golder et al., 2012; O’Donnell et al., 2017; Sullivan et al., 2017; Young-Wolff et al., 2013; Ziobrowski et al., 2020). LCA-based PTE models are able to organize heterogeneous data into more homogenous groups by identifying similar clusters of PTE endorsements and assigning class membership accordingly. Existing LCA literature on PTE models, predominantly in high-income settings, has typically identified three to five classes of trauma exposures, across a variety of populations (Contractor et al., 2018a; O’Donnell et al., 2017), most often within trauma-exposed groups (e.g., war, intimate partner violence, natural disaster survivors, community violence, etc.) (Kelber et al., 2019; Pollack et al., 2016; Sullivan et al., 2017). Identified classes in these groups have been related to specific PTE categories such as grief, child maltreatment, or witnessing physical violence, in addition to including PTE severity dimensions ranging from no/low reported PTE to high PTE burden (O’Donnell et al., 2017; Young-Wolff et al., 2013; Ziobrowski et al., 2020).
As a data-driven analytic method, empirically identified classes of PTE exposure are sensitive to design features of the primary datasets, such as restrictions to a specific PTE-exposed population (e.g. car accident). Identified classes may differ in PTE-exposed sub-populations compared with a broader population not selected for these exposures. It could be that in a general population-based sample, the difference between trauma and no-trauma individuals is the major distinction (i.e., source of variation), with the resulting profiles mostly capturing this difference. With the trauma-only sample, it is possible we might uncover more nuanced profiles. However, this comparison has not been directly made, though would inform downstream research and knowledge. LCA studies that critically examine PTE patterns in these samples can provide nuanced insights into individuals who meet these conditions.
Leveraging a large-scale, multiple cohort panel study in Nepal, a low-income country with high PTE occurrence (Benjet et al., 2020; Williams et al., 2012), this study compares PTE profiles from a population-representative sample to those in the PTE-restricted subsample. To highlight similarities and differences in these approaches in the minimal extant literature, for the first time we explore the differential associations of resulting PTE classes with sociodemographic factors and psychiatric sequelae, thus both contributing to the population-based and PTE-restricted literature simultaneously.
2. Methods
2.1. Sample
The Chitwan Valley Family Study (CVFS) (University of Michigan, 2019) is a panel study originally designed to replicate demographic U.S.-based studies, includes more than two decades of data, beginning in 1995, with a cohort from 151 neighborhoods that varied by access to roads, schools, health services, employers, and other social services in Western Chitwan, Nepal (Barber et al., 1997). The CVFS has high survey response rates with minimal missing data and reliable measures (Axinn et al., 2012). In 2016–2018, the Nepali version of the World Mental Health consortium’s Composite International Diagnostic Interview (WMH-CIDI) 3.0 was administered to all study participants ages 15–59, with a response rate of 93 % (N = 10,714, detailed methods previously published) (Scott et al., 2020). This analysis includes all respondents from this WMH-CIDI sample (population-representative sample) and a subsample of those exposed to any PTE below (N = 9183; PTE-restricted subsample). Interviews were conducted in person and all study participants provided written or verbal informed consent. The study was approved by both the University of Michigan Institutional Review Board and the Nepal Health Research Council.
2.2. Potentially traumatic events
The WMH-CIDI included 29 items related to PTEs. This analysis examined the 11 lifetime PTEs that were endorsed by at least 2 % of all participants: life-threatening car accident, any other life-threatening accident other than automobile accidents, natural disaster, life-threatening illness, beaten by parents/caregivers as a child, beaten by spouse/partner, beaten by anyone else, someone close to you died unexpectedly, son or daughter had life threatening illness, witness serious physical fights as a child, or witness someone badly injured, killed, or a dead body. Among the PTE-restricted subsample, average PTE counts and age at incident PTE were drawn from these items.
2.3. Mental health outcomes
The WMH-CIDI survey assessed diagnostic criteria for lifetime and 12-month mental health disorders at the time of interview, with documented strong validity with the Structured Clinical Interview for Diagnostic and Statistical Manual of Mental Health Disorders (DSM-IV) Disorders (Axinn et al., 2020a; Ghimire et al., 2013). Life history calendars were used to enhance lifetime recall of psychiatric disorders, a method shown to improve psychiatric disorder measurement accuracy (Axinn et al., 2020a). Any mental health disorder, whether lifetime or 12-month, was defined by meeting diagnostic criteria for any of the following psychiatric disorders: major depressive disorder (MDD), bipolar disorder broad (bipolar I, II and subthreshold), panic disorder, generalized anxiety disorder (GAD), alcohol abuse or alcohol dependence indicating alcohol use disorder (AUD), post-traumatic stress disorder (PTSD), minor depression, recurrent brief depression, and dysthymia disorders. Of these, MDD and AUD, as the outcomes with sufficient sample size (e.g. most prevalent) and most studied outcomes in this dataset(Axinn et al., 2022, 2020b; Benjet et al., 2020; Cole et al., 2021; Scott et al., 2020), were explored further than the other measured mental health outcomes for this study.
2.4. Sociodemographic variables
Age (continuous in years), gender (male/female), education (passed school leaving certificate [SLC] versus less than SLC), ethnicity (Brahmin/Chhetri, as compared to other ethnicities [Hill Janjati, Dalits, Newar, and Terai Janjati]), marital status (married, separated/divorced/widowed, never married), self-rated health (excellent/very good/good, fair/poor) and ever having migrated domestically or internationally (yes/no) were self-reported by participants. Historically Brahmin/Chhetri communities have had increased access to education, wealth, and income opportunities, as compared to other ethnic groups within the Nepal.
2.5. Statistical analyses
First, descriptive analyses were performed to examine sociodemographic characteristics and prevalence of psychiatric disorders among both the population-representative sample and PTE-restricted subsample. Because the PTE-only sample is a subset of the population-based sample, the samples are not independent nor identical, so any descriptive comparisons are qualitative in nature. Second, LCA were conducted using Mplus 8 software to empirically identify latent profiles of PTEs in each of the two analytic samples, ranging from two- to seven-class solutions (Muthen and Muthen, 2017). As there is limited consensus in the literature regarding the optimal fit statistic for selecting final class solutions (Nylund et al., 2007), we compared LCA results across multiple fit statistics and incorporating conceptual plausibility to select final class solutions (Nylund-Gibson and Hart, 2014a). The following model statistics were used to inform model selection: log likelihood (non-statistically significant values indicate that the additional class does not improve statistical fit over current model) (Lo et al., 2001), Akaike information criterion (AIC, lower value indicates better model fit) (Akaike, 1987), Bayesian information criterion (BIC, lower value indicates better model fit) (Schwarz, 1978), sample-size adjusted BIC (ssaBIC, lower value indicates better model fit) (Schwarz, 1978), entropy (higher value suggests better class differentiation fit) (Ramaswamy et al., 1993), G2 (statistic lower than degrees of freedom indicate a good fit), and chi-squared test and p-value (<0.05 indicates good fit). For each solution, the probabilities of endorsing each PTE were visualized by each identified class to conceptually evaluate resulting classes in an interpretable fashion (Collins and Lanza, 2009). Then, once the final class solutions were selected for both the population-representative sample and PTE-restricted subsample, the sociodemographic and psychiatric disorder prevalence across resulting classes in each sample were calculated. Class names were developed by a) reviewing probability of PTEs in each class; b) highlighting most prevalent PTE(s) per class; c) identifying PTE(s) that differentiated between classes; and d) comparing to existing classes in the literature and potential overlap of causes of PTE exposures to develop substantive class names. Supplemental Table 1 includes estimated probabilities of PTEs by class for the final class solution.
Third, associations between sociodemographic variables and PTE class membership were tested using multinomial logistic regression models, adjusting for survey design factors (i.e., survey sample wave) and using the lowest PTE burden class (i.e., class 5) as the outcome reference category. Separate multinomial logistic regression models were conducted for both the population-representative sample and the PTE-restricted subsample. Fourth, logistic regression models estimated the extent to which class membership was associated with mental health outcomes (i.e., any mental health disorder, any major depressive disorder, and any alcohol use disorder), adjusting for all sociodemographic variables in addition to survey design factors. The odds of lifetime disorders and 12-month disorders associated with class membership were examined using separate models conducted in the population-representative sample and PTE-restricted subsample. Sensitivity analyses exploring distribution of PTE before disorder onset were conducted to establish the temporal order of associations.
3. Results
There were 10,714 individuals in the population-representative sample; of these, 9183 individuals were included in the PTE-subsample. As expected, the mean number of reported lifetime PTEs was higher in the PTE-subsample (2.30 versus 2 in population-representative sample). The mean age was comparable across the two samples (33.10 and 33.20 years old in the population-representative versus PTE-subsample, respectively; Table 1), and other sociodemographic characteristics were distributed similarly across the two samples. Over half of individuals passed the school leaving certificate (SLC) in both samples (61.70 % in population-representative sample and 62.50 % in the PTE-subsample). The prevalence of any mental health disorder was qualitatively slightly higher in the PTE-subsample (5.30 %) compared with the population-representative sample (5.00 %).
Table 1.
Descriptive characteristics of the population-representative sample compared with the PTE-sub sample in the CVFS, Nepal, 2016–2018.
| Characteristic | Population-based sample |
PTE-subsample |
|---|---|---|
| N = 10,714 |
N = 9183 |
|
| Mean (sd) | Mean (sd) | |
|
| ||
| Age | 33.12 (12.12) | 33.18 (12.24) |
| Average PTE countsa | 2 (1.39) | 2.33 (1.22) |
| Mean age at incident PTEa (years) | 24.97 (10.36) | 24.97 (10.37) |
|
| ||
| N (%) | N (%) | |
|
| ||
| Female | 5790 (54.04) | 4874 (53.07) |
| Ethnicity (Brahmin/Chhetri)b | 4634 (43.25) | 3932 (42.82) |
| SLC pass | 6615 (61.74) | 5736 (62.46) |
| Any MHDc | ||
| Lifetime | 2431 (22.69) | 2208 (24.04) |
| 12-month | 533 (4.97) | 489 (5.33) |
| PTSD | ||
| Lifetime | 283 (2.64) | 283 (3.08) |
| 12-month | 56 (0.52) | 56 (0.61) |
| MDD | ||
| Lifetime | 1622 (15.14) | 1455 (15.84) |
| 12-month | 292 (2.73) | 260 (2.83) |
| AUDd | ||
| Lifetime | 629 (8.64) | 595 (9.40) |
| 12-month | 119 (1.64) | 114 (1.80) |
| GAD | ||
| Lifetime | 603 (5.63) | 543 (5.91) |
| 12-month | 148 (1.38) | 138 (1.50) |
| PTE exposures | ||
| Any PTEa | 9218 (86.04) | 9183 (100.00) |
| Car accident | 1097 (10.24) | 1097 (11.95) |
| Other accident | 664 (6.20) | 664 (7.23) |
| Natural disaster | 7149 (66.73) | 7149 (77.85) |
| Illness | 1954 (18.24) | 1954 (21.28) |
| Beaten by caregiverse | 768 (7.17) | 768 (8.36) |
| Beaten by spouse | 350 (3.27) | 350 (3.81) |
| Beaten by other | 246 (2.30) | 246 (2.68) |
| Sudden death | 2577 (24.05) | 2577 (28.06) |
| Sick child | 864 (8.06) | 864 (9.41) |
| Witness physical fightse | 882 (8.23) | 882 (9.60) |
| Witness injury/dead | 3306 (30.86) | 3306 (36.00) |
Notes: CVFS = Chitwan Valley Family Study; PTE = potentially-traumatic event; MHD = mental health disorder; SLC = school leaving certificate; PTSD = posttraumatic stress disorder; MDD = major depressive disorder; AUD = alcohol use disorder; GAD = generalized anxiety disorder.
Indicates estimates that included all measured PTEs (n = 29) and not just the 11 in the final LCA model.
Ethnicity categorized as Brahmin/Chhetri, as compared to other ethnicities Hill Janjati, Dalits, Newar, and Terai Janjati.
Any mental health disorder includes: major depressive disorder, bipolar disorder broad (bipolar I, II and subthreshold), panic disorder, generalized anxiety disorder, alcohol abuse or alcohol dependence indicating alcohol use disorder, post-traumatic stress disorder, minor depression, recurrent brief depression, and dysthymia disorders.
Among those with an opportunity to drink (n = 7276 in Population-representative sample, n = 6333 in PTE-subsample).
PTE was experienced during childhood.
The five-class solutions provided the best fit statistics, with the non-significant χ2 p-value at k class solution supporting the k-1 class solution (Table 2) (Nylund et al., 2007; Nylund-Gibson and Hart, 2014b). Selected fit statistics for the population-representative sample were: Log likelihood p-value ≤ 0.001; AIC = 82,591.99; BIC = 83,021.47; Entropy = 0.54; and χ2 p-value = 0.02. For the PTE-subsample, selected fit statistics were: Log likelihood p-value ≤ 0.0001; AIC = 74,097.83; BIC = 74,518.22; Entropy = 0.58; and χ2 p-value = 0.001. Fig. 1 displays participant latent profiles of PTE endorsement based on the respective five-class solutions. Table 3 descriptively summarizes the distribution of sociodemographic and mental health characteristics across these classes in the population-representative and PTE-subsample, respectively. The population-representative sample identified classes predominantly related to: interpersonal violence (4.93 %), accident (21.54 %), illness (6.88 %), natural disaster (52.19 %), low-burden (14.46 %). The following classes were identified in the PTE-subsample: interpersonal violence (10.85 %), bereavement (4.31 %), intimate partner violence/illness (7.69 %), accident/injury (14.82 %), and natural disaster (62.33 %). Supplemental Table 1 illustrates prevalence estimates of PTE items by class.
Table 2.
Model fit statistics from latent class model solutions comparing the population-representative sample and the PTE-subsample in the CVFS, Nepal, 2016–2018.
| Model | Log likelihood | Log likelihood (p-value) | AIC | BIC | ssaBIC | Entropy | G2 (df) | χ2 (p-value) |
|---|---|---|---|---|---|---|---|---|
|
| ||||||||
| Population-representative sample | ||||||||
| 2 classes | −41,650.13 | <0.0001 | 83,346.26 | 83,513.68 | 83,440.59 | 0.30 | 1855.10 (2020) | 0.00 |
| 3 classes | −41,461.49 | <0.0001 | 82,992.98 | 83,247.75 | 83,136.53 | 0.55 | 1499.23 (2010) | <0.0001 |
| 4 classes | −41,327.79 | <0.0001 | 82,749.58 | 83,091.71 | 82,942.35 | 0.46 | 1180.21 (1993) | 0.01 |
| 5 classes | −41,236.10 | <0.0001 | 82,591.99 | 83,021.47 | 82,833.97 | 0.54 | 1053.36 (1986) | 0.00 |
| 6 classes | −41,202.01 | <0.0001 | 82,546.02 | 83,062.84 | 82,837.21 | 0.54 | 942.34 (1970) | 1.00 |
| 7 classes | −41,179.96 | <0.0001 | 82,525.91 | 83,130.09 | 82,866.33 | 0.55 | 908.69 (1959) | 1.00 |
| PTE-subsample | ||||||||
| 2 classes | −37,420.60 | <0.0001 | 74,887.20 | 75,051.08 | 74,977.99 | 0.43 | 2118.66 (2014) | 0.00 |
| 3 classes | −37,215.13 | <0.0001 | 74,500.27 | 74,749.65 | 74,638.42 | 0.45 | 1772.10 (2008) | <0.0001 |
| 4 classes | −37,071.60 | <0.0001 | 74,237.19 | 74,572.07 | 74,422.72 | 0.57 | 1516.77 (1999) | <0.0001 |
| 5 classes | −36,989.92 | <0.0001 | 74,097.83 | 74,518.22 | 74,330.72 | 0.58 | 1352.64 (1987) | 0.00 |
| 6 classes | −36,924.17 | <0.0001 | 73,990.33 | 74,496.21 | 74,270.59 | 0.69 | 1190.82 (1972) | 0.96 |
| 7 classes | −36,888.94 | <0.0001 | 73,943.89 | 74,535.27 | 74,271.51 | 0.73 | 1120.51 (1960) | 0.48 |
Notes: PTE-subsample was restricted to the 11 PTEs included in the latent class models. Bold values indicate best-fitting for that fit statistic. PTE = potentially-traumatic event; CVFS = Chitwan Valley Family Study; AIC = Akaike information criterion; BIC = Bayesian information criterion; ssaBIC = sample-size adjusted BIC.
Fig. 1.
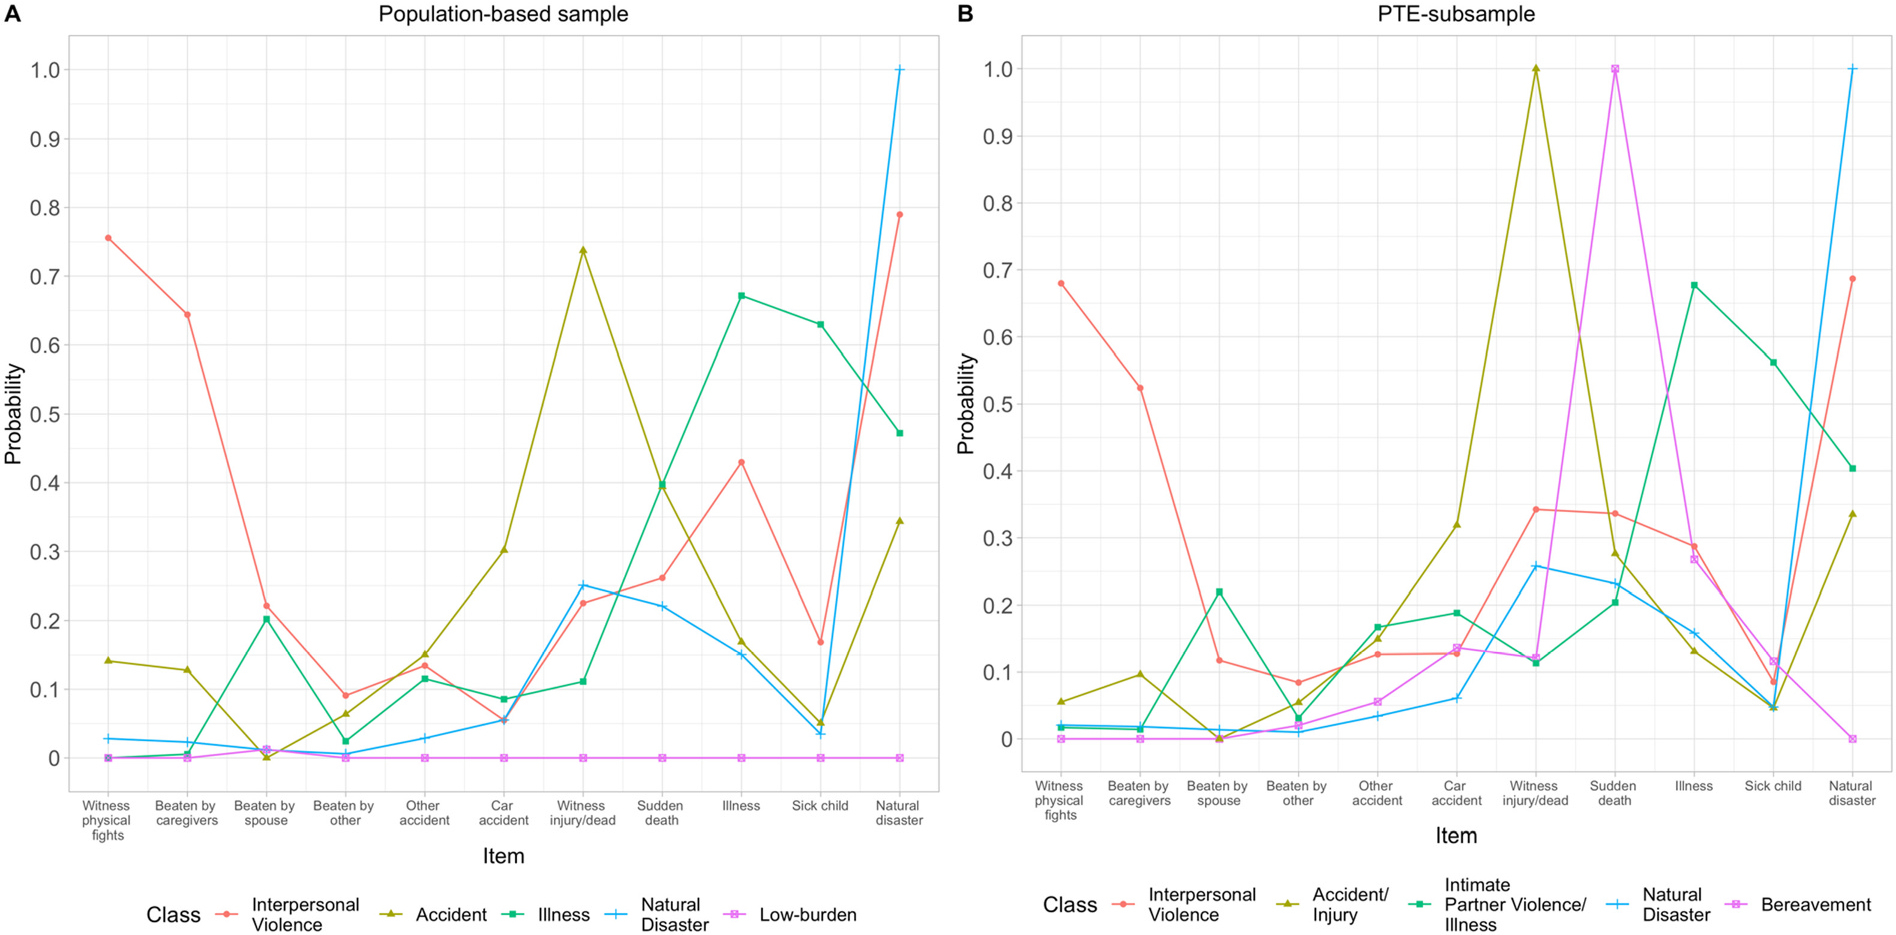
Scatter plot of potentially-traumatic event items by class, CVFS, Nepal 2016–2018.
Notes: N = 10,713 for population-representative sample (interpersonal violence class 4.9 %, accident class 21.5 %, illness class 6.9 %, natural disaster class 52.2 %, low class 14 %) and N = 9183 for PTE-subsample population (interpersonal violence class 10.9 %, bereavement class 4.3 %,interpersonal violence/illness class 7.7 %, accident/injury class 14.8 %, natural disaster class 62.3 %).
Table 3.
Descriptive characteristics of classes in the population-representative sample compared with the PTE-subsample in the CVFS, Nepal, 2016–2018.
| Population-representative sample |
PTE subsample |
|||||||||
|---|---|---|---|---|---|---|---|---|---|---|
| Interpersonal violence | Accident | Illness | Natural disaster | Low-burden | Interpersonal violence | Accident/injury | Intimate partner violence/illness | Natural disaster | Bereavement | |
|
| ||||||||||
| N (%) | 528 (4.93) | 2308 (21.54) | 737 (6.88) | 5591 (52.19) | 1549 (14.46) | 996 (10.85) | 1361 (14.82) | 706 (7.69) | 5724 (62.33) | 396 (4.31) |
| Mean (sd) | ||||||||||
| Age | 30.02 (11.54) | 33.56 (11.63) | 41.01 (11.03) | 32.26 (12.30) | 32.91 (11.40) | 29.31 (11.34) | 34.36 (11.56) | 40.27 (11.41) | 32.50 (12.33) | 36.03 (10.88) |
| Average PTE countsa | 3.93 (1.30) | 2.77 (1.42) | 2.91 (1.32) | 1.92 (9.84) | 0.04 (0.26) | 3.59 (1.41) | 2.79 (1.38) | 2.81 (1.47) | 1.97 (0.88) | 1.94 (0.92) |
| Mean age at incident PTE (years)a | 17.60 (6.30) | 22.27 (8.91) | 28.57 (9.27) | 26.30 (10.81) | 25.07 (8.51) | 17.15 (6.53) | 23.02 (8.45) | 27.71 (9.55) | 26.45 (10.77) | 25.07 (9.49) |
| N (%) | ||||||||||
| Female | 308 (58.33) | 629 (27.25) | 500 (67.84) | 3418 (61.13) | 935 (60.36) | 482 (48.39) | 263 (19.32) | 461 (65.30) | 3484 (60.87) | 184 (46.46) |
| Other Ethnicityb | 162 (30.68) | 1063 (46.06) | 327 (44.37) | 2371 (42.41) | 711 (45.90) | 313 (31.43) | 663 (48.71) | 316 (44.76) | 2442 (42.66) | 198 (50.00) |
| SLC pass | 389 (73.67) | 1345 (58.28) | 603 (81.82) | 3382 (60.49) | 896 (57.84) | 679 (68.17) | 773 (56.80) | 561 (79.46) | 3493 (61.02) | 230 (58.08) |
| Any PTEa | 528 (100.00) | 2308 (100.00) | 737 (100.00) | 5591 (100.00) | 54 (3.49) | 996 (100.00) | 1361 (100) | 706 (100.00) | 5724 (100) | 396 (100.00) |
| Any MHDc | ||||||||||
| Lifetime | 202 (38.26) | 575 (24.91) | 307 (41.66) | 1112 (19.89) | 235 (15.17) | 326 (32.73) | 303 (22.26) | 303 (42.92) | 1161 (20.28) | 115 (29.04) |
| 12-month | 59 (11.17) | 115 (4.98) | 77 (10.45) | 234 (4.19) | 48 (3.10) | 81 (8.13) | 59 (4.34) | 78 (11.05) | 250 (4.37) | 21 (5.30) |
| PTSD | ||||||||||
| Lifetime | 32 (6.06) | 69 (2.99) | 61 (8.28) | 121 (2.16) | 0 (0.00) | 39 (3.92) | 23 (1.69) | 58 (8.22) | 127 (2.22) | 36 (9.09) |
| 12-month | 11 (2.08) | 10 (0.43) | 10 (1.36) | 25 (0.45) | 0 (0.00) | 10 (1.00) | 6 (0.44) | 9 (1.27) | 28 (0.49) | 3 (0.76) |
| MDD | ||||||||||
| Lifetime | 139 (26.33) | 289 (12.52) | 247 (33.51) | 769 (13.75) | 178 (11.49) | 200 (20.08) | 142 (10.43) | 229 (32.44) | 798 (13.94) | 86 (21.72) |
| 12-month | 33 (6.25) | 53 (2.30) | 49 (6.65) | 122 (2.18) | 35 (2.26) | 45 (4.52) | 25 (1.84) | 46 (6.52) | 130 (2.27) | 14 (3.54) |
| AUDd | ||||||||||
| Lifetime | 57 (14.21) | 256 (13.14) | 43 (9.21) | 238 (6.78) | 35 (3.68) | 120 (15.52) | 147 (12.27) | 52 (11.38) | 255 (7.07) | 21 (7.02) |
| 12-month | 14 (3.49) | 43 (2.21) | 6 (1.28) | 51 (1.45) | 5 (0.53) | 21 (2.72) | 25 (2.09) | 6 (1.31) | 59 (1.64) | 3 (1.00) |
| GAD | ||||||||||
| Lifetime | 58 (10.98) | 66 (2.86) | 122 (16.55) | 291 (5.20) | 66 (4.26) | 68 (6.83) | 28 (2.06) | 117 (16.57) | 307 (5.36) | 23 (5.81) |
| 12-month | 16 (3.03) | 16 (0.69) | 34 (4.61) | 69 (1.23) | 13 (0.84) | 23 (2.31) | 6 (0.44) | 36 (5.10) | 72 (1.26) | 1 (0.25) |
Notes: CVFS = Chitwan Valley Family Study. PTE = potentially traumatic event; MHD = mental health disorder; SLC = school leaving certificate; PTSD = posttraumatic stress disorder; MDD = major depressive disorder; AUD = alcohol use disorder; GAD = generalized anxiety disorder.
Indicates estimates that included all measured PTEs (n = 29) and not just the 11 in the final LCA model.
Ethnicity categorized as Brahmin/Chhetri, as compared to other ethnicities (Hill Janajati, Dalit, Newar, and Terai Janajati).
Any mental health disorder includes: major depressive disorder, bipolar disorder broad (bipolar I, II and subthreshold), panic disorder, generalized anxiety disorder, alcohol abuse or alcohol dependence indicating alcohol use disorder, post-traumatic stress disorder, minor depression, recurrent brief depression, and dysthymia disorders.
Among those with an opportunity to drink.
In the population-representative sample, gender (female) was associated with membership in the interpersonal violence, accident, or natural disaster classes versus the low-burden class (e.g., adjusted relative risk ratio [aRRR] = 0.24, 95 % confidence interval [CI] = 0.20, 0.28 for accident versus low-burden class), but not with the illness class (Table 4). Separated, divorced, or widowed marital status was associated with membership in the interpersonal violence class versus the low-burden class (aRRR = 2.02, 95 % CI = 1.27, 3.20), but not with the other PTE classes. Poor self-reported health showed a similar pattern of association to all other PTE classes except accident (e.g., aRRR = 1.47, 95 % CI = 1.18, 1.82) versus the low-burden class.
Table 4.
Multinomial logistic regression results of characteristics predicting class membership in both the population-representative sample and the PTE-subsample in the CVFS, Nepal, 2016–2018.
| Population-representative sample |
PTE-subsample |
|||||||
|---|---|---|---|---|---|---|---|---|
| Ref: Low-burden |
Ref: Natural disaster |
|||||||
| N = 10,713 |
N = 9183 |
|||||||
| Interpersonal violence aRRR (95 % CI) | Accident aRRR (95 % CI) | Illness aRRR (95 % CI) | Natural disaster aRRR (95 % CI) | Interpersonal violence aRRR (95 % CI) | Accident/injury aRRR (95 % CI) | Intimate partner violence/illness aRRR (95 % CI) | Bereavement aRRR (95 % CI) | |
|
| ||||||||
| Age (years) | 0.97 (0.95, 0.98) | 1.00 (0.99, 1.00) | 1.04 (1.03, 1.05) | 1.00 (1.00, 1.01) | 1.12 (1.10, 1.13) | 1.09 (1.07, 1.10) | 1.12 (1.10, 1.13) | 1.09 (1.07, 1.11) |
| Mean age at incident PTE (years)a | – | 0.75 (0.74, 0.76) | 0.87 (0.86, 0.89) | 0.89 (0.88, 0.90) | 0.89 (0.88, 0.91) | |||
| Femaleb | 0.65 (0.51, 0.81) | 0.24 (0.20, 0.28) | 1.11 (0.90, 1.37) | 0.76 (0.66, 0.86) | 0.92 (0.77, 1.10) | 0.26 (0.22, 0.31) | 1.57 (1.28, 1.92) | 0.79 (0.62, 1.02) |
| Ethnicity: Brahmin/Chhetric | 1.43 (1.12, 1.83) | 0.95 (0.82, 1.01) | 0.99 (0.81, 1.20) | 1.07 (0.94, 1.22) | 1.55 (1.31, 1.86) | 0.90 (0.78, 1.04) | 1.00 (0.83, 1.20) | 0.90 (0.71, 1.14) |
| SLC passd | 0.46 (0.36, 0.59) | 0.96 (0.82, 1.13) | 0.53 (0.41, 0.67) | 0.89 (0.77, 1.01) | 0.65 (0.54, 0.77) | 1.15 (0.99, 1.34) | 0.62 (0.50, 0.77) | 1.36 (1.07, 1.73) |
| Marital status: separated/divorced/widowede | 2.02 (1.27, 3.20) | 0.94 (0.63, 1.40) | 1.20 (0.80, 1.81) | 0.90 (0.65, 1.25) | 2.13 (1.43, 3.17) | 0.56 (0.32, 1.00) | 1.60 (1.12, 2.27) | 2.15 (1.33, 3.50) |
| Marital status: never marriede | 0.78 (0.59, 1.05) | 0.87 (0.70, 1.07) | 0.32 (0.21, 0.49) | 1.00 (0.84, 1.20) | 0.82 (0.67, 1.02) | 0.82 (0.67, 1.00) | 0.60 (0.44, 0.83) | 0.53 (0.37, 0.76) |
| International migration (ever) | 0.62 (0.49, 0.80) | 1.05 (0.90, 1.22) | 0.75 (0.62, 0.92) | 0.44 (0.38, 0.50) | 1.37 (1.13, 1.65) | 2.44 (2.01, 2.84) | 1.65 (1.36, 1.99) | 2.93 (2.31, 3.72) |
| Self-reported general health status: poorf | 1.47 (1.18, 1.82) | 1.12 (0.97, 1.31) | 1.42 (1.17, 1.73) | 1.15 (1.01, 1.31) | 1.01 (0.86, 1.20) | 0.95 (0.82, 1.11) | 1.23 (1.04, 1.46) | 1.02 (0.81, 1.29) |
| PTE count: 2+a,g | – | 7.23 (5.48, 9.55) | 1.22 (1.03, 1.45) | 0.82 (0.67, 1.00) | 0.46 (0.36, 0.57) | |||
Notes: CVFS = Chitwan Valley Family Study. PTE = potentially-traumatic event; aRRR = adjusted relative risk ratio. CI = confidence interval. SLC = school leaving certificate. Mean age at incident PTE and PTE count were only included in the PTE-subsample population model. Bold values indicate p < 0.05. Models additionally adjusted for design features (i.e., survey sample wave) and accounted for household clustering.
Indicates estimates that included all measured PTEs (n = 29) and not just the 11 in the final LCA model.
Reference: male.
Ethnicity categorized as Brahmin/Chhetri, as compared to other ethnicities (Hill Janjati, Dalit, Newar, and Terai Janjati).
Reference: did not pass SLC.
Reference: married.
Reference: good health.
Reference: 1 PTE.
In the PTE-subsample, age and age at incident PTE were associated with membership in all other PTE classes (e.g., interpersonal violence) versus the more common natural disaster class (Table 4). Belonging to the interpersonal violence class was more likely (aRRR = 7.23, 95 % CI = 5.48, 9.55) if an individual had more than two PTEs versus only one PTE as compared with the natural disaster class. The likelihood of belonging to the bereavement class was lower in those with two or more PTEs (aRRR = 0.46, 95 % CI = 0.36, 0.57) as compared with the natural disaster class.
PTE class membership was more consistently associated with psychiatric outcomes in the population-representative sample (which had a low-burden reference group) than the PTE-subsample (which had a group-based-exposure, natural disaster, reference group, Table 5). Membership in the interpersonal violence, accident, illness, or natural disaster classes, compared with the low-burden class, was associated with increased odds of any mental health disorder (adjusted odds ratio [aOR] range = 1.42 to 3.57). Odds of any 12-month mental health disorder (aOR = 3.57, 95 % CI = 2.42, 5.27), such as MDD (e.g., lifetime aOR = 3.00, 95 % CI = 2.28, 3.95) or AUD among those with the opportunity to drink (e.g., 12-month aOR = 6.65, 95 % CI = 2.37, 18.70), were particularly high in the interpersonal violence class relative to the low-burden class. In the PTE-subsample, class membership was also associated with any mental health disorder and MDD, but the observed strength of relationships was attenuated in this sample (which used the natural disaster class as the reference group) compared with the population-representative sample, particularly for AUD outcomes (e.g., lifetime AUD aOR = 2.30, 95 % CI = 1.78, 2.97 in the PTE-subsample versus lifetime AUD aOR = 5.23, 95 % CI = 3.27, 8.37 in the population-representative sample, Table 5). Sensitivity analyses revealed that the overall associations hold in logistic regressions adjusted for only birth-ascribed attributes (age, gender, ethnicity) and study design features (sample wave and household clustering) and that the majority (66.31 %) of those with lifetime exposure to any psychiatric disorder experienced their incident PTE before the age at their psychiatric disorder onset (data available upon request). These data do not capture the temporal specificity of every lifetime PTE, but rather the age at incident PTE exposure, thus complete temporal ordering cannot be accomplished.
Table 5.
Logistic regression results of the relationships between class membership and psychiatric disorders in the CVFS, Nepal, 2016–2018.
| Any MH lifetime aOR (95 % CI) |
Any MH 12-month aOR (95 % CI) |
MDD lifetime aOR (95 % CI) |
MDD 12-month aOR (95 % CI) |
AUD lifetimea aOR (95 % CI) |
AUD 12-montha aOR (95 % CI) |
|
|---|---|---|---|---|---|---|
|
| ||||||
| Population-representative sample (N = 10,713) | ||||||
| Class | ||||||
| Interpersonal violence | 3.68 (2.90, 4.67) | 3.57 (2.42, 5.27) | 3.00 (2.28, 3.95) | 2.59 (1.58, 4.25) | 5.23 (3.27, 8.37) | 6.65 (2.37, 18.70) |
| Accident | 2.26 (1.89, 2.70) | 1.99 (1.42, 2.79) | 1.87 (1.50, 2.31) | 1.57 (1.00, 2.42) | 2.85 (1.97, 4.13) | 3.09 (1.21, 7.85) |
| Illness | 2.90 (2.34, 3.59) | 2.76 (1.88, 4.06) | 2.76 (2.18, 3.50) | 2.34 (1.48, 3.70) | 2.82 (1.74, 4.57) | 2.35 (0.70, 7.96) |
| Natural disaster | 1.42 (1.21, 1.66) | 1.32 (0.96, 1.81) | 1.23 (1.02, 1.47) | 0.92 (0.63, 1.35) | 2.01 (1.39, 2.92) | 2.63 (1.03, 6.73) |
| Low-burden | Ref | Ref | Ref | Ref | Ref | Ref |
| PTE-subsample (N = 9183) | ||||||
| Class | ||||||
| Interpersonal violence | 2.16 (1.84, 2.53) | 1.96 (1.51, 2.56) | 2.01 (1.66, 2.44) | 2.21 (1.55, 3.17) | 2.30 (1.78, 2.97) | 1.44 (0.85, 2.42) |
| Accident/injury | 1.36 (1.16, 1.60) | 1.30 (0.94, 1.79) | 1.41 (1.13, 1.75) | 1.47 (0.89, 2.42) | 1.18 (0.94, 1.48) | 0.97 (0.58, 1.61) |
| Intimate partner violence/illness | 2.21 (1.86, 2.63) | 2.18 (1.63, 2.90) | 2.21 (1.82, 2.68) | 2.41 (1.67, 3.47) | 1.70 (1.22, 2.39) | 0.82 (0.35, 1.88) |
| Bereavement | 1.54 (1.22, 1.94) | 1.25 (0.79, 1.97) | 1.96 (1.49, 2.57) | 1.70 (0.97, 3.17) | 0.78 (0.48, 1.26) | 0.56 (0.17, 1.80) |
| Natural disaster | Ref | Ref | Ref | Ref | Ref | Ref |
Notes: CVFS = Chitwan Valley Family Study. aOR = adjusted odds ratio. Models adjusted for age (continuous variable), gender (male/female), binary ethnicity (Brahmin or Chhetri/Other), education (school leaving certificate [SLC] pass/less than SLC), marital status (married/separated, widowed, divorced/never married), ever internationally migrated, design features (i.e., survey sample wave), and accounted for household clustering. Bold values indicate p < 0.05. MH = mental health disorder including any of the following disorders: major depressive disorder, bipolar disorder (bipolar I or II), panic disorder, generalized anxiety disorder, alcohol abuse, alcohol dependence, post-traumatic stress disorder, minor depression, recurrent brief depression, or dysthymia disorders; MDD = major depressive disorder; AUD = alcohol use disorder.
Sample size for AUD models restricted to those with an opportunity to drink, population-representative sample N = 7276 and PTE-subsample N = 6333.
4. Discussion
Using data from Nepal, this study documented the heterogeneous profiles of lifetime PTE exposure in a population-representative cohort in a high-stress LMIC setting. For the first time, this study compares profiles of a population-representative sample to those from a PTE-subsample. Our LCAs of 11 different relatively common PTEs in over 10,000 individuals in Nepal revealed two distinct five-class profiles of trauma exposure in this population that were distinguishable within this sociodemographic as well as mental health correlates.
Overall, class number and domains were similar across the population-representative and PTE-subsample. The five-class solutions identified in this study are consistent with few published LCAs (Adams et al., 2016; Ziobrowski et al., 2020) as the majority of PTE-based profiles published have identified four-class solutions (Contractor et al., 2018b; O’Donnell et al., 2017). Both published LCAs that identified five-class solutions as the best-fitting for their data included a component of age at PTE exposure in their models, with one specifically disentangling child from adolescent exposure windows (Ziobrowski et al., 2020) and the other documenting temporal exposure period heterogeneity (i.e. exposures in multiple lifetime age periods) (Adams et al., 2016). Similar to our models, both five-class publications had a low-burden class, consistent with most published LCAs to date (Adams et al., 2016; Ziobrowski et al., 2020), including the predominant four-class models (Contractor et al., 2018b; O’Donnell et al., 2017). Inconsistent with other studies that found the inclusion of non-interpersonal PTE exposures led to the identification of a separate high-burden class (O’Donnell et al., 2017), in both analyses the interpersonal violence category had the highest average PTE count per class member (3.93 in population-representative and 3.59 in PTE-subsample).
We found that specific class composition differed based on the sample (population-representative vs PTE-subsample). Given that we could only identify six population-representative LCA studies, and none have conducted a side-by-side sub-analysis of a PTE-subsample, it is not possible to directly situate these findings in the larger literature. In this study, within the PTE-subsample, we failed to observe a generally low-burden class, and rather identified a class that was distinguished by loss and bereavement. On a PTE-endorsement level, our findings are consistent with prior studies noting that the unexpected death of a loved one is one of the most commonly reported potentially traumatic event (Kessler et al., 1995). Given the strength of association between unexpected loss and psychopathology seen in this study, and in other high-income country population-representative samples (Keyes et al., 2014), along with prior work noting that the unexpected loss of a loved one is among the more common precipitant of psychiatric disorder (Breslau et al., 1998), it is fitting that a class defined by bereavement was identified. Additionally, this suggests that selecting samples based on their trauma exposure may reveal subclasses. That is, in the population, exposure to bereavement is represented by “expected” losses as well as “unexpected” losses. However, in a PTE-exposed selected sample, the prevalence of exposure to unexpected loss is likely higher and could enable clearer ascertainment of associations with psychopathology. This suggests that LCA results are dependent on input data, and selecting samples based on overall trauma exposure may reveal additional subclasses obscured in a more general population.
Identified classes in the population-representative and PTE-selected subsamples varied along meaningful sociodemographic dimensions. For example, in the population-representative sample, female participants were more highly represented within the various PTE classes except for the accident class, which consisted mostly of male participants. Female gender was negatively associated with membership in most of the various PTE classes (including interpersonal violence, accident, and natural disaster) relative to the low-burden class, except for the illness class, which showed no difference across females versus males. Within the PTE-subsample, gender was associated with intimate partner violence class (more female) and accident (more male), as compared to the natural disaster class. Literature from other settings suggests that females are more likely to experience interpersonal violence, particularly sexual assault and partner violence (Iverson et al., 2013); however, the violence-related PTEs we examined included being beaten by others or witnessing serious physical fights, rather than sexual forms of violence which were likely underreported in this setting. Data on the gendered distribution of accident exposure is inconsistent (Boughton et al., n.d.; Chandran et al., 2010; Wegman, 2017). Higher educational attainment showed protective associations with belonging to the various PTE classes, as did a history of international migration. This is consistent with literature linking higher educational attainment and economic means to reduced risk of psychopathology (potentially mediated through PTE exposure) (Araya et al., 2003; Bjelland et al., 2008; Butler et al., 2015).
While comparing sociodemographic associations across class membership is interesting and potentially useful if they identify characteristics that can be leveraged to personalize and improve prevention and treatment related to PTE exposures, the ability to compare between these classes and choose an appropriate reference group is more straightforward within the population-representative sample than the PTE-subsample. Some have suggested that isolating a high exposure category (i.e. set as referent group) would allow for more class differentiation in sociodemographic factors and predicting psychiatric disorders (O’Donnell et al., 2017); however, in this study, models were identified along PTE qualitative composition rather than burden counts. Thus, for ease of interpretation to guide clinicians and policy makers, the population-representative sample, with a low-burden group identified, has great utility over the PTE-subsample.
We also observed different patterns in the population-representative versus PTE-subsample when specifically looking at associated mental health morbidity. In the population-representative sample, membership in almost all PTE classes relative to the low-burden class was linked to increased odds of lifetime and 12-month mental health disorders, as well as MDD or AUD specifically. The interpersonal violence class showed the highest odds of lifetime and 12-month mental health disorders, with almost three-fold odds of lifetime MDD and five-fold odds of lifetime AUD compared to the low-burden class. This emphasizes interpersonal violence as a particularly strong risk factor for poor mental health, even when compared to other PTEs (Devries et al., 2011; Mercy et al., 2017). On the other hand, in the PTE-subsample, membership in other PTE classes relative to the natural disaster class was linked to increased odds of mental health disorders, but more so for MDD than AUD, with no significant associations between class membership and 12-month AUD. As natural disaster-related PTEs are more likely to be experienced collectively, they are thus often accompanied by increased community need and resultant support, as compared to individually-experienced PTEs. It is important to note that not all LMICs have had an earthquake/natural disaster. Conversely, some settings have even higher interpersonal violence (e.g., Liberia). While it may reveal some overarching patterns, this LCA approach would likely need to be applied in a variety of LMIC settings to identify tailored patterns.
This study offers a number of strengths. Not only does it expand our understanding of the implications of sample selection (population-representative sample vs PTE-subsample) in polytraumatization profiles, but it draws upon a dataset large enough to explore both population-based estimates and PTE-restricted patterns, and in a Nepalese sample where PTE were assessed comprehensively and with a high response rate using the established CIDI instrument. Several limitations should be noted. First, generalizability to other settings may be limited given unique trauma exposures in Nepal, such as the 2015 earthquake (Goda et al., 2015). At the same time, Nepal’s agrarian population is similar to the majority of the world’s population living in Asia and Africa. In addition, given the dearth of such studies from LMICs, and the increased population-level risk of individuals within LMICs, we provide novel data on PTE exposure profiles that may more accurately reflect the realities of individuals in LMICs than those from similarly unique high-income contexts that dominate the literature. Second, while LCA methods allow researchers to explain variability within populations, there is much debate about how to select final class solutions using model fit statistics (Nylund et al., 2007). Since each fit statistic has limitations and various researchers have used different fit statistics to select final class solutions (Nylund-Gibson and Hart, 2014a), our study used an iterative approach combining information from multiple fit statistics to guide our final class selection decision. Some researchers have recommended exploring plausibility of models in addition to fit statistics (Nylund-Gibson and Hart, 2014a). Model entropy values for the population-based sample are low overall, suggesting poor separation of classes in these models, but not the PTE-restricted sample. Third, using the natural disaster class as the reference group in the trauma-exposed sample was informed by the fact that many individuals were exposed to the Nepal earthquake, and thus represents a more ubiquitous event, but limit the interpretation of the findings between classes. Fourth, the timing of exposure to PTEs and onset of mental health conditions was not ascertained specifically. This leaves open the possibility that onset of psychiatric disorder could have preceded PTE exposure, especially for those individuals endorsing multiple PTEs. This issue was somewhat attenuated by considering lifetime and 12-month psychiatric disorders separately and the brief sensitivity analyses that explored age at incident PTE and age at incident psychiatric disorder onset.
5. Conclusion
This is the first study to directly compare polytraumatization profiles between a population-representative sample and the more commonly employed PTE-restricted subsample. This is one of the few studies to document and explore latent classes of PTE in LMICs. Understanding profiles of lifetime trauma exposure, and their correlates and potential consequences, is challenging but important to improve treatment and preventive services, especially in resource-constrained contexts.
Supplementary Material
Acknowledgements
The authors thank the survey staff of the Institute for Social and Environmental Research–Nepal for collecting the data reported here; the staff of the Survey Research Operations unit of the University of Michigan’s Survey Research Center for development and support of the technical systems that made the fieldwork in Nepal possible; the World Mental Health Consortium leadership and staff at Harvard University for their input into the design and all subsequent steps of collecting and analyzing the data reported here; and the respondents of the CVFS, whose generous contributions made this research possible. The authors thank Erika Arias for her copyediting support. The authors alone remain responsible for any errors or omissions in this manuscript.
Role of the funding source
This work was supported by the National Institute of Mental Health (grant number R01MH110872) and the Eunice Kennedy Shriver National Institute of Child Health and Human Development (grant number P2CHD041028). Choi was supported in part by a Kaplen Fellowship on Depression from the Harvard Medical School. The sponsors played no direct role in study design, data collection, analysis, interpretation, manuscript preparation, or the decision to submit the paper for publication.
Footnotes
Conflict of interest
Ghimire is also the Director of the Institute for Social and Environmental Research–Nepal (ISER-N) that collected the data for the research reported here. Ghimire’s conflict of interest management plan is approved and monitored by the Regents of the University of Michigan. None of the other authors have a potential conflict of interest.
CRediT authorship contribution statement
The authors of this manuscript are Sabrina Hermosilla, Karmel W. Choi, Melanie Askari, Taylor Marks, Christy Denckla, William Axinn, Jordan W. Smoller, Dirgha Ghimire, and Corina Benjet. Hermosilla and Choi led the conceptualization and writing of this paper and all other authors contributed to both conceptualization and writing. Hermosilla and Askari led the analyses for this paper, with support from Marks. Axinn and Ghimire direct the Chitwan Valley Family Study, including the mental health data collection analyzed here. Askari, Axinn, Choi, Ghimire, Marks, and Hermosilla have direct access to these protected data; Smoller and Benjet have indirect access. Hermosilla, Askari, and Marks have verified the underlying data. These results have not been presented anywhere other than this manuscript.
Supplementary data to this article can be found online at https://doi.org/10.1016/j.jad.2022.07.006.
References
- Adams ZW, Moreland A, Cohen JR, Lee RC, Hanson RF, Danielson CK, Self-Brown S, Briggs EC, 2016. Polyvictimization: latent profiles and mental health outcomes in a clinical sample of adolescents. Psychol. Violence 6, 145–155. 10.1037/a0039713. [DOI] [PMC free article] [PubMed] [Google Scholar]
- Akaike H, 1987. Factor analysis and AIC. Psychometrika 52, 317–332. 10.1007/BF02294359. [DOI] [Google Scholar]
- <collab>American Psychological Association, A.P.</collab>, 2013. Diagnostic And Statistical Manual of Mental Disorders (DSM-5®). American Psychiatric Pub. [Google Scholar]
- Araya R, Lewis G, Rojas G, Fritsch R, 2003. Education and income: which is more important for mental health? J. Epidemiol. Community Health 57, 501–505. 10.1136/jech.57.7.501. [DOI] [PMC free article] [PubMed] [Google Scholar]
- Atwoli L, Stein DJ, King A, Petukhova M, Aguilar-Gaxiola S, Alonso J, Bromet EJ, de Girolamo G, Demyttenaere K, Florescu S, Maria Haro J, Karam EG, Kawakami N, Lee S, Lepine J-P, Navarro-Mateu F, O’Neill S, Pennell B-E, Piazza M, Posada-Villa J, Sampson NA, ten Have M, Zaslavsky AM, Kessler RC, on behalf of the WHO World Mental Health Survey Collaborators, 2017. Posttraumatic stress disorder associated with unexpected death of a loved one: cross-national findings from the world mental health surveys: Atwoli et al. Depress. Anxiety 34, 315–326. 10.1002/da.22579. [DOI] [PMC free article] [PubMed] [Google Scholar]
- Axinn WG, Chardoul S, Gatny H, Ghimire DJ, Smoller JW, Zhang Y, Scott KM, 2020a. Using life history calendars to improve measurement of lifetime experience with mental disorders. Psychol. Med. 50, 515–522. 10.1017/S0033291719000394. [DOI] [PMC free article] [PubMed] [Google Scholar]
- Axinn WG, Choi KW, Ghimire DJ, Cole F, Hermosilla S, Benjet C, Morgenstern MC, Lee YH, Smoller JW, 2022. Community-level social support infrastructure and adult onset of major depressive disorder in a South Asian postconflict setting. JAMA Psychiatry. 10.1001/jamapsychiatry.2021.4052. [DOI] [PMC free article] [PubMed] [Google Scholar]
- Axinn WG, Ghimire D, Williams NE, 2012. Collecting survey data during armed conflict. J. Off. Stat. 28, 153–171. [PMC free article] [PubMed] [Google Scholar]
- Axinn WG, Zhang Y, Ghimire DJ, Chardoul SA, Scott KM, Bruffaerts R, 2020b. The association between marital transitions and the onset of major depressive disorder in a South Asian general population. J. Affect. Disord. 266, 165–172. 10.1016/j.jad.2020.01.069. [DOI] [PMC free article] [PubMed] [Google Scholar]
- Barber JS, Shivakoti GP, Axinn WG, Gajurel K, 1997. Sampling strategies for rural settings: a detailed example from the Chitwan Valley Family Study,Nepal. Nepal Popul. J. 6, 193–203. [Google Scholar]
- Benjet C, Axinn WG, Hermosilla S, Schulz P, Cole F, Sampson L, Ghimire D, 2020. Exposure to armed conflict in childhood vs older ages and subsequent onset of major depressive disorder. JAMA Netw. Open 3, e2019848. 10.1001/jamanetworkopen.2020.19848. [DOI] [PMC free article] [PubMed] [Google Scholar]
- Benjet C, Bromet E, Karam EG, Kessler RC, McLaughlin KA, Ruscio AM, Shahly V, Stein DJ, Petukhova M, Hill E, Alonso J, Atwoli L, Bunting B, Bruffaerts R, Caldas-de-Almeida JM, de Girolamo G, Florescu S, Gureje O, Huang Y, Lepine JP, Kawakami N, Kovess-Masfety V, Medina-Mora ME, Navarro-Mateu F, Piazza M, Posada-Villa J, Scott KM, Shalev A, Slade T, ten Have M, Torres Y, Viana MC, Zarkov Z, Koenen KC, 2016. The epidemiology of traumatic event exposure worldwide: results from the World Mental Health Survey Consortium. Psychol. Med. 46, 327–343. 10.1017/S0033291715001981. [DOI] [PMC free article] [PubMed] [Google Scholar]
- Bjelland I, Krokstad S, Mykletun A, Dahl AA, Tell GS, Tambs K, 2008. Does a higher educational level protect against anxiety and depression? The HUNT study. Soc. Sci. Med. 66, 1334–1345. 10.1016/j.socscimed.2007.12.019. [DOI] [PubMed] [Google Scholar]
- Boughtonet al n.d.O., Boughton GG, Jones CBD, Lavy CE, Grimes, n.d. Young, male, road traffic victims: a systematic review of the published trauma registry literature from low and middle income countries. SICOT-J 1, 10. doi: 10.1051/sicotj/2015007. [DOI] [PMC free article] [PubMed] [Google Scholar]
- Breslau N, Kessler RC, Chilcoat HD, Schultz LR, Davis GC, Andreski P, 1998. Trauma and posttraumatic stress disorder in the community: the 1996 Detroit Area Survey of Trauma. Arch. Gen. Psychiatry 55, 626–632. 10.1001/archpsyc.55.7.626. [DOI] [PubMed] [Google Scholar]
- Butler M, Warfa N, Khatib Y, Bhui K, 2015. Migration and common mental disorder: an improvement in mental health over time? Int. Rev. Psychiatry 27, 51–63. 10.3109/09540261.2014.996858. [DOI] [PubMed] [Google Scholar]
- Chandran A, Hyder AA, Peek-Asa C, 2010. The global burden of unintentional injuries and an agenda for progress. Epidemiol. Rev. 32, 110–120. 10.1093/epirev/mxq009. [DOI] [PMC free article] [PubMed] [Google Scholar]
- Cole F, Benjet C, Ghimire DJ, Axinn WG, 2021. Predictors of transitions across stages of alcohol use and disorders in an adult population with heterogeneous ethnic restrictions regarding drinking. Addiction 116, 809–818. 10.1111/add.15221. [DOI] [PMC free article] [PubMed] [Google Scholar]
- Collins LM, Lanza ST, 2009. Latent Class And Latent Transition Analysis: With Applications in the Social, Behavioral, And Health Sciences. John Wiley & Sons. [Google Scholar]
- Contractor AA, Caldas S, Fletcher S, Shea MT, Armour C, 2018a. Empirically derived lifespan polytraumatization typologies: a systematic review. J. Clin. Psychol. 74, 1137–1159. 10.1002/jclp.22586. [DOI] [PubMed] [Google Scholar]
- Contractor AA, Caldas S, Fletcher S, Shea MT, Armour C, 2018b. Empirically derived lifespan polytraumatization typologies: a systematic review. J. Clin. Psychol. 74, 1137–1159. 10.1002/jclp.22586. [DOI] [PubMed] [Google Scholar]
- Devries K, Watts C, Yoshihama M, Kiss L, Schraiber LB, Deyessa N, Heise L, Durand J, Mbwambo J, Jansen H, Berhane Y, Ellsberg M, Garcia-Moreno C, WHO Multi-Country Study Team, 2011. Violence against women is strongly associated with suicide attempts: evidence from the WHO multi-country study on women’s health and domestic violence against women. Soc. Sci. Med. 1982 (73), 79–86. [DOI] [PubMed] [Google Scholar]
- Duhig M, Patterson S, Connell M, Foley S, Capra C, Dark F, Gordon A, Singh S, Hides L, McGrath JJ, Scott J, 2015. The prevalence and correlates of childhood trauma in patients with early psychosis. Aust. N. Z. J. Psychiatry 49, 651–659. 10.1177/0004867415575379. [DOI] [PubMed] [Google Scholar]
- Dursa EK, Reinhard MJ, Barth SK, Schneiderman AI, 2014. Prevalence of a positive screen for PTSD among OEF/OIF and OEF/OIF-era veterans in a large population-based cohort. J. Trauma. Stress 27, 542–549. 10.1002/jts.21956. [DOI] [PubMed] [Google Scholar]
- Esie P, Osypuk TL, Schuler SR, Bates LM, 2019. Intimate partner violence and depression in rural Bangladesh: accounting for violence severity in a high prevalence setting. SSM - Popul. Health 7, 100368. 10.1016/j.ssmph.2019.100368. [DOI] [PMC free article] [PubMed] [Google Scholar]
- Ghimire DJ, Chardoul S, Kessler RC, Axinn WG, Adhikari BP, 2013. Modifying and validating the composite international diagnostic interview (CIDI) for use in Nepal. Int. J. Methods Psychiatr. Res. 22, 71–81. 10.1002/mpr.1375. [DOI] [PMC free article] [PubMed] [Google Scholar]
- Gill DA, Ritchie LA, Picou JS, Langhinrichsen-Rohling J, Long MA, Shenesey JW, 2014. The exxon and BP oil spills: a comparison of psychosocial impacts. Nat. Hazards 74, 1911–1932. 10.1007/s11069-014-1280-7. [DOI] [Google Scholar]
- Giordano GN, Ohlsson H, Kendler KS, Sundquist K, Sundquist J, 2014. Unexpected adverse childhood experiences and subsequent drug use disorder: a Swedish population study (1995–2011). Addict. Abingdon Engl. 109, 1119–1127. 10.1111/add.12537. [DOI] [PMC free article] [PubMed] [Google Scholar]
- Goda K, Kiyota T, Pokhrel RM, Chiaro G, Katagiri T, Sharma K, Wilkinson S, 2015. The 2015 Gorkha Nepal earthquake: insights from earthquake damage survey. Front. Built Environ. 1 10.3389/fbuil.2015.00008. [DOI] [Google Scholar]
- Golder S, Connell CM, Sullivan TP, 2012. Psychological distress and substance use among community-recruited women currently victimized by intimate partners: a latent class analysis and examination of between-class differences. Violence Women 18, 934–957. 10.1177/1077801212456991. [DOI] [PMC free article] [PubMed] [Google Scholar]
- Iverson KM, McLaughlin KA, Gerber MR, Dick A, Smith BN, Bell ME, Cook N, Mitchell KS, 2013. Exposure to interpersonal violence and its associations with psychiatric morbidity in a U.S. national sample: a gender comparison. Psychol. Violence 3, 273–287. 10.1037/a0030956. [DOI] [PMC free article] [PubMed] [Google Scholar]
- Jankovic J, Bremner S, Bogic M, Lecic-Tosevski D, Ajdukovic D, Franciskovic T, Galeazzi GM, Kucukalic A, Morina N, Popovski M, Schützwohl M, Priebe S, 2013. Trauma and suicidality in war affected communities. Eur. Psychiatry 28, 514–520. 10.1016/j.eurpsy.2012.06.001. [DOI] [PubMed] [Google Scholar]
- Kelber MS, Smolenski DJ, Workman DE, Morgan MA, Garvey Wilson AL, Campbell MS, Evatt DP, Belsher BE, 2019. Typologies of combat exposure and their effects on posttraumatic stress disorder and depression symptoms. J. Trauma. Stress 32, 946–956. 10.1002/jts.22459. [DOI] [PubMed] [Google Scholar]
- Kessler RC, Aguilar-Gaxiola S, Alonso J, Benjet C, Bromet EJ, Cardoso G, Degenhardt L, de Girolamo G, Dinolova RV, Ferry F, Florescu S, Gureje O, Haro JM, Huang Y, Karam EG, Kawakami N, Lee S, Lepine J-P, Levinson D, Navarro-Mateu F, Pennell B-E, Piazza M, Posada-Villa J, Scott KM, Stein DJ, Ten Have M, Torres Y, Viana MC, Petukhova MV, Sampson NA, Zaslavsky AM, Koenen KC, 2017. Trauma and PTSD in the WHO world mental health surveys. Eur. J. Psychotraumatology 8. 10.1080/20008198.2017.1353383. [DOI] [PMC free article] [PubMed] [Google Scholar]
- Kessler RC, Sonnega A, Bromet E, Hughes M, Nelson CB, 1995. Posttraumatic stress disorder in the National Comorbidity Survey. Arch. Gen. Psychiatry 52, 1048–1060. 10.1001/archpsyc.1995.03950240066012. [DOI] [PubMed] [Google Scholar]
- Keyes KM, Pratt C, Galea S, McLaughlin KA, Koenen KC, Shear MK, 2014. The burden of loss: unexpected death of a loved one and psychiatric disorders across the life course in a national study. Am. J. Psychiatry 171, 864–871. 10.1176/appi.ajp.2014.13081132. [DOI] [PMC free article] [PubMed] [Google Scholar]
- Lo Y, Mendell NR, Rubin DB, 2001. Testing the number of components in a normal mixture. Biometrika 88, 767–778. 10.1093/biomet/88.3.767. [DOI] [Google Scholar]
- Lowe SR, Galea S, Uddin M, Koenen KC, 2014. Trajectories of posttraumatic stress among urban residents. Am. J. Community Psychol. 53, 159–172. 10.1007/s10464-014-9634-6. [DOI] [PMC free article] [PubMed] [Google Scholar]
- McCutcheon VV, Heath AC, Nelson EC, Bucholz KK, Madden PAF, Martin NG, 2010. Clustering of trauma and associations with single and co-occurring depression and panic attack over twenty years. Twin Res. Hum.Genet. 13, 57–65. 10.1375/twin.13.1.57. [DOI] [PMC free article] [PubMed] [Google Scholar]
- Mercy JA, Hillis SD, Butchart A, Bellis MA, Ward CL, Fang X, Rosenberg ML, 2017. Interpersonal Violence: Global Impact And Paths to Prevention, Injury Prevention And Environmental Health, 3rd edition. The International Bank for Reconstruction and Development/The World Bank. 10.1596/978-1-4648-0522-6_ch5. [DOI] [PubMed] [Google Scholar]
- Muthen LK, Muthen BO, 2017. Mplus Statistical Analysis With Latent Variables User’s Guide. 1998–2017, Eighth edition. [Google Scholar]
- Nylund KL, Asparouhov T, Muthén BO, 2007. Deciding on the number of classes in latent class analysis and growth mixture modeling: a Monte Carlo simulation study. Struct. Equ. Model. Multidiscip. J. 14, 535–569. 10.1080/10705510701575396. [DOI] [Google Scholar]
- Nylund-Gibson K, Hart SR, 2014. Latent class analysis in prevention science. In: Sloboda Z, Petras H (Eds.), Defining Prevention Science, Advances in Prevention Science. Springer US, Boston, MA, pp. 493–511. 10.1007/978-1-4899-7424-2_21. [DOI] [Google Scholar]
- O’Donnell ML, Schaefer I, Varker T, Kartal D, Forbes D, Bryant RAA, Silove D, Creamer M, McFarlane A, Malhi G, Felmingham K, Van Hoof M, Hadzi-Pavlovic D, Nickerson A, Steel Z, 2017. A systematic review of person-centered approaches to investigating patterns of trauma exposure. Clin. Psychol. Rev. 57, 208–225. 10.1016/j.cpr.2017.08.009. [DOI] [PubMed] [Google Scholar]
- Pollack AA, Weiss B, Trung LT, 2016. Mental health, life functioning and risk factors among people exposed to frequent natural disasters and chronic poverty in Vietnam. BJPsych Open 2, 221–232. 10.1192/bjpo.bp.115.002170. [DOI] [PMC free article] [PubMed] [Google Scholar]
- Ramaswamy V, Desarbo WS, Reibstein DJ, Robinson WT, 1993. An empirical pooling approach for estimating marketing mix elasticities with PIMS data. Mark. Sci. 12, 103–124. [Google Scholar]
- Schwarz G, 1978. Estimating the dimension of a model. Ann. Stat. 6, 461–464. 10.1214/aos/1176344136. [DOI] [Google Scholar]
- Schweininger S, Forbes D, Creamer M, McFarlane AC, Silove D, Bryant RA, O’Donnell ML, 2015. The temporal relationship between mental health and disability after injury. Depress. Anxiety 32, 64–71. 10.1002/da.22288. [DOI] [PubMed] [Google Scholar]
- Scott KM, Zhang Y, Chardoul S, Ghimire DJ, Smoller JW, Axinn WG, 2020. Resilience to mental disorders in a low-income, non-Westernized setting. Psychol. Med. 1–10 10.1017/S0033291720001464. [DOI] [PMC free article] [PubMed] [Google Scholar]
- Sullivan E, Contractor AA, Gerber MM, Neumann C, 2017. Examination of polytrauma typologies: a latent class analysis approach. Psychiatry Res. 255, 111–118. 10.1016/j.psychres.2017.05.026. [DOI] [PubMed] [Google Scholar]
- Sumner, Jennifer A, Kubzansky, Laura D, Elkind Mitchell SV, Roberts, Andrea, Jessica, Agnew-Blais, Qixuan, Chen, Magdalena, Cerdá, Rexrode, Kathryn M, Rich-Edwards, Janet W, Donna, Spiegelman, Suglia, Shakira F, Rimm, Eric B, Koenen, Karestan C, 2015. Trauma exposure and posttraumatic stress disorder symptoms predict onset of cardiovascular events in women. Circulation 132, 251–259. 10.1161/CIRCULATIONAHA.114.014492. [DOI] [PMC free article] [PubMed] [Google Scholar]
- Tang W, Lu Y, Xu J, 2018. Post-traumatic stress disorder, anxiety and depression symptoms among adolescent earthquake victims: comorbidity and associated sleep-disturbing factors. Soc. Psychiatry Psychiatr. Epidemiol. 53, 1241–1251. 10.1007/s00127-018-1576-0. [DOI] [PubMed] [Google Scholar]
- University of Michigan, 2019. Chitwan Valley Family Study [WWW Document]. Welcome Chitwan Val. Fam. Study. URL. https://cvfs.isr.umich.edu/ (accessed 1.5.21). [Google Scholar]
- Walsh JL, Senn TE, Carey MP, 2012. Exposure to different types of violence and subsequent sexual risk behavior among female STD clinic patients: a latent class analysis. Psychol. Violence 2, 339–354. 10.1037/a0027716. [DOI] [PMC free article] [PubMed] [Google Scholar]
- Wegman F, 2017. In: The future of road safety: a worldwide perspective. IATSS Res., Special issue: The first global interactive forum on traffic and safety (2015) symposium on “diverse, regionally-rooted transport cultures”, 40, pp. 66–71. 10.1016/j.iatssr.2016.05.003. [DOI] [Google Scholar]
- Westphal M, Olfson M, Bravova M, Gameroff MJ, Gross R, Wickramaratne P, Pilowsky DJ, Neugebauer R, Shea S, Lantigua R, Weissman M, Neria Y, 2013. Borderline personality disorder, exposure to interpersonal trauma, and psychiatric comorbidity in urban primary care patients. Psychiatry 76, 365–380. 10.1521/psyc.2013.76.4.365. [DOI] [PubMed] [Google Scholar]
- Williams NE, Ghimire DJ, Axinn WG, Jennings EA, Pradhan MS, 2012. A micro-level event-centered approach to investigating armed conflict and population responses. Demography 49, 1521–1546. 10.1007/s13524-012-0134-8. [DOI] [PMC free article] [PubMed] [Google Scholar]
- Wolf EJ, Miller MW, Kilpatrick D, Resnick HS, Badour CL, Marx BP, Keane TM, Rosen RC, Friedman MJ, 2015. ICD–11 complex PTSD in U.S. national and veteran samples: prevalence and structural associations with PTSD. Clin. Psychol. Sci. 3, 215–229. 10.1177/2167702614545480. [DOI] [PMC free article] [PubMed] [Google Scholar]
- Young-Wolff K, Hellmuth J, Jaquier Erard V, Swan S, Connell C, Sullivan T, 2013. Patterns of resource utilization and mental health symptoms among women exposed to multiple types of victimization: a latent class analysis. J. Interpers. Violence 28. 10.1177/0886260513488692. [DOI] [PMC free article] [PubMed] [Google Scholar]
- Ziobrowski HN, Buka SL, Austin SB, Sullivan AJ, Horton NJ, Simone M, Field AE, 2020. Using latent class analysis to empirically classify maltreatment according to the developmental timing, duration, and co-occurrence of abuse types. Child Abuse Negl. 107, 104574 10.1016/j.chiabu.2020.104574. [DOI] [PMC free article] [PubMed] [Google Scholar]
Associated Data
This section collects any data citations, data availability statements, or supplementary materials included in this article.