Abstract
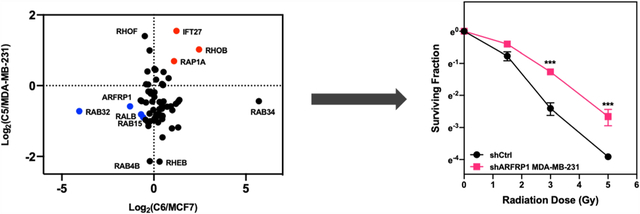
Radiation therapy benefits more than 50% of all cancer patients and cures 40% of them, where ionizing radiation (IR) deposits energy to cells and tissues, thereby eliciting DNA damage and resulting in cell death. Small GTPases are a superfamily of proteins that play critical roles in cell signaling. Several small GTPases, including RAC1, RHOB, and RALA, were previously shown to modulate radioresistance in cancer cells. However, there is no systematic proteomic study on small GTPases that regulate radioresistance in cancer cells. Herein, we applied a high-throughput scheduled multiple-reaction monitoring (MRM) method, along with the use of synthetic stable isotope-labeled (SIL) peptides, to identify differentially expressed small GTPase proteins in two pairs of breast cancer cell lines, MDA-MB-231 and MCF7, and their corresponding radioresistant cell lines. We identified 7 commonly altered small GTPase proteins with over 1.5-fold changes in the two pairs of cell lines. We also discovered ARFRP1 as a novel regulator of radioresistance, where its downregulation promotes radioresistance in breast cancer cells. Together, this represents the first comprehensive investigation about the differential expression of the small GTPase proteome associated with the development of radioresistance in breast cancer cells. Our work also uncovered ARFRP1 as a new target for enhancing radiation sensitivity in breast cancer.
Graphical Abstract
INTRODUCTION
Small guanosine triphosphatases (small GTPases) are a superfamily of low-molecular-weight proteins that turn on their molecular functions through binding of GTP and turn off these functions through hydrolysis of the bound GTP to GDP.1 Small GTPases are involved in many important cellular processes, including membrane trafficking, cell migration, and cell cycle progression through modulating the relevant signaling pathways.2–4 Many of them have been shown to promote cancer progression.5–8
In the latest report by the International Agency for Research on Cancer (IARC), breast cancer is the most commonly diagnosed cancer in the world.9 Aside from surgery, treatment modalities for breast cancer include chemotherapy, hormone therapy, and radiation.10 Among them, radiation therapy is beneficial to cancer patients owing to its localized application and little effect to the rest of the body. More than 50% of cancer patients receive radiation therapy.11 It is an effective way to cure and shrink the size of tumor and stop cancer recurrence, and it can be used to treat relapsed cancer. However, a significant portion of patients develop radioresistance.12,13 Therefore, to improve treatment efficacy and prognosis, it is important to understand the biological processes and molecular mechanisms through which the sensitivity of cancer cells toward ionizing radiation (IR) is regulated.
An increasing number of studies revealed that small GTPases are involved in modulating radioresistance in cancer cells. For instance, downregulation of RHOB in glioma cells reduces cancer cell survival after IR.14 RAB27B, which is upregulated in IR-exposed glioma cells, controls the proliferation of cancer cells through an epiregulin-mediated pathway.15 RALA and RALB regulate colony formation, cell survival, and DNA repair following IR exposure.16 However, there is no systematic proteomic study on which small GTPases regulate radioresistance in cancer cells.
In this study, we employed an MRM-based targeted proteomic method, along with the use of stable isotope-labeled (SIL) peptides, to examine the differential expression of small GTPases accompanied with the acquisition of radioresistance in two breast cancer cell lines. We identified several commonly altered small GTPases, and demonstrated that the diminished expression of one of them, i.e., ARFRP1 (ADP-ribosylation factor-related protein 1), confers radioresistance in breast cancer cells.
EXPERIMENTAL SECTION
Cell Culture and shRNA Knockdown.
Radioresistant C5 and C6 cell lines were generated previously.17–19 MDA-MB-231/C5 and MCF7/C6 pairs of breast cancer cells were cultured in Dulbecco’s modified Eagle’s medium (DMEM, Thermo Fisher) supplemented with 10% fetal bovine serum (FBS, Thermo Fisher) and 1% penicillin–streptomycin solution (PS, GE Healthcare). The cells were maintained at 37 °C in a humidified chamber supplemented with 5% CO2. The shRNA stable knockdown cells were generated using pLKO.1-shRNA plasmids targeting ARFRP1 gene at the 3′-UTR and coding regions. Oligonucleotide sequences are listed in Table S1. Successful constructions of pLKO.1-shRNA plasmids were confirmed by Sanger sequencing.
Cell Lysis and Proteomic Sample Preparation.
Total protein lysates of MDA-MB-231/C5 and MCF7/C6 cells were prepared by using CelLytic M cell lysis reagent (Sigma) supplemented with a protease inhibitor cocktail (Sigma). Protein concentration was measured by using Quick Start Bradford Protein Assay (Bio-Rad). Fifty micrograms of total proteins in Laemmli loading buffer were boiled for 10 min and loaded onto a 15% SDS-PAGE gel. The gel was subsequently stained with Coomassie Brilliant Blue R-250, destained, and proteins were digested in-gel as described previously.20,21 In brief, gel bands corresponding to a molecular weight range of 15–37 kDa were cut into 1 mm3 cubes and destained sequentially with 25 and 50% CH3CN in 50 mM ammonium bicarbonate (pH 7.8). Cysteine reduction and alkylation were performed by incubating the gel pieces in 10 mM dithiothreitol (DTT) at 37 °C for 1 h and 55 mM iodoacetamide at room temperature in the dark for 20 min, respectively. The proteins were digested with MS-grade trypsin (Pierce) at 37 °C for 16 h. Peptides were eluted by shaking in a solution containing CH3CN/H2O/acetic acid (45/45/5, v/v) and dried by a Speed-Vac. The tryptic peptides were then desalted using C18 ZipTip (Agilent). Prior to the LC-MRM analysis, each digestion mixture was spiked-in with 4 fmol each of synthetic small GTPase peptides (New England Peptide, Inc.) with a C-terminal [15N2, 13C6]-labeled lysine or [15N4, 13C6]-labeled arginine. In this regard, the amount of spiked-in SIL peptides was based on the optimized amount from a previously published study.22
Liquid Chromatography–Tandem Mass Spectrometry (LC–MS/MS) Analysis.
The MRM-based LC–MS/MS experiments were performed on a TSQ Altis triple-quadrupole mass spectrometer (Thermo Fisher) equipped with a Flex nanoelectrospray ion source (Thermo Fisher), where an UltiMate 3000 UPLC (Thermo Fisher) was employed for separation. The sample was loaded onto an in-house packed C18 (5 μm in particle size and 120 Å in pore size, Dr. Maisch GmbH HPLC) trapping column (150 μm i.d.) with buffer A, which contained 0.1% formic acid in water. The eluted peptides were loaded onto an analytical column (75 μm i.d.) packed in-house with C18 resin (3 μm in particle size and 120 Å in pore size, Dr. Maisch GmbH HPLC), using a 90-min gradient of 10–45% buffer B (80% CH3CN in 0.1% formic acid). The peptides were ionized with a spray voltage of 2200 V, and the ion transport tube temperature was set at 325 °C. The resolution of Q1 and Q3 was set at 0.7 Th full-width at half-maximum (FWHM). Fragmentation of precursor ions in Q2 was conducted with 1.5 mTorr argon. The collision energy was derived from default settings in Skyline (version 21.2).23 The retention time (RT) of 10 tryptic peptides of BSA was monitored and used to derive the normalized retention time (iRT)–RT calibration curve and to generate the scheduled MRM method in Skyline. The mass spectrometer was scheduled to monitor the precursor to product ion transitions of 144 unique peptides of human small GTPases with a cycle time of 3 s in a 4.5-min RT window.
The mass spectrometry proteomics data have been deposited to the ProteomeXchange Consortium24 via the PRIDE partner repository with the data set identifier PXD034360.
LC-MRM Data Processing.
The acquired LC-MRM data were imported to Skyline. In Skyline, all peptides were filtered with dot-product (dotp) value of >0.7, where the dotp scores were assigned by comparing the similarities of the observed relative abundances of fragment ions to those in the spectral library.25 The potential interfering fragment ions that do not overlay with other fragment ions were manually excluded (i.e., processed data). The signal intensity ratios for unlabeled over stable isotope-labeled small GTPase peptides were directly exported from Skyline. Detailed MRM quantification data are listed in Table S2.
Western Blot.
MDA-MB-231/C5 and MCF-7/C6 pairs of breast cancer cells were lysed with CelLytic M cell lysis reagent (Sigma) supplemented with 1% protease inhibitor cocktail and denatured at 95 °C for 5-min in Laemmli loading buffer. Protein concentration was measured by Quick Start Bradford Protein Assay (Bio-Rad). Thirty micrograms of proteins from the denatured lysats were separated using 15% SDS-PAGE and transferred onto a nitrocellulose membrane. The membrane was blocked with 5% non-fat milk in PBS-T (PBS with 0.1% Tween 20) for 1 h and then incubated with the corresponding primary antibodies, including human ARFRP1 (Proteintech, 17712-1-AP, 1:800 dilution), IFT27 (Proteintech, 15017-1-AP, 1:500 dilution), and anti-tubulin (Santa Cruz, SC-32293, 1:5000). The secondary antibodies were donkey anti-rabbit secondary antibody (Sigma, A0545, 1:5000) or anti-mouse secondary antibody (Santa Cruz, m-IgGκ BP-HRP, 1:5000).
Total RNA Extraction and Real-Time Quantitative-PCR (RT-qPCR).
Total RNA was extracted with Total RNA Kit I (Omega) and purified with HiBind RNA mini columns (VWR). Two micrograms of total RNA was mixed with M-MLV Reverse Transcriptase (Promega, Madison, WI, USA) for cDNA synthesis. RT-qPCR was conducted as previously described,26 with the use of Luna Universal qPCR Master Mix (NEB) on a CFX96 RT-qPCR detection system (Bio-Rad).
Clonogenic Survival Assay.
Clonogenic survival assay was performed as described previously.27,28 Briefly, control shRNA- and shARFRP1-treated MCF-7 and MDA-MB-231 cells were plated in triplicate in six-well plates at a concentration of 300 cells per well for 0 and 1.5 Gy treatment, and 600 cells per well for 3 and 5 Gy treatment. X-rays were delivered using a Rad Source RS-2000 cabinet irradiator (Rad Source Technologies, Buford, GA) followed by a 10-day incubation. Cell colonies were fixed and stained in an aqueous solution containing 6.0% glutaraldehyde and 0.5% crystal violet. The plates were then rinsed with water and dried at room temperature in air. Those colonies with at least 50 cells were counted. The survival fraction (SF) was calculated using the following equation:
where Ncolonies,IR and Ncolonies,control are the numbers of colonies formed from IR-treated and control untreated cells, respectively, and Nseeded,IR and Nseeded,control are the numbers of cells seeded for IR treatment and without IR treatment, respectively.
RESULTS AND DISCUSSION
MRM-Based Quantitative Profiling of Small GTPases in Modulating Radioresistance of Breast Cancer Cells.
In this study, we compared the expression levels of small GTPases in two lines of breast cancers cells (i.e., MDA-MB-231 and MCF7) and their corresponding radioresistant C5 and C6 clones17,19 by applying a previously developed scheduled multiple-reaction monitoring (MRM)-based targeted quantitative proteomic approach, together with the use of synthetic SIL peptides as internal standards (Figure 1A).22,29 We observed a number of small GTPases altered in radioresistant breast cancer cells relative to parental cells, including RHOB and RALB, which are known regulators of radiation sensitivity.14,16,30 We also discovered novel candidate small GTPase regulators of radiation sensitivity in breast cancer cells, which provides potential targets for improving the efficacy of cancer radiotherapy.
Figure 1.
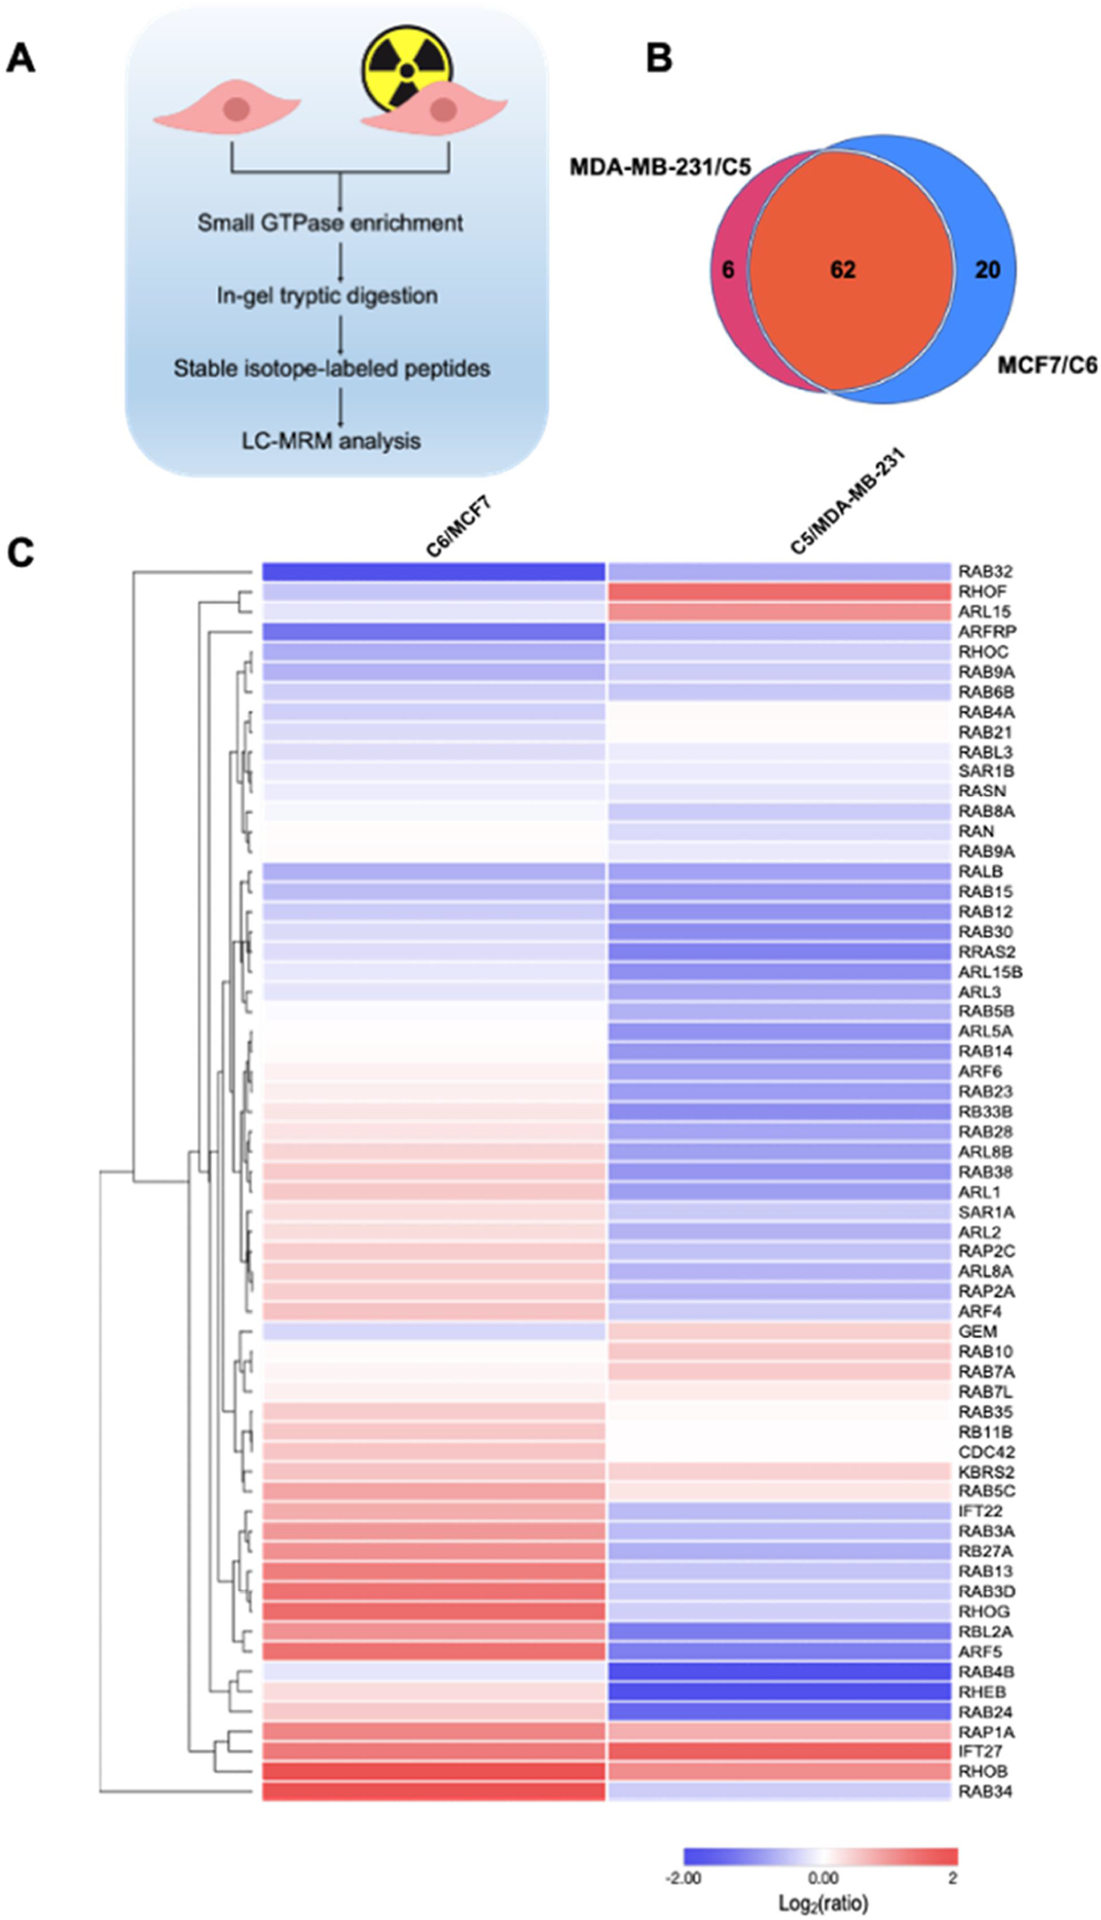
A scheduled LC-MRM method for interrogating the differential expression of small GTPases in breast cancer cells and the corresponding radioresistant cell lines. (A) A schematic diagram illustrating the workflow of the LC-MRM method for discovering small GTPases that modulate radioresistance. (B) A Venn diagram showing the numbers of quantified small GTPases in MDA-MB-231/C5 and MCF7/C6 pairs of breast cancer cells. (C) Hierarchical clustering displaying the Log2-transformed expression fold changes of small GTPases in radioresistant C5 and C6 cells relative to the corresponding parental MDA-MB-231 and MCF7 cells. Hierarchical clustering was generated using Perseus, where red and blue boxes designate proteins up- and down-regulated, respectively, in radioresistant breast cancer cells relative to the corresponding parental lines. Protein expression was clustered using Euclidean distance.
To achieve high-throughput analysis of small GTPase proteins in breast cancer cells, we employed a previously developed scheduled LC-MRM method.22,29 In this regard, our MRM library consists of 144 unique peptides derived from 144 non-redundant small GTPases (one peptide per protein), representing 86% of the human small GTPase proteome with a total of 167 known proteins.31 For MRM analysis, we chose three most abundant fragment ions observed in MS/MS acquired from shotgun proteomic analyses for each peptide. We conducted the experiments in three biological replicates, where samples from each replicate were analyzed by LC–MS/MS twice, and processed the data using Skyline.23
The LC-MRM data allowed us to quantify 82 and 68 proteins in the MCF7/C6 and MDA-MB-231/C5 pairs, respectively, with 62 small GTPases being commonly quantified in the two pairs (Figure 1B). In this context, we were able to detect 93 SIL peptides with dotp value of >0.7. The failure in detecting other SIL peptides may emanate from their low abundance in the crude SIL pool and/or ion suppression from the sample matrices. For some small GTPase peptides, we were able to detect the spiked-in heavy peptides but not the respective endogenous peptides, which might be attributed to low levels of expression of the corresponding GTPase proteins in these breast cancer cells. In this vein, we analyzed previously reported RNA-Seq data for MCF7 and MDA-MB-231 cells (GSM2095708 and GSM2095710). We found that some small GTPases, e.g., RAP2B, ARL13A, RAB41, ARL9, ARL10, RERGL, RAB19, and DIRAS2, exhibit relatively low levels of mRNA expression, also show low intensities for the light-labeled peptides in our MRM results. However, other small GTPases, e.g., RAB7B, RHOD, RAC1, and REM1, which display high levels of mRNA expression, were not detectable in our MRM analysis. Thus, the failure to detect some small GTPases at the protein level does not always arise from low levels of mRNA expression, which is in line with the notion that transcript levels are in many cases insufficient predictors of protein levels.32 On the other hand, post-translational modifications may shift molecular weights of some small GTPases out of the 15–37 kDa range (the portion of the gel that we employed for in-gel tryptic digestion and subsequent LC–MS/MS analysis), and/or introduce mass shifts of the tryptic peptides monitored in MRM, which may also contribute to failure in detecting some of the peptides.
We also performed hierarchical clustering analysis with Euclidean metric applied to the distance measurement (Figure 1C). Such analysis illustrates the similarities and differences in the quantified levels of small GTPases in the radioresistant clones over the corresponding parental breast cancer cell lines. Many small GTPase proteins were commonly up- or downregulated in the two radioresistant/parental pairs of breast cancer cells, while some exhibit different trends in the two pairs. This is not surprising on the grounds that MCF7 and MDA-MB-231 cells were derived from different breast cancer patients, where genetic heterogeneity may also contribute to differences in expression levels of small GTPases accompanied with the acquisition of radioresistance.
Validation of Differential Expression of Small GTPases in Parental/Radioresistant Breast Cancer Cells.
We further categorized the quantified small GTPase proteins by imposing a cut-off of at least 1.5-fold difference in expression levels, which yielded 29 and 38 substantially changed proteins in MCF7/C6 and MDA-MB-231/C5 pairs, respectively (Figure 2A, B). Among them, 7 proteins, including the known radioresistant regulators RALB and RHOB, were found to be commonly altered in both pairs with at least 1.5-fold changes (Figure 2C). We further validated the differential expression of ARFRP1 and IFT27 proteins by Western blot analyses (Figures 3 and S1), suggesting the quantification accuracy of the MRM method.
Figure 2.
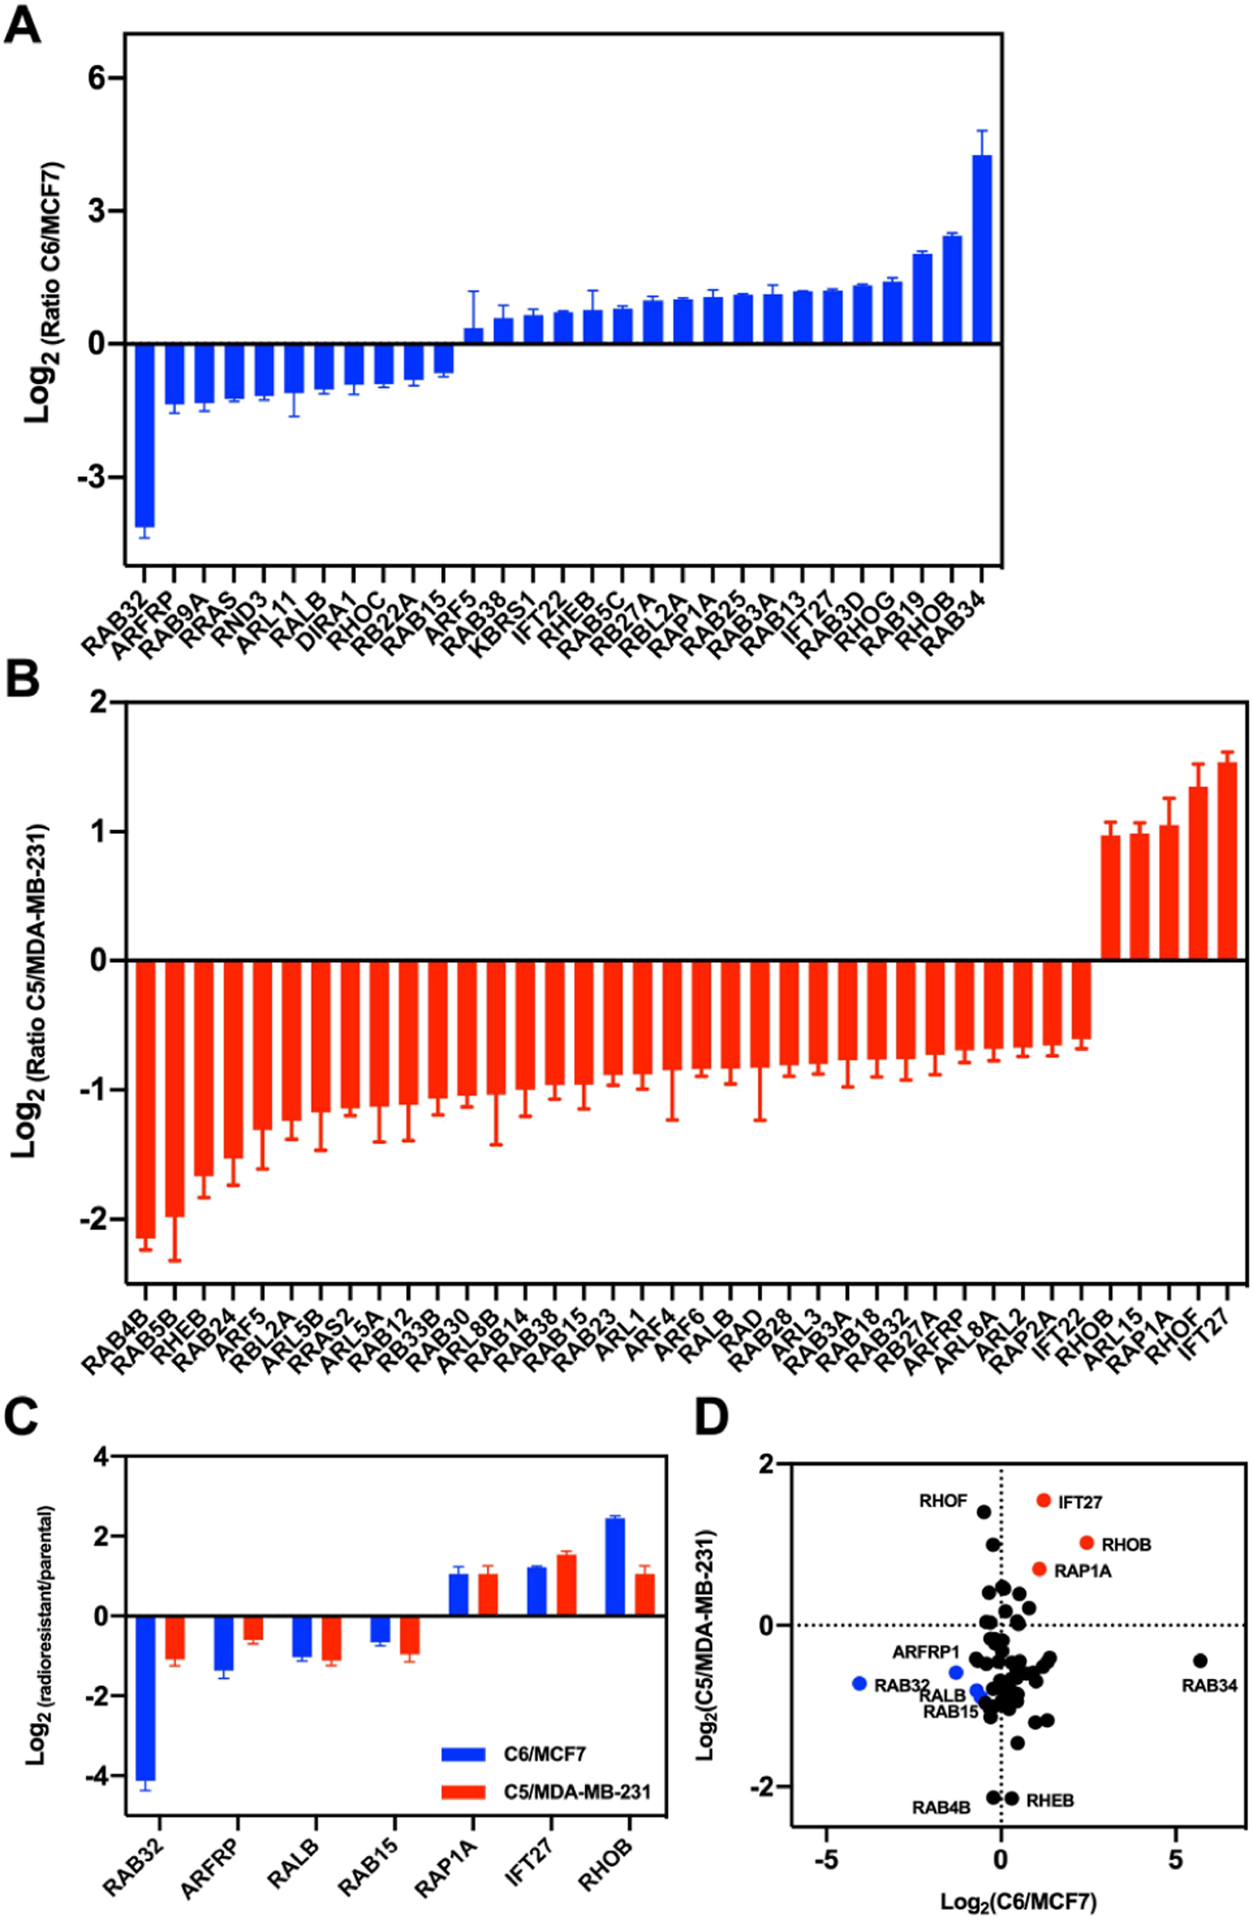
Quantification of differential expression of small GTPases in MDA-MB-231/C5 and MCF7/C6 pairs of breast cancer cells. (A,B) Bar graphs showing the MRM quantification results of small GTPases with differences in expression being over 1.5-fold in radioresistant/parental pairs. (C) A bar graph illustrating the proteins commonly altered in the two pairs of radioresistant/parental breast cancer cell lines. Relative expression level is plotted as Log2 ratio of radioresistant/parental cells. (D) A scatter plot illustrating significantly up- and downregulated small GTPases in the two pairs of breast cancer cells. Seven commonly altered small GTPases are highlighted in red (for upregulated small GTPases in radioresistant cell lines) and blue (for downregulated small GTPases).
Figure 3.
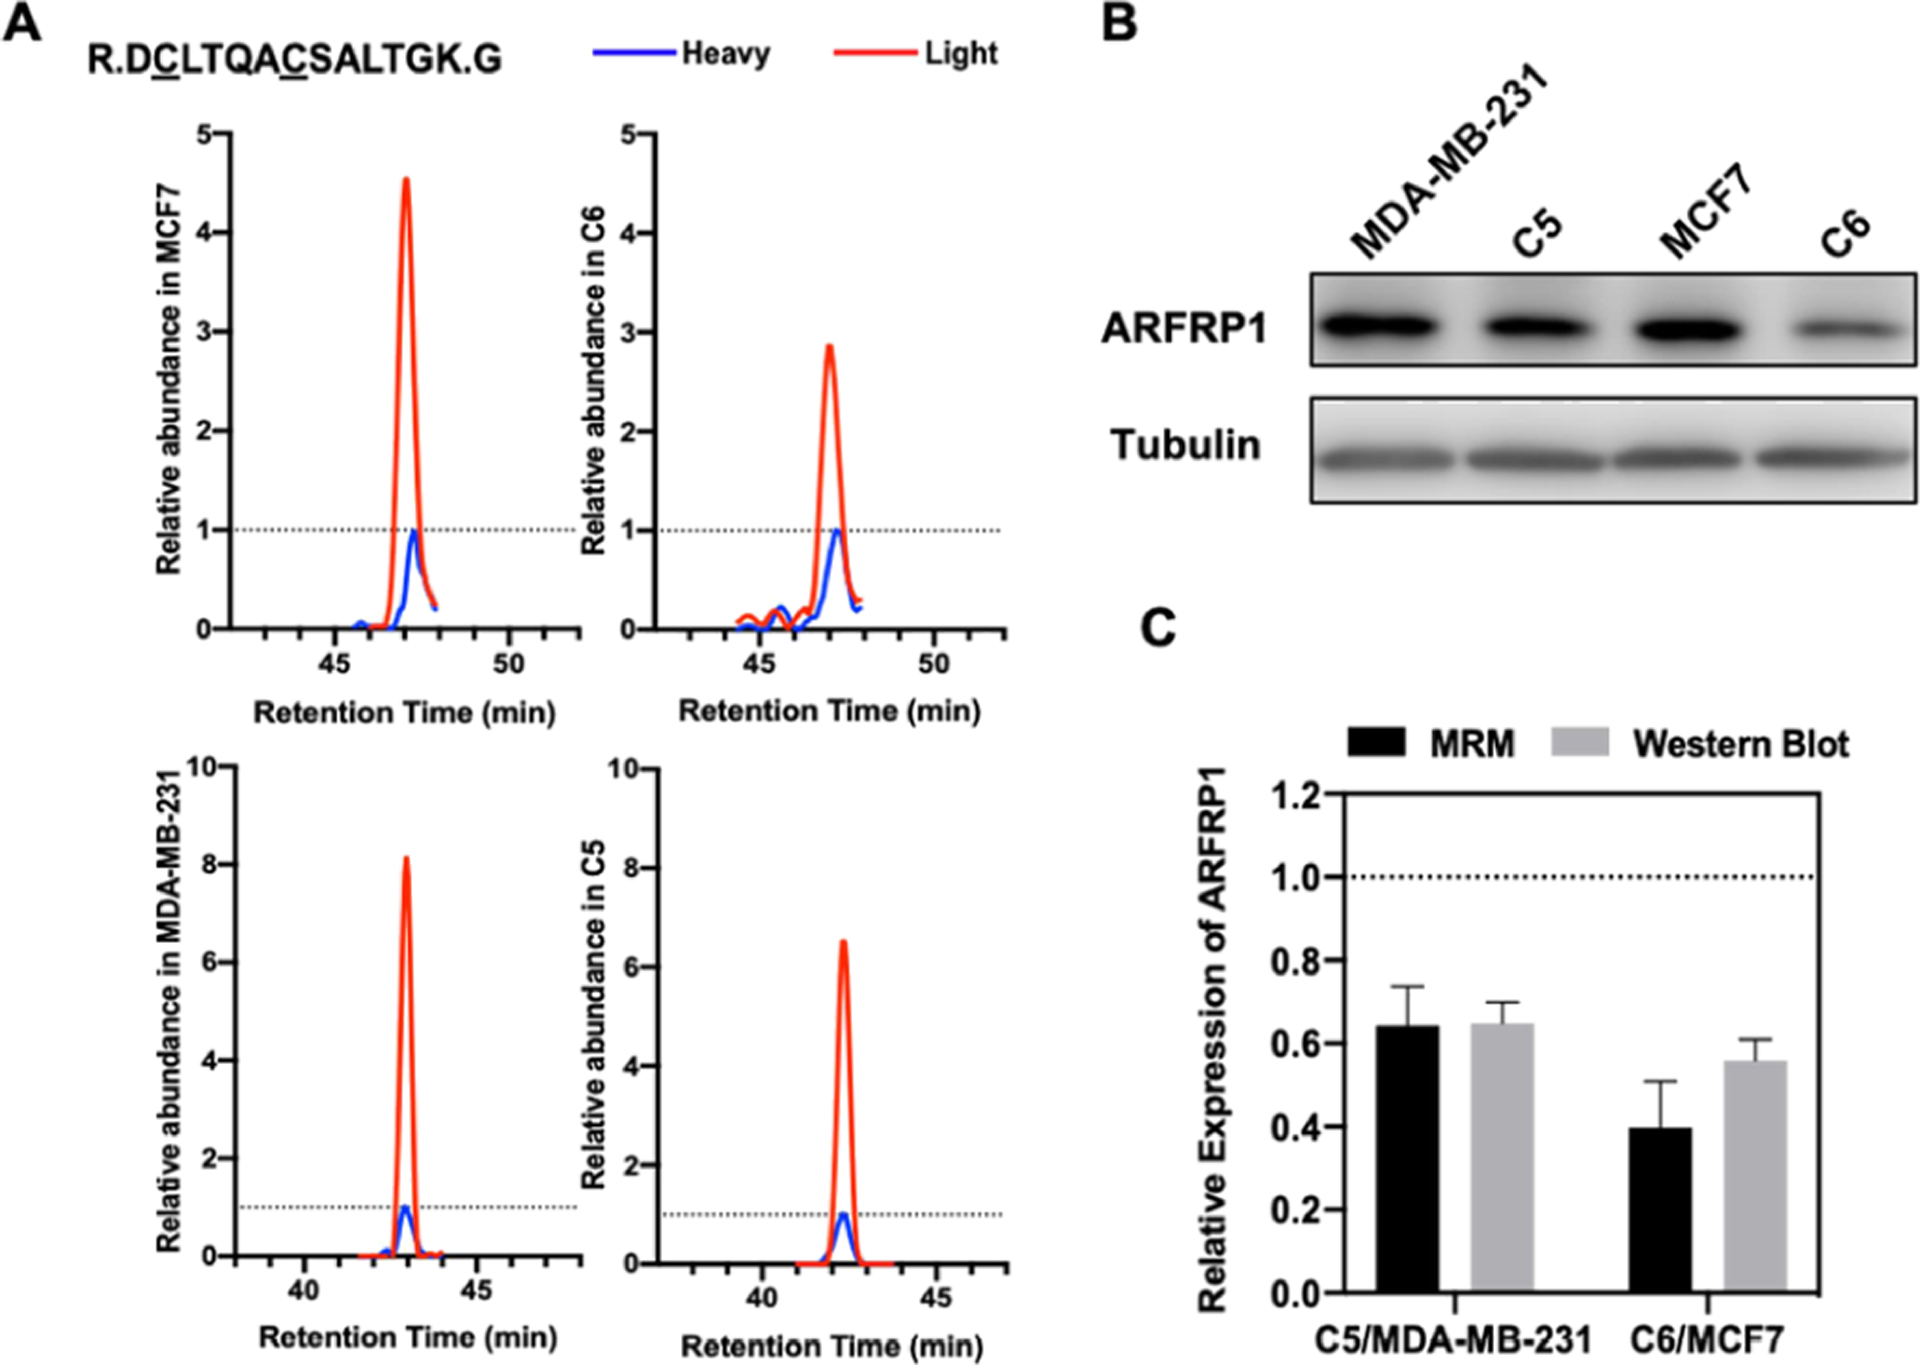
ARFRP1 is downregulated in radioresistant lines of both MDA-MB-231/C5 and MCF7/C6 pairs of breast cancer cells. (A) The MRM traces of a representative peptide (DCLTQACSALTGK, where underlined C represents carbamidomethylated cysteine) from ARFRP1 in MDA-MB-231/C5 and MCF7/C6 pairs of breast cancer cells. The traces of the unlabeled peptide in parental and radioresistant cell lines are shown in red and the spiked-in isotope-labeled peptide are depicted in blue. (B) Western blot for validating the MRM results for ARFRP1 in MDA-MB-231/C5 and MCF7/C6 cells. (C) Quantification results for the relative levels of expression of ARFRP1 protein in the two pairs of cell lines obtained from MRM and Western blot analyses. Error bars represent S.D. (n = 3).
We also compared our MRM quantification results for IFT27 and ARFRP1 proteins with their mRNA levels in parental breast cancer cells and the corresponding radioresistant cell lines (Figures 3C and S3C). Consistent with the MRM and Western blot data, we observed higher levels of IFT27 mRNA and lower levels of ARFRP1 mRNA in C5 and C6 cell lines than the corresponding parental lines (Figure S2). These results suggest that the differential expression of these two small GTPase proteins arise from transcriptional regulation.
ARFRP1 was shown to be involved in trans-Golgi network through regulating ARL1-mediated Golgi recruitment.33,34 It was also found to be important for lipidation and assembly of lipoproteins.35,36 However, there are not many studies about its role in cancer.37 Our MRM results prompted us to hypothesize that downregulation of ARFRP1 may confer radioresistance in breast cancer cells.
ARFRP1 Knockdown Led to Increased Radioresistance in Breast Cancer Cells.
To assess the role of ARFRP1 in modulating radiation sensitivity, we generated MCF7 and MDA-MB-231 cells with the ARFRP1 gene being stably knocked down using shRNA. The knockdown efficiency was assessed by Western blot analyses (Figures 4A and S3A). We then examined the cell survival rate after X-ray exposure.27 The results from clonogenic survival assay showed pronounced increases in radioresistance after substantial knockdown of ARFRP1 gene in both breast cancer cell lines (Figures 4B and S3B). In particular, shARFRP1-1 and shARFRP1-3 led to 79.6 and 93.9% depletions, respectively, of ARFRP1 protein in MDA-MB-231 cells (Figure 4), and shARFRP1-2 and shARFRP1-3 led to 51.0 and 85.4% losses, respectively, of ARFRP1 protein in MCF7 cells (Figure S3). Our clonogenic survival assay results showed that shARFRP1-3 conferred a more pronounced elevation in radioresistance than shARFRP1-1 and shARFRP1-2, which is in agreement with the relative knockdown efficiencies of the three different sequences of shRNAs (Figures 4 and S3).
Figure 4.
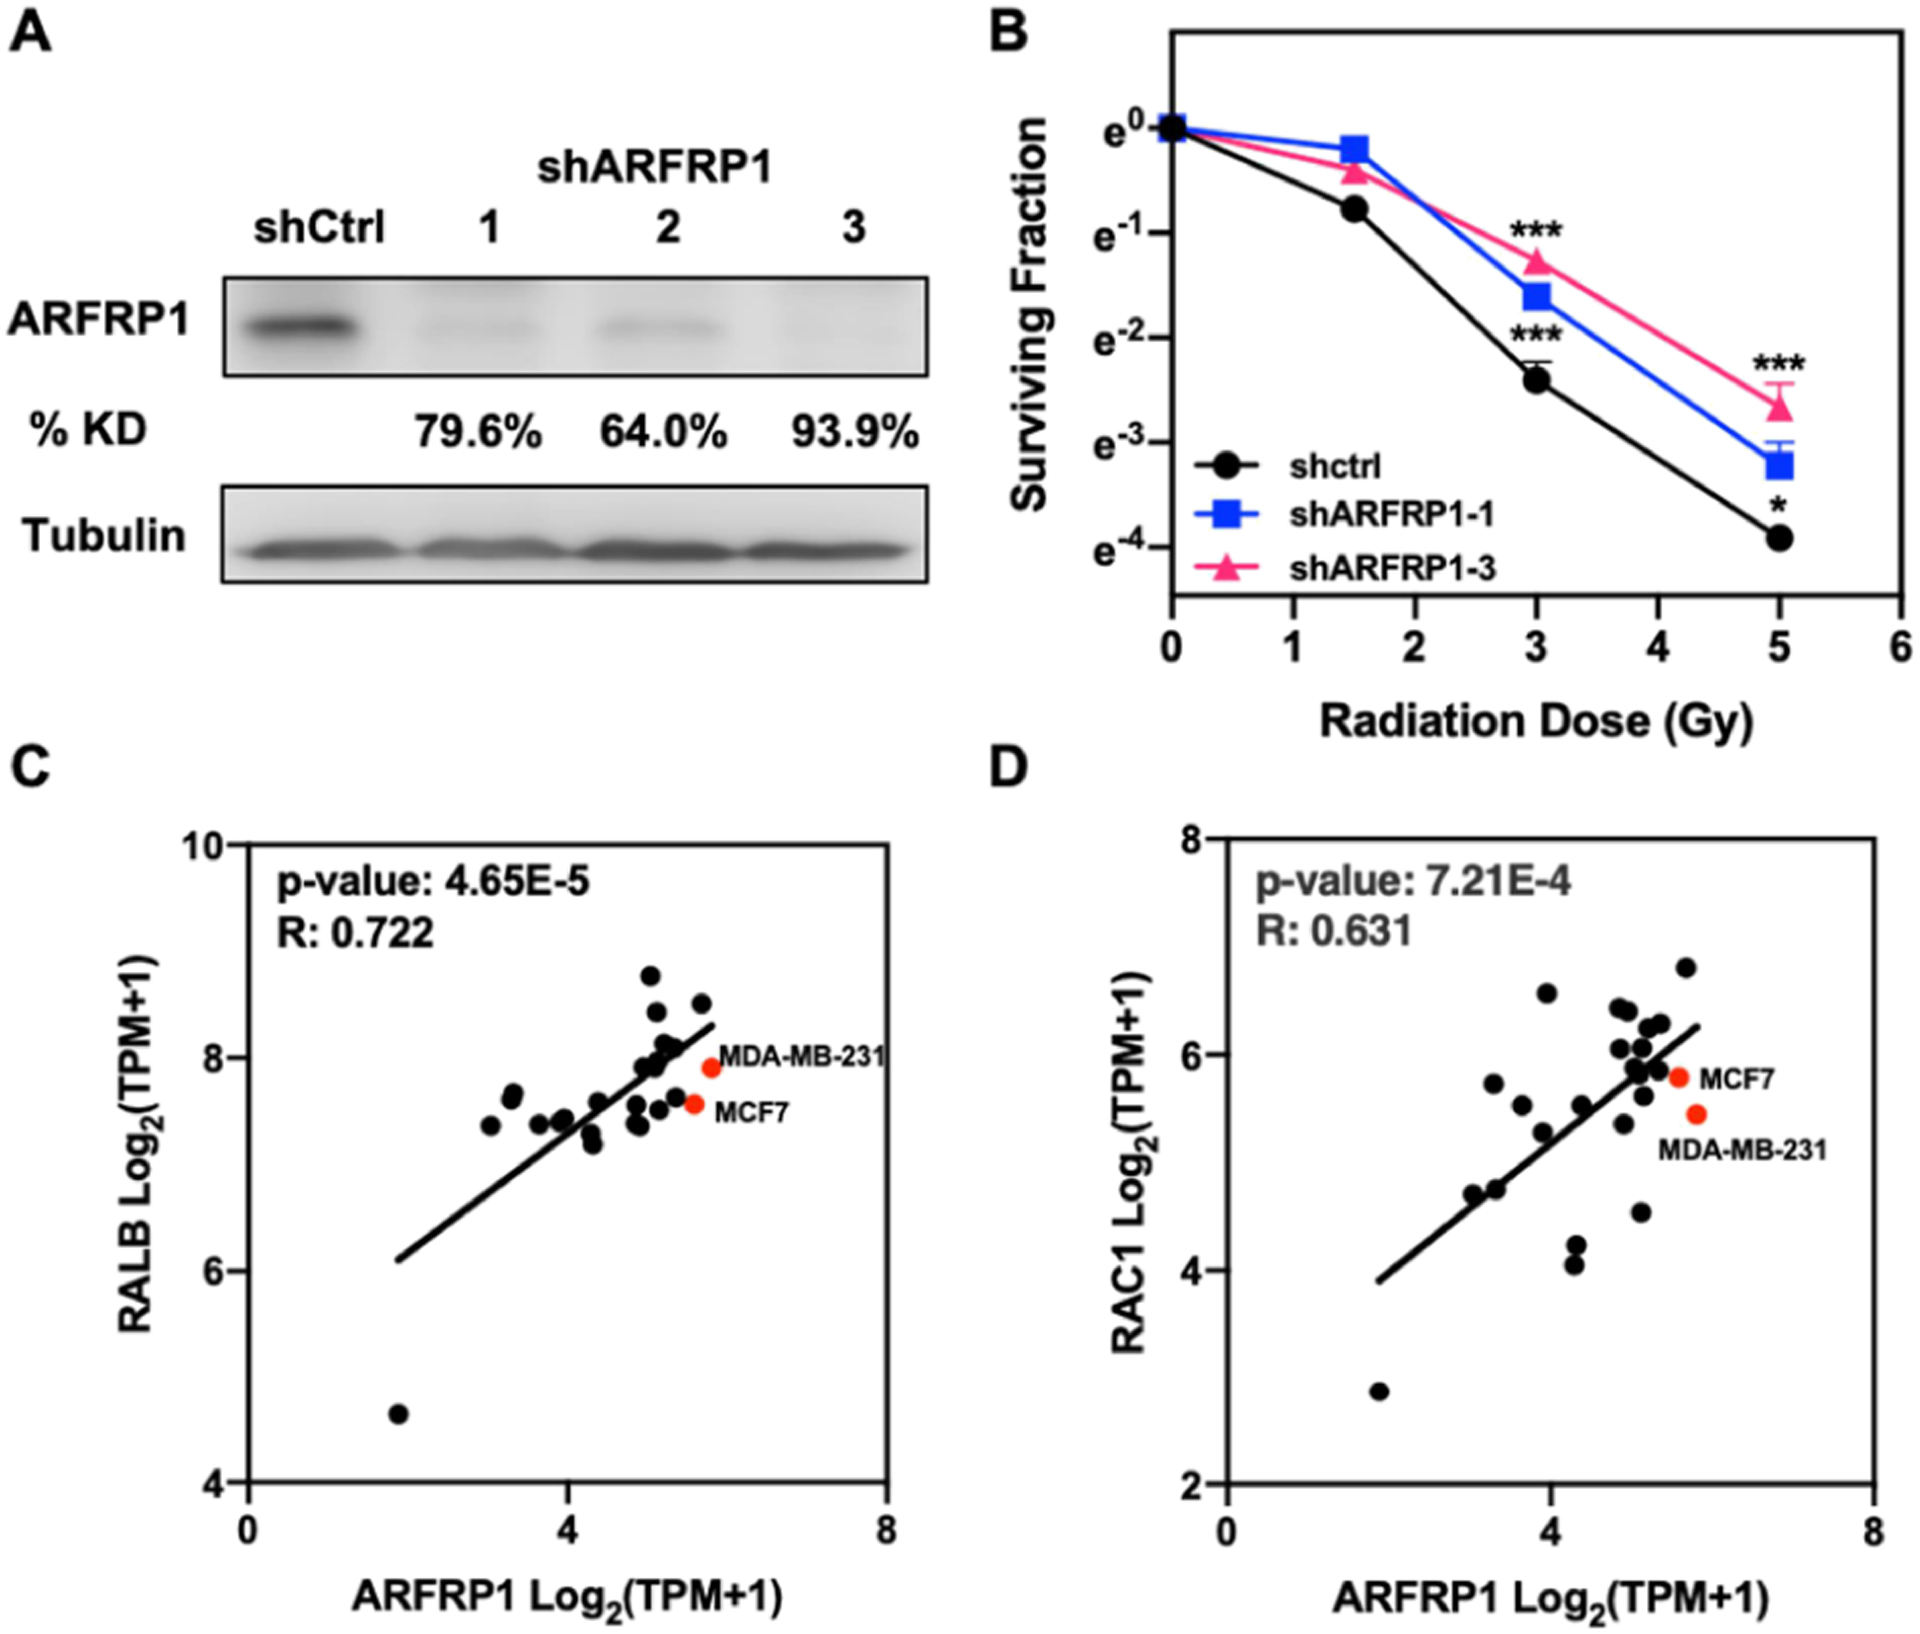
ARFRP1 modulates radioresistance in breast cancer cells. (A) Western blot for validating the knockdown efficiency of ARFRP1 in MDA-MB-231 cells. (B) Survival rates of MDA-MB-231 cells treated with control or ARFRP1 shRNA and exposed with the indicated doses of X-rays. Error bars represent S.D. (n = 3). The p values were calculated using two-tailed, unpaired Student’s t-test: *, p < 0.05; ***, p < 0.001. (C,D) Scatter plots showing the correlation of mRNA expression level of ARFRP1 gene to those of RALB (C) and RAC1 (D) genes in different breast cancer cell lines.
Using mRNA expression data of 25 breast carcinoma cell lines in the Cancer Cell Line Encyclopedia (CCLE) database, we compared the mRNA expression level of ARFRP1 to those of two known radioresistance regulators, RALB16 and RAC1,38,39 where RALB was also shown by our MRM results to be differentially expressed in the radioresistant/parental breast cancer cells (Figure 2C). We found that the mRNA expression levels of RALB and RAC1 genes are positively correlated with the mRNA levels of ARFRP1 gene across the 25 breast cancer cell lines (Figure 4C, D), further substantiating the role of ARFRP1 in modulating radioresistance.
CONCLUSIONS
In summary, we applied high-throughput scheduled LC-MRM analysis to explore the alterations in expression levels of small GTPase proteins accompanied with the development of radioresistance in breast cancer cells and to identify potential regulators of radioresistance. We were able to quantify 82 and 68 proteins in the MDA-MB-231/C5 and MCF-7/C6 pairs of breast cancer cells, respectively. Western blot analysis validated the MRM quantification results for two small GTPases, underscoring the quantification accuracy of the LC-MRM method. The LC-MRM analysis led to the discovery of 7 small GTPases that are commonly altered by at least 1.5-fold in the two pairs of breast cancer cells. These included two known radioresistance modulators (RHOB and RALB) and several novel candidate radioresistance regulators. In particular, we demonstrated, for the first time, that ARFRP1 is a regulator of radiation sensitivity, where its downregulation in breast cancer cells conferred augmented radioresistance. Thus, our study also provides a new target for overcoming resistance in cancer radiotherapy and a novel protein biomarker for selecting radiotherapy for patients. In this regard, it is worth discussing a limitation of our work. In particular, owing to the limited availabilities of radioresistant breast cancer cells, we employed only two radioresistant breast cancer cell lines and the corresponding parental cell lines in the current study. It would be important to explore, in the future, if the findings made from these two pairs of cell lines can be expanded to other radioresistant breast cancer cell lines and radioresistant breast cancer tissues. Along this line, the quantitative proteomic method described in this study is also amenable to the quantification of small GTPase proteins in tissues.22
Supplementary Material
ACKNOWLEDGMENTS
This work was supported by the National Institute of Health (R35 ES031707). The authors would like to thank Prof. Jian-Jian Li of University of California, Davis, for providing the radioresistant cell lines used in the current study.
Footnotes
Supporting Information
The Supporting Information is available free of charge at https://pubs.acs.org/doi/10.1021/acs.analchem.2c02389.
Sequences of RT-qPCR primers and oligodeoxynucleotides, MRM traces and Western blot results of IFT27, RT-qPCR results, and cell survival assay results for MCF7 cells (PDF)
Table S2. LC-MRM quantification results (XLSX)
Complete contact information is available at: https://pubs.acs.org/10.1021/acs.analchem.2c02389
The authors declare no competing financial interest.
Contributor Information
Zi Gao, Department of Chemistry, University of California Riverside, Riverside, California 92521-0403, United States.
Yen-Yu Yang, Department of Chemistry, University of California Riverside, Riverside, California 92521-0403, United States.
Ming Huang, Environmental Toxicology Graduate Program, University of California Riverside, Riverside, California 92521-0403, United States.
Tianyu F. Qi, Environmental Toxicology Graduate Program, University of California Riverside, Riverside, California 92521-0403, United States
Handing Wang, Department of Chemistry, University of California Riverside, Riverside, California 92521-0403, United States.
Yinsheng Wang, Department of Chemistry and Environmental Toxicology Graduate Program, University of California Riverside, Riverside, California 92521-0403, United States.
REFERENCES
- (1).Cherfils J; Zeghouf M Physiol. Rev 2013, 93, 269–309. [DOI] [PubMed] [Google Scholar]
- (2).Sancak Y; Peterson TR; Shaul YD; Lindquist RA; Thoreen CC; Bar-Peled L; Sabatini DM Science 2008, 320, 1496–1501. [DOI] [PMC free article] [PubMed] [Google Scholar]
- (3).Stenmark H Nat. Rev. Mol. Cell Biol 2009, 10, 513–525. [DOI] [PubMed] [Google Scholar]
- (4).Guan X; Guan X; Dong C; Jiao Z Exp. Cell Res 2020, 388, No. 111824. [DOI] [PubMed] [Google Scholar]
- (5).Haga RB; Ridley AJ FEBS Lett 2016, 7, 207–221. [DOI] [PMC free article] [PubMed] [Google Scholar]
- (6).Subramani D; Alahari SK Mol. Cancer 2010, 9, 312. [DOI] [PMC free article] [PubMed] [Google Scholar]
- (7).Vega FM; Ridley AJ FEBS Lett 2008, 582, 2093–2101. [DOI] [PubMed] [Google Scholar]
- (8).Cheng KW; Lahad JP; Gray JW; Mills GB Cancer Res 2005, 65, 2516–2519. [DOI] [PubMed] [Google Scholar]
- (9).Dyba T; Randi G; Bray F; Martos C; Giusti F; Nicholson N; Gavin A; Flego M; Neamtiu L; Dimitrova N; Negrao Carvalho R; Ferlay J; Bettio M Eur. J. Cancer 2021, 157, 308–347. [DOI] [PMC free article] [PubMed] [Google Scholar]
- (10).Loibl S; Poortmans P; Morrow M; Denkert C; Curigliano G Lancet 2021, 397, 1750–1769. [DOI] [PubMed] [Google Scholar]
- (11).Baskar R; Lee KA; Yeo R; Yeoh KW Int. J. Med. Sci 2012, 9, 193–199. [DOI] [PMC free article] [PubMed] [Google Scholar]
- (12).Zhang H; Luo H; Jiang Z; Yue J; Hou Q; Xie R; Wu SJ Radiat. Res 2016, 57, 370–380. [DOI] [PMC free article] [PubMed] [Google Scholar]
- (13).Koto M; Miyamoto T; Yamamoto N; Nishimura H; Yamada S; Tsujii H Radiother. Oncol 2004, 71, 147–156. [DOI] [PubMed] [Google Scholar]
- (14).Monferran S; Skuli N; Delmas C; Favre G; Bonnet J; Cohen-Jonathan-Moyal E; Toulas C Int. J. Cancer 2008, 123, 357–364. [DOI] [PubMed] [Google Scholar]
- (15).Nishioka S; Wu PH; Yakabe T; Giaccia AJ; Le QT; Aoyama H; Shimizu S; Shirato H; Onodera Y; Nam JM Neurooncol. Adv 2020, 2, No. vdaa091. [DOI] [PMC free article] [PubMed] [Google Scholar]
- (16).Kidd AR 3rd; Snider JL; Martin TD; Graboski SF; Der CJ; Cox AD Int. J. Radiat. Oncol., Biol., Phys 2010, 78, 205–212. [DOI] [PMC free article] [PubMed] [Google Scholar]
- (17).Ahmed KM; Dong S; Fan M; Li JJ Mol. Cancer Res 2006, 4, 945–955. [DOI] [PubMed] [Google Scholar]
- (18).Qi TF; Miao W; Wang Y Anal. Chem 2022, 94, 1525–1530. [DOI] [PMC free article] [PubMed] [Google Scholar]
- (19).Cao N; Li S; Wang Z; Ahmed KM; Degnan ME; Fan M; Dynlacht JR; Li JJ Radiat. Res 2009, 171, 9–21. [DOI] [PMC free article] [PubMed] [Google Scholar]
- (20).Shevchenko A; Tomas H; Havlis J; Olsen JV; Mann M Nat. Protoc 2006, 1, 2856–2860. [DOI] [PubMed] [Google Scholar]
- (21).Yang YY; Yu K; Li L; Huang M; Wang Y Anal. Chem 2020, 92, 10145–10152. [DOI] [PMC free article] [PubMed] [Google Scholar]
- (22).Huang M; Darvas M; Keene CD; Wang Y Anal. Chem 2019, 91, 12307–12314. [DOI] [PMC free article] [PubMed] [Google Scholar]
- (23).MacLean B; Tomazela DM; Shulman N; Chambers M; Finney GL; Frewen B; Kern R; Tabb DL; Liebler DC; MacCoss MJ Bioinformatics 2010, 26, 966–968. [DOI] [PMC free article] [PubMed] [Google Scholar]
- (24).Deutsch EW; Bandeira N; Sharma V; Perez-Riverol Y; Carver JJ; Kundu DJ; Garcia-Seisdedos D; Jarnuczak AF; Hewapathirana S; Pullman BS; Wertz J; Sun Z; Kawano S; Okuda S; Watanabe Y; Hermjakob H; MacLean B; MacCoss MJ; Zhu Y; Ishihama Y; Vizcaino JA Nucleic Acids Res 2020, 48, D1145–D1152. [DOI] [PMC free article] [PubMed] [Google Scholar]
- (25).Kawahara R; Bollinger JG; Rivera C; Ribeiro AC; Brandao TB; Paes Leme AF; MacCoss MJ Proteomics 2016, 16, 159–173. [DOI] [PMC free article] [PubMed] [Google Scholar]
- (26).Li L; Williams P; Gao Z; Wang Y Nucleic Acids Res 2020, 48, 11994–12003. [DOI] [PMC free article] [PubMed] [Google Scholar]
- (27).Franken NA; Rodermond HM; Stap J; Haveman J; van Bree C Nat. Protoc 2006, 1, 2315–2319. [DOI] [PubMed] [Google Scholar]
- (28).Miao W; Bade D; Wang YJ Proteome Res 2021, 20, 2830–2838. [DOI] [PMC free article] [PubMed] [Google Scholar]
- (29).Huang M; Qi TF; Li L; Zhang G; Wang Y Cancer Res 2018, 78, 5431–5445. [DOI] [PMC free article] [PubMed] [Google Scholar]
- (30).Ader I; Toulas C; Dalenc F; Delmas C; Bonnet J; Cohen-Jonathan E; Favre G Oncogene 2002, 21, 5998–6006. [DOI] [PubMed] [Google Scholar]
- (31).Rojas AM; Fuentes G; Rausell A; Valencia AJ Cell Biol 2012, 196, 189–201. [DOI] [PMC free article] [PubMed] [Google Scholar]
- (32).Liu Y; Beyer A; Aebersold R Cell 2016, 165, 535–550. [DOI] [PubMed] [Google Scholar]
- (33).Jaschke A; Chung B; Hesse D; Kluge R; Zahn C; Moser M; Petzke KJ; Brigelius-Flohe R; Puchkov D; Koepsell H; Heeren J; Joost HG; Schurmann A Hum. Mol. Genet 2012, 21, 3128–3142. [DOI] [PMC free article] [PubMed] [Google Scholar]
- (34).Ishida M; Bonifacino JS J. Cell Biol 2019, 218, 3681–3696. [DOI] [PMC free article] [PubMed] [Google Scholar]
- (35).Hesse D; Radloff K; Jaschke A; Lagerpusch M; Chung B; Tailleux A; Staels B; Schurmann AJ Lipid Res 2014, 55, 41–52. [DOI] [PMC free article] [PubMed] [Google Scholar]
- (36).Hommel A; Hesse D; Volker W; Jaschke A; Moser M; Engel T; Bluher M; Zahn C; Chadt A; Ruschke K; Vogel H; Kluge R; Robenek H; Joost HG; Schurmann A Mol. Cell. Biol 2010, 30, 1231–1242. [DOI] [PMC free article] [PubMed] [Google Scholar]
- (37).Starheim KK; Kalvik TV; Bjorkoy G; Arnesen T Biosci. Rep 2017, 37, No. BSR20170066. [DOI] [PMC free article] [PubMed] [Google Scholar]
- (38).Hein AL; Post CM; Sheinin YM; Lakshmanan I; Natarajan A; Enke CA; Batra SK; Ouellette MM; Yan Y Oncogene 2016, 35, 6319–6329. [DOI] [PMC free article] [PubMed] [Google Scholar]
- (39).Tan S; Yi P; Wang H; Xia L; Han Y; Wang H; Zeng B; Tang L; Pan Q; Tian Y; Rao S; Oyang L; Liang J; Lin J; Su M; Shi Y; Liao Q; Zhou Y Front. Oncol 2020, 10, 649. [DOI] [PMC free article] [PubMed] [Google Scholar]
Associated Data
This section collects any data citations, data availability statements, or supplementary materials included in this article.


