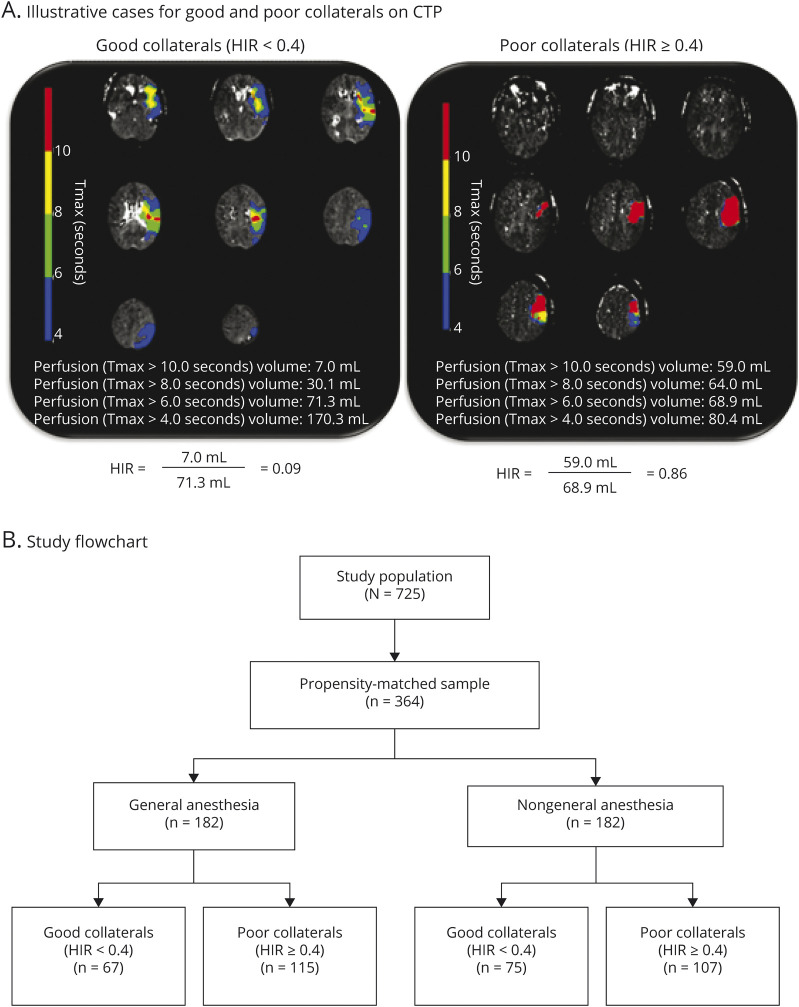
Figure 1. Illustrative Cases for Good and Poor Collaterals and Study Flowchart.
(A) Illustrative cases for good and poor collaterals on perfusion imaging. Patient 1 demonstrated Tmax >10 seconds volume of 7.0 mL and Tmax > 6 seconds volume of 71.3 mL, resulting in an HIR of 0.09, which is considered a marker for good collaterals, whereas patient 2 demonstrated Tmax > 10 seconds volume of 59.0 mL and Tmax > 6 seconds volume of 68.9 mL, resulting in an HIR of 0.86, which is considered a marker for poor collaterals. (B) Study flowchart. HIR = hypoperfusion intensity ratio.

