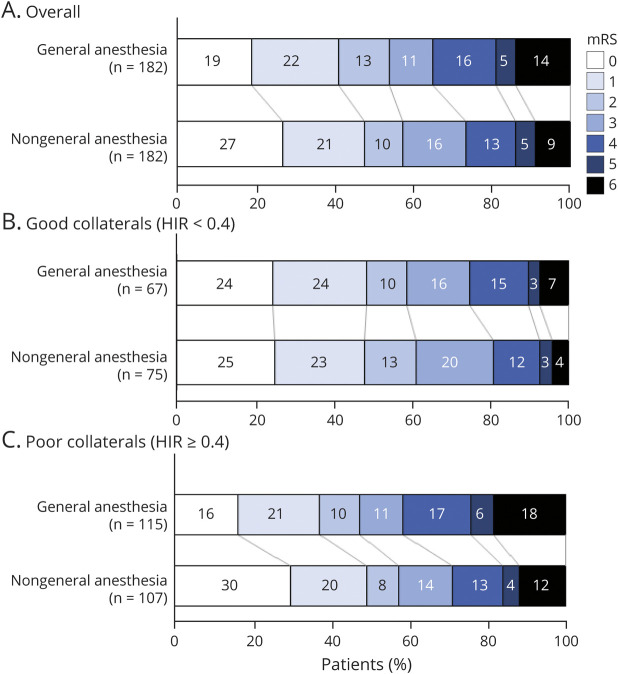
Figure 2. Distribution of Functional Outcomes by 90-Day mRS Score in the Propensity-Matched Cohort.
(A) Illustrates EVT outcomes in patients based on their anesthesia type, demonstrating an overall shift toward better functional outcomes in patients treated with non-GA. (B) Illustrates EVT outcomes in patients based on their anesthesia type in patients with HIR < 0.4. (C) Illustrates EVT outcomes in patients based on their anesthesia type in patients with HIR ≥ 0.4. Patients with poor collaterals (HIR ≥ 0.4) demonstrated a clear shift in the functional outcomes with non-GA, whereas the distribution of functional outcomes was similar for GA and non-GA approaches for patients with good collaterals (HIR < 0.4). EVT = endovascular thrombectomy; GA = general anesthesia; HIR = hypoperfusion intensity ratio; mRS = modified Rankin Scale.

