

Abstract
Socioeconomic and demographic factors including educational attainment, race and ethnicity, and childhood socioeconomic status (SES) are powerful predictors of inequalities in aging, morbidity, and mortality. Immune aging, including accumulation of late-differentiated, senescent-like lymphocytes and lower levels of naïve lymphocytes, may play a role in the development of the age-related health inequalities. This study used nationally representative data from more than 9,000 US adults from the Health and Retirement Study to investigate associations between educational attainment, race and ethnicity, and childhood SES and lymphocyte percentages. Respondents with lower educational attainment, Hispanic adults, and those who had a parent with less than a high school education had lymphocyte percentages consistent with more immune aging compared to those with greater educational attainment, non-Hispanic White adults, and respondents who had parents with a high school education, respectively. Associations between education, Hispanic ethnicity, and parents’ education and late differentiated senescent-like T lymphocytes (TemRA) and B cells were largely driven by cytomegalovirus (CMV), suggesting it is a driver of observed SES inequalities in immunosenescence. Naïve T lymphocytes may be particularly affected by socioeconomic position and may therefore be of particular interest to research interested in inequalities in health and aging.
Keywords: race and ethnicity, lymphocytes, cytomegalovirus, immunosenescence
Introduction
Age-related changes in immune function have been associated with increased risk of chronic conditions, reduced efficacy fighting acute infections, and reduced response to vaccines (Huff et al., 2019; Pawelec, 2018; Thyagarajan et al., 2021). The aging immune system is characterized by lower percentages of naïve T and B lymphocytes, higher percentages of late differentiated lymphocytes, increases in cytotoxic (CD8+) relative to helper (CD4+) T cells, and decreases in naïve helper T cells relative to memory helper T cells. As the thymus involutes with age, fewer naïve cells are available to respond to novel viral and vaccine exposures (Pangrazzi & Weinberger, 2020). Late differentiated effector T cells (characterized by re-expression of CD45RA) accumulate over time and are less effective in viral response, less effective in senescent cell and cancerous cell clearance, produce inflammatory cytokines, and display a senescence-associated secretory phenotype (Bektas et al., 2017; Palmer et al., 2018). Though other immune cells are involved in immune aging, past research suggests that lymphocytes—and T lymphocytes in particular—are most affected by age-related immune changes (Pangrazzi & Weinberger, 2020). Though age is a very powerful predictor of percentages of naïve and late differentiated T cells (Thyagarajan et al., 2021), there is substantial individual variation within age groups. Uncovering the sources of variance in percentages of naïve and late differentiated T cells is important for understanding and combating age-related health problems and functional decline.
Past research links socioeconomic status (e.g., education, income, occupational status) and demographic factors with age-related health outcomes generally (Kristenson et al., 2004) and with immune dysfunction particularly (Kiecolt-Glaser & Glaser, 2001). For example, past research suggests lower income is associated with a greater proportion of effector relative to naïve CD4+ and CD+ lymphocytes (Aiello et al., 2016). We focus on educational attainment as an indicator of SES. Lower educational attainment may be linked to immune aging via several pathways, including greater exposure to stressors (Klopack et al., 2022b) and health risk behaviors associated with thymic involution (Duggal et al., 2018; Spadaro et al., 2022).
SES in childhood is also a major determinant of adult health (Klopack et al., 2022a; Yang et al., 2017). Low childhood SES is associated with adverse health behaviors (Pudrovska et al., 2014), greater adversity and toxic stress (McEwen & McEwen, 2017), and lower adult SES attainment (Pudrovska & Anikputa, 2014) and may directly alter developmental trajectories toward a more accelerated aging phenotype (Duggal et al., 2018). Past research in small samples has found early life adversity increases risk of viral infection (potentially because of larger families, greater day-care usage, and congenital transmission (Cannon et al., 2010)) and T cell senescence (Elwenspoek et al., 2017).
Because of structural, systemic, and interpersonal racism, race and ethnicity are highly related to SES in the US and are also robustly associated with age-related health problems (Williams, 2012). Most past research on immune aging has utilized small or all White samples, making comparisons across race and ethnicity difficult. However, there is reason to expect minoritized racial and ethnic groups may have more accelerated immune aging compared to White Americans—for example, there are racial differences in exposures to stress and other health risks associated with immune aging (Simons et al., 2021; Williams, 2018).
Human cytomegalovirus (CMV) infection is a particularly important environmental exposure for immune aging (Hoes et al., 2018). CMV infection is a strong determinant of cell percentages that characterize an aging immune system. CMV seropositivity is socially patterned such that primary (first) infections occur at younger ages in racial and ethnic minority groups and socioeconomically disadvantaged populations (Colugnati et al., 2007). Several pathways have been suggested for this relationship; for example, low SES groups have been structurally disadvantaged and isolated from resources leading to more crowded living conditions, lower quality housing, and less sanitary living conditions (Cannon et al., 2010). Lower educational attainment, lower childhood SES, and race and ethnicity are associated with a variety of stressors that may accelerate immune aging and depress immune functioning, potentially increasing susceptibility to CMV infection (Dowd et al., 2009).
Little research has investigated the roles of socioeconomic factors and race and ethnicity in immune aging. What research has been conducted on SES and immune age phenotype generally has utilized limited community samples. This study builds on this past research by utilizing nationally representative data from over 9,000 US adults from the Health and Retirement Study. This study represents the first time detailed immunophenotyping has been conducted in a large US population representative sample of older adults. We investigated whether educational attainment, race/ethnicity, and childhood SES (assessed by parental education) were associated with percentages of age-related lymphocytes: percentages of naïve CD4+ and CD8+ T cells, late differentiated (so called TemRA) CD4+ and CD8+ T cells, the CD4:CD8 cell ratio, the CD4 naïve:CD4 total memory cell ratio, naïve B cells, and late memory B cells. We expect higher educational attainment, being non-Hispanic White, and higher parental education to be associated with
higher percentages of naïve lymphocytes,
lower percentages of late differentiated (e.g., TemRA and late memory) lymphocytes, and
higher CD4:CD8 and CD4 naïve:CD4 total memory cell ratios.
Methods
Sample
This study utilizes the Health and Retirement Study (HRS) 2016 Venous Blood Study (N = 9,934). HRS is a national panel survey of older Americans, which when weighted is designed to be representative of community dwelling Americans older than 50. The VBS consisted of panel members who were not in a nursing home, whose interview was not done by a proxy, who had been interviewed at least once before, and who consented to a venous blood draw. 78.5% of eligible respondents consented and 82.9% of those respondents completed a blood draw. More information about this study is available elsewhere (Crimmins et al., 2017). Absolute counts and percentages of 24 different types of immune cells were assessed using multiparameter flow cytometry using the standardized protocol by the Human Immunology Project with minor modifications performed on an LSRII or a Fortessa X20 flow cytometer (BD Biosciences, San Diego, CA). More detailed methods for this sample are published elsewhere (Crimmins et al., 2017; Thyagarajan et al., 2018).
Measures
In the current study, we focus on:
the percentage of naïve CD4+ cells (CD4+/CD3+/CD19−/CD45RA+/CCR7+/CD28+)
the percentage of naïve CD8+ cells (CD8+/CD3+/CD19−/CD45RA+/CCR7+/CD28+)
the percentage of TemRA CD4+ cells (CD4+/CD3+/CD19−/CD45RA+/CCR7−/CD28−)
the percentage of TemRA CD8+ cells (CD8+/CD3+/CD19−/CD45RA+/CCR7−/CD28−)
the ratio of CD4+ to CD8+ T cells using the quotient of counts of these compartments
- the ratio of naïve to total memory CD4+ T cells total memory is the sum of:
- central memory cells (CD4+/CD3+/CD19−/CD8−/CD45RA−/CCR7+/CD28+)
- effector memory cells (CD4+/CD3+/CD19−/CD8−/CD45RA−/CCR7−/CD28−)
- TemRA cells (CD4+/CD3+/CD19-/CD45RA+/CCR7-/CD28-)
the percentage of naïve B cells (CD3−/CD19+/IgD+/CD27−)
the percentage of late memory B cells (CD3−/CD19+/IgD−/CD27+).
Variables that showed substantial skewness (skewness > 2; viz., CD4+ TemRA, the CD4:CD8 ratio, CD4 naïve:CD4 total memory cell ratio, and late memory B cells) were natural log transformed to approximate a normal distribution. These variables were standardized to have a mean of 0 and variance of 1 to facilitate comparison.
CMV seropositivity was assessed using IgG antibodies to CMV using the Roche e411 immunoassay analyzer (Roche Diagnostics Corporation, Indianapolis, IN). Cutoffs were used to identify non-reactive (<0.5 COI; coded 0), borderline (0.5 to <1.0 COI; coded 0), and reactive (>1.0 COI; coded 1) individuals. Non-reactive and borderline groups were combined and were used as the reference group. More information is available elsewhere (Crimmins et al., 2017).
Educational attainment was assessed by self-reported years of education. Respondents were categorized as 0–11 years (reference group), 12 years, 13–15 years, and 16 or more years. These categories approximate less than high school, high school, some college or university, and college or university completion or more education in the US educational system.
Race/ethnicity was assessed by self-report. Respondents were categorized as non-Hispanic White (reference group), Hispanic, non-Hispanic Black, and non-Hispanic other race.
Parental low education was assessed using respondents’ reports of their parents’ educational attainment. If respondents reported on both parents, they were coded as 1 if either parent had less than high school education. If respondents only reported on one parent, they were coded as 1 if that parent had less than high school education. Respondents who only reported on their parents’ education at Wave 3 or at Wave 2 as part of the AHEAD study reported only whether their parent had attended school for 8 or more years. These respondents were assigned 7.5 years if less than 8 years and 8.5 is assigned if 8 or more.
We controlled for age in years and sex (male as reference) in all models. The weighted sample had a mean age of 68 years, ranging from 50 to 107. The sample was 55% female.
Plan of Analysis
Of the initial 9,934 respondents, 201 were cohort ineligible (e.g., were not a member of one of the birth cohorts represented in HRS) and 85 were missing on control variables. Sample weights, strata, and PSUs from the HRS tracker file were used to weight the sample. Respondents missing Venous Blood Study specific weights were assigned their core 2016 weight. The resulting sample size for this study is 9,648. Some individuals were missing data on specific cell types or predictor variables. While major T cell subsets (e.g.) CD4+ and CD8+ subsets are available in almost all individuals, the rarer cell subsets (e.g., effector T cell subsets) were not detected in all individuals as sufficient numbers of cells were not available to reliably detect these rare subsets in all individuals. Hence these rare cell subsets have higher missingness because they are harder to detect reliably. To retain information, we used all respondents with complete data on each cell type for analyses using that cell type as the dependent variable. Additionally, there were too few participants in the non-Hispanic other race category to make meaningful comparisons, so those 299 participants were excluded in analyses with race and ethnicity as the focal predictors. e-table 1 shows final sample sizes for analyses for each model.
We began by estimating CMV seropositivity rates by age, educational attainment level, race and ethnicity, and parental educational attainment. Next a series of generalized linear models were estimated regressing each cell type percentage/ratio on educational attainment, race/ethnicity, or parental education, age and sex and then on educational attainment, race/ethnicity, or parental education, CMV seropositivity, age, and sex. We then estimated a final set of models regressing each cell type percentage/ratio on race/ethnicity, parental education, education, CMV seropositivity, age, and sex (results in online supplement). To assess whether CMV seropositivity mediated the associations between educational attainment, race and ethnicity, and parental education and cell type outcomes, we conducted causal mediation analysis using a non-parametric quasi-Bayesian procedure with 1000 Monte Carlo draws using estimates from the full model (results in online supplement). All analyses were conducted in R 4.1.1 (R Core Team, 2021) using the survey (Lumley, 2004) and mediation (Tingley et al., 2014) packages.
Results
CMV seropositivity
Because CMV positivity is an important potential mediator of associations between socioeconomic and demographic factors and immune aging, we began by estimating CMV seropositivity by age, educational attainment level, race and ethnicity, and parental educational attainment. Figure 1 shows the weighted proportion of participants who were CMV positive by age and sociodemographic factors. Higher education was associated with lower CMV seropositivity in our sample. Participants with fewer than 12 years of education had the highest proportion of seropositivity before age 80 and the proportion of CMV seropositive respondents remained stable across age. Higher educated participants tended to have lower seropositivity at all ages, and seropositivity increased with age. Non-Hispanic White respondents had lower CMV seropositivity at all ages compared to both non-Hispanic Black and Hispanic respondents. CMV seropositivity was also associated with parents’ education such that participants whose parent(s) had less than a high school education had higher proportions of CMV seropositivity. Finally, when considering education and race/ethnicity, CMV seropositivity tended to be lower for people with higher educational attainment across racial/ethnic groups. To assess whether the association between educational attainment and CMV serostatus differed by race/ethnicity, we estimated a model predicting CMV seropositivity with interactions between educational attainment and race/ethnicity (not shown), and no interaction term was significant.
Figure 1.
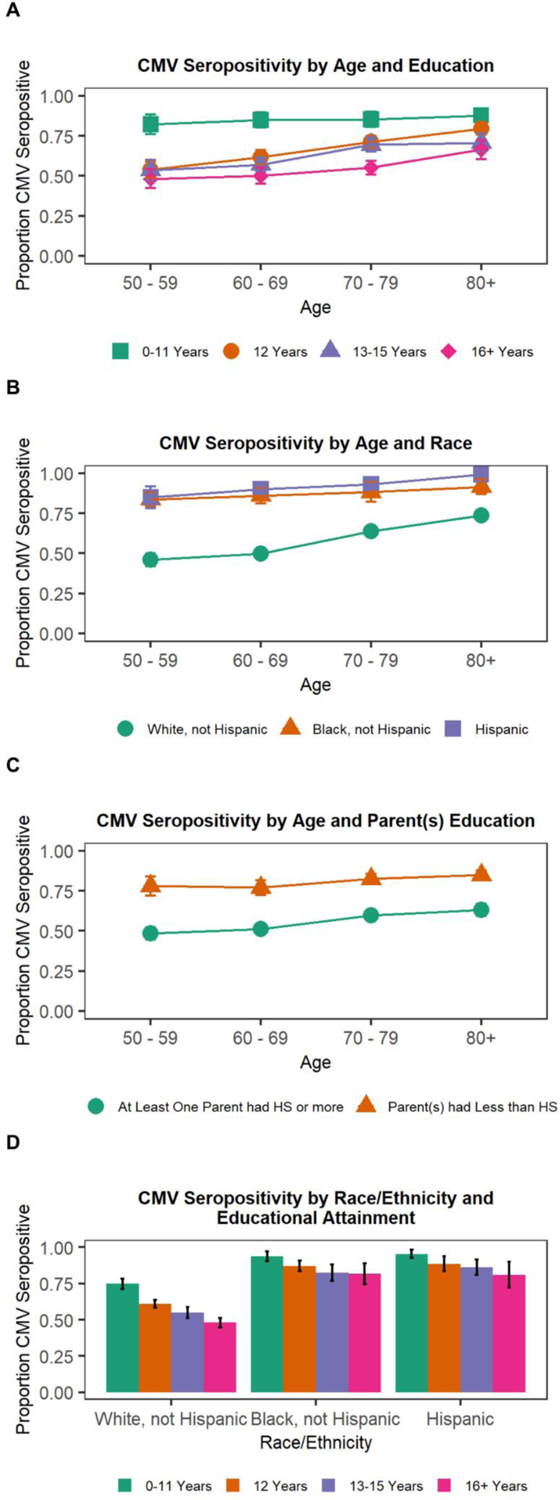
Proportion CMV seropositive by SES variables and age
Note: HS = high school; 95% confidence intervals shown.
Educational Attainment
Results indicating educational differences from models regressing cell type percentages and ratios on education and controls are shown in Figure 2, Panel A, Model 1. Compared to participants with the lowest level of education, i.e., fewer than 12 years, having 12 years of education, 13–15 years of education, or 16 or more years of education was associated with a greater percentage of naïve CD4+ T cells, CD8+ T cells, higher CD4:CD8 T cell ratio and CD4 naïve:CD4 total memory cell ratios, and lower percentages of CD4+ and CD8+ TemRA and late memory B cells (all indicative of less accelerated immune aging). Participants with 12 and 16 or more years of education had a greater percentage of naïve B cells compared to those with less than 12 years of education (indicative of less accelerated immune aging).
Figure 2.
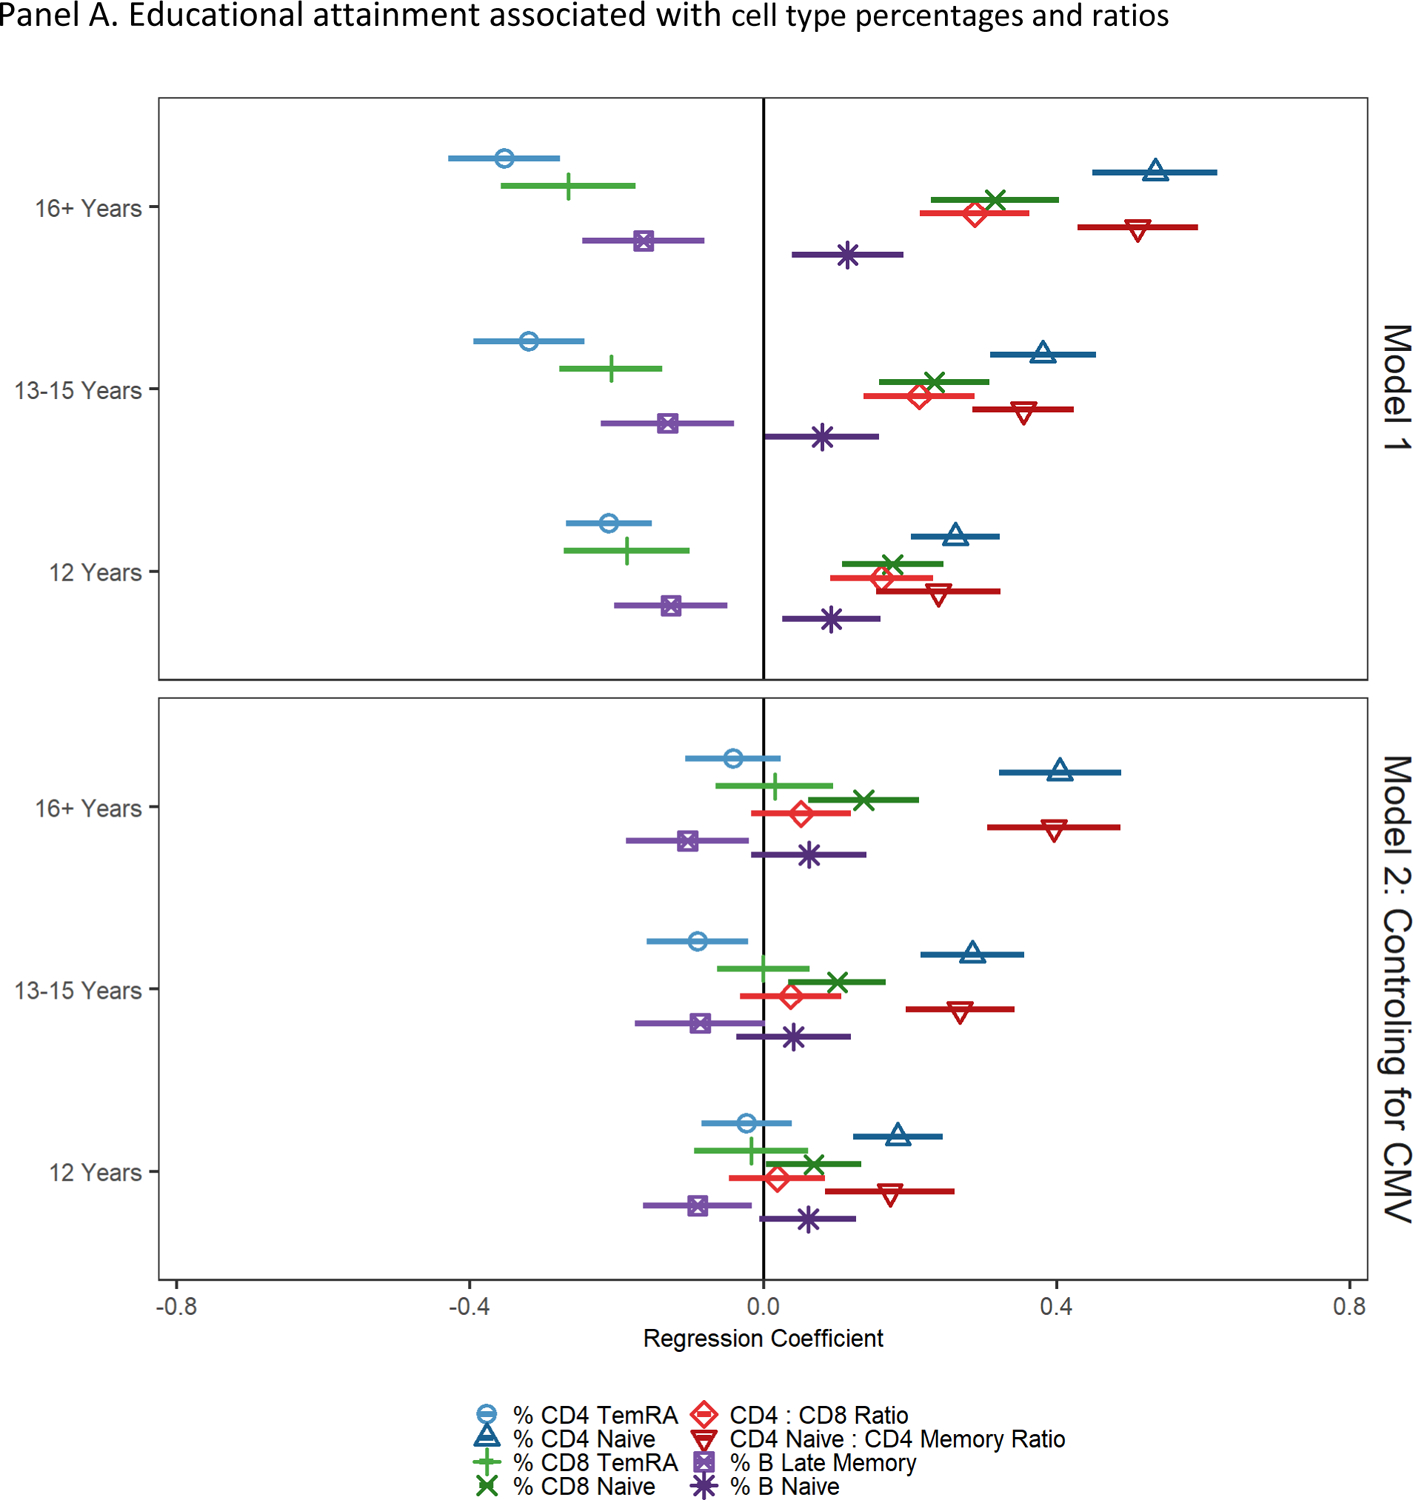
Socioeconomic and demographic factors associated with cell type percentages and ratios
Note: cell type percentages and ratios have been standardized to have a mean of 0 and standard deviation of 1; regression coefficients and 95% confidence intervals from GLMs regressing cell type percentages/ratios on educational attainment; reference group is less than 12 years of education. Model 1 controls for age and sex. Model 2 controls for age, sex, and CMV seropositivity.
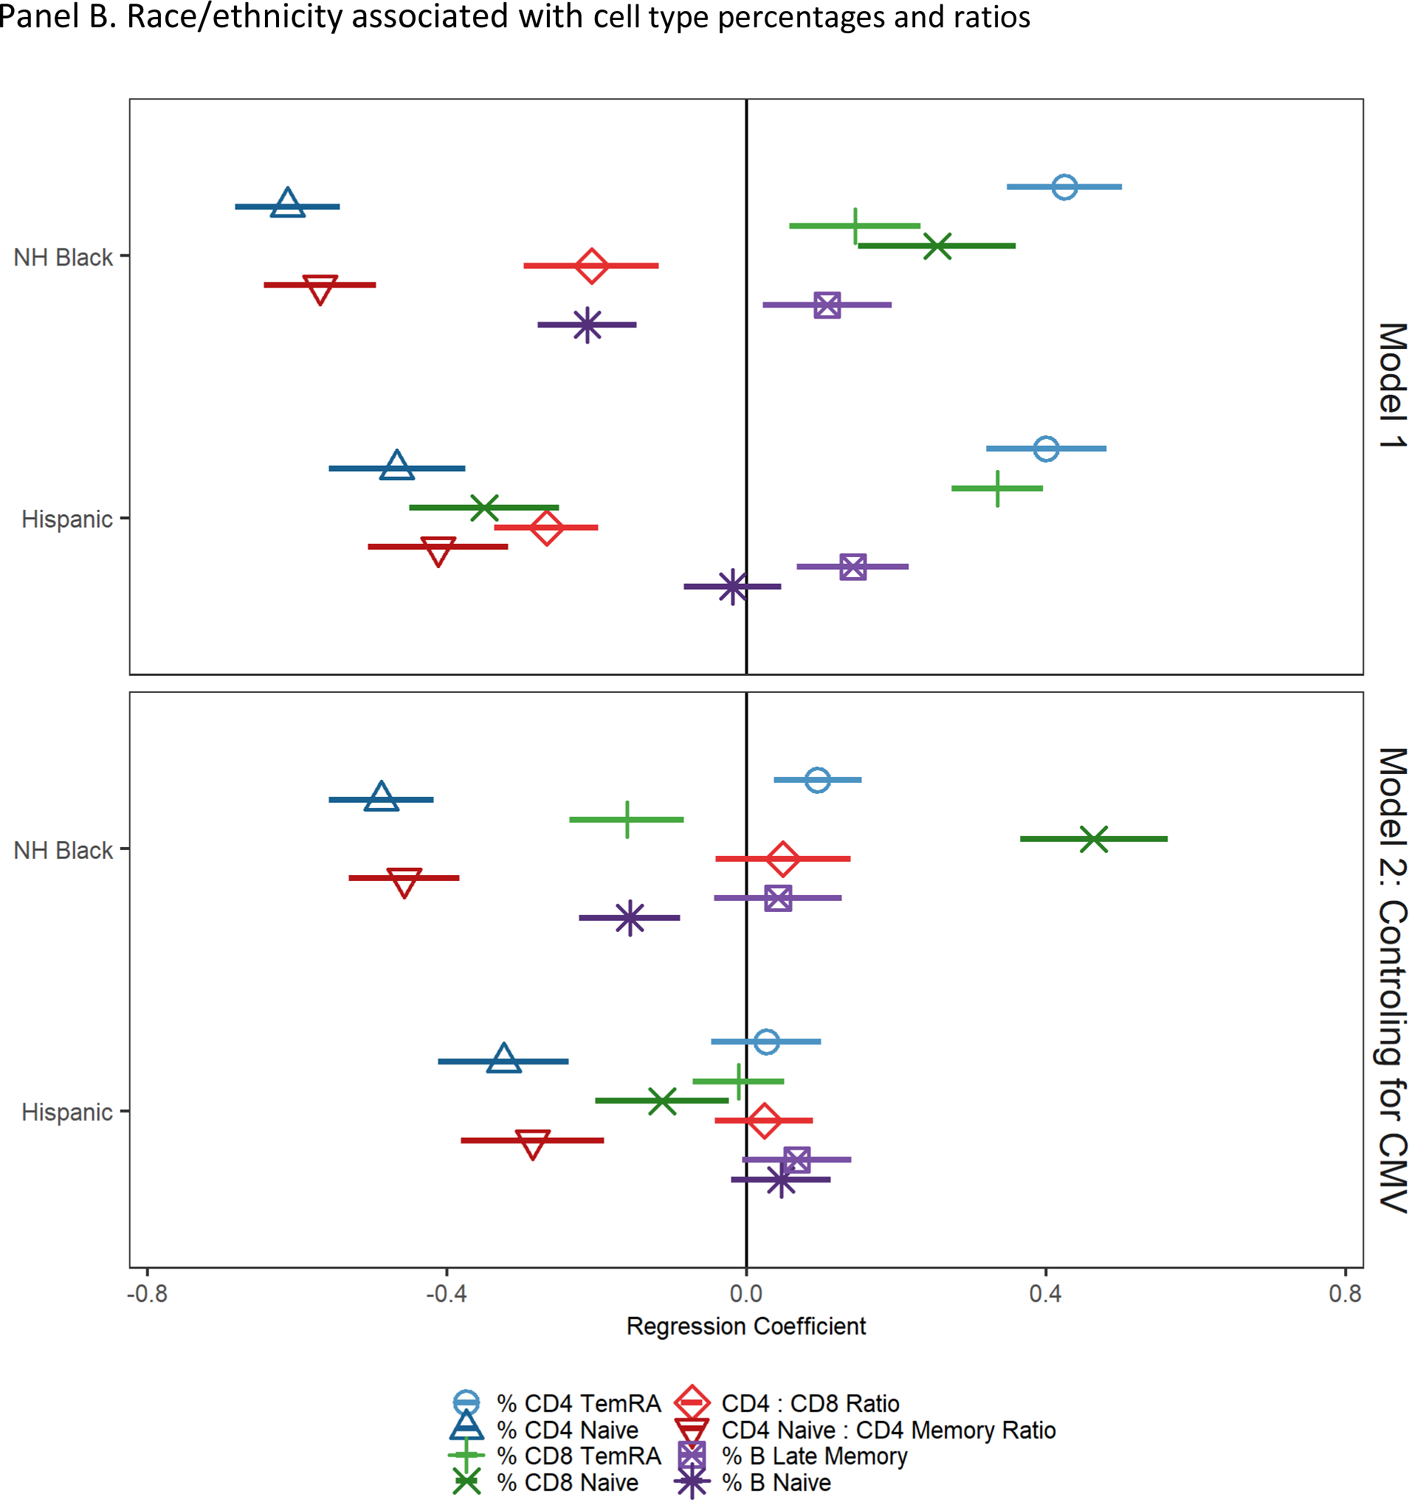
Note: NH = non-Hispanic; cell type percentages and ratios have been standardized to have a mean of 0 and standard deviation of 1; regression coefficients and 95% confidence intervals from GLMs regressing cell type percentages/ratios on race/ethnicity; reference group is non-Hispanic White. Model 1 controls for age and sex. Model 2 controls for age, sex, and CMV seropositivity.
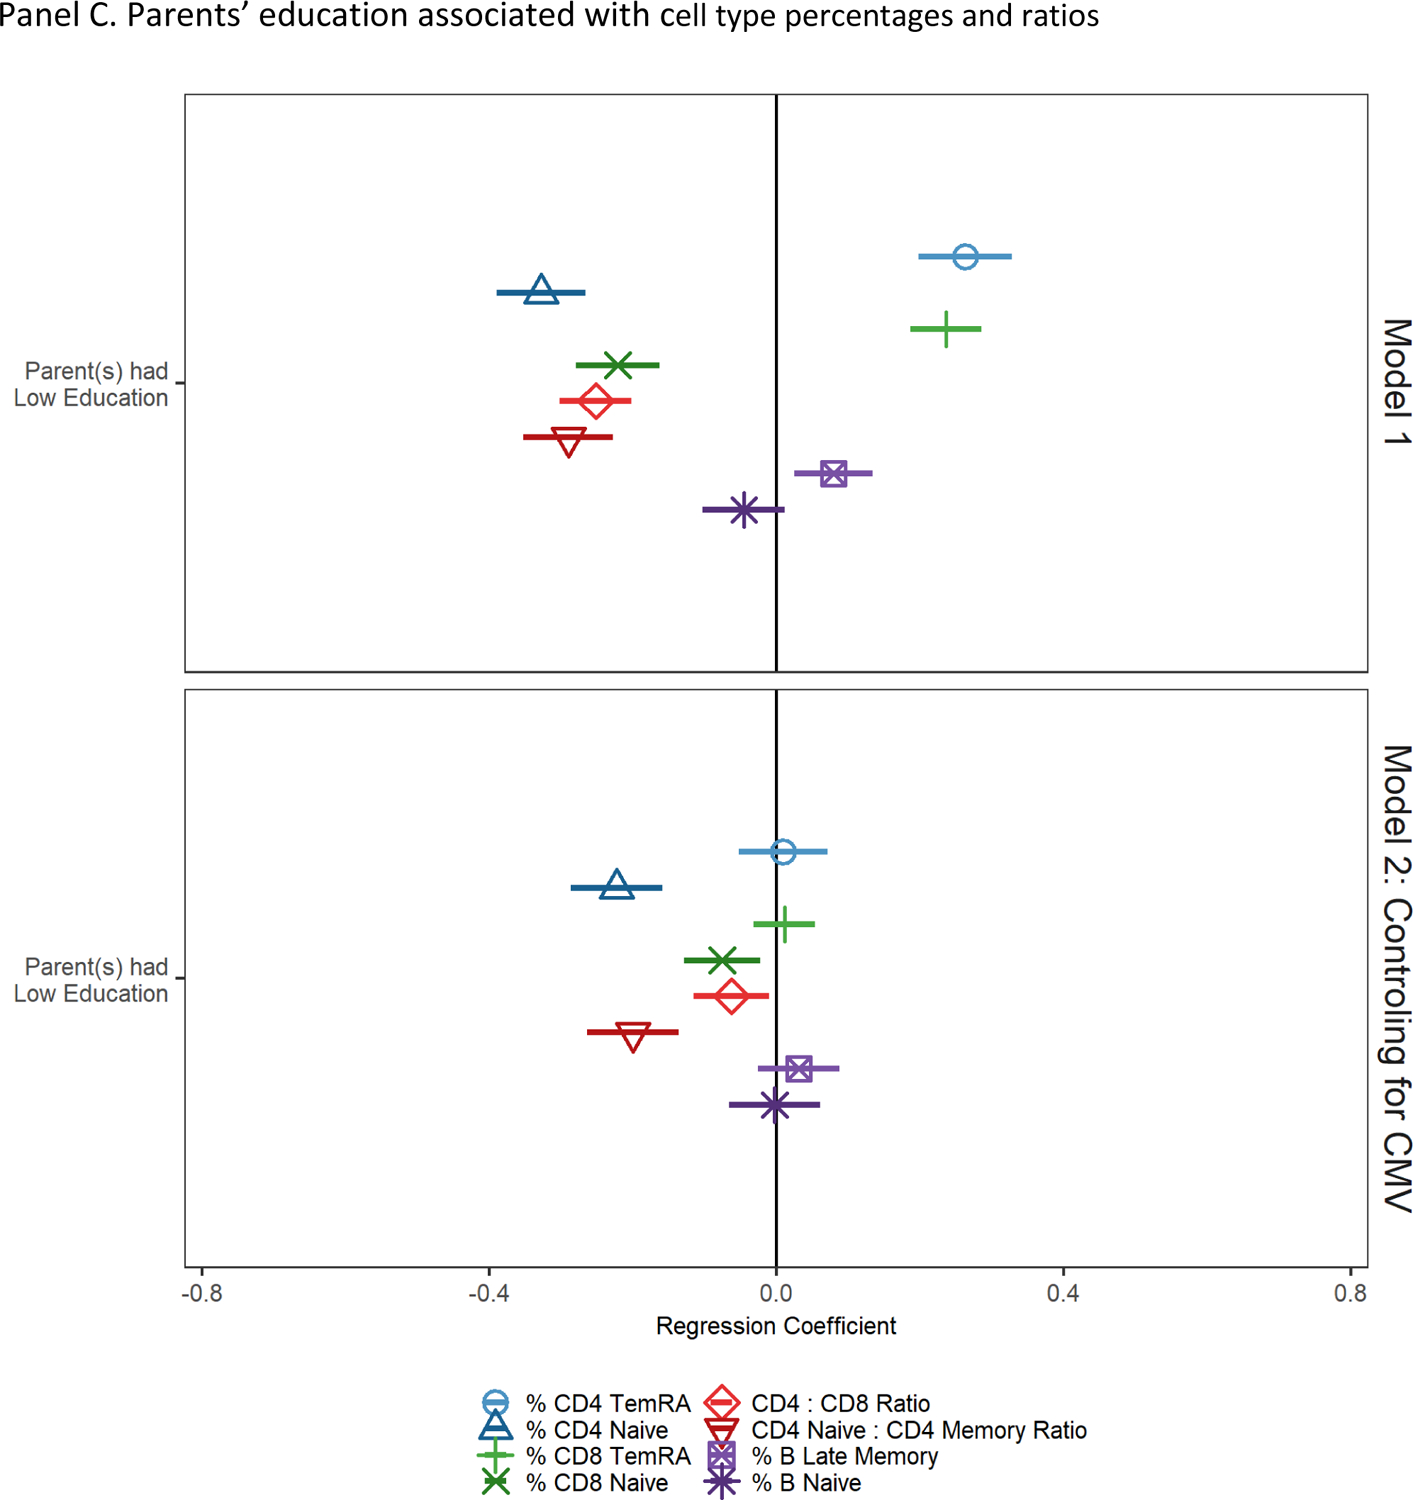
Note: cell type percentages and ratios have been standardized to have a mean of 0 and standard deviation of 1; regression coefficients and 95% confidence intervals from GLMs regressing cell type percentages/ratios on parents’ education; reference group is low parental education. Model 1 controls for age and sex. Model 2 controls for age, sex, and CMV seropositivity.
After controlling for CMV seropositivity in Model 2, compared to having fewer than 12 years of education, having 12 years of education was still associated with a greater percentage of naïve CD4+, a higher CD4 naïve:CD4 total memory cell ratio, and fewer late memory B cells (all indicative of less accelerated immune aging), but all other associations were attenuated and no longer statistically significant. Having 13–15 years of education was also associated with fewer CD8+ TemRA cells, a greater percentage of naïve CD4+ T and CD8+ T cells, and a higher CD4 naïve:CD4 total memory cell ratio (indicative of less accelerated immune aging) but was no longer associated with CD4:CD8 ratio or with CD8+ TemRA and late memory B cells. Finally, having 16 or more years of education was associated with a greater percentage of naïve CD4+ T and CD8+ T cells, and a higher CD4 naïve:CD4 total memory cell ratio, and fewer late memory B cells.
Race and Ethnicity
Results from models regressing cell type percentages and ratios on race and ethnicity and controls are shown in Figure 2, Panel B, Model 1. Compared to non-Hispanic White participants, non-Hispanic Black participants had fewer naïve CD4+ T cells, fewer naive B cells, and lower CD4:CD8 and CD4 naïve:CD4 total memory cell ratios (indicative of more accelerated immune aging). Black participants had a higher percentage of CD4+ TemRA cells, CD8+ TemRA cells, and late memory B cells (indicative of more accelerated immune aging). Unexpectedly, non-Hispanic Black participants also had a significantly higher percentage of CD8+ T naïve cells compared to non-Hispanic White participants (indicative of less accelerated immune aging). Compared to non-Hispanic White participants, Hispanic participants had fewer naïve CD4+ T and CD8+ T cells, lower CD4:CD8 and CD4 naïve:CD4 total memory cell ratios, and a higher percentage of CD4+ and CD8+ TemRA cells and late memory B cells (indicative of more accelerated immune aging).
After controlling for CMV seropositivity, non-Hispanic Black participants had significantly higher percentages of CD4+ TemRA and significantly lower percentages of naïve CD4+ T cells, CD8+ TemRA cells, and naïve B cells, and a significantly lower CD4 naïve:CD4 total memory cell ratio (indicative of more accelerated immune aging). Non-Hispanic Black participants had higher percentages of CD8+ naïve cells and the non-Hispanic Black-White CD8+ TemRA cell percentage difference changed direction after controlling for CMV seropositivity (indicative of less accelerated immune aging). Compared to White participants, Hispanic participants had lower CD4+ and CD8+ naïve T cell percentages and a lower CD4 naïve:CD4 total memory cell ratio after controlling for CMV (indicative of more accelerated immune aging).
We further investigated the sign change in CD8+ TemRA cells for Black participants after controlling for CMV seropositivity by looking at cell type percentages by race/ethnicity and CMV status (see Table 2). Among CMV non-reactive and among CMV reactive individuals, non-Hispanic Black participants had a lower percentage of CD8+ TemRA cells compared to non-Hispanic White participants.
Table 2.
Standardized cell type percentages and ratios by CMV status and race/ethnicity
| CMV Non-Reactive | CMV Reactive | ||||||
|---|---|---|---|---|---|---|---|
| Non-Hispanic White | Non-Hispanic Black | Hispanic | Non-Hispanic White | Non-Hispanic Black | Hispanic | ||
| % CD4 TemRA | −0.760 | −0.566 | −0.490 | 0.302 | 0.363 | 0.280 | a |
| % CD4 Naive | 0.401 | −0.212 | 0.127 | 0.030 | −0.434 | −0.288 | a,b,c,d,e,f |
| % CD8 TemRA | −0.706 | −0.905 | −0.658 | 0.325 | 0.104 | 0.220 | a,d,e |
| % CD8 Naive | 0.444 | 0.977 | 0.572 | −0.281 | 0.257 | −0.301 | a,c,d,f |
| CD4:CD8 Ratio | 0.526 | 0.594 | 0.342 | −0.253 | −0.204 | −0.199 | |
| CD4 Naive : CD4 Memory Ratio | 0.346 | −0.142 | 0.001 | 0.043 | −0.421 | −0.247 | a,b,d,e,f |
| % B Naive | 0.169 | −0.043 | 0.234 | −0.042 | −0.159 | 0.042 | a,c,d,e,f |
| % B Late Memory | −0.156 | −0.054 | −0.065 | 0.050 | 0.080 | 0.111 | |
Note: Lymphocyte percentages and ratios are standardized to have a mean of 0 and variance of 1 to make comparisons easier, thus some values may be below 0 or above 1; significant differences between groups (p < .05) are represented by: a = non-reactive non-Hispanic White compared to non-reactive non-Hispanic Black, b = non-reactive non-Hispanic White compared to non-reactive Hispanic, c = non-reactive non-Hispanic White compared to non-reactive Hispanic, d = reactive non-Hispanic White compared to reactive non-Hispanic Black, e = reactive non-Hispanic White compared to reactive Hispanic, f = reactive non-Hispanic White compared to reactive Hispanic.
Parental Education
Results of models regressing cell type percentages and ratios on parental education and controls are shown in Figure 2, Panel C, Model 1. Participants who had at least one parent with less than high school education had a lower percentage of naïve CD4+, CD8+, lower CD4:CD8 and CD4 naïve:CD4 total memory cell ratios, and higher percentages of CD4+ and CD8+ TemRA and late memory B cells. After controlling for CMV seropositivity, participants who had at least one parent with less than high school education had lower percentages of CD4+ and CD8+ naïve cells and lower CD4:CD8 T and CD4 naïve:CD4 total memory cell ratios compared to other participants (all indicative of more accelerated immune aging).
Mediation Analysis
Full results of mediation analyses are shown in e-table 4. This table shows the estimated average causal mediation effect (ACME: the indirect effect of being in a given group that goes through CMV serostatus), the 95% confidence interval for the ACME, the average direct effect (ADE; the direct effect of being in a given group that does not go through CMV serostatus), and the estimated proportion of the total effect mediated (ACME / ACME + ADE). All estimated ACMEs were statistically significant (i.e., 95% confidence intervals do not contain 0). The proportion of the total effect mediated by CMV seropositivity varied widely depending on the predictor and outcome variable, ranging from 15.2% to 95.2%.
Discussion
In this nationally representative sample of US adults over the age of 50, we found cell type percentages and ratios indicative of immune aging were associated with educational attainment, race and ethnicity, and parental education. Higher educational attainment, non-minority status, and higher levels of parental education were associated with less “aged” lymphocyte percentages. Though there has been little research on the association between immune aging and SES broadly, these findings are consistent with evidence that income is associated with age-related immune change (Aiello et al., 2016) and that SES is associated with immune functioning broadly (Kiecolt-Glaser & Glaser, 2001). Our findings are also consistent with past research showing early life SES (measured here by parental education) is associated with CMV exposure and altered immune functioning (Elwenspoek et al., 2017).
CMV serostatus substantially mediated all significant effects in this study, which underscores the importance of CMV in later life immune function. CMV infection is patterned by education and race/ethnicity in the US (Dowd et al., 2009). Of note, individuals with low education and racial and ethnic minorities are more likely to acquire CMV earlier in life than highly educated individuals and Non-Hispanic Whites (Colugnati et al., 2007). Generally, CMV positivity mediated a larger portion of associations with TemRA cells compared to associations with naive T cells. This is consistent with past research on memory inflation. That is, the suppression of CMV requires substantial immunological resources, leading to the expansion of late-differentiated T cells specific to CMV (Bektas et al., 2017). Having to control the virus for additional years may be relevant for the sociodemographic patterning of decline in immune function observed with aging (Solana et al., 2012).
Higher percentages of naïve T cells were consistently indicative of higher educational attainment, non-Hispanic White identity, and higher parental education independent of CMV serostatus. It is possible lifestyle factors associated with these sociodemographic factors (e.g., diet and exercise) may slow thymic involution, leading to a relatively larger percentage of new naïve T cells being produced (Palmer et al., 2018). Thus, naïve T cells may be an immunological bellwether for socioeconomic and structural forces of interest to researchers interested in health inequalities, however further research is needed to refine this hypothesis.
Higher educational attainment was positively associated with CD4/CD8 ratio, indicating stronger immune function, however, all observed associations were attenuated and no longer statistically significant after adjusting for CMV. Thus, the differential prevalence of CD4+ and CD8+ T lymphocytes associated with educational attainment may be driven by differential exposure to and reactivation of CMV (Bauer & De la Fuente, 2016; Reed et al., 2019). Alternatively, the ratio of CD4+ naïve to CD4+ memory cells was statistically significantly associated with educational attainment, race and ethnicity, and parental education after controlling for CMV seropositivity. Therefore, CD4+ naïve/CD4+ memory cell ratio may be particularly indicative of age-related immune phenotype that is affected by educational attainment, race and ethnic status, and parental education.
Non-Hispanic Black-White differences in CD8+ naïve T cell percentages became more extreme after controlling for CMV, and CD8+ TemRA cell differences changed direction. This was because non-Hispanic Black participants had a lower percentage of CD8+ TemRA cells and higher percentage of CD8+ naïve T cells compared to non-Hispanic White participants within each CMV seropositivity category. These differences were masked or reversed at the population level, suggesting this may be an example of Simpson’s paradox. That is, were it not for differential CMV exposure, Black US adults might have less accelerated immunosenescence compared to White US adults. Differential exposure to CMV may be a major driver of racial differences in immunosenescence and potentially in racial health disparities, though further research is needed to confirm this. Interventions targeting exposure to risk factors (e.g., number of individuals in the household, sexual behaviors), interventions focused on building resilience to stress and providing resources to more at risk groups (e.g., people born outside of the US, people who utilize day care), or potentially CMV vaccination may help in addressing racial health disparities.
This study has limitations. First, CMV seroprevalence and flow cytometry were only assessed at one time. Longitudinal assessments are needed to establish temporal ordering of CMV infection and age-related cell type percentages and ratios. Second, this study is limited to US adults 50 years and older. Further research in international samples with different educational systems and CMV seroprevalence profiles are needed to understand place-based SES and infection influences on later life immune function.
Despite these limitations, this study has many strengths. The age-related cell type percentages and ratios examined expand on previous research into the immune risk profile (Pawelec, 2020)—immune parameters associated with mortality in very old individuals—to include age-related changes to immune function in a population representative study of older US adults. This study provides evidence higher socioeconomic status may be protective against immunosenescence. Future research on nutritional, physical activity, psychosocial stress, and inflammatory drivers of cell type percentages and ratios, as well as the relationship between cell type percentages and ratios and morbidity and mortality are warranted. We focused on associations between educational attainment, race/ethnicity, and parental education and immune aging indicators; however, as noted above, there are a number of important potential pathways by which these factors are associated with immune aging. Future research should investigate these pathways. Understanding the aging immune system may illuminate the biological processes underlying inequalities in age-related morbidity and mortality.
Supplementary Material
Table 1.
Expected Associations of Cell Type Percentages with Age
| Expected Association with Age | Cell Type |
|---|---|
| ↓ | Naïve T Cell % |
| ↑ | TemRA T Cell % |
| ↓ | CD4+ : CD8+ Ratio |
| ↓ | Naïve CD4+ : Total Memory Ratio |
| ↓ | Naïve B Cell % |
| ↑ | Late Memory B Cell % |
Note: Cell type percentages are expected to change on average with age. Thus, people who have more extreme changes than same aged peers (e.g., after statistically controlling for chronological age) have more accelerated immune aging.
Funding Statement
Support was provided by grants from the National Institute on Aging (T32AG000037-43, P30AG017265, and R01AG060110).
The Health and Retirement Study is supported by the National Institute on Aging (NIA U01AG009740) and the Social Security Administration with grants to the University of Michigan.
Footnotes
Conflict of Interest Disclosure
The authors report no conflict of interest.
Ethics Approval Statement
This research was approved by the University of Southern California IRB.
Contributor Information
Eric T. Klopack, Leonard Davis School of Gerontology, University of Southern California.
Bharat Thyagarajan, Department of Laboratory Medicine and Pathology, University of Minnesota
Jessica D. Faul, Survey Research Center, University of Michigan
Helen C. S. Meier, Survey Research Center, University of Michigan
Ramya Ramasubramanian, Division of Epidemiology and Community Health, University of Minnesota School of Public Health
Jung Ki Kim, Leonard Davis School of Gerontology, University of Southern California
Eileen M. Crimmins, Leonard Davis School of Gerontology, University of Southern California
Data Availability Statement
All data are publicly available: https://hrs.isr.umich.edu/
References
- Aiello AE, Feinstein L, Dowd JB, Pawelec G, Derhovanessian E, Galea S, Uddin M, Wildman DE, & Simanek AM (2016). Income and Markers of Immunological Cellular Aging. Psychosomatic Medicine, 78(6), 657–666. 10.1097/PSY.0000000000000320 [DOI] [PMC free article] [PubMed] [Google Scholar]
- Bauer ME, & De la Fuente M (2016). The role of oxidative and inflammatory stress and persistent viral infections in immunosenescence. Mechanisms of Ageing and Development, 158, 27–37. 10.1016/j.mad.2016.01.001 [DOI] [PubMed] [Google Scholar]
- Bektas A, Schurman SH, Sen R, & Ferrucci L (2017). Human T cell immunosenescence and inflammation in aging. Journal of Leukocyte Biology, 102(4), 977–988. 10.1189/jlb.3RI0716-335R [DOI] [PMC free article] [PubMed] [Google Scholar]
- Cannon M, Schmid D, & Hyde T (2010). Review of cytomegalovirus seroprevalence and demographic characteristics associated with infection. Reviews in Medical Virology, 20(4), 202–213. 10.1002/rmv.655 [DOI] [PubMed] [Google Scholar]
- Colugnati FA, Staras SA, Dollard SC, & Cannon MJ (2007). Incidence of cytomegalovirus infection among the general population and pregnant women in the United States. BMC Infectious Diseases, 7(1), 71. 10.1186/1471-2334-7-71 [DOI] [PMC free article] [PubMed] [Google Scholar]
- Crimmins EM, Faul JD, Thyagarajan B, & Weir DR (2017). Venous blood collection and assay protocol in the 2016 Health and Retirement Study 2016 Venous Blood Study (VBS). https://hrsdata.isr.umich.edu/sites/default/files/documentation/data-descriptions/HRS2016VBSDD.pdf
- Dowd JB, Aiello AE, & Alley DE (2009). Socioeconomic disparities in the seroprevalence of cytomegalovirus infection in the US population: NHANES III. Epidemiology and Infection, 137(1), 58–65. 10.1017/S0950268808000551 [DOI] [PMC free article] [PubMed] [Google Scholar]
- Duggal NA, Pollock RD, Lazarus NR, Harridge S, & Lord JM (2018). Major features of immunesenescence, including reduced thymic output, are ameliorated by high levels of physical activity in adulthood. Aging Cell, 17(2), e12750. 10.1111/acel.12750 [DOI] [PMC free article] [PubMed] [Google Scholar]
- Elwenspoek MMC, Sias K, Hengesch X, Schaan VK, Leenen FAD, Adams P, Mériaux SB, Schmitz S, Bonnemberger F, Ewen A, Schächinger H, Vögele C, Muller CP, & Turner JD (2017). T Cell Immunosenescence after Early Life Adversity: Association with Cytomegalovirus Infection. Frontiers in Immunology, 8. 10.3389/fimmu.2017.01263 [DOI] [PMC free article] [PubMed] [Google Scholar]
- Hoes J, Boef AGC, Knol MJ, de Melker HE, Mollema L, van der Klis FRM, Rots NY, & van Baarle D (2018). Socioeconomic Status Is Associated With Antibody Levels Against Vaccine Preventable Diseases in the Netherlands. Frontiers in Public Health, 6, 209. 10.3389/fpubh.2018.00209 [DOI] [PMC free article] [PubMed] [Google Scholar]
- Huff WX, Kwon JH, Henriquez M, Fetcko K, & Dey M (2019). The Evolving Role of CD8+CD28− Immunosenescent T Cells in Cancer Immunology. International Journal of Molecular Sciences, 20(11), Article 11. 10.3390/ijms20112810 [DOI] [PMC free article] [PubMed] [Google Scholar]
- Kiecolt-Glaser JK, & Glaser R (2001). Stress and immunity: Age enhances the risks. Current Directions in Psychological Science, 10(1), Article 1. pbh. 10.1111/1467-8721.00105 [DOI] [Google Scholar]
- Klopack ET, Crimmins EM, Cole SW, Seeman TE, & Carroll JE (2022a). Accelerated epigenetic aging mediates link between adverse childhood experiences and depressive symptoms in older adults: Results from the Health and Retirement Study. SSM - Population Health, 17, 101071. 10.1016/j.ssmph.2022.101071 [DOI] [PMC free article] [PubMed] [Google Scholar]
- Klopack ET, Crimmins EM, Cole SW, Seeman TE, & Carroll JE (2022b). Social stressors associated with age-related T lymphocyte percentages in older US adults: Evidence from the US Health and Retirement Study. Proceedings of the National Academy of Sciences, 119(25), e2202780119. 10.1073/pnas.2202780119 [DOI] [PMC free article] [PubMed] [Google Scholar]
- Kristenson M, Eriksen HR, Sluiter JK, Starke D, & Ursin H (2004). Psychobiological mechanisms of socioeconomic differences in health. Social Science & Medicine, 58(8), 1511–1522. 10.1016/S0277-9536(03)00353-8 [DOI] [PubMed] [Google Scholar]
- Lumley T (2004). Analysis of Complex Survey Samples. Journal of Statistical Software, 9(1), 1–19. 10.18637/jss.v009.i08 [DOI] [Google Scholar]
- McEwen CA, & McEwen BS (2017). Social structure, adversity, toxic stress, and intergenerational poverty: An early childhood model. Annual Review of Sociology, 43(1), Article 1. 10.1146/annurev-soc-060116-053252 [DOI] [Google Scholar]
- Palmer S, Albergante L, Blackburn CC, & Newman TJ (2018). Thymic involution and rising disease incidence with age. Proceedings of the National Academy of Sciences, 115(8), 1883–1888. 10.1073/pnas.1714478115 [DOI] [PMC free article] [PubMed] [Google Scholar]
- Pangrazzi L, & Weinberger B (2020). T cells, aging and senescence. Experimental Gerontology, 134, 110887. 10.1016/j.exger.2020.110887 [DOI] [PubMed] [Google Scholar]
- Pawelec G (2018). Age and immunity: What is “immunosenescence”? Experimental Gerontology, 105, 4–9. 10.1016/j.exger.2017.10.024 [DOI] [PubMed] [Google Scholar]
- Pawelec G (2020). The human immunosenescence phenotype: Does it exist? Seminars in Immunopathology, 42(5), 537–544. 10.1007/s00281-020-00810-3 [DOI] [PMC free article] [PubMed] [Google Scholar]
- Pudrovska T, & Anikputa B (2014). Early-Life Socioeconomic Status and Mortality in Later Life: An Integration of Four Life-Course Mechanisms. The Journals of Gerontology: Series B, 69(3), 451–460. 10.1093/geronb/gbt122 [DOI] [PMC free article] [PubMed] [Google Scholar]
- Pudrovska T, Logan ES, & Richman A (2014). Early-life social origins of later-life body weight: The role of socioeconomic status and health behaviors over the life course. Social Science Research, 46, 59–71. edselp. 10.1016/j.ssresearch.2014.02.007 [DOI] [PMC free article] [PubMed] [Google Scholar]
- R Core Team. (2021). R: A language and environment for statistical computing. R Foundation for Statistical Computing. https://www.R-project.org/ [Google Scholar]
- Reed RG, Presnell SR, Al-Attar A, Lutz CT, & Segerstrom SC (2019). Perceived stress, cytomegalovirus titers, and late-differentiated T and NK cells: Between-, within-person associations in a longitudinal study of older adults. Brain, Behavior, and Immunity, 80, 266–274. 10.1016/j.bbi.2019.03.018 [DOI] [PMC free article] [PubMed] [Google Scholar]
- Simons RL, Lei M-K, Klopack E, Beach SRH, Gibbons FX, & Philibert RA (2021). The effects of social adversity, discrimination, and health risk behaviors on the accelerated aging of African Americans: Further support for the weathering hypothesis. Social Science & Medicine, 282, 113169. 10.1016/j.socscimed.2020.113169 [DOI] [PMC free article] [PubMed] [Google Scholar]
- Solana R, Tarazona R, Aiello AE, Akbar AN, Appay V, Beswick M, Bosch JA, Campos C, Cantisán S, Cicin-Sain L, Derhovanessian E, Ferrando-Martínez S, Frasca D, Fulöp T, Govind S, Grubeck-Loebenstein B, Hill A, Hurme M, Kern F, … Pawelec G (2012). CMV and Immunosenescence: From basics to clinics. Immunity & Ageing, 9(1), Article 1. 10.1186/1742-4933-9-23 [DOI] [PMC free article] [PubMed] [Google Scholar]
- Spadaro O, Youm Y, Shchukina I, Ryu S, Sidorov S, Ravussin A, Nguyen K, Aladyeva E, Predeus AN, Smith SR, Ravussin E, Galban C, Artyomov MN, & Dixit VD (2022). Caloric restriction in humans reveals immunometabolic regulators of health span. Science, 375(6581), 671–677. 10.1126/science.abg7292 [DOI] [PMC free article] [PubMed] [Google Scholar]
- Thyagarajan B, Barcelo H, Crimmins E, Weir D, Minnerath S, Vivek S, & Faul J (2018). Effect of delayed cell processing and cryopreservation on immunophenotyping in multicenter population studies. Journal of Immunological Methods, 463, 61–70. 10.1016/j.jim.2018.09.007 [DOI] [PMC free article] [PubMed] [Google Scholar]
- Thyagarajan B, Faul J, Vivek S, Kim JK, Nikolich-Žugich J, Weir D, & Crimmins EM (2021). Age-related differences in T cell subsets in a nationally representative sample of people over age 55: Findings from the Health and Retirement Study. The Journals of Gerontology: Series A, glab300. 10.1093/gerona/glab300 [DOI] [PMC free article] [PubMed] [Google Scholar]
- Tingley D, Yamamoto T, Hirose K, Keele L, & Imai K (2014). mediation: R Package for Causal Mediation Analysis. Journal of Statistical Software, 59, 1–38. 10.18637/jss.v059.i0526917999 [DOI] [Google Scholar]
- Williams DR (2012). Miles to go before we Sleep: Racial inequities in health. Journal of Health and Social Behavior, 53(3), Article 3. edsjsr. 10.1177/0022146512455804 [DOI] [PMC free article] [PubMed] [Google Scholar]
- Williams DR (2018). Stress and the Mental Health of Populations of Color: Advancing Our Understanding of Race-related Stressors. Journal of Health and Social Behavior, 59(4), 466–485. 10.1177/0022146518814251 [DOI] [PMC free article] [PubMed] [Google Scholar]
- Yang YC, Gerken K, Schorpp K, Boen C, & Harris KM (2017). Early-life socioeconomic status and adult physiological functioning: A life course examination of biosocial mechanisms. Biodemography & Social Biology, 63(2), Article 2. sih. 10.1080/19485565.2017.1279536 [DOI] [PMC free article] [PubMed] [Google Scholar]
Associated Data
This section collects any data citations, data availability statements, or supplementary materials included in this article.
Supplementary Materials
Data Availability Statement
All data are publicly available: https://hrs.isr.umich.edu/