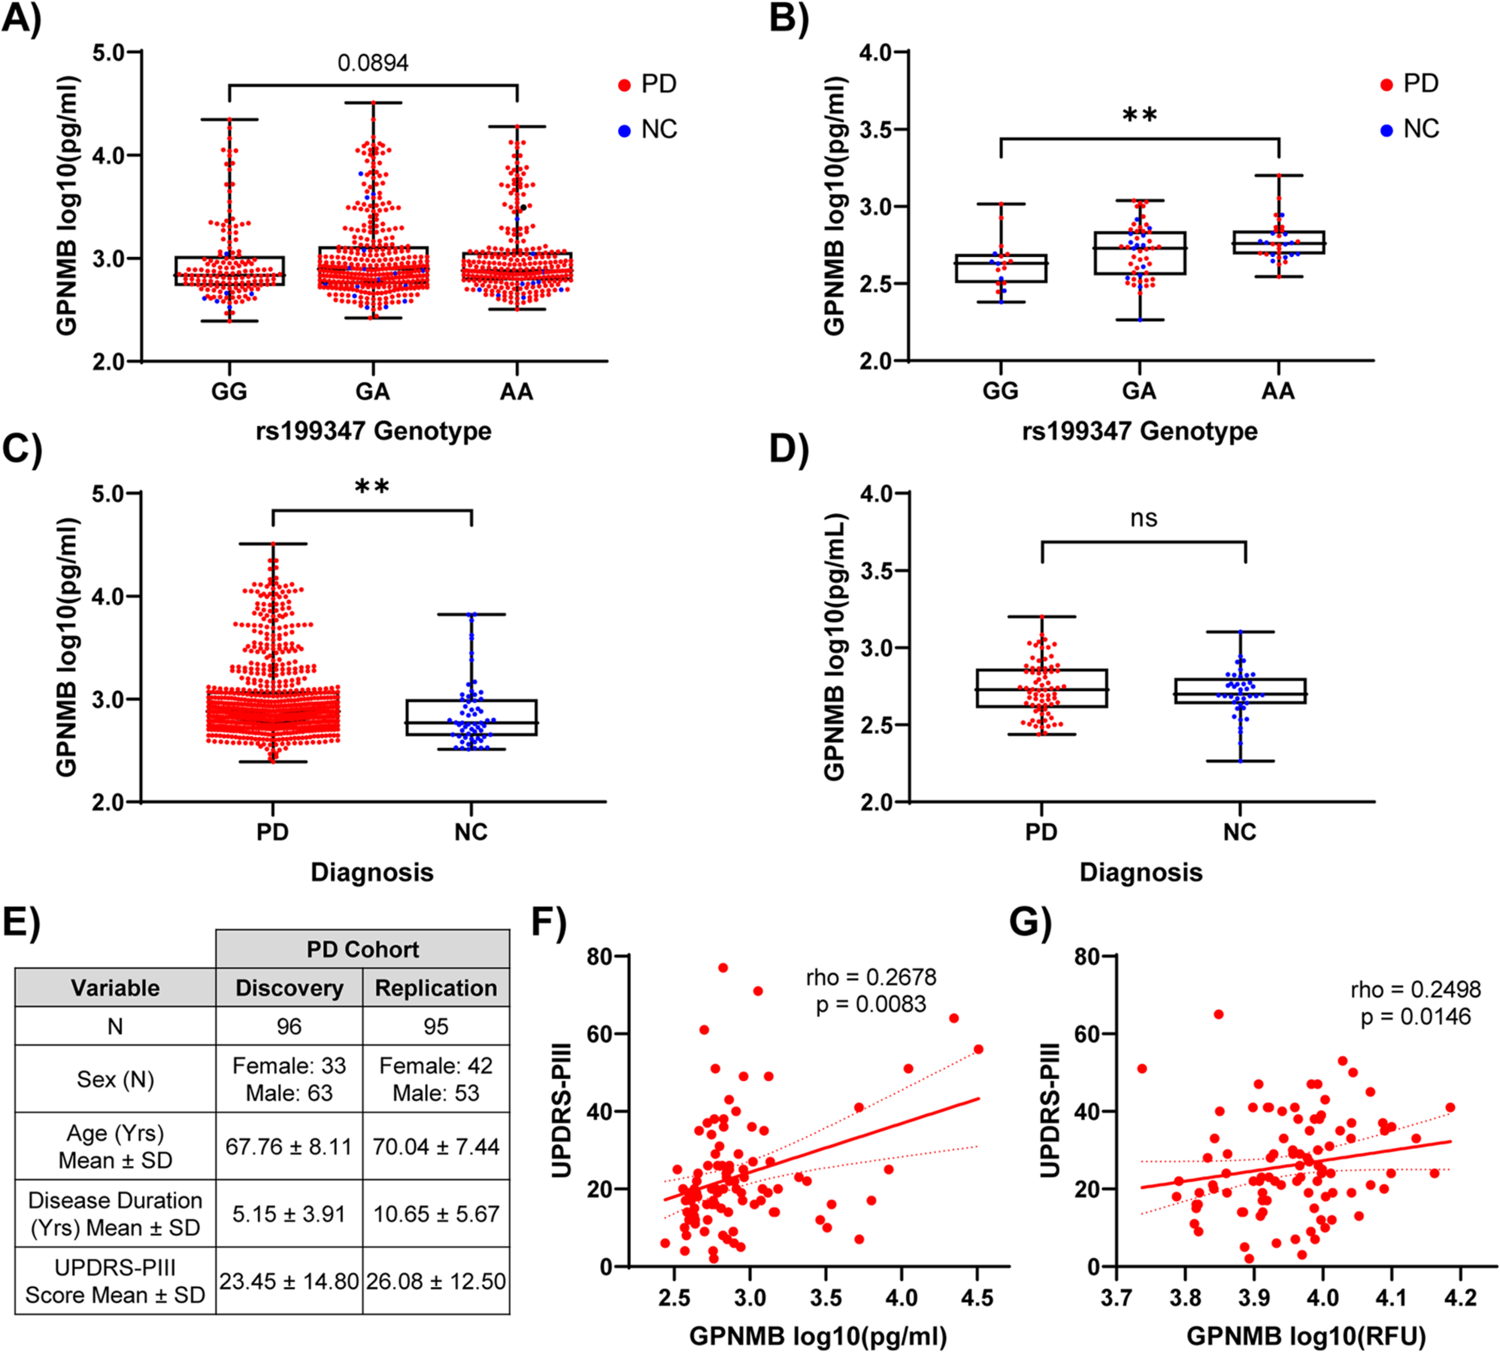
Fig. 6. Biofluid GPNMB protein levels associate with rs199347 genotype, PD diagnosis, and disease severity.

(A) Plasma and (B) CSF GPNMB levels grouped by rs199347 genotype. Genotypes compared with Kruskal-Wallis test, followed by post-hoc Dunn’s test. ** p < 0.01. (C) Plasma and (D) CSF GPNMB levels grouped by diagnosis. PD (red) vs. neurologically normal controls (NC, blue) compared by Mann-Whitney test. Boxplots depict median, 25th, 75th quartiles, while whiskers are full range. ** p < 0.01. (E) Demographics for discovery and replication cohorts used for UPDRS-PIII analysis. (F-G) Scatterplots showing positive correlation between UPDRS-PIII scores and plasma GPNMB values in discovery (F) and replication (G) cohorts. Spearman’s rho and p-value displayed in text.
