Summary
APOE4 is the strongest genetic risk factor for Alzheimer’s disease (AD)1–3. Yet, the effects of APOE4 on the human brain are not fully understood, limiting opportunities to develop targeted therapeutics for APOE4 and other AD risk factors4–8. To gain more comprehensive insight into the impact of APOE4 on the human brain, we performed single-cell transcriptomics profiling of post-mortem human brains from APOE4-carriers compared to non-carriers. This revealed that APOE4 is associated with widespread gene expression changes across all cell types of the human brain. Consistent with APOE’s biological function2–6, APOE4 significantly altered signaling pathways associated with cholesterol homeostasis and transport. Confirming these findings with histological and lipidomic analysis of the post-mortem human brain, iPSC-derived cells, and targeted-replacement mice, we further discovered that cholesterol is aberrantly deposited in oligodendrocytes, myelinating cells responsible for insulating and promoting electrical activity of neurons. We discovered altered cholesterol localization in the APOE4 brain coincides with reduced myelination. Pharmacologically facilitating cholesterol transport increases axonal myelination and improves learning and memory in APOE4 mice. Our study delivers a single-cell atlas detailing the transcriptional effects of APOE4 on the aged human brain and establishes a functional link between APOE4, cholesterol, myelination, and memory; opening paths to new therapeutic opportunities for AD.
Introduction
Late-onset Alzheimer’s disease (AD) accounts for more than 95% of the disease, with approximately 50 million cases worldwide. The heritability of AD is estimated between 50 and 80%, suggesting that genetics is the most dominant risk factor after age. Genome-wide association studies (GWAS) have identified genetic variants associated with an increased risk of AD1. The E4 allele variant in the APOE gene shows the strongest association with AD1–3. One copy of the APOE4 allele, which differs from the major allele (APOE3) by a single amino acid change from Cys112 to Arg112, increases the risk of developing AD 3 to 4 fold, while two copies increase it by 8 to 12 fold2. APOE4 is associated with increased amyloid-β deposition, hyperphosphorylation and aggregation of tau, and accelerated cognitive decline4–7. However, the mechanisms by which APOE4 mediates these effects are not fully understood. The APOE4 allele is present in 40 – 50% of the AD population8, therefore elucidating the molecular and cellular pathways underlying APOE4-associated pathogenesis could reveal therapeutic opportunities for a large portion of the AD population.
APOE is a lipid and cholesterol transporter. The APOE4 polymorphism alters the accessibility of the lipid-binding region, which interferes with its cholesterol and lipid transport capacity7. Alois Alzheimer noted lipid inclusions in glial cells when first describing AD9. Recent in vitro studies discovered that APOE4 promotes the accumulation of unsaturated triglycerides and lipid droplets in iPSC-derived astrocytes10 and increases cholesterol sequestration in astrocytes leading to changes in the brain matrisome11. Despite these longstanding associations, how cholesterol and lipid abnormalities impair learning and memory in the APOE4 brain, and whether such effects can be mitigated, remains unclear.
Insight into APOE4-mediated pathogenesis is complicated by the fact that APOE is a soluble factor expressed by many cell types12,13. The APOE genotype has a widespread impact on cell-autonomous and non-autonomous biological processes14. To investigate this complexity, we sought to generate an extensive cell-type-specific reference of the molecular processes influenced by APOE4 in the post-mortem human brain. We profiled the prefrontal cortex (PFC) from APOE4-carriers (APOE3/4 or APOE4/4) and non-carriers (APOE3/3) using single-nucleus RNA-sequencing and then complemented this transcriptomic approach with phenotypic analysis of post-mortem human brain sections and isogenic iPSC models, and with studies in humanized APOE knock-in mice. Our results reveal that APOE4: (1) alters cholesterol biosynthesis, trafficking, and localization in human and mouse oligodendrocytes; and (2) is associated with endoplasmic reticulum stress and reduced myelination. We establish that pharmacologically facilitating cholesterol transport improves myelination and learning and memory in aged APOE4/4 mice, thus providing new insight into the mechanistic connection between APOE4, myelination, and AD pathogenesis.
APOE4 single-nucleus profiling
To determine the effect of APOE4 on gene expression in the aged human brain, we studied a cohort of 32 subjects (12 APOE3/3, 12 APOE3/4, and 8 APOE4/4-carriers) from the Religious Order Study (ROS) or the Rush Memory and Aging Project (MAP), collectively known as ROSMAP15. The APOE3/3 and APOE3/4 subgroups were balanced by AD pathological diagnosis (n=6 each for positive and negative diagnoses of AD) and gender (3 male and 3 female each; Extended Data Fig. 1a; Supplementary Table S1). All AD subjects presented high levels of both amyloid and neurofibrillary tangle (Tau) pathology, and there were no differences in age or post-mortem intervals between APOE3/3 and APOE3/4 groups and AD status (Extended Data Fig. 1b). All available APOE4/4-carriers had a diagnosis of AD, and 5 out of 8 were female. We obtained post-mortem tissue samples extracted from the prefrontal cortex of each individual and performed single-nucleus RNA sequencing (snRNAseq) using the 10x Genomics Chromium platform. We report a total of 178,789 (164,741 after quality control) single-nucleus transcriptomes (Extended Data Fig. 1c).
Cellular diversity of human PFC
Cell types and subtypes were annotated through two rounds of graph-based clustering analysis (Extended Data Fig. 1c). The first round identified excitatory (Ex, NRGN+) and inhibitory (In, GAD1+) neurons (SYT1+), astrocytes (Ast, AQP4+), oligodendrocytes (Oli, MBP+), oligodendrocyte progenitor cells (OPC, VCAN+), microglia (Mic, CSF1R+), and a heterogeneous population of vascular cell types (Extended Data Fig. 1d). Annotations were supported by expression patterns of curated marker genes16,17 (Extended Data Fig. 1e; Supplementary Table S2). Sub-clustering analysis of each cell type population identified T-cell (Tcell, CD247+), pericytes (Per, PDGFRB+), endothelial cells (End, FLT1+), smooth muscle cells (SMC, CALD1+), and fibroblasts (Fib, ABCA9+) (Extended Data Fig 1f). A total of 11 cell types supported by gene marker expression and significant enrichment (FDR < 0.01, permutation test) of marker sets (Extended Data Fig. 1g) were annotated. Cell type expression profiles were strongly correlated between individual donors (average Pearson r=0.94 and r=0.65 for high and low-abundant cell types, respectively; Extended Data Fig. 1h, i; Supplementary Table S3). Low-abundant cells (Tcell, End, Per, Fib, SMC) were not detected in a small fraction of subjects (average fraction across cell types = 0.1) and had relatively low cell counts when detected (9.3 vs 850.2 cells on average across cell types and subjects for low- and high-abundant cells, respectively) (Extended Data Fig. 1j, k). High-abundant cell types were well-represented across all donors, independent of AD diagnosis or genotypic background, with reproducible proportions in most cases (Extended Data Fig. 1l, m). Therefore, downstream analysis was focused only on high-abundant cell types.
APOE4 pathway-level alterations
To broadly characterize the potential transcriptomic effects of APOE4 on molecular processes, we considered Gene Ontology Biological Processes (GO BP) and performed differential pathway activity analysis. We aggregated gene expression values into pathway activity scores and estimated the effect of APOE4 on aggregate scores. Activity scores summarize the overall gene expression levels for genes in a given pathway, improving power to detect subtle pathway activity changes (see Methods). We compared APOE3/4 and APOE4/4 vs APOE3/3 scores using a multivariate linear model controlling for sex, postmortem interval (PMI), amyloid, neurofibrillary tangles, and age at death. A total of 486 candidate APOE4-perturbed molecular processes were identified (p-value < 0.05), including cell-type specific (404 pathways, affected only in one cell type) and broadly dysregulated processes (82 pathways, affected in at least two cell types) (Fig. 1a; Supplementary Table S4).
Fig. 1. Cell-type specific APOE4-associated pathway alterations.
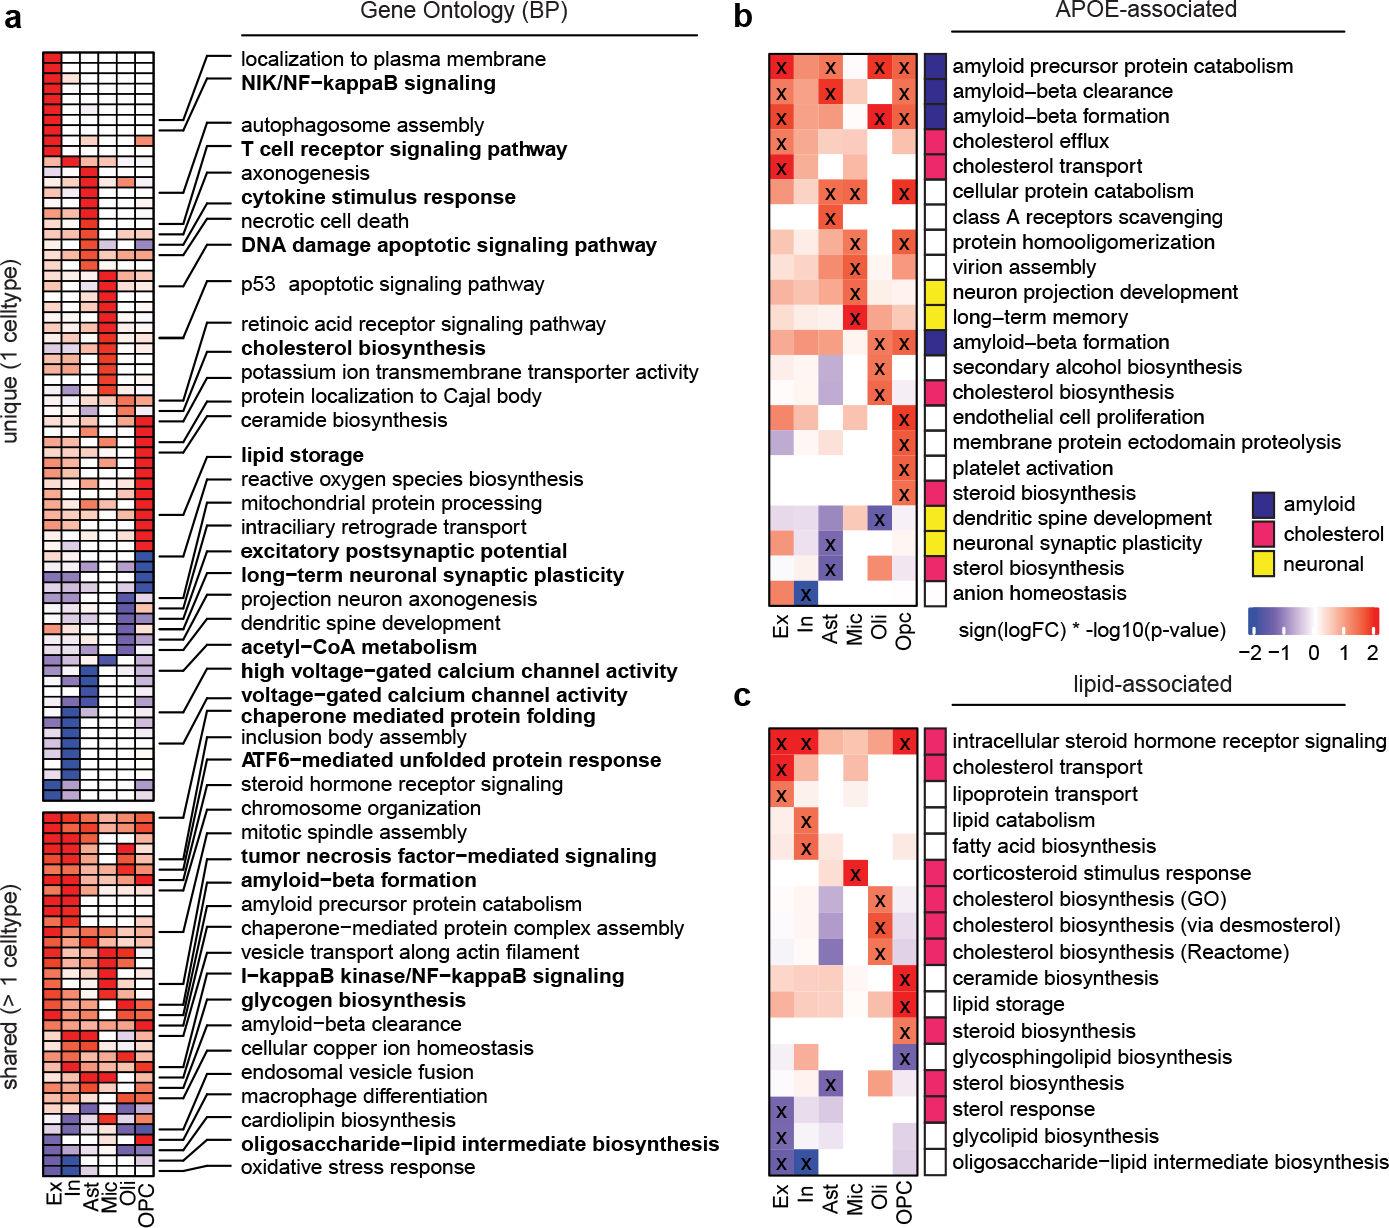
a, Top gene ontology biological processes (BP) with expression changes associated with APOE4 (nominal p-value < 0.05, linear model, APOE3/3 vs APOE3/4 and APOE4/4). Red indicates APOE4 up-regulation and blue down-regulated relative to APOE3. Top 20 pathways in order of p-value. Unique alterations indicate evidence (p-value < 0.05) of pathway alteration in a single cell type. Shared alterations indicate evidence in multiple cell types. b, APOE-associated pathways with expression changes associated with APOE4 (nominal p-value < 0.05, linear model, APOE3/3 vs APOE3/4 and APOE4/4). ‘X’ indicates evidence of alteration (p-value < 0.05). Pathways were manually classified into three categories (color box, right). c, Brain-specific lipid-associated pathways (see Methods) with APOE4-associated expression changes (nominal p-value < 0.05, linear model, APOE3/3 vs APOE3/4 and APOE4/4).
APOE4 dysregulated processes included upregulation of inflammatory and immune-related pathways in several cell types, including NF-кB signaling in excitatory neurons, inhibitory neurons, and OPCs; T cell receptor and cytokine signaling in astrocytes; and tumor necrosis factor-mediated signaling in microglia and excitatory neurons (Fig. 1a). We also observed downregulation of synaptic-related processes, including ion channel activity, excitatory postsynaptic potential, and synaptic plasticity (Fig. 1a). Remarkably, these alterations not only occurred in neurons (e.g., voltage-gated calcium channel activity), but also in oligodendrocytes (e.g., long-term neuronal synaptic plasticity). In APOE4 excitatory neurons, we identified upregulation of ERK1/2 signaling (e.g., MAPK1, MAP2K1, and MAP2K2) and endosomal-related transport genes (e.g., RAB21 and SNX12) (Supplementary Table S4). All these effects are consistent with reported roles of APOE4 in inflammation, synaptic impairment, MAPK1 signaling and downstream APP transcription, and early endosomes7,18. We also identified decreased glycosyltransferase activity (e.g., ALG6, ALG3) in APOE4 neurons and widespread alterations to amyloid-β metabolism genes in excitatory neurons, oligodendrocytes, and OPCs (amyloid-β formation, e.g., BIN1, ROCK1; Fig. 1a). DNA damage response was also altered in APOE4 microglia and OPCs, suggesting APOE4 may promote DNA damage in specific cell types. Altered amyloid-β processing and DNA damage have been associated with APOE4 and AD19–21.
Finally, APOE4 was associated with cellular stress and energy metabolism in multiple cell types. Chaperone-mediated protein folding was increased in most cell types (e.g., DNAJB14, HSPA1A), and ATF-mediated unfolded protein response was increased in neurons and oligodendrocytes. Cholesterol biosynthesis was increased in APOE4 oligodendrocytes (e.g., DHCR24, LBR), lipid storage in OPCs (e.g., PPARA), and glycogen metabolism in microglia and astrocytes (e.g., UGP2, PGM1); while acetyl-CoA metabolism was decreased in astrocytes (e.g., ACAT1, ACSS1; Fig. 1a; Supplementary Table S4). Thus, dysregulation of energy production, transport, or utilization may be central pathogenic mechanisms of APOE4.
Overall, our analysis confirms established APOE4 neurobiology7, reveals novel disturbances, and assigns cell type specificity to known APOE4-associated alterations. Cell type specific molecular atlas of APOE4 pathway-level effects are in Supplementary Tables S4–S6.
APOE4 impacts lipid pathways in the brain
We next performed a targeted pathway analysis focusing on specific molecular pathways likely to be affected by APOE4 by integration of prior literature (Methods). We created a curated database of 193 brain-expressed and APOE-related pathways comprising 8,759 unique genes (Extended Data Fig. 2a). Most pathways exhibited cell type-specific activity, yet a subset was active across all major cell types, suggesting potential for both cell type-specific and broad effects of APOE alterations (Extended Data Fig. 2b). By comparing pathway activity scores of APOE3/4 and APOE4/4 vs APOE3/3, we found APOE4 genotype impacts 22 of the 193 pathways (Fig. 1b; Supplementary Table S5). As expected, associated pathways included amyloid-β and protein processing, lipid metabolism, and synaptic-related processes. However, additional alterations in cholesterol efflux and transport were recovered by this targeted analysis. Given the reported impairment of APOE4’s lipid transport function22, and our finding of associations with lipid metabolism (Fig. 1a,b), we performed a third, more narrowly targeted analysis focusing only on brain-specific lipid-related processes. We reasoned that this could uncover novel molecular processes mediating APOE4 effects. This analysis further prioritized 17 lipid-related processes affected by APOE4, revealing cell type-specific alterations in cholesterol, steroid, phospholipid, glycolipid, fatty acid, and triglyceride metabolism (Fig. 1c; Supplementary Table S6).
APOE4 alters cholesterol in oligodendrocytes
In APOE4 oligodendrocytes canonical enzymes associated with cholesterol biosynthesis (e.g., DHCR24, HMGCS1, SQLE, MVK) were confirmed to be upregulated by differential expression and gene set enrichment analysis (Fig. 1a–c; Extended Data Fig. 2c,d). Our previous single-cell analysis uncovered AD-associated oligodendrocyte subpopulations highlighting a role of myelin-related processes in AD pathogenesis12, consistent with reports of hypomyelination and white matter changes in AD23,24. Given this emerging association, our experimental follow-up focused on investigating the relationship of APOE4 and cholesterol in oligodendrocytes.
APOE4 was associated with increased expression of cholesterol-related genes in oligodendrocytes in a dose-dependent manner (4/4 > 3/4 > 3/3, p-value = 0.01, Pearson’s correlation; Fig. 2a), similar to APOE4’s dose-dependent effect on AD risk suggesting that APOE4 modulation of cholestrol in oligodendrocytes may contribute to AD. However, cholesterol biosynthesis gene expression in APOE3/3 individuals displayed a bimodal trend, with higher expression in AD (Fig. 2a), suggesting potential modulation of cholesterol pathways by AD pathology. To test whether the effects of APOE4 were independent of the effects of AD, we performed pathology-stratified analyses focusing on lipid-associated pathways. Cholesterol biosynthesis gene expression increased in individuals without AD pathology (Extended Data Fig. 2e, f; lipid storage pathways also increased) and a non-significant increase in individuals with AD (Extended Data Fig. 2g), indicating an APOE4 effect independent of AD pathology. AD vs control subjects also exhibited similar increases when controlling for APOE3/3 and APOE3/4 backgrounds, suggesting an effect of AD pathology independent of APOE4 (Extended Data Fig. 2h–j). Notably, the combined effect of APOE4 genotype and AD pathology appeared additive. APOE3/3 subjects with and without pathology exhibited the lowest cholesterol biosynthesis gene expression, and those with both APOE4 and AD pathology the largest (Extended Data Fig. 2k). Together, this suggests APOE4 has a pathology-independent effect on lipid and cholesterol metabolism and that increased cholesterol biosynthesis might be a convergent pathway of both APOE4 and AD pathology.
Fig. 2: APOE4 alters cholesterol homeostasis and localization in human post-mortem oligodendrocytes.
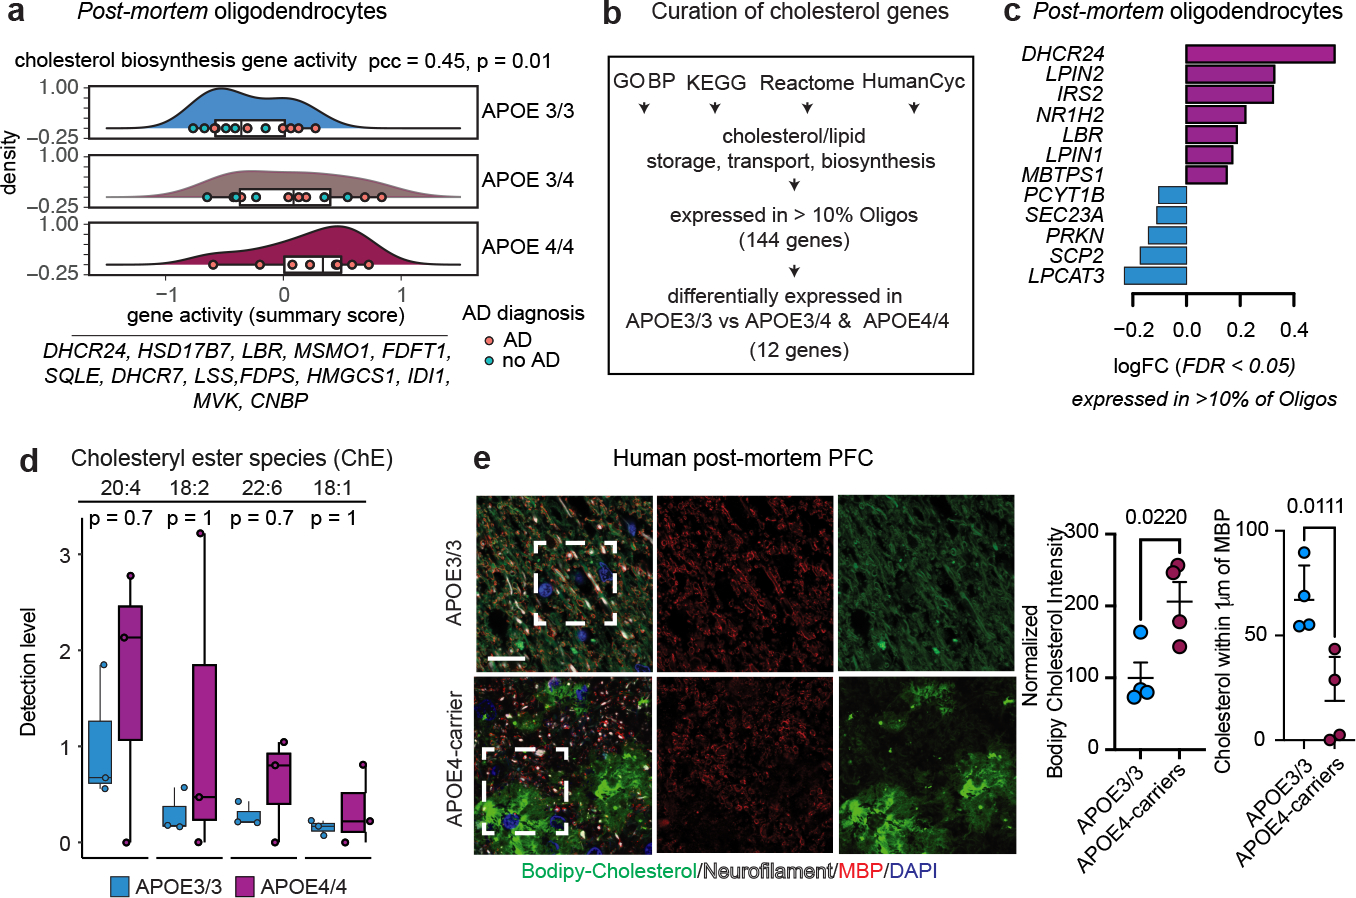
a, Dose-dependent association between APOE4 and cholesterol biosynthesis genes aggregated expression in oligodendrocytes (APOE 4/4 > 3/4 > 3/3, Pearson correlation coefficient (pcc) = 0.45, p-value = 0.01, two-sided). b, Curation process of cholesterol-related genes. Pathway databases were filtered using the terms cholesterol/lipid storage, transport, or synthesis. c, Cholesterol-related genes differentially expressed in APOE3/3 vs APOE3/4 and APOE4/4 post-mortem oligodendrocytes (snRNA-seq data, FDR-adjusted p-value < 0.05, negative binomial mixed model). d, Detection levels of four cholesteryl esters quantified by mass-spectrometry of post-mortem human corpus callosum from APOE3 (APOE3/3, females, n=3) and APOE4-carriers (APOE4/4, females, n=3). Data points represent relative abundance per individual (n=3 individuals per genotype). Numbers in the top label cholesteryl ester species. First number specifies the carboxylate position connecting the fatty acid to the cholesterol hydroxyl group. Second number specifies the frequency of unsaturated fatty acid bonds. Two-sided unadjusted wilcoxon test p-values are shown. Boxplots indicate median, 25th and 75th percentiles. e, Representative images of Bodipy-cholesterol staining and anti-myelin basic protein (MBP) immunoreactivity in prefrontal cortex (BA10) from APOE4-carriers compared to APOE3/3 individuals. Scale bar 10 μm. Cholesterol localization was analyzed across 4 individuals for each APOE genotype. Right panels show total Bodipy-cholesterol signal and percent of Bodipy-cholesterol signal within 1 μm of an MBP-positive axon quantified using Imaris software. Data points represent individuals. Bars depict means, error bars represent standard error of the mean, and p values were calculated with an unpaired two-tailed student’s t-test.
APOE4 raises cholesteryl esters in human brain
Genes associated with cholesterol and lipid synthesis, storage, or transport were differentially expressed in APOE3/4 & APOE4/4 vs APOE3/3 post-mortem oligodendrocytes (FDR<0.05, negative binomial mixed model; Fig. 2b, c). Genes associated with cholesterol biosynthesis and droplet formation (DHCR24, LPIN2, IRS2, NR1H2, LBR, LPIN1, and MBTPS1) were upregulated, while cholesterol transport genes were downregulated (PCYT1B, SEC23A, PRKN, SCP2, and LPCAT3; Fig. 2c). To investigate the abundance of cholesterol species in APOE3/3 and APOE4-carriers, we performed mass-spectrometry-based lipidomic profiling on frozen post-mortem corpus callosum tissue from APOE4/4 (all female; n = 3) and APOE3/3 (all female; n = 3) individuals. Four species of cholesteryl esters, a form of cholesterol associated with storage in lipid droplets, were detected in the human corpus callosum (20:4, 18:2, 22:6, and 18:1; Fig. 2d). Corpus callosum from APOE4/4 individuals exhibited a trend toward higher levels of all four detected cholesteryl ester species relative to non-carriers (APOE3/3, all female, p-value ≥0.7), suggesting that cholesteryl ester may be elevated in APOE4 brain tissue.
We further analyzed a separate lipidomic dataset generated from the prefrontal cortex of 314 individuals, including APOE3/3 and APOE4 subjects with and without AD pathology. Although this larger dataset was not designed to specifically measure cholesterol species, we detected evidence of increased cholesteryl ester species (CH18:1) in APOE4-carriers (15, APOE3/4 and APOE4/4 males and females) vs non-carriers (105, APOE3/3 males and females) in the absence of AD pathology (p-value = 0.046, Wilcoxon rank-sum test) (Extended Data Fig. 3a–d). While additional well-powered lipidomic analyses designed to quantify cholesteryl esters in post-mortem tissue are needed, these further support an association between APOE4 and brain cholesterol potentially indicating increased cholesterol storage in lipid droplets (Supplementary Tables S7 and S8).
We find that APOE4-carriers have decreased localization of cholesterol along neurofilaments and increased intracellular accumulation or storage of cholesterol as compared to brains from age-matched APOE3/3 individuals. We stained post-mortem prefrontal cortex samples from individuals with late-stage AD that are APOE4-carriers (APOE3/4; n=4) and non-carriers (APOE3/3; n = 7) with Bodipy-cholesterol and antibodies against the lipid droplet-associated protein, PLIN1. Bodipy-cholesterol and PLIN1 staining exhibited a high degree of overlap, indicating accumulation of Bodipy-cholesterol in lipid droplets (Extended Data Fig. 4a). Punctate, perinuclear PLIN1 stained lipid droplets appeared in both APOE3/3 and APOE3/4 tissue; staining was more prominent around distinct nuclei in APOE4-carriers (Extended Data Fig. 4a). In APOE3/3 PFC tissue, Bodipy-cholesterol staining was instead most intense along neurofilament tracts, where it formed ribbon-like staining patterns adjacent to neurofilament and MBP staining (Fig. 2e). In the white matter tracts from APOE3/3 PFCs, 59% of Bodipy-cholesterol was within 1 μm of neurofilament staining (Fig. 2e). In APOE4-carriers, the localization of Bodipy-cholesterol along neurofilaments significantly (p = 0.0106) decreased from 58% to only 19% of the total signal (Fig. 2e). APOE4-carriers also exhibited a significantly (p-value = 0.0220) higher mean intensity of Bodipy-cholesterol staining across multiple PFC sections, indicating an increase in overall cholesterol (Fig. 2e). To further corroborate altered localization of cholesterol, we performed transmission electron microscopy (TEM) on corpus callosum from six-month-old APOE3/3 and APOE4/4 targeted-replacement (APOE-TR) mice, quantifying the number of lipid droplets per μm2 surface area. APOE4/4-TR mice had a significantly (p-value = 0.0048) increased density of small lipid droplet-like structures in the corpus callosum compared to age-matched APOE3/3-TR mice (Extended Data Fig. 4b), suggesting APOE4 brains have increased lipid and cholesterol storage.
Our single-nucleus transcriptomic analysis revealed altered cholesterol biosynthesis, storage, and transport in APOE4 oligodendrocytes and, to a lesser extent, in microglia and astrocytes (Fig. 1a–c). To determine whether these cell types contributed to the observed differences in cholesterol accumulation, we co-stained PFC white matter tissue from APOE4-carriers with Bodipy-cholesterol and cell-type-specific markers for oligodendrocytes (OLIG2), astrocytes (GFAP), and microglia (IBA1). IBA1-positive microglia and GFAP-positive astrocytes exhibited minimal (< 15% of cells) Bodipy-cholesterol accumulation (Extended Data Fig. 4c). In contrast, the area within a 2 μm radius of OLIG2-positive nuclei exhibited significantly (p < 0.0001) more Bodipy-cholesterol staining, with 77% of OLIG2-positive nuclei surrounded by intense Bodipy-cholesterol signal, suggesting that cholesterol may aberrantly accumulate in APOE4 oligodendrocytes (Extended Data Fig. 4c). PLIN1 immunoreactivity around OLIG2-positive nuclei in APOE3/4 human PFC from AD individuals also exhibited a minimal but non-significant increase compared to APOE3/3 (p = 0.1521, n = 3 per genotype) (Extended Data Fig. 4d, e). These findings indicate that cholesterol accumulates in APOE4 oligodendrocytes.
APOE4 impacts cellular storage of cholesterol
Genetic diversity may confound the effects of APOE4 observed on human post-mortem brain tissue. Therefore, we employed isogenic APOE3/3 and APOE4/4 induced pluripotent stem cells (iPSC) generated by CRISPR-dCas9 editing14. Briefly, an iPSC line from a cognitively normal APOE3/3 individual was edited to APOE4/4 homozygous. Using a reciprocal strategy, an iPSC line from an APOE4/4 AD patient was also edited to APOE3/3. These isogenic iPSC sets were simultaneously differentiated into oligodendroglia using established protocols (see Methods). Similar to human post-mortem oligodendrocytes, iPSC-derived oligodendroglia transcribed mRNAs and expressed proteins specific to oligodendrocytes, including MOG, MBP, PLP1, PLLP, and MYRF (Extended Data Fig. 5a, b). Following completion of the differentiation protocol, 65–81% of cells were immunoreactive for MBP and 69–82% were immunoreactive for PLP1 across cultures (Extended Data Fig. 5c). To further validate iPSC-derived oligodendroglia, gene expression was compared to pseudo-bulk signatures of major cell types from post-mortem snRNA human brain. Principal component analysis confirmed that iPSC-derived oligodendroglia cluster with post-mortem human oligodendrocytes, and oligodendrocyte precursor cells (OPCs; Extended Data Fig. 5d; Supplementary Table S9), and pairwise comparison of cells identified iPSC-derived oligodendroglia have the most similarity to OPCs and oligodendrocytes (Extended Data Fig. 5e; Supplementary Table S9). Similar to in vivo human oligodendrocytes, iPSC-derived oligodendroglia exhibited robust upregulation of myelin- (Extended Data Fig. 5f) and cholesterol-associated genes (Extended Data Fig. 5g, h; Supplementary Table S9–10). APOE mRNA and protein were expressed at low to moderate levels in iPSC-derived oligodendroglia, with no significant (p = 0.2635) difference between isogenic APOE3/3 and APOE4/4 iPSC-derived oligodendroglia (Extended Data Fig. 5i, j). Post-mortem oligodendrocytes had low but detectable APOE expression, consistent with previous single-cell resolution reports25 (Extended Data Fig. 5k, l). This demonstrates that iPSC-derived oligodendroglia are transcriptionally similar to ex vivo human oligodendrocytes and OPCs, providing a reliable proxy for investigating the effect of APOE4 on human oligodendrocytes.
Mass-spectrometry-based lipidomic profiling of APOE3/3 and APOE4/4 isogenic iPSC-derived oligodendroglia detected 88 lipid species increased (adjusted p-value < 0.05) in APOE4/4 oligodendroglia compared to APOE3/3 controls, and only one species decreased (Fig. 3a; Extended Data Fig. 6; Supplementary table S11). In agreement with the lipidomic analysis of post-mortem human brain, cholesteryl esters were the most abundantly altered lipid class, with 15 species increased in APOE4/4 oligodendroglia compared to APOE3/3 (adjusted p-value < 0.05; Fig. 3a). We also observed changes to phosphatidic acids, diglycerides, triglycerides, and phosphatidylcholines; suggesting that APOE4/4 broadly alters cellular lipid composition. Notably, di- and triglycerides are major components of lipid droplets, suggesting an increase in lipid droplet biosynthesis in APOE4/4 oligodendrocytes. We also observed an increase in lysophosphatidylcholine (LPC) and its derivative lysophosphatidic acid (LPA), two lipid classes known to promote brain inflammation and demyelination (Extended Data Fig. 6; Supplementary Table S11)26. SOAT1, the enzymes responsible for cholesterol esterification, was differentially expressed in isogenic APOE4/4 versus APOE3/3 oligodendroglia (Extended Data Fig. 7a). SOAT2 was not detected in iPSC-derived oligodendroglia for either genotype. Likewise, CYP46A1, a hydroxylation enzyme that facilitates brain cholesterol trafficking and clearance, was downregulated in APOE4/4 compared to APOE3/3 oligodendroglia (Extended Data Fig. 7a; Supplementary Table S12), suggesting that cholesterol membrane trafficking in APOE4/4 oligodendroglia may be reduced.
Fig. 3: APOE4 alters cholesterol homeostasis and localization in iPSC-derived oligodendrocytes.
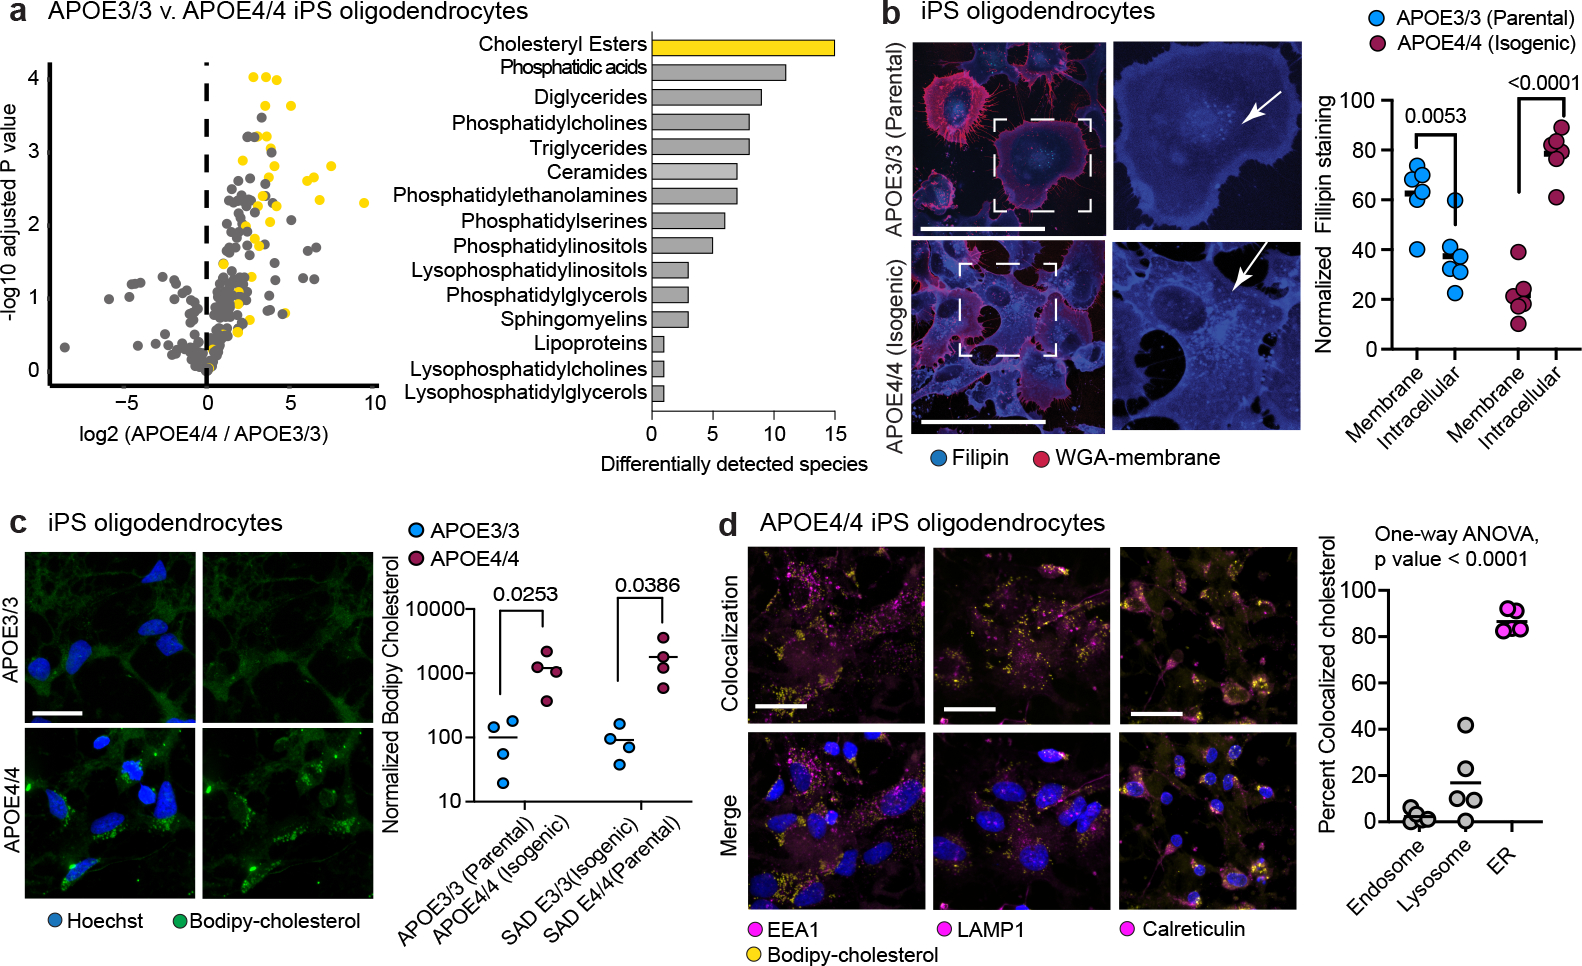
a, Detected lipid-species concentrations from mass spectrometry-based lipidomic profiling of iPSC-derived APOE3/3 and APOE4/4 oligodendroglia. Cholesteryl ester species are highlighted in yellow. Barplot depicts the number of differentially (adjusted p value < 0.05) detected lipid species for each lipid class. Cholesteryl esters are the most frequently differentially detected class, with 15 species upregulated in APOE4 oligodendroglia. b, Representative images of Filipin (cholesterol) and WGA-membrane staining in APOE3/3 and APOE4/4 iPSC-derived oligodendroglia. Arrows highlight altered cholesterol localization in APOE4/4 iPSC-derived oligodendroglia. Filipin intensity was quantified for the cell membrane (localized with WGA) and intracellular compartment (between membrane and nucleus; n=6 replicates from independent experiments), scale bar represents 50 μm. Bars represent means from independent biological replicates, p values were calculated with an unpaired two-tailed student’s t-test. c, Representative images of APOE3/3 and APOE4/4 iPSC-derived oligodendroglia. Bodipy-cholesterol stained oligodendroglia. Bars represent means from independent biological replicates (n=4 per genotype), and p values were calculated with an unpaired two-tailed student’s t-test, scale bar represents 24 μm. d, Representative images of APOE4/4 iPSC-oligodendroglia following addition of 1 μg/ml Bodipy-cholesterol to cell culture media of live cells, for two hours. Cells were counterstained for markers of the endosome (EEA1), lysosome (LAMP1), and endoplasmic reticulum (Calreticulin). The percentage of Bodipy-cholesterol particles overlapping with EEA1, (n = 5), LAMP1 (n = 5), or Calreticulin (n = 4) immunoreactivity was quantified using Imaris software. Scale bar represents 24 μm. Bars represent means, data points represent independent biological replicates, P-values were calculated with a one-way ANOVA.
To further characterize APOE4-mediated differences in cholesterol storage, we stained isogenic APOE3/3 and APOE4/4 oligodendroglia with the cholesterol dye filipin, Bodipy-cholesterol, and lipid-droplet associated PLIN1. In APOE3/3 oligodendroglia, the majority (63 ± 12%) of filipin staining accumulated around the membrane, co-localizing with WGA-membrane stain (Fig. 3b). The remaining filipin signal (37 ± 13%) accumulated intracellularly in APOE3/3 oligodendroglia (Fig. 3b). Isogenic APOE4/4 oligodendroglia exhibited the opposite staining pattern, with 79% of filipin staining appearing intracellular and 22% localized to the membrane (Fig. 3b). To assess cholesterol uptake and intracellular trafficking, we added fluorescent Bodipy-cholesterol to oligodendroglia cell culture media. Similar to the post-mortem human brain, Bodipy-cholesterol staining co-localized with PLIN1 immunoreactive areas (Extended Data Fig. 7b). APOE4/4 oligodendroglia exhibited approximately 10-fold higher Bodipy-cholesterol staining (p = 0.0253 and 0.0386) than isogenic APOE3/3 controls across two isogenic sets generated from different individuals (Fig. 3c). Both sets of APOE4/4 oligodendroglia also contained more Bodipy droplets per cell (p = 0.0345 and 0.027) than APOE3/3 controls, suggesting an increased number of lipid droplets in APOE4/4 (Extended Data Fig. 7c). APOE4 oligodendroglia exhibited significantly (p = 0.0069) more Bodipy-cholesterol co-localized with Lysotracker-Red staining than APOE3/3, suggesting lysosomal accumulation of cholesterol in APOE4 oligodendroglia (Extended Data Fig. 7d). However, the increased bodipy-cholesterol in APOE4 oligodendroglia was not entirely localized to lysosome, suggesting cholesterol may be accumulating in other organelles. These results demonstrate APOE4 oligodendroglia have increased intracellular cholesterol storage, confirming and extending results seen in post-mortem human PFC.
Cholesterol localizes in ER causing stress
Accumulation of lipid droplets is a common hallmark of ER stress27,28. Post-mortem human APOE4/4 oligodendrocytes exhibited upregulation of the ATF6-mediated ER stress pathways compared to APOE3/3 controls with increased expression of multiple heat-shock proteins and of ATF6, a key regulator of the unfolded protein response. (Extended Data Fig. 7e; Supplementary Table S4). Immunohistochemistry against ATF6 showed increased nuclear ATF6 in APOE4/4 oligodendroglia compared to isogenic APOE3/3 controls (Extended Data Fig. 7f). Likewise, genes associated with unfolded protein response (CALR, HSP90B1, and HSPA5) were upregulated in APOE4/4 oligodendroglia compared to APOE3/3 isogenic controls (Extended Data Fig. 7g). Concurrently, genes associated with ER cholesterol transport (PCYT1B, SEC23A, SCP2, and LPCAT3) were downregulated in APOE4/4 oligodendrocytes (Fig. 2c), suggesting ER stress and impaired cholesterol transport could have a central role in the observed intracellular cholesterol accumulation. To examine this possibility, we added Bodipy-cholesterol to the media of iPSC-derived APOE4/4 oligodendroglia and counter-stained for canonical markers of the endosome (EEA1), lysosome (LAMP1), and ER (Calreticulin). Approximately ~2% of Bodipy-cholesterol particles localized to the endosome, ~18% to the lysosome, and ~80% to the ER, indicating that the majority of intracellular cholesterol accumulating in APOE4/4 oligodendroglia is retained in the ER (Fig. 3d). Together, these results demonstrate that APOE4 is associated with reduced localization of cholesterol in the plasma membrane of oligodendrocytes, increased cholesteryl esters and lipid droplets, and upregulation of ATF6-mediated ER stress response.
Cholesterol and APOE4 impact myelination
Oligodendrocytes myelinate the central nervous system and the bioavailability of cholesterol is rate-limiting for the formation and maintenance of myelin29. We reasoned that altered cholesterol localization and homeostasis in APOE4 oligodendrocytes may impair myelination. Compared to APOE3/3, APOE3/4 and APOE4/4 post-mortem human oligodendrocytes exhibited downregulation of myelin-associated genes (PLLP, MYRF, MAG, OPALIN, MOG, and PLP1; Fig. 4a, Supplementary Table S13). This pattern persisted in cells from individuals without AD pathology, suggesting that these myelin-associated genes may be influenced by APOE genotype and not confounded by pathology (Extended Data Fig. 8a; Supplementary Table S13). Decreased myelin-associated gene expression occurred concomitantly with increased expression of genes associated with cholesterol homeostasis, including MVK, FDPS, ABCG1, IDI1, LDLR, INSIG1, SREBF2, SQLE, DHCR7, DHCR24, FDFT1, and LSS (Fig. 4a).
Figure 4: APOE4 leads to impaired myelination in mice and humans.
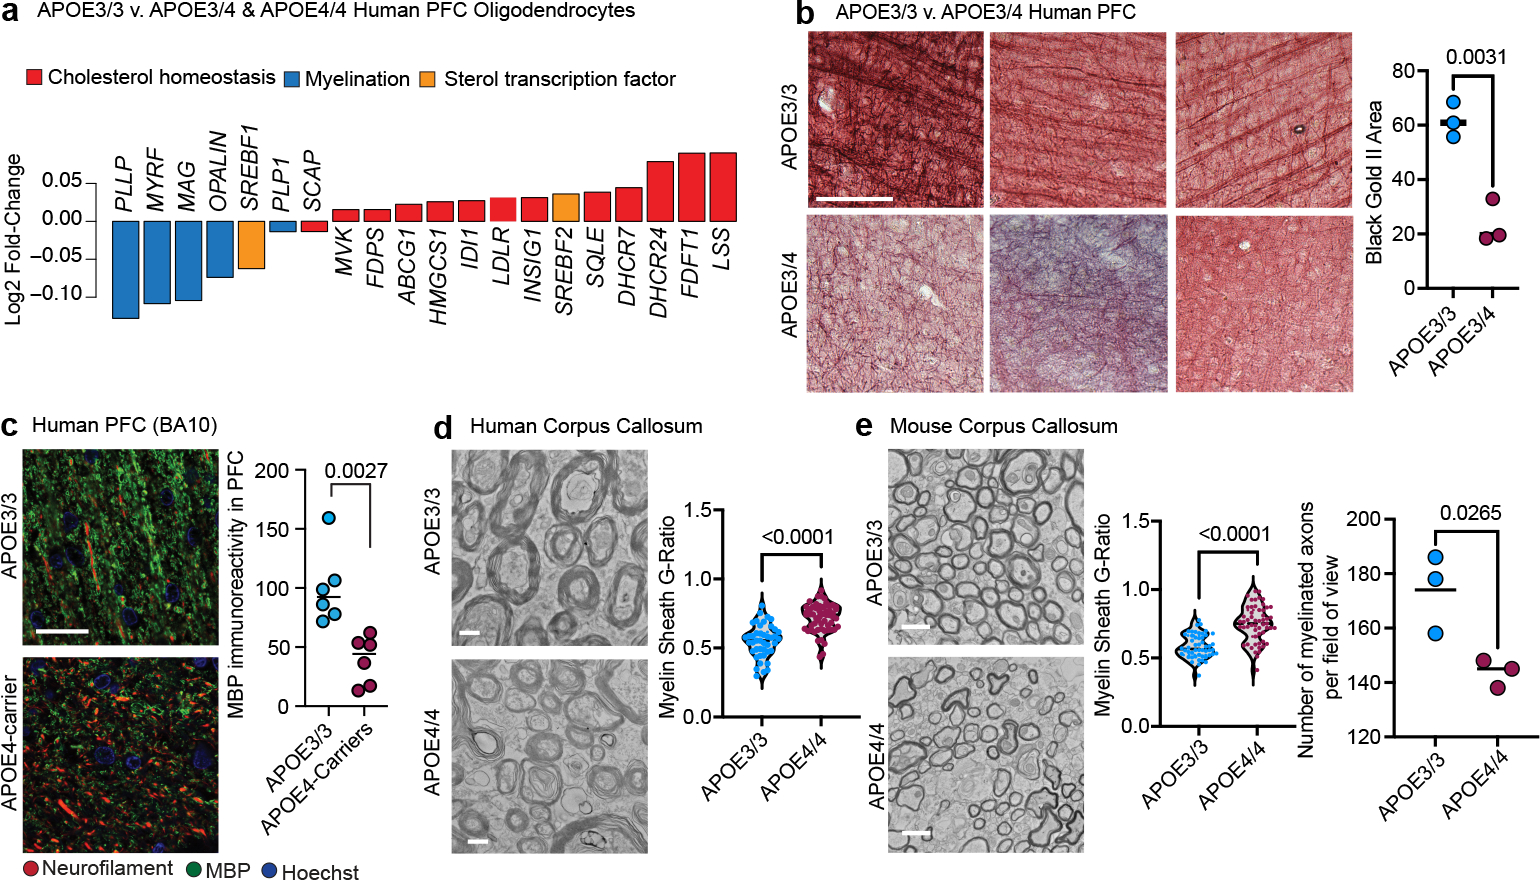
a, Log2(mean gene expression in APOE3/4 & APOE4/4 / mean gene expression in APOE3/3) for differentially expressed (p-adj < 0.05, Wilcoxon test computed by wilcoxauc(); see methods) myelin-associated or cholesterol-associated genes in human post-mortem oligodendrocytes. b, Black Gold II staining of myelinated axons in the PFC (BA10) of APOE3/3 and APOE3/4 individuals (n=3 individuals/genotype). Area positive for Black Gold II staining was quantified using ImageJ, with same intensity thresholds for each image and group. Scale bar represents 250 μm. Data points represent individuals, bars represent mean per genotype, p values were calculated with an unpaired two-tailed student’s t-test. c, MBP and neurofilament (SMI311) immunoreactivity in prefrontal cortex (BA10) from APOE4-carriers and non-carriers (n=6 individuals/genotype). Area positive for MBP and Neurofilament were quantified using FIJI ImageJ with same intensity thresholds for each image and group. Three images were quantified for each individual. Data points represent individuals mean values, bars represent means per genotype, p values were calculated with an unpaired two-tailed student’s t-test. d, TEM on sections from human corpus callosum of APOE4-carriers (n=3 individuals, n= 58 axons) and APOE3/3 (n=3 individuals, n = 44 axons). Scale bar represents 500 μm. G-ratio was calculated with ImageJ, measuring inner axonal diameter divided by the diameter of outer myelin band. Data points represent axons, p values were calculated with an Wilcoxon test. e, TEM on corpus callosum from APOE3/3 (n=3) and APOE4/4 (n=3) TR mice at 6 months of age. G-ratio was quantified using ImageJ as stated in d). Scale bar represents 500 μm. Data points represent axons, p values were calculated with a Wilcoxon test. Number of myelinated axons per image was counted with Cell Counter tool (ImageJ). Data points represent average per animal, bars represent mean per genotype, p values were calculated with an unpaired two-tailed student’s t-test.
To examine whether reduced myelin-associated gene expression in APOE4-carriers translated to decreased myelin, we used Black Gold II staining to visualize myelinated axons in post-mortem human prefrontal cortex tissue from APOE3/4 (n=3) compared to APOE3/3 (n=3) individuals. APOE3/3 human PFC showed multiple dense, parallel, axonal tracks suggestive of robust levels of myelination (Fig. 4b). In contrast, PFC from APOE3/4 had a significant (p = 0.0031) reduction in the area positive for Black Gold II staining, and axonal fasciculation was largely absent, suggesting a decrease in axonal myelination (Fig. 4b). To further compare myelination between APOE4-carriers and APOE3/3 individuals, we immunostained PFC tissue with two different anti-MBP antibodies using two separate cohorts of post-mortem human tissue. In APOE3/3-carriers, MBP staining was robust and closely associated with neurofilaments that largely formed parallel tracts of axons (Fig. 4c and Extended Fig. 8b). In contrast, PFC white matter regions from APOE4-carriers exhibited significantly (p = 0.0027, p = 0.0294) decreased MBP immunoreactivity as compared to APOE3/3 non-carriers, with fewer MBP regions surrounding neurofilament-positive axons (Fig. 4c and Extended Data Fig. 8b). Together, these results suggest reduced myelin levels in human brains of APOE4-carriers.
To assess ultrastructural myelin differences and integrity, we performed TEM on human post-mortem corpus callosum samples from APOE4/4 (n=3, mean age 77 ± 7 years, males, mean PMI 24 ± 15 hours) and APOE3/3 (n=3, mean age 86 ± 2 years, males and females, mean PMI 29 ± 8 hours) individuals with AD pathology. APOE4/4 individuals had reduced levels of axonal myelination relative to APOE3/3, as indicated by fewer and thinner dark-electron dense bands encircling neuronal axons (Fig. 4d). To quantify relative myelin levels per axon, we calculated the g-ratio (the inner axonal diameter divided by the outer diameter with myelin sheath) for 150 neurons per condition. APOE4-carriers had higher g-ratios (p < 0.0001), suggesting that corpus callosum from aged APOE4/4 individuals contains fewer myelinated axons and thinner overall myelin sheaths compared to APOE3/3 individuals (Fig. 4d).
To control for covariates inherent to post-mortem human samples, we also quantified myelin levels in inbred APOE-TR mice (9 months old, male and female mice; n = 4 per genotype). The hippocampus from APOE4/4-TR mice exhibited less MBP immunoreactivity (p = 0.044), suggesting reduced myelin levels compared to APOE3/3-TR mice (Extended Data Fig. 8c). Western blotting of lysates prepared from mouse cortex revealed reduced total MBP protein levels (p = 0.0112) in APOE4/4-TR mice compared to APOE3/3-TR control mice (Extended Data Fig. 8d). TEM on corpus callosum from 6-month-old APOE3/3-TR mice showed densely packed myelinated axons, with an average of 170 myelinated axons per field of view. APOE4/4-TR mice had fewer myelinated axons (p = 0.0265, 140 myelinated axons in average per field of view, n=3 mice), and higher g-ratios compared to APOE3/3-TR mice (p < 0.0001; Fig. 4e). To investigate whether reduced myelination in APOE4/4-TR mice is an age-related phenotype, we performed TEM analysis on young two-month-old mice. Similar to six-month-old mice, two-month-old APOE3/3-TR mice exhibited densely packed myelinated axons, whereas two-month-old APOE4/4-TR mice exhibited a more heterogeneous and sparse distribution of myelinated axons, reflected by an increased g-ratio (Extended Data Fig. 8e). Together, these findings suggest that APOE4/4-TR mice have a reduced number of myelinated axons and thinner myelin sheaths than APOE3/3-TR mice, a phenotype that may precede age-related neurodegeneration.
A key question is whether APOE4 expression in oligodendrocytes is sufficient to decrease myelination or requires the involvement of additional cells and/or factors. To investigate this, we employed an in vitro myelination assay using isogenic iPSC-derived oligodendroglia co-cultured with NGN2-induced neurons derived from the same iPSCs (iNeurons) in a three-dimensional extracellular matrix that allows cells to interact with each other and self-assemble into tissue-like structures (Extended Data Fig. 9a). After two weeks in these 3D co-cultures, MBP-positive oligodendroglia spread and engaged neurofilament-positive axons (Extended Data Fig. 9b). After six weeks in culture, myelin-associated proteins O4 and MBP encircled neurofilaments, mimicking biological processes critical to myelination (Extended Data Fig. 9c). GFP-labeled oligodendroglia cells aligned with neurofilament-positive axons in co-cultures containing iNeurons (Extended Data Fig. 9d). High-magnification imaging confirmed that the cells surrounding neurofilaments were positive for MBP (Extended Data Fig. 9e, Supplemental Video 1), and transmission electron microscopy (TEM) showed axonal segments surrounded by electron-dense membrane rings at a low frequency, suggesting the presence of myelinated axons (Extended Data Fig. 9f). Given that these co-cultures exhibit key components of myelination, such as axonal engagement and canonical marker expression, we sought to use this model to assess the effect of APOE4 on myelin-associated phenotypes in human cells.
We established oligodendroglia/iNeuron co-cultures from two different APOE4/4 and APOE3/3 isogenic sets of iPSC-derived cells. MBP-immunoreactive areas sporadically appeared after three weeks in APOE3/3 co-cultures (Extended Data Fig. 9g). After six weeks, both APOE3/3 and APOE4/4 co-cultures contained similar (p > 0.9999) levels of neurofilament positive signal, indicating a similar number of axons (Extended Data Fig. 9h). APOE3/3 co-cultures exhibited robust MBP immunostaining with approximately 60% of MBP signal surrounding (within 1 μm) neurofilament-positive axons (Fig. 5a). However, both sets of isogenic APOE4/4 co-cultures exhibited significantly (p = 0.0003 and 0.0193) less (< 20%) MBP staining localized with neurofilament, suggesting that APOE4/4 oligodendrocytes were producing less MBP and engaging less with neuronal processes than isogenic APOE3/3 co-cultures (Fig. 5a).
Figure 5: iPSC-derived APOE4 oligodendroglia exhibit myelination deficits in neuronal co-cultures.
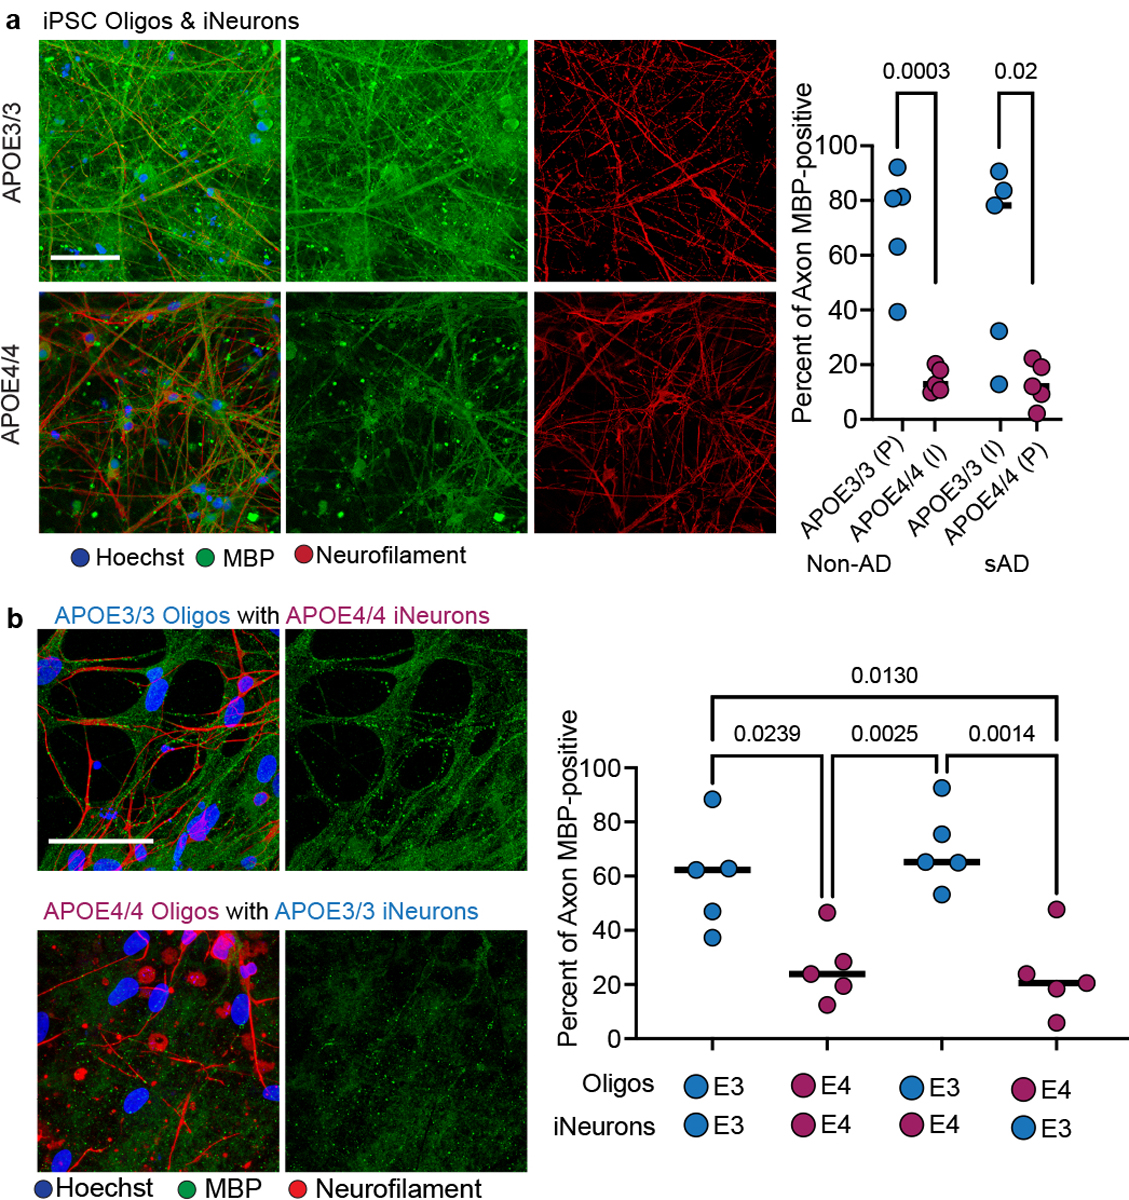
a, Representative co-culture images of isogenic iPSC-derived APOE4/4 and APOE3/3 oligodendroglia and NGN2-induced neurons after six weeks of culture (n = 5 biological replicates). Scale bar represents 50 μm. Co-cultures were prepared using two different isogenic iPSC sets created with reciprocal editing strategies from different individuals. MBP immunoreactivity localized within 1 μm of Neurofilament immunoreactivity was quantified using Imaris. Data points represent mean values (n = 4 images, independent biological replicates). Bars represent group mean values, p values were calculated with an unpaired two-tailed student’s t-test. b, Genetic “mix and match” experiment where oligodendrocytes and neurons were co-cultured under four permutations (Oligodendroglia with iNeuron): APOE3/3 with APOE3/3, APOE3/3 with APOE4/4, APOE4/4 with APOE4/4, and APOE4/4 with APOE3/3 (n=5 biological replicates). Percent of MBP immunoreactivity localized within 1 μm of neurofilament staining was quantified using Imaris. Representative MBP, neurofilament, and Hoechst staining images. Scale bar represents 50 μm. Data points represent the mean (n=4 four images, independent experiments). Axonal MBP quantified using ImageJ, same thresholding settings for each image and group (p values were calculated using a one-way ANOVA, Bonferroni correction).
The reduction in myelination associated with APOE4 could arise from autonomous defects in oligodendrocytes, or from more complex mechanisms involving paracrine signaling from neurons and other cell types. To gain insight into the cell type-specific mechanisms of APOE4 on myelination, we performed a combinatorial experiment in which we co-cultured APOE4/4 oligodendroglia with APOE3/3 iNeurons and vice versa. APOE3/3 oligodendroglia co-cultured with isogenic APOE4/4 iNeurons exhibited a similar (p > 0.99) level of MBP staining localizing to neurofilaments as all-APOE3/3 co-cultures, suggesting that APOE4/4 neurons do not impair the ability of APOE3/3 oligodendroglia to produce MBP or engage neuronal axons (Fig. 5b). In contrast, APOE4/4 oligodendroglia co-cultured with APOE3/3 iNeurons exhibited significantly (p = 0.0130) reduced MBP staining that localized with neurofilament staining (Fig. 5b). The levels of MBP surrounding neurofilament in APOE4/4 oligodendroglia co-cultured with APOE3 iNeurons were similar (p > 0.9999) to all-APOE4/4 co-cultures, with only ~20% of neurofilament-positive axons surrounded by MBP staining (Fig. 5b). This suggests that APOE4 in oligodendroglia is sufficient to impair the ability of oligodendroglia to produce MBP and engage neuronal axons, processes critical for myelination. Consistent with lower MBP protein expression in APOE4 post-mortem oligodendrocytes (Extended Data Fig. 8b), APOE4/4 iPSC-derived oligodendroglia monocultures also exhibited significantly lower MBP immunoreactivity compared to isogenic APOE3/3 (Extended Data Fig. 9i).
Given that APOE is detectable in both APOE3/3 and APOE4/4 iPSC-oligodendroglia cultures at similar levels (Extended Data Fig. 5i, j), we reasoned that decreased myelination is likely the result of impaired protein function. To test whether APOE4 myelination defects are also observed in cells lacking APOE, we generated an APOE knock-out iPSC line (APOE−/−), and differentiated oligodendroglia and iNeurons. We then created co-cultures of APOE−/− of oligodendroglia and iNeurons and compared myelination after six weeks in culture to APOE3/3 and APOE4/4 iNeuron/oligodendroglia co-cultures. MBP immunoreactivity and axonal localization in the APOE−/− co-cultures were significantly (p = 0.0005) lower than APOE3/3 co-cultures and were similar to APOE4/4 co-cultures (Extended Data Fig. 9j). To test whether the addition of APOE3 protein could rescue the myelination phenotype, we added recombinant APOE3 protein (rAPOE3) to APOE4/4 iNeuron/oligodendroglia co-cultures for six weeks. The addition of rAPOE3 increased MBP expression and localization in APOE4/4 cultures to similar (p = 0.4545) levels as APOE3/3 co-cultures (Extended Data Fig. 9j). Therefore, myelination defects are observed in APOE4/4 and APOE−/− oligodendrocytes and can be rescued with the addition of APOE3 protein. Taken together, these results suggest that APOE4’s impaired ability to transport cholesterol may reduce myelination.
Aiding cholesterol transport increases myelin
APOE4 expression in oligodendrocytes promotes both cholesterol accumulation and impaired myelination. Therefore, we reasoned that inhibiting cholesterol biosynthesis and/or facilitating cholesterol transport in APOE4/4 oligodendrocytes may reduce intracellular accumulation and improve myelination. To test this hypothesis, we employed small molecules that inhibit cholesterol biosynthesis (simvastatin and atorvastatin) or facilitate cholesterol transport (2-hydroxypropyl-β-cyclodextrin; cyclodextrin). Cyclodextrin is a molecule known to reduce intracellular cholesterol accumulation in Niemann-Pick disease type C30. APOE4/4 iPSC-derived oligodendroglia were treated with each drug for two weeks, and intracellular cholesterol was subsequently quantified with Bodipy-cholesterol staining. APOE4/4 oligodendroglia cultured in the presence of cholesterol biosynthesis inhibitors (either simvastatin or atorvastatin) exhibited more Bodipy-cholesterol staining than APOE3/3 oligodendroglia (p = 0.0085 and 0.0450) (Fig. 6a). However, APOE4/4 oligodendroglia treated with cyclodextrin exhibited reduced bodipy-cholesterol staining not significantly different (p > 0.99) from that in APOE3/3 oligodendroglia (Fig. 6a). In cyclodextrin-treated APOE4/4 oligodendroglia, we observed a significant (p = 0.0092) reduction in the number of intracellular droplets of Bodipy-cholesterol, as well as a significant (p < 0.0001) reduction of neutral lipid droplets stained with Bodipy. This suggests that cyclodextrin reduced both intracellular cholesterol and accumulation of neutral lipids such as triacylglycerides (Fig. 6b and Extended Data Fig. 10a).
Figure 6: Cyclodextrin improves myelination and learning and memory in aged APOE4 mice.
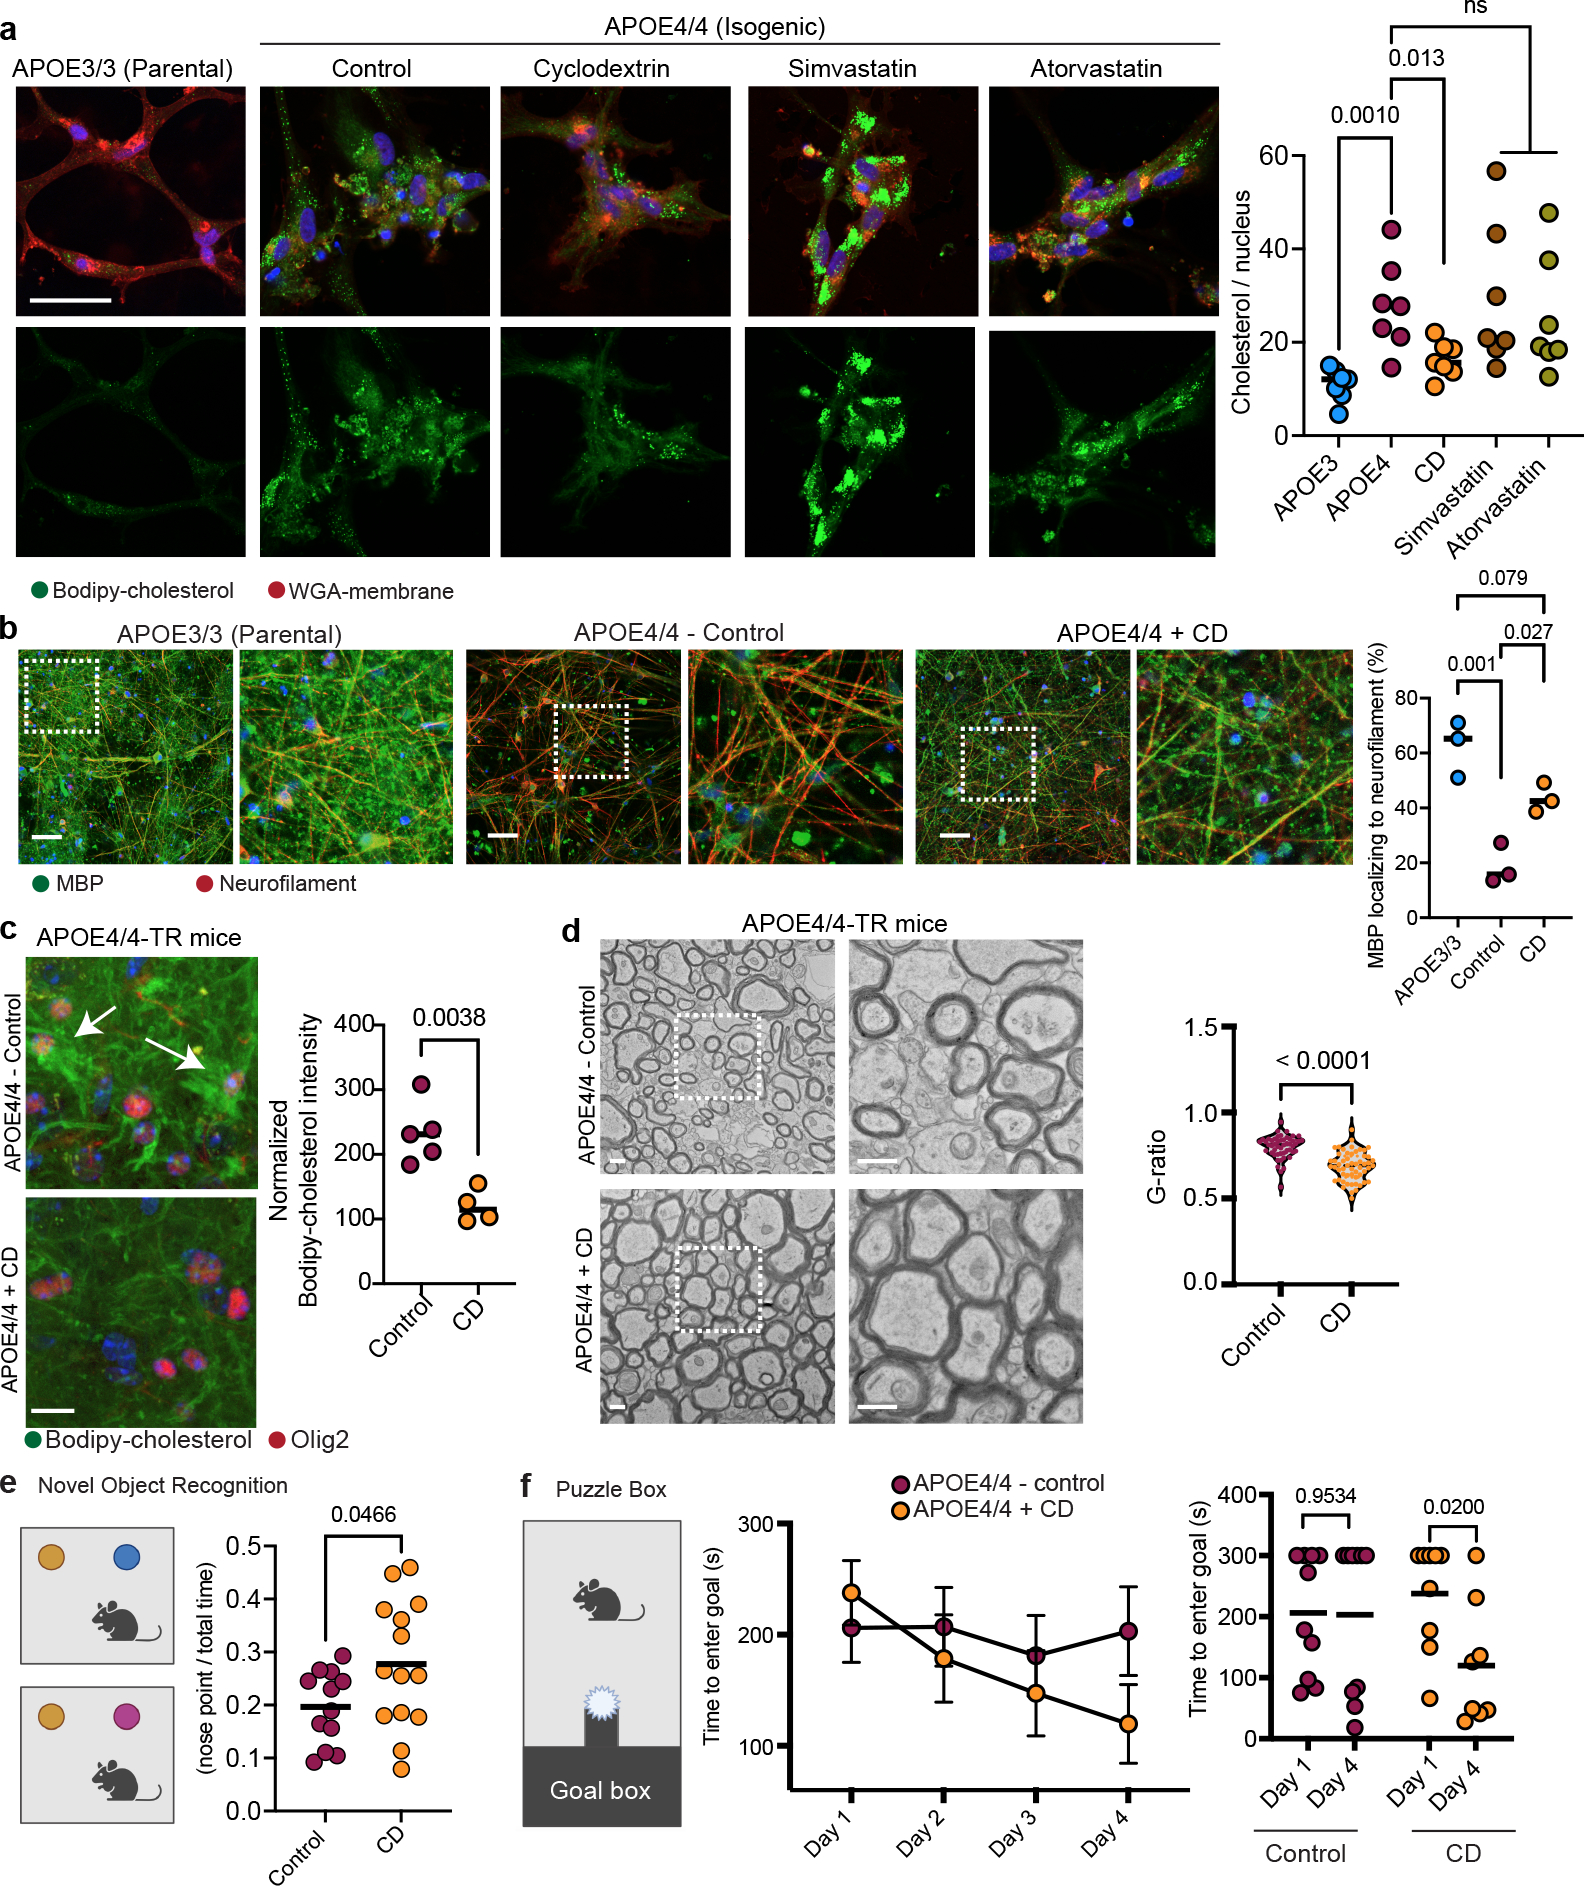
a, Representative Bodipy-cholesterol images of APOE4/4 iPSC-derived oligodendroglia treated with cyclodextrin (1 mM), simvastatin (1 μM), or atorvastatin (1μM). Scale bar represents 50 μm. Bodipy-cholesterol positive punctae normalized to the number of nuclei. Bars represent means (n=7 biological replicates; p values were calculated using a one-way ANOVA, Bonferroni correction). b, MBP and neurofilament staining of cyclodextrin-treated co-cultures of iPSC-derived APOE4/4 oligodendroglia and neurons versus APOE3/3 co-cultures. Scale bar represents 10 μm. Axonal MBP expression was quantified using Imaris. Bars represent means (n= 3 biological replicates; p values were calculated using a one-way ANOVA, Bonferroni correction). c, Bodipy-cholesterol and Olig2 staining in control (n = 5) or cyclodextrin-treated (n = 4) APOE4/4-TR mouse brain. Arrows highlight Bodipy-cholesterol accumulations around Olig2-positive nuclei. Datapoints represent individual mice, bars represent means of treatment group, p values were calculated with an unpaired two-tailed student’s t-test. Scale bar represents 50 μm. d, Representative corpus callosum TEM images from APOE4/4-TR mice treated with saline (n = 5 mice, n = 51 axons ) cyclodextrin (n = 4 mice, n = 56 axons) for 8 weeks. Scale bar represents 500 nm. G-ratio calculated as described in 4d), p values were calculated with an unpaired two-tailed student’s t-test. e, Schematic of novel object recognition task with control (n = 12) and cyclodextrin-treated (n = 14) APOE4/4-TR female mice. Preference calculated by dividing time the animal explored the novel object with the nose by total time interacting with either object (measured with Noldus EthoVision) Cartoons generated with BioRender. Data points represent individual mice. Bars represent means), p values were calculated with an unpaired two-tailed student’s t-test with Welch correction. f, Puzzle box test, control n = 9 and cyclodextrin-treated n = 10 APOE4/4-TR mice. Task performance was recorded with Noldus EthoVision. Data points represent means per treatment group and bars represent standard error of the mean, p values were calculated with an unpaired two-tailed student’s t-test Cartoons generated with BioRender.
To determine whether cyclodextrin-induced cholesterol reduction in APOE4/4 oligodendroglia affected myelination, we treated APOE4/4 oligodendroglia/iNeuron co-cultures with cyclodextrin for six weeks and then assessed myelination phenotypes (Fig. 6b). In all APOE3/3 co-cultures, a majority (62% ± 10%) of MBP staining was localized within 1 μm of neurofilament staining (Fig. 6b). In contrast, in untreated APOE4/4 co-cultures, less than a fifth (19% ± 7%) of MBP staining localized with neurofilament staining (Fig. 6b). Treating APOE4/4 co-cultures with cyclodextrin significantly (p = 0.0274) increased (by 43% ± 5%) MBP colocalization with neurofilament staining (Fig 6b) to similar levels (p = 0.0794) seen in APOE3/3 co-cultures (Fig. 6b).
We next assessed whether cyclodextrin could reduce aberrant cholesterol accumulation in oligodendrocytes and promote increased myelination in APOE4/4-TR mice in vivo. APOE4/4-TR mice were treated with subcutaneous injections of cyclodextrin or saline (control) for eight weeks (n = 5 control and n = 4 cyclodextrin treated mice). In the hippocampus of APOE4/4-TR cyclodextrin-treated mice, Bodipy-cholesterol droplets were reduced compared to control mice (p = 0.0038; Fig. 6c). Moreover, in cyclodextrin-treated mice, we observed a significant increase (p = 0.0423) in Bodipy-cholesterol staining co-localizing within 1 μm of MBP staining, indicating that cyclodextrin may improve trafficking of cholesterol to the myelin sheath (Extended Data Fig. 10b). MBP immunoreactivity was significantly increased (p = 0.0008) in APOE4/4-TR mice treated with cyclodextrin, suggesting that cyclodextrin may promote myelination (Extended Data Fig. 10b). Consistent with this, TEM-based ultrastructural analysis of corpus callosum from APOE4/4-TR mice revealed that cyclodextrin treatment significantly (p < 0.0001) reduced the g-ratio (n = 150 neurons for each genotype) versus saline-treated APOE4/4-TR mice, indicating an increased number of myelinated axons and thicker myelin sheaths (Fig 6d). Collectively, these data demonstrate that pharmacological enhancement of cholesterol transport can improve APOE4 myelination in vitro and in vivo.
Cyclodextrin improves cognition in APOE4 mice
To investigate whether the increased myelination observed in cyclodextrin-treated APOE4/4-TR mice is associated with functional improvements, we evaluated learning and memory using the novel object recognition assay (Fig. 6e)31. Total distance traveled and time spent in the center of the home cage (p = 0.1275 and p = 0.4478, respectively) was similar in control (n = 12) and cyclodextrin-treated (n = 14) APOE4/4-TR mice, suggesting that repeated cyclodextrin treatment did not affect general locomotion or induce anxiety-like behavior (Extended Data Fig. 10c). However, when exposed to a novel object, cyclodextrin-treated APOE4/4-TR mice exhibited significantly (p = 0.0466) increased preference for the novel object as compared to control APOE4/4-TR mice, suggesting that cyclodextrin treatment may improve learning and memory (Fig. 6e). We further employed the Puzzle Box test, a test previously used to measure demyelination-associated cognitive dysfunction32, as an additional assessment of learning and executive function (Extended Data Fig. 10d). This test consists of an open, brightly lit arena connected via tunnel to a covered “goal box” chamber with bedding (Fig 6f). On Day 0, the mice were habituated by freely exploring the setup for five minutes. Locomotion did not significantly vary between treatment groups (Extended Data Fig. 10d). The following day (“Day 1”), we blocked the tunnel with a piece of paper, placed a mouse in the arena, and recorded the time required for the mouse to remove the paper and enter the goal box. The task was repeated for four days and the latency to enter the goal box between the first and last day was compared. Cyclodextrin-treated APOE4/4-TR mice exhibited a decrease in latency to enter the goal box (p-value = 0.02), while saline-treated APOE4/4-TR mice (control) did not improve between the trial days (p-value > 0.6; Fig. 6f). This demonstrates that cyclodextrin treatment improves learning and executive function in aged APOE4/4-TR mice.
Discussion
By combining transcriptomic and lipidomic analysis of post-mortem human brains with functional studies employing isogenic stem cell lines and knock-in mouse models, we mechanistically dissect cell-type-specific effects of APOE4 from molecular pathways to cognitive behavior. We find that APOE4 alters lipid and cholesterol homeostasis across multiple cell types in the human brain. Cholesterol gene expression and localization are dysregulated in oligodendrocytes, leading to impaired myelination. We observed that pharmacologically promoting cholesterol efflux increases myelination in vitro and in vivo, and improves cognition in APOE4/4-TR mice. These results establish a causal link between cholesterol dysregulation and myelination in APOE4-carriers, which may influence the onset and severity of cognitive decline in AD.
Developmental myelination defects might influence the age of onset of AD by increasing the vulnerability to amyloid-β, tau and neuroinflammatory toxicity that progressively accumulates in aging33. Infant APOE4-carriers exhibit alterations in myelin volume and cognitive maturation trajectories relative to APOE3/3-carriers34,35. Reduced myelin volume and integrity often occur prior to the onset of dementia and are predictive of future cognitive impairment23,24,33,36. Therefore, cognitive impairment could also be influenced by reduced myelin maintenance and repair in the adult AD brain. Pharmacological, dietary, or lifestyle interventions focused on restoring cholesterol homeostasis and increasing myelin volume might increase cognitive reserves in APOE4 individuals.
Our results suggest that cholesterol transport could be an entry point to pharmacologically target impaired myelination, and that APOE genotype can inform such a therapeutic approach. We demonstrate facilitating cholesterol transport increases myelination and improves cognitive function in APOE4. These effects are not observed when targeting biosynthesis, suggesting that APOE4 plays a role in cholesterol trafficking and that increased biosynthesis might be a compensatory mechanism. Our integrative study thus establishes a mechanistic link between APOE4, cholesterol transport and localization in oligodendrocytes, myelin impairment, and cognitive performance. This finding presents new therapeutic and diagnostic opportunities for Alzheimer’s disease.
Methods
ROSMAP subject selection.
A total of 32 individuals were selected from the Religious Orders Study or the Rush Memory and Aging Project (ROSMAP), two harmonized longitudinal cohort studies of aging and dementia that includes extensive post-mortem pathological evaluations and clinical data collected annually, as previously described15. Details of clinical and pathological data collection methods have been previously reported37. To asses APOE4 effects in the context of AD pathology, 6 control subjects with no or very low pathology (no-pathology) and 6 age-matched subjects with severe amyloid-β, tau pathology, and cognitive decline (AD-group) were selected independently for APOE3/3 and APOE3/4-carriers. For APOE3/3 and APOE3/4-carriers, subjects were balanced between sexes (12 each) and matched for age (median=84.6 for APOE3/3 and 85.2 for APOE3/4). Informed consent and an Anatomical Gift Act were obtained from each subject, and the Religious Orders Study and Rush Memory and Aging Project were approved by an Institutional Review Board (IRB) of Rush University Medical Center. All subjects signed a repository consent that allowed their data and biospecimens to be shared.
Isolation of nuclei from frozen post-mortem brain tissue.
The protocol for the isolation of nuclei from frozen post-mortem brain tissue was adapted from a previous study12. All procedures were carried out on ice or at 4°C. In brief, post-mortem brain tissue was homogenized in 700 μl homogenization buffer (320 mM sucrose, 5 mM CaCl2, 3 mM Mg(CH3COO)2, 10 mM Tris HCl pH 7.8, 0.1 mM EDTA pH 8.0, 0.1% IGEPAL CA-630, 1 mM β-mercaptoethanol, and 0.4 U/μl recombinant RNase inhibitor (Clontech)) using a Wheaton Dounce tissue grinder (15 strokes with the loose pestle). Then the homogenized tissue was filtered through a 40 μm cell strainer, mixed with an equal volume of working solution (50% OptiPrep density gradient medium (Sigma-Aldrich), 5 mM CaCl2, 3 mM Mg(CH3COO)2, 10 mM Tris HCl pH 7.8, 0.1 mM EDTA pH 8.0, and 1 mM β-mercaptoethanol) and loaded on top of an OptiPrep density gradient (750 μl 30% OptiPrep solution (30% OptiPrep density gradient medium,134 mM sucrose, 5 mM CaCl2, 3 mM Mg(CH3COO)2, 10 mM Tris HCl pH 7.8, 0.1 mM EDTA pH 8.0, 1 mM β-mercaptoethanol, 0.04% IGEPAL CA-630, and 0.17 U/μl recombinant RNase inhibitor) on top of 300 μl 40% OptiPrep solution (40% OptiPrep density gradient medium, 96 mM sucrose, 5 mM CaCl2, 3 mM Mg(CH3COO)2, 10 mM Tris HCl pH 7.8, 0.1 mM EDTA pH 8.0, 1 mM β-mercaptoethanol, 0.03% IGEPAL CA-630, and 0.12 U/μl recombinant RNase inhibitor). The nuclei were separated by centrifugation (5 min, 10,000 g, 4°C). A total of 100 μl of nuclei was collected from the 30%/40% interphase and washed with 1 ml of PBS containing 0.04% BSA. The nuclei were centrifuged at 300g for 3 min (4°C) and washed with 1 ml of PBS containing 0.04% BSA. Then the nuclei were centrifuged at 300g for 3 min (4°C) and re-suspended in 100 μl PBS containing 0.04% BSA. The nuclei were counted and diluted to a concentration of 1,000 nuclei per microliter in PBS containing 0.04% BSA.
Droplet-based snRNA-seq.
For droplet-based snRNA-seq, libraries were prepared using the Chromium Single Cell 3′ Reagent Kits v3 according to the manufacturer’s protocol (10x Genomics). The generated snRNA-seq libraries were sequenced using NextSeq 500/550 High Output v2 kits (150 cycles) or NovaSeq 6000 S2 Reagent Kits.
snRNA-seq data preprocessing.
Gene counts were obtained by aligning reads to the GRCh38 genome using Cell Ranger software (v.3.0.2, 10x Genomics). To account for unspliced nuclear transcripts, reads mapping to pre-mRNA were counted. After quantification of pre-mRNA using the Cell Ranger count pipeline, the Cell Ranger aggr pipeline was used to aggregate all libraries (without equalizing the read depth between groups) to generate a gene-count matrix. The Cell Ranger 3.0 default parameters were used to call cell barcodes.
Quality control for cell inclusion.
Outlier cells with less than 500 or more than 10,000 genes detected were excluded, and only genes detected in at least 10 cells were considered. The following quality measures were quantified for each cell: (1) the number of genes for which at least one read was mapped (indicative of library complexity); (2) the total number of counts; and (3) the percentage of reads mapped to mitochondrial genes (used to approximate the relative amount of endogenous RNA and commonly used as a measure of cell quality). Cells with a discriminatively high ratio of mitochondrial to non-mitochondrial read counts were excluded using unbiased k-means clustering-based binarization (k=2). Nuclear-encoded protein coding genes were considered for downstream analyses.
Clustering analysis and QC filtering.
All dimensionality reduction, clustering, and visualization analyses were performed using our computational analysis framework ACTIONet38, available at (https://github.com/shmohammadi86/ACTIONet, version ACTIONet-Legacy). Briefly, for each round of clustering, singular value decomposition is performed for feature (gene) dimensionality reduction, and multiple rounds of matrix decomposition are performed to identify a lower dimensional cell state representation for each individual cell. This cell state representation is operationalized as a set of variables quantifying the relative contribution of latent cell state patterns learned from data to optimally describe the transcriptional heterogeneity of the whole dataset. This representation is used to build a cell network or embedding whose structure captures transcriptomic state relationships at single-cell level. This coupled decomposition and network-based analysis has been shown to recover biological cellular associations with improved performance relative to more conventional methods38. To avoid biased cell mixing due to independent sequencing batches or potential technical artifacts, a batch correction step considering sequencing batch as indicator vector was performed as part of the initial dimensionality reduction in all analyses. This step is achieved using ACTIONet’s function reduce.and.batch.correct.ace. Harmony, which internally uses the data integration procedure39 implemented in the software package Harmony (https://github.com/immunogenomics/harmony). Discrete groups of cells with similar transcriptomes (cell clusters) were identified by applying the Leiden graph-based clustering algorithm to the resulting network. The same methodology was applied in the second clustering round, using cell type annotated subsets of cells as input. As part of QC filtering steps, clusters representing only cells from one individual, suspected to recover doublet cells, or to be composed of presumed low-quality cells, were excluded from downstream analyses. Doublet or low-quality cluster status was determined empirically based on the examination of cell associations in 2D plots, the presence of mixed gene markers from distinct cell types, and extreme QC metric values. The latter relative to those commonly observed in other subclusters of the same cell type. After applying QC filtering steps, the dataset included 17,915 genes profiled in 164,741 nuclei.
Differential gene expression.
(1) Differential gene expression by NBMM (negative binomial mixed model). Per-gene expression levels per cell type were modeled as a negative binomial model with random effects that model both within-individual and between-individual effects, as implemented in the R package NEBULA (version 1.2.1)40 Briefly, NEBULA models gene counts as sampled from a negative binomial distribution, parameterized by a mean and variance. The mean parameter is modeled as an exponential scaled by a scaling factor (total library count per cell). The exponent is modeled as a linear combination of fixed and random effects (individual of origin), where the fixed effects are a linear combination of predictors: ~ β0*amyloid + β1*nft + β3*age_death + β4*batch + β5*APOE4. Where the β5 coefficient and p-value were computed with respect to the APOE4 variable of interest, when controlling for the remaining variables. Nebula results are reported in Supplementary Table S14. (2) Single-cell differential gene expression. Differential gene expression between groups of individual cells was estimated using a Wilcoxon rank sum test, as implemented in the R package presto (version 1.0.0; https://github.com/immunogenomics/presto). Wilcoxon results are reported in Supplementary Table S13. (3) Pseudo-bulk differential gene expression. Individual-level normalized gene expression averages were fitted with the following linear model: gene expression ~ β0*APOE4 + β1*amyloid + β2*nft + β3*age_death + β4*msex + β5*pmi. The linear models were fitted using the lmfit() function and t-statistics were computed using the eBayes() function from the Limma R package (version 3.50.3). Estimates are reported in Supplementary Table S15.
Pathway analyses.
(1) Databases. Both the APOE-associated and lipid-associated pathway databases were curated by filtering the union of pathways (downloaded from the Mayaan laboratory, https://maayanlab.cloud/Enrichr/#libraries) from GO BP (2018), KEGG (2019), Reactome (2016), and HumanCyc (2016) pathways either for gene sets that contain the gene APOE or for gene sets whose name contains at least one of the following terms: sterol, athero, cholest, LDL, HDL, lipoprotein, triglyceride, TAG, DAG, lipid, steroid, fatty acid, ceramide. Some pathways were renamed for clarity and because of space constraints in Fig. 1. New names are documented in Supplementary Tables. S4–6. (2) Pathway activity scores. Individual-cell type level normalized gene expression profile averages were first computed (normalized values were first computed using ACTIONet), followed by calculation of pathway activity scores, as previously implemented in the R package GSVA (version 1.42.0)41. Briefly, GSVA estimates a normalized relative expression level per gene across samples. This expression level is then rank ordered for each sample and aggregated into gene sets by calculating sample-wise enrichment scores using a Kolmogorov-Smirnov-like rank statistic. The following parameters were used to evaluate the GSVA function: mx.diff=TRUE, kcdf=c(“Gaussian”), min.sz=5, max.sz=150. Activity scores computed this way accurately recovered cell type signatures not recovered by equally-sized randomly sampled genesets (data not shown), suggesting that this approach captures transcriptomically-encoded biological signals in snRNA-sequencing data. (3) Differential pathway activity analysis. First, GSVA was used to compute pathway activity scores on individual-level average expression profiles in each cell type of interest. To minimize the discovery of false positive effects, activity scores were computed only after filtering out genes that were not expressed in a given cell type (defined as a nonzero detection rate ≥10%, see Supplementary Table S2 for full list of expressed genes per cell type). For each pathway-cell type combination, pathway activity scores were modeled using a multivariate linear model as follows: pathway activity ~ β0 * APOE4 + β1 * amyloid + β2 * nft + β3 * age_death + β4 * msex + β5 * pmi. Here, APOE4 is a binary variable, encoding the presence of at least one E4 allele. Amyloid and nft are averages of continuous measurements of pathology across 8 and 5 brain regions, respectively, as evaluated and reported by ROSMAP. Age_death is a continuous measurement indicating age at death, pmi represents the post-mortem-interval (a continuous measurement), and sex is a binary variable encoding biological sex. β0 represents the additive effect of APOE4 (≥1 allele) on pathway activity, when accounting for other confounding variables that might be correlated with, and thus explain, a portion of the variation observed in the activity of a pathway of interest. The linear models were fitted using the lmfit() function and t-statistics were computed using the eBayes() function from the Limma R package (version 3.50.3). To prioritize candidate APOE4-dysregulated processes to be subsequently thoroughly validated using independent data and experimental methods, processes with snRNAseq evidence of association with APOE4 at a nominal p-value 0.05 were considered as potential candidates (Fig. 1). This procedure resulted in prioritized candidate pathways for all major cell types. β0 estimates with confidence intervals related to the analysis in Extended Fig. 2 and Fig. 1 are reported in Supplementary Tables S4–6, including statistics, nominal and FDR-adjusted p-values. (4) Pathway dysregulation by gene set enrichment analysis (GSEA). For a subset of highly relevant pathways, a second statistical analysis was performed to further corroborate reproducibility of results across methods. To this end, Nebula (above) was used to model gene expression changes associated with APOE4 in oligodendrocytes. Next, for each gene, the following score was computed: s = −log10(p-value)*sign(β5), and genes were rank ordered based on the scores. An R implementation of gene set enrichment analysis (fgsea, version 1.20.0) was used to estimate the statistical overrepresentation of lipid-associated gene sets (above) within high-scoring, differentially expressed genes. Lipid-related genesets with evidence of having an APOE4 effect (p-value < 0.05) are shown in Extended Fig. 2d.
Untargeted Lipidomics on post-mortem prefrontal cortex.
The untargeted lipidomics was previously described42. Briefly, approximately 50 mg of dorsolateral prefrontal cortex (DLPFC) tissues were added to 96-well plate with 1 ml PBS and 1.4 mm ceramic beads, and then homogenized for 4.0 m/s for 20 sec by Omni homogenizer (OMNI International, Kennesaw, GA) at 4°C. After homogenization, the samples were centrifuged at 4000 rpm for 10 min and the supernatant was collected and extracted using a combination of Methyl tert-butyl ether (MTBE) and methanol via an automated extraction system, Biotage Extrahera (Biotage, Charlotte, NC). The extract was then filtered and dried under nitrogen for lipidomic analysis. Dried lipids were reconstituted in 200 μl 1:1 chloroform:methanol and resolved using a Thermo Accucore C18 column on a Thermo Vanquish Ultimate 3000 UPLC coupled to a Thermo Orbitrap ID-X Tribrid mass spectrometer (Thermo, Waltham, MA). Chromatography was operated at the flow rate of 0.4 ml/min at 40°C during a 15-min gradient. The mobile phase of UPLC grade solvents consisted of solvent A: 10 mM ammonium formate in 60% acetonitrile with 0.1% formic acid and Solvent B: 10 mM ammonium formate in 10% acetonitrile and 90% isopropanol with 0.1% formic acid. Data were acquired in both positive and negative mode. Data were acquired at full scan mode at a resolution of 120,000 for all the samples. Iterative data dependent acquisition (DDA) was collected on pooled samples and National Institute of Standards and Technology (NIST) standard reference material (SRM) 1950 human plasma at a resolution of 15,000 using stepwise collision energy to obtain substructure information of lipid identification. Pooled QC samples were run after every ten samples using the same analytical procedure as samples and used for normalization of data. The raw data were processed using LipidSearch ver 4.2 (Thermo Fisher, San Jose, CA) and a total 2200 lipids from both negative and positive modes were identified via full scan with data dependent MS2 (ddMS2). To determine cholesterol ester (ChE) in the samples, we used global profiling of NIST SRM 1950 as m/z RT library and all ChE identified in this library had MS/MS confidence as either level B or C. Grade “B” calls are lipids of which class and some fatty acid chains were identified and grade “C” calls are lipids of which class or fatty acid was identified. The lipid annotation in the samples was based on m/z and retention time matching to the m/z RT library. Then, we normalized the lipidomic data to remove systematic variations based on quality control (QC) pool samples by Shiny-SERRF R app (https://github.com/slfan2013/Shiny-SERRF) and the normalized data was used for further analysis. Normalized values are reported in Supplementary Table S8. The cohort was subset into 314 subjects (194 individuals with AD pathology, where niareagansc was equal to 1 or 2 and 120 subjects without AD pathology, where niareagansc was equal to 3 or 4. APOE4-carriers (including APOE3/4 and APOE4/4 genotypes) vs APOE4 non-carriers (i.e. APOE3/3 carriers) were compared by wilcoxon rank sum test (stats base package, R version 4.1.2). Only peaks with a signal to noise ratio > 3 and of quality >= 0.6 were considered in the analysis. 4 out of 17 peaks passed this quality control cutoff (Supplementary Table S8). Underscores_N (e.g. ChE(18:1)_1 vs ChE(18:1)_2) refer to the same lipid species, with different retention times. Underscore_c indicates a combination of _1 and _2 peaks. Species without underscore have a single retention peak.
Untargeted lipidomics of post-mortem corpus callosum.
Lipids were extracted using a methyl-tert-butyl ether (MTBE)-based liquid-liquid method. Tissue homogenates were prepared at a concentration of 50 mg (wet weight)/mL in 150 mM NaHCO3 in 7-mL Precellys tubes containing ceramic beads (CK14 for soft tissue). The vials were placed in the Precellys tissue homogenizer and shaken at 7900 rpm for 3 cycles of 60 seconds with a 60-second rest between cycles. Sixty-L aliquots of the resulting homogenates were removed from each sample and placed in 16×100 mm glass tubes for extraction. To these were added 100 L 150 mM NaHCO3, 100 L deionized water, 1 mL MTBE/methanol 7:2 (v/v), and 5 L internal standard mixture (Equisplash, Avanti Polar Lipids, #330731 diluted 1:1 with MeOH). The tubes were vortexed and mixed on a tabletop shaker for 15 minutes at room temperature and then centrifuged at 5 °C for 15 minutes at 3000 g to separate the phases. The top, organic phase was removed carefully using a Pasteur pipette into new glass tubes, and the organic solvent was removed on a SpeedVac vacuum concentrator. The dried samples were then reconstituted in 200 L n-butanol/methanol 1:1 (v/v) and placed into autosampler vials for analysis.
Bulk RNA-sequencing from isogenic iPSC-derived oligodendroglia.
700 μL of EtOH and Trizol were added at a 1:1 ratio to each well, and cells were collected into tubes. The procedure was then followed according to Zymo Direct-Zol Microprep kit instructions. Approximately 500 ng of each sample was submitted for library prep (Kappa HiFi) and bulk sequencing performed by the BioMicro Center at MIT’s Department of Biology, using the NextSeq Illumina platform. Raw FASTQ data were quasi-mapped to a reference transcriptome derived from the GRCh38 human genome assembly and quantified using Salmon (version 1.3.0). Differential gene expression testing was performed with DESeq2 (version 1.22.1) with median-ratio count normalization, parametric dispersion estimation, and additional count normalization by variance-stabilizing transformation. GSVA was used to compute differential pathway activity scores on replicate-level bulk sequencing profiles. A simple linear model, with APOE status as the single predictor, was used to compute effect sizes and confidence intervals. The normalized (FPKM) gene counts matrix is reported in Supplementary Table S10. Differentially expressed gene statistics are reported in Supplementary Table S12.
Comparative analysis of iPSC and post-mortem transcriptomes.
Normalized gene expression values (FPKM) for iPSC-derived neuronal cells (N=6), microglial-like cells (N=8), and astrocytes (N=6) were obtained from a previous publication (GEO accession number: GSE102956)14. To assess whether corresponding cell types in the iPSC and post-mortem data showed consistent transcriptomic signatures relative to remaining cell types, while accounting for sequencing and batch effects, scaled gene expression values (mean-centered, standard deviation = 1) were first independently computed for each dataset and then concatenated into a normalized expression matrix. Pathway activity scores were computed on this concatenated matrix using GSVA. Principal component analysis was performed on the concatenated matrix of gene-by-individual (or replicates for iPSC). Pairwise distances between individual-level cell type averages from post-mortem tissue and iPSC-derived cells were computed in scaled mean-centered gene space.
iPSC differentiation into oligodendroglia.
iPSCs were differentiated into oligodendrocytes as described44. Briefly, following single-cell disassociation with accutase iPSCs were plated at nearly 100% confluency. Differentiation was initiated the following day via the addition of 10 μM SB431542 and 100 nM LDN 193189 with 100 nM all-trans RA in DMEM/F12 (1:1) media supplemented with N2 (Defined as Day 0 of the induction). Media was changed every day. At day 8, SAG (1 μM) was added to the medium along with 10 μM SB431542 and 100 nM LDN 193189 ng/ml. At day 12, adherent cells were lifted and seeded in low-attachment plates to promote sphere aggregation. Spheres were cultured in DMEM/F12 (1:1) media supplemented with N2, RA, and SAG. On day 30, spheres were plated into poly-L-ornithine/laminin-coated dishes and cells were allowed to migrate out of the sphere. At this stage, media was switched to DMEM/F12 (1:1) media supplemented with N2, B27, 10 ng/ml PDGF-AA, 10 ng/ml IGF, 5 ng/ml HGF, 10 ng/ml NT3, 25 μg/ml insulin, 100 ng/ml biotin, 1 μM cAMP, 60 ng/ml T3. At day 75, cells were dissociated and selected for NG2 via MACS purification. The resulting cells were expanded in DMEM/F12 (1:1) media supplemented with N2, B27, 10 ng/ml PDGF-AA, 10 ng/ml β-FGF, 10 ng/ml NT3. To promote oligodendrocyte maturation, the media was switched to DMEM/F12 (1:1) media supplemented with N2, B27, 20 μg/ml ascorbic acid, 10 mM HEPES, 25 μg/ml insulin, 100 ng/ml biotin, 1 μM cAMP, 100 ng/ml T3 for at least 2 weeks.
iPSC-derived Oligodendroglia drug treatment.
Cells were plated onto a Millipore eight-chamber glass slide, at a density of 250,000 cells per well. Cells were then cultured in Neurobasal media, supplemented with PDGFR-AA, NT3 and β-FGF. Cells were treated with either Atorvastatin (1 μM), Simvastatin (1 μM), or cyclodextrin (1 mM) for two weeks. Cells were incubated with Bodipy-cholesterol, and then fixed with 4% PFA, and counter-stained for WGA-membrane and DAPI.
APOE Oligodendroglia Lipidomics.
Cell pellets from oligodendrocytes were extracted by adding 600 μL MeOH, 300 μL H2O, and 400 μL chloroform. Samples were vortexed for 10 minutes and centrifuged for 10 minutes at 10,000 g at 4°C. The nonpolar layer was transferred to a glass vial and dried under a stream of N2 gas and samples were stored at −80°C. Dried lipids were resuspended with 200 μL of 1:1:1 MeOH:Acetonitrile:2-propanol and 10 μL was injected for analysis by mass spectrometry. The LC-MS system uses an Accela UPLC pump (Thermo Scientific, San Jose, CA) and an Exactive orbitrap mass spectrometer (Thermo Fisher Scientific, San Jose, CA). Chromatography was performed using a Luna C8 reversed-phase column (150 × 2.0 mm, 3 μm particle size, 100 Å poresize, Phenomenex, Torrance, CA) with a binary gradient (solvent A: 97:3 water/methanol with 10 mM tributylamine and 15 mM acetic acid (pH 4.5), and solvent B: 100% methanol). The gradient ran linearly from 80–99% B from 0 to 20 min, remaining at 99% B from 20 to 40 min, from 99% B to 80% B to 41 min, and remaining steady at 80% B to 50 min to re-equilibrate the column at a flow rate of 200μL/min. The autosampler temperature was held at 4°C, injection volume 10 μl, and column temperature 25 °C. The mass spectrometer was operated in negative and positive ionization modes. The electrospray ionization (ESI) settings were: sheath gas flow rate 30 (arbitrary units), auxiliary gas flow rate 10 (arbitrary units), sweep gas flow rate 5 (arbitrary units), spray voltage 3 kV, capillary temperature 325°C, capillary voltage −50 V, tube lens voltage 100 V, and skimmer voltage −25 V. The mass spec resolution was set to 100,000 resolving power at m/z 200 and the automatic gain control (ACG) was set to high dynamic range with a maximum injection time of 100 ms. The scan range was 200 – 400 m/z in the first 20 min and 300 – 575 m/z in the subsequent 30 min. Resulting mass spectrometry data was analyzed using El-Maven (Elucidata.io) and compounds were identified using m/z or using a library of standards with known retention times.
Bodipy-cholesterol stain.
Formalin-fixed human post-mortem brain tissue was sectioned with a Leica vibratome at a thickness of 40 μm. Brain sections were incubated overnight at 4°C in a solution of 1 μg/ml Bodipy-cholesterol in PBS with 0.1% TritonX-100 + 10% bovine serum albumin, and primary antibodies. Brain sections were washed 4 times with PBS-T and stained with Alexa secondary antibodies (1:1000). Samples were washed with PBS 4 times following secondary staining. Autofluorescence was quenched using True Black (Sigma) following manufacturer’s instructions. Sections were mounted on slides and imaged using Zeiss LSM 880 confocal microscope, using the same imaging parameters for each image.
Mouse immunohistochemistry.
Animals were anesthetized via exposure to gaseous isoflurane, and transcardially perfused with ice-cold PBS. The brains were dissected out, one hemisphere frozen in dry ice, and one hemisphere drop-fixed in 4% paraformaldehyde. The post-fixed hemisphere was sliced at a thickness of 40 μm using a Leica vibratome. Slices were blocked with a buffer containing 0.3% Triton-X and 10% normal donkey serum for two hours at room temperature, before being incubated with primary antibody overnight at 4°C. Slices were then washed with PBS and incubated with secondary antibodies for two hours at room temperature, washed with PBS again, and mounted. Slides were imaged using a Zeiss LSM 880 microscope with the same parameters for each image, and analyzed using the ImageJ FIJI or Imaris software. All animal experiments were performed according to the Guide for the Care and Use of Laboratory Animals and were approved by the National Institutes of Health and the Committee on Animal Care at the Massachusetts Institute of Technology.
Mouse models.
All experiments were performed according to the Guide for the Care and Use of Laboratory Animals and were approved by the National Institute of Health and the Committee on Animal Care at Massachusetts Institute of Technology. APOE-TR mice were obtained from Taconic. Colonies were bred and aged in the MIT vivarium under standard light/dark cycles, temperature, and humidity. For all mouse model experiments, APOE targeted replacement mice, where the endogenous murine locus is replaced by human APOE3/3 or human APOE4/4 on a C57BL/6NTac background, were used. Ages ranged from 6 to 9 months old. Both males and females were included in the experiments and sex was balanced across treatment and genotype conditions. Sample size was determined from previous publications from our lab. Power analysis to determine sample size was not performed. Treatment and genotype groups were matched on age as much as possible. Experimenters were not blinded to drug injections and when executing behavioral trials. Data analysis of the TEM images was done manually under blinded conditions. Data analysis of behavioral and immunohistochemistry data was performed using software and scripts (see corresponding methods sections).
Transmission Electron Microscopy.
Animals were euthanized via exposure to gaseous isoflurane. The head was submerged under EM-grade fixative, and the brain removed without exposure to air. The corpus callosum was dissected out, and post-fixed in EM-grade fixative for 72 hours. Tissue preparation and TEM analysis was performed by Harvard Medical School Electron Microscopy Core. G-ratios were calculated using Image J software by dividing the axon diameter by the outer diameter of the myelin sheath. The number of lipid droplets per 1 μm2 surface area were also quantified for each mouse. At least four images for each animal were analyzed. Each experiment consisted of at least 3 mice per a treatment group. Analysis was performed blinded.
Western Blot.
Protein concentration of each sample was measured using the Bradford Protein Assay. Volumes corresponding to 50 μg of protein for each sample were loaded into wells, and a current of 100V was applied for 45 minutes. The gel was transferred to a membrane for 30 minutes, blocked in 3% milk in TBST for two hours at room temperature, and incubated with primary antibody overnight at four degrees. Membranes were washed with TBST, incubated with an antibody-conjugated horseradish peroxidase (1:2000) for two hours at RT, and a chemiluminescence activator.
Mouse cyclodextrin treatment.
APOE4/4-TR male and female mice (6 months old) were injected subcutaneously in the right thigh with 2 grams per kilogram body weight 2-hydroxypropyl-β-cyclodextrin in phosphate-buffered saline (200 μL total volume) or 200 μL phosphate-buffered saline (PBS), twice a week for eight weeks. For IHC and TEM analysis mice were anesthetized and subjected to cardiac perfusion of PBS followed by ice-cold 4% paraformaldehyde. Brains were dissected out and post-fixed in 4% PFA overnight at 4C.
Novel object recognition task.
Mice were placed into the test arena and allowed to move freely for 10 minutes. The total distance moved, and time mice spent in the center of the arena was tracked using the EthoVision XT software from Noldus. One day later, mice were then placed into the same arena containing two objects and allowed to freely investigate both for eight minutes. After an interval of four hours, mice were then placed back in the chamber with one novel object and one familiar object. The preference index was calculated by determining how much time an animal spent with its nose interacting with the novel object, divided by the total time an animal spent interacting with either object.
Puzzle Box task.
Mice were placed in a Puzzle box and allowed to move freely for ten minutes. The total distance moved, and time mice spent in the center of the arena was tracked using the EthoVision XT software from Noldus, using the same parameters for each animal. One day later, mice were exposed to the Puzzle Box task, which consists of an open, brightly-lit arena connected via tunnel to a dark chamber with bedding. On Day 0, we habituated mice by giving them five minutes to freely explore the apparatus. The following day (“Day 1”), the tunnel entrance was blocked with a piece of paper. Mice were then placed in the brightly lit arena, and the latency for the animals to remove the paper and enter the goal box was recorded. The assay was repeated for four days, and the time to enter the goal box or “latency” was compared between the first day with the obstacle (“Day 1”) and the fourth day (“Day 4”).
Extended Data
Extended Data Fig. 1. Subject-level metadata and single-cell annotation quality control.
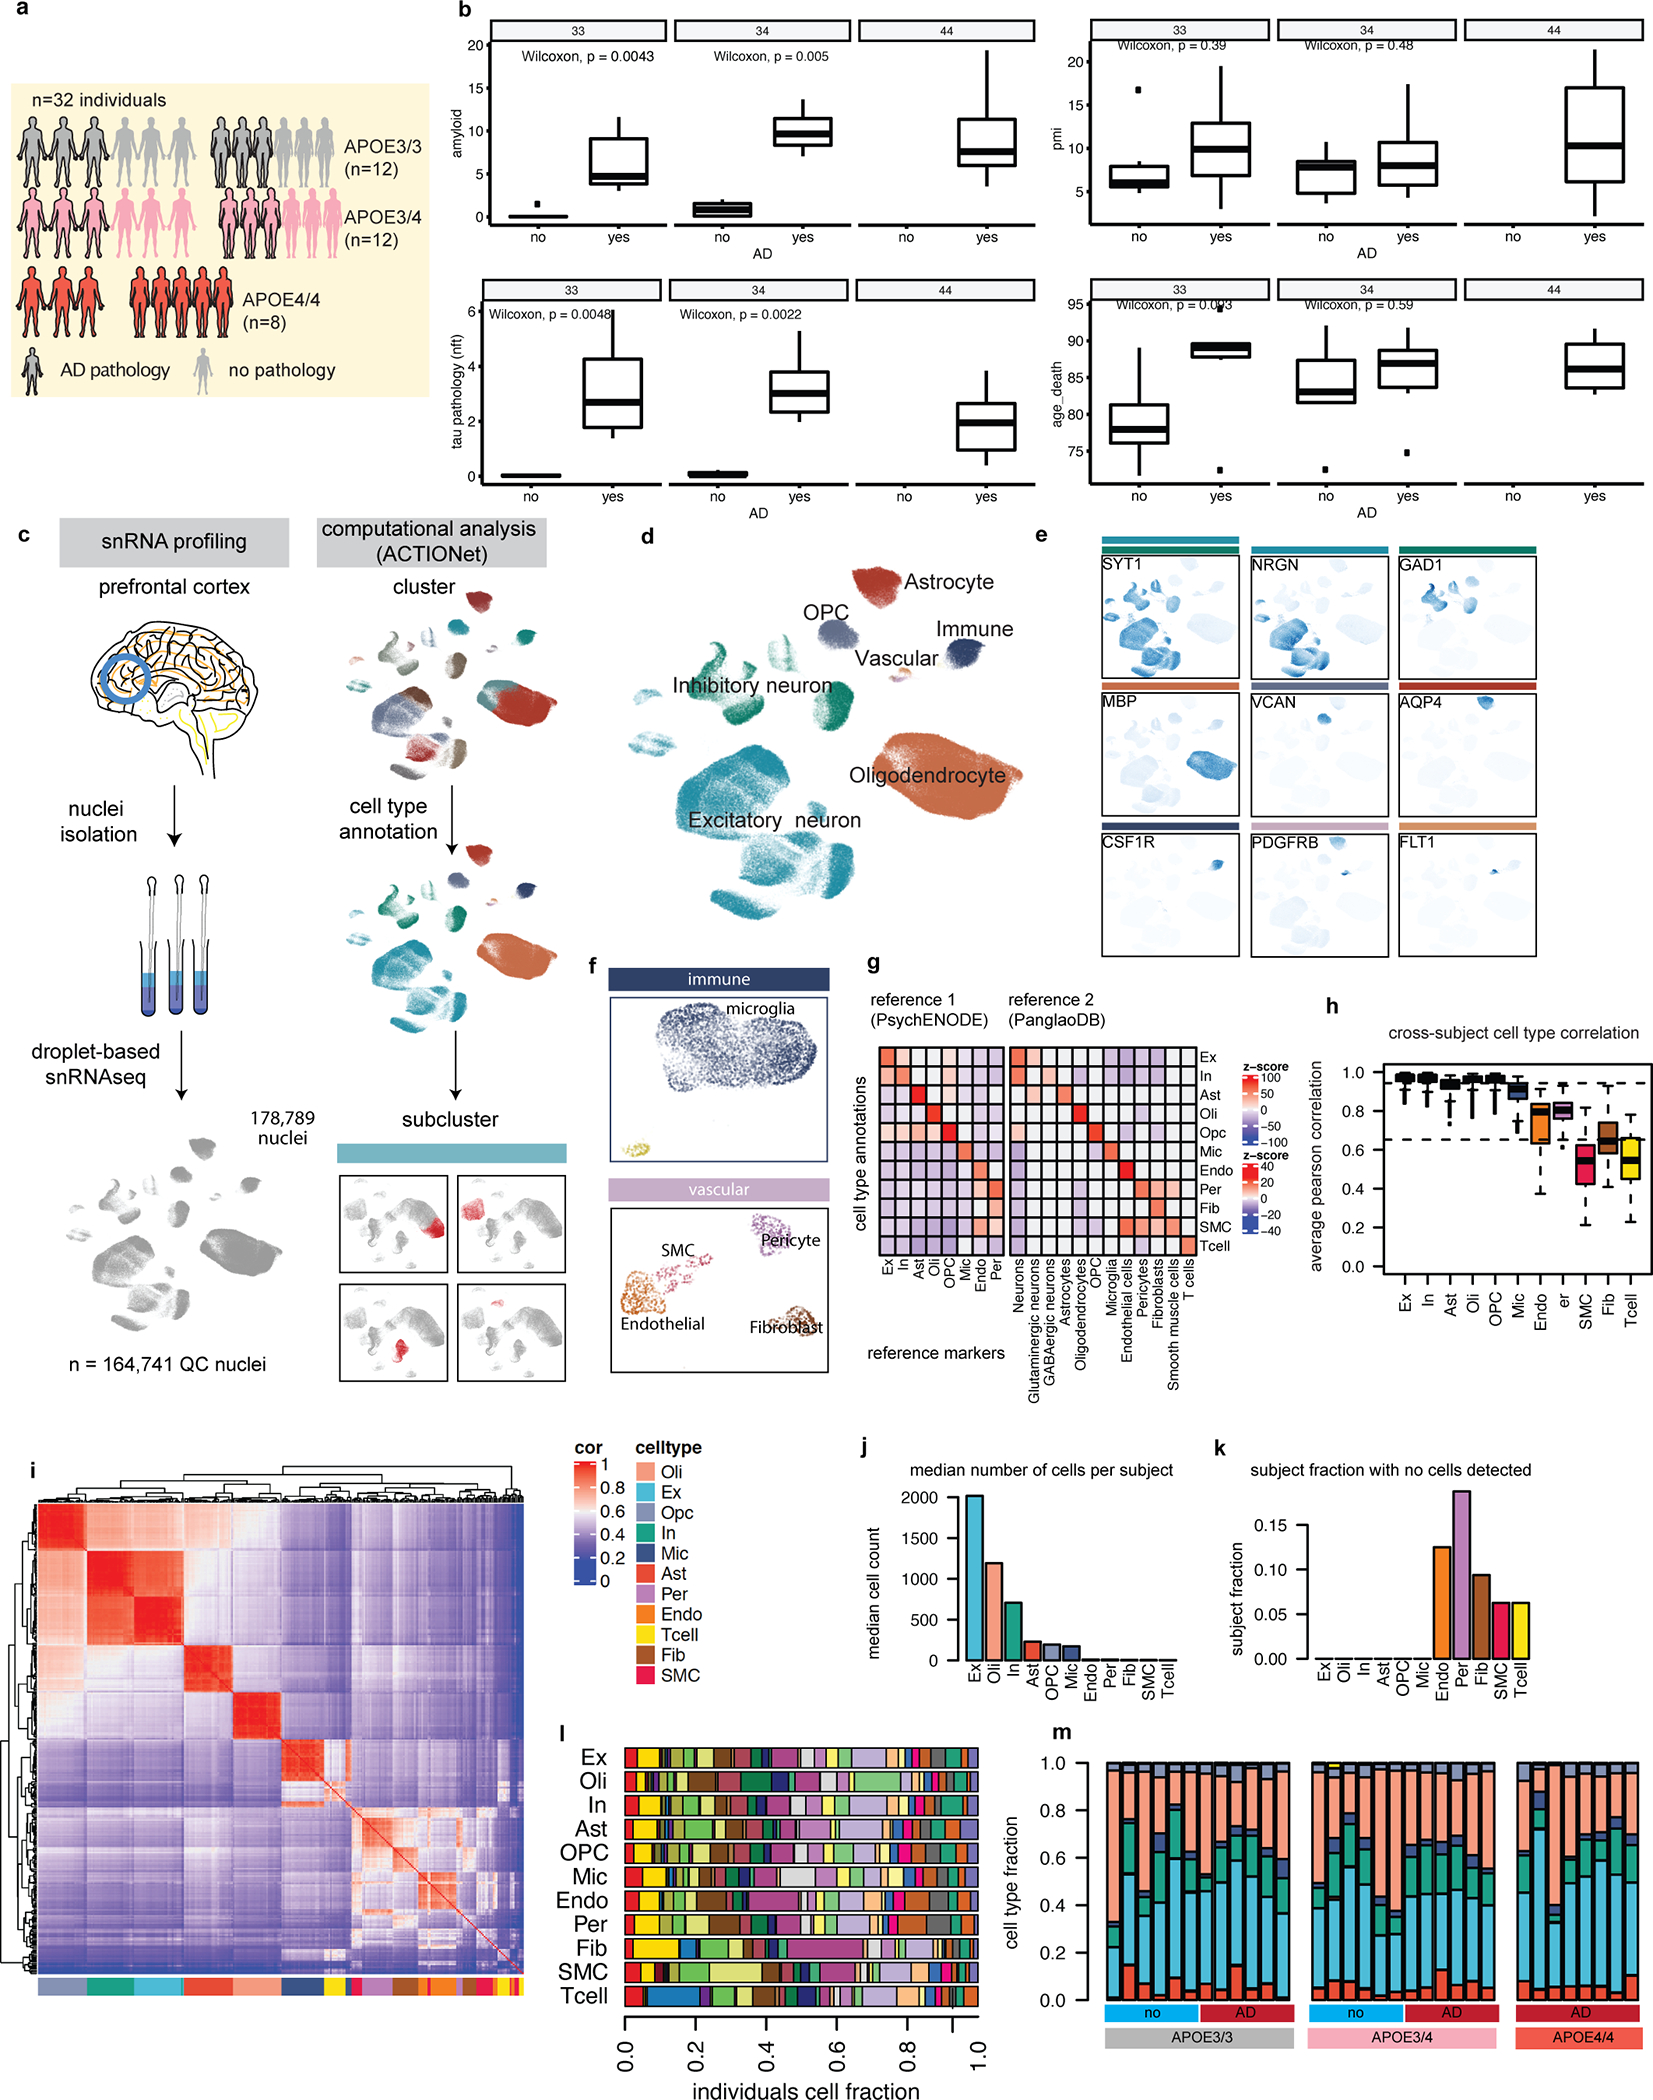
a, Study cohort description by APOE genotype groups: APOE3/3-carriers (gray), APOE3/4-carriers (pink), APOE4/4-carriers (red); balanced according to positive (glow) or negative pathological diagnosis (no glow) Cartoons generated with BioRender. APOE4/4 group comprised 3 male and 5 female subjects, all with an AD diagnosis. AD status is defined based on pathological (high amyloid and tau pathology) and cognitive diagnosis of Alzheimer’s dementia (final consensus cognitive diagnosis, cogdx=4). b, Distribution of pathology variables, PMI, and age at death in cohort. Unadjusted wilcoxon test p-values shown, two-sided (N = 6 per group, except for APOE4/4, where N = 8). Boxplots indicate median, 25th and 75th percentiles. c, Experimental and computational workflow of the single-cell analysis involves single nuclei isolation and sequencing, followed by computational analysis for sub-clustering and cell type annotation. Cartoons generated with BioRender d, Two-dimensional representation of all high-quality cells included in downstream analysis labeled by major cell types. e, Cell-type-specific marker gene expression projected onto two-dimensional representation of cell space. Colored bars indicate the cell type for which a given gene was considered a marker. See panel i for legend. f, Expanded view of immune and vascular cell types within cell space. g, Enrichment of markers from two independent datasets (columns) within genes with preferential gene expression across annotated cell groups (rows). h, Distribution of inter-subject correlation values by cell type. Boxplots indicate median, 25th and 75th percentiles. i, Pairwise correlations of cell-type-specific individual-level transcriptomic profiles (average expression values across cells of a given type, N = 32 profiles per cell type). j, Median number of cells per subject by cell type. k, Fraction of subjects lacking cells of a given type. l, Individual distributions across cell types. m, Individual cell-type fractions organized by pathological diagnosis and APOE genotype.
Extended Data Fig. 2: APOE-associated and lipid pathway changes in APOE4 and AD.
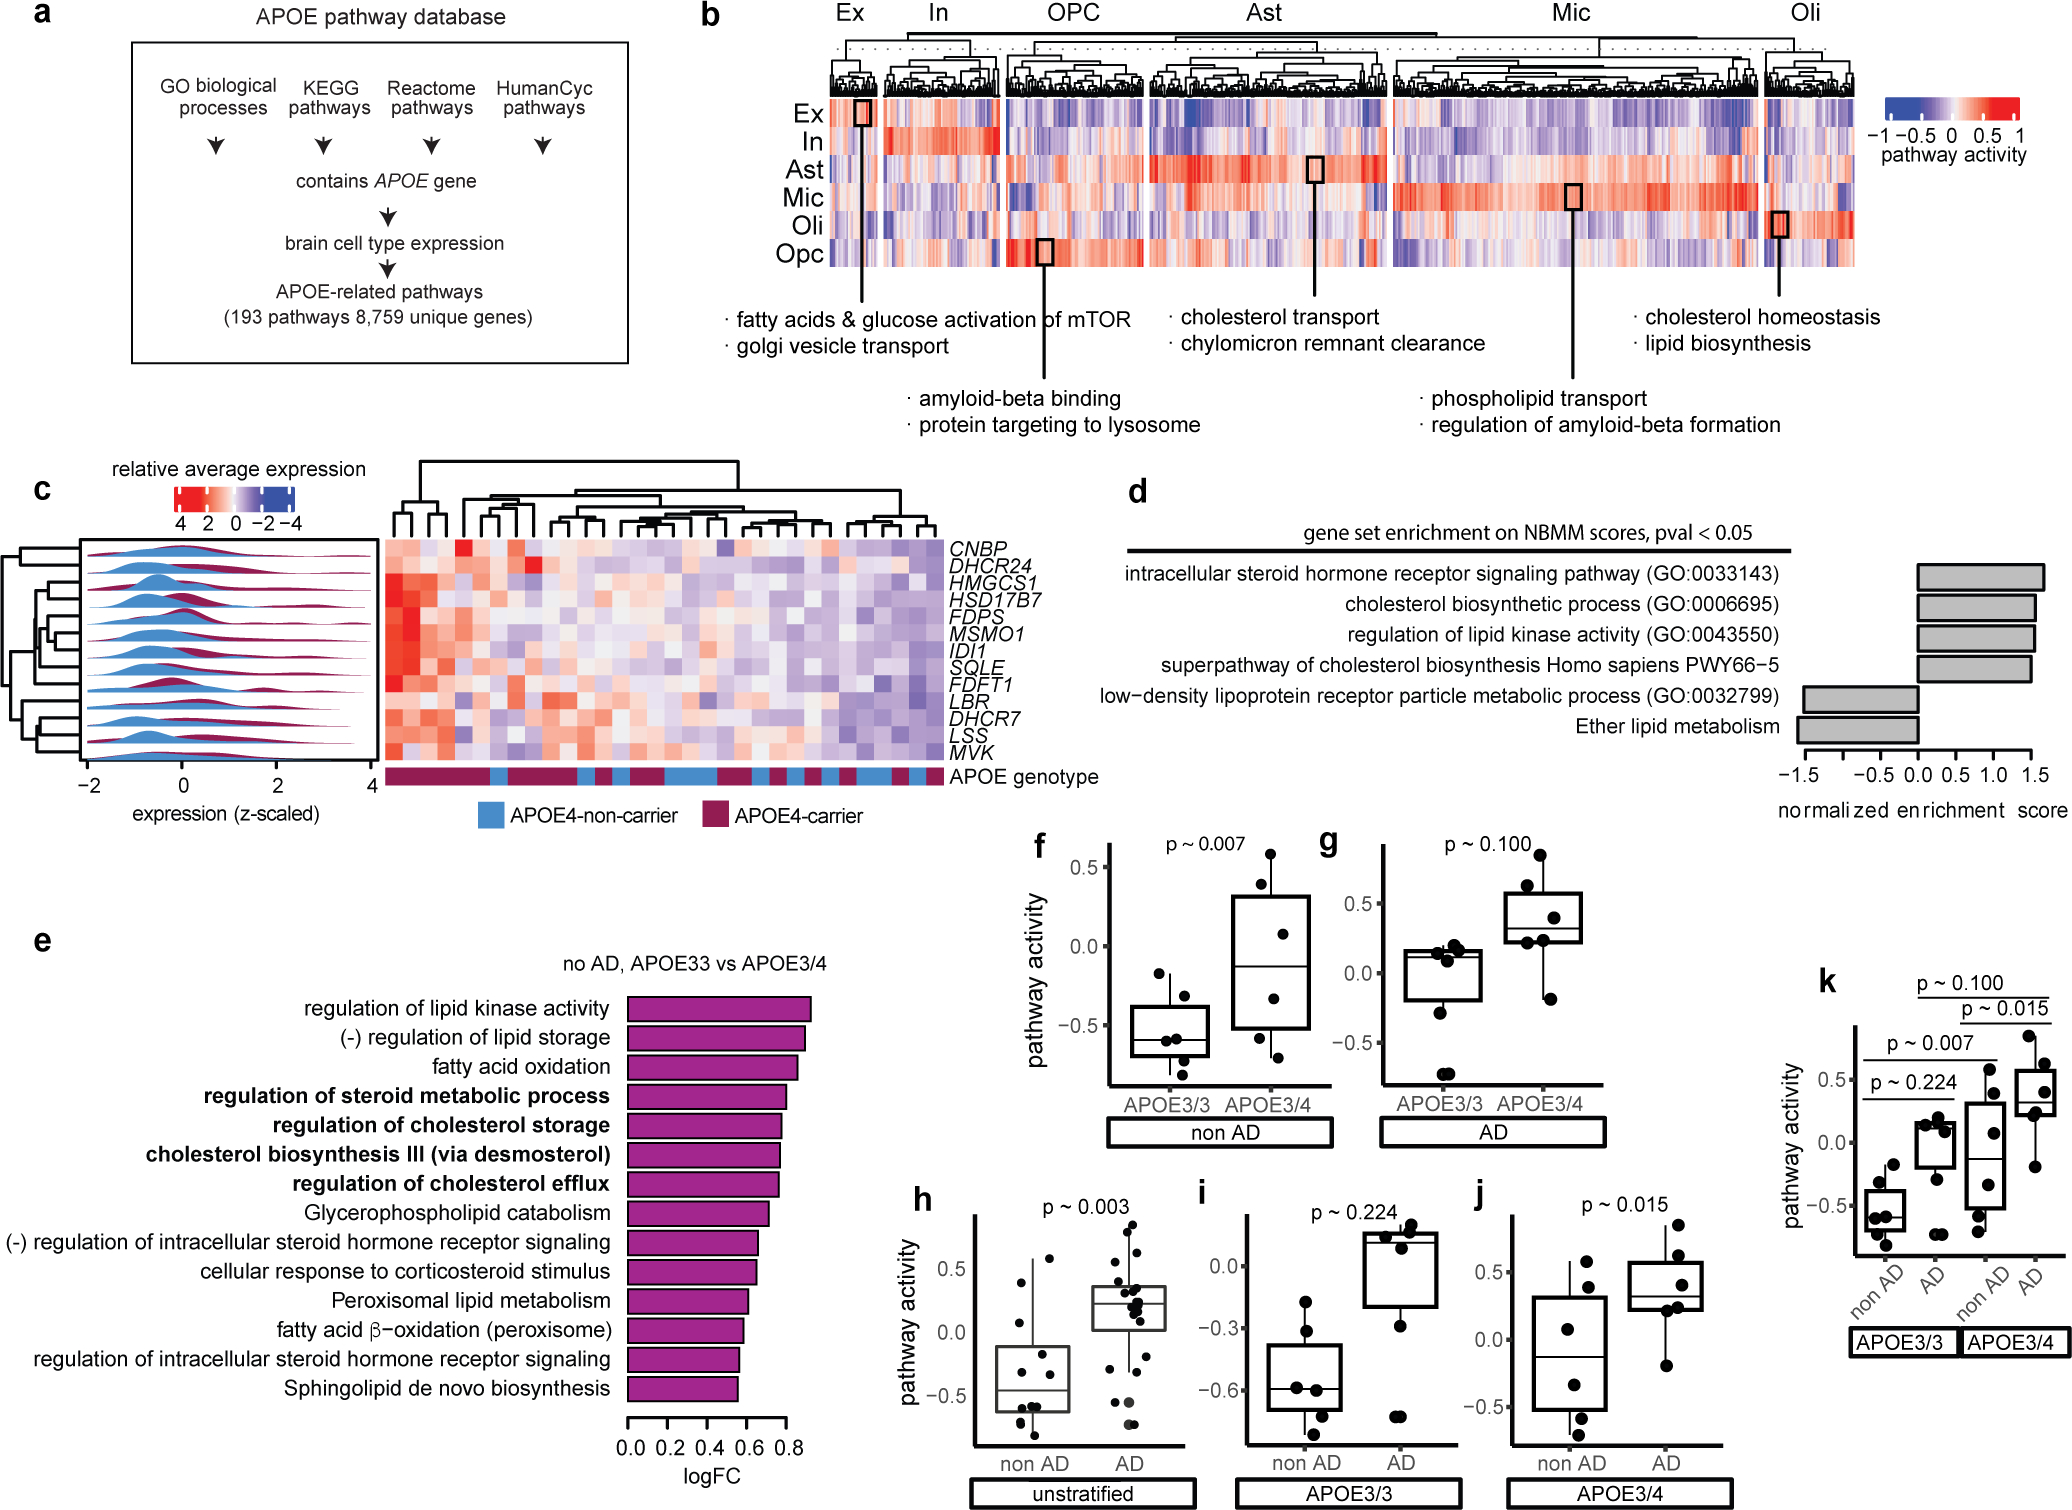
a, Curation process for APOE-associated pathway database. Brain cell type expression was defined as nonzero detection of a gene in >10% of cells of that cell type. b, Transcriptional activity scores of APOE-associated pathways that show cell-type-specific patterns. c, Individual-level average expression of cholesterol biosynthesis genes from Fig. 2a in oligodendrocytes. d, Overrepresentation of lipid-related pathways (database from Fig. 1c) within genes differentially expressed in APOE4 relative to APOE3 in human post-mortem oligodendrocytes as estimated by a negative binomial mixed model (NBMM). e, Altered lipid-associated pathways (see methods) in APOE3/3 vs APOE3/4-carriers, in no AD background (control) (nominal p-value < 0.05, linear model, unadjusted, N = 6 per group). Pathways of special interest are highlighted in bold. (−) indicates negative regulation. f-k, Pathway activity scores for ‘Cholesterol biosynthesis III (via desmosterol) stratified by APOE genotype and/or AD pathology (p-values, linear model, unadjusted, n = 6 per group). Boxplots indicate median, 25th and 75th percentiles.
Extended Data Fig. 3: Large-scale lipidomic analysis of human prefrontal cortex.
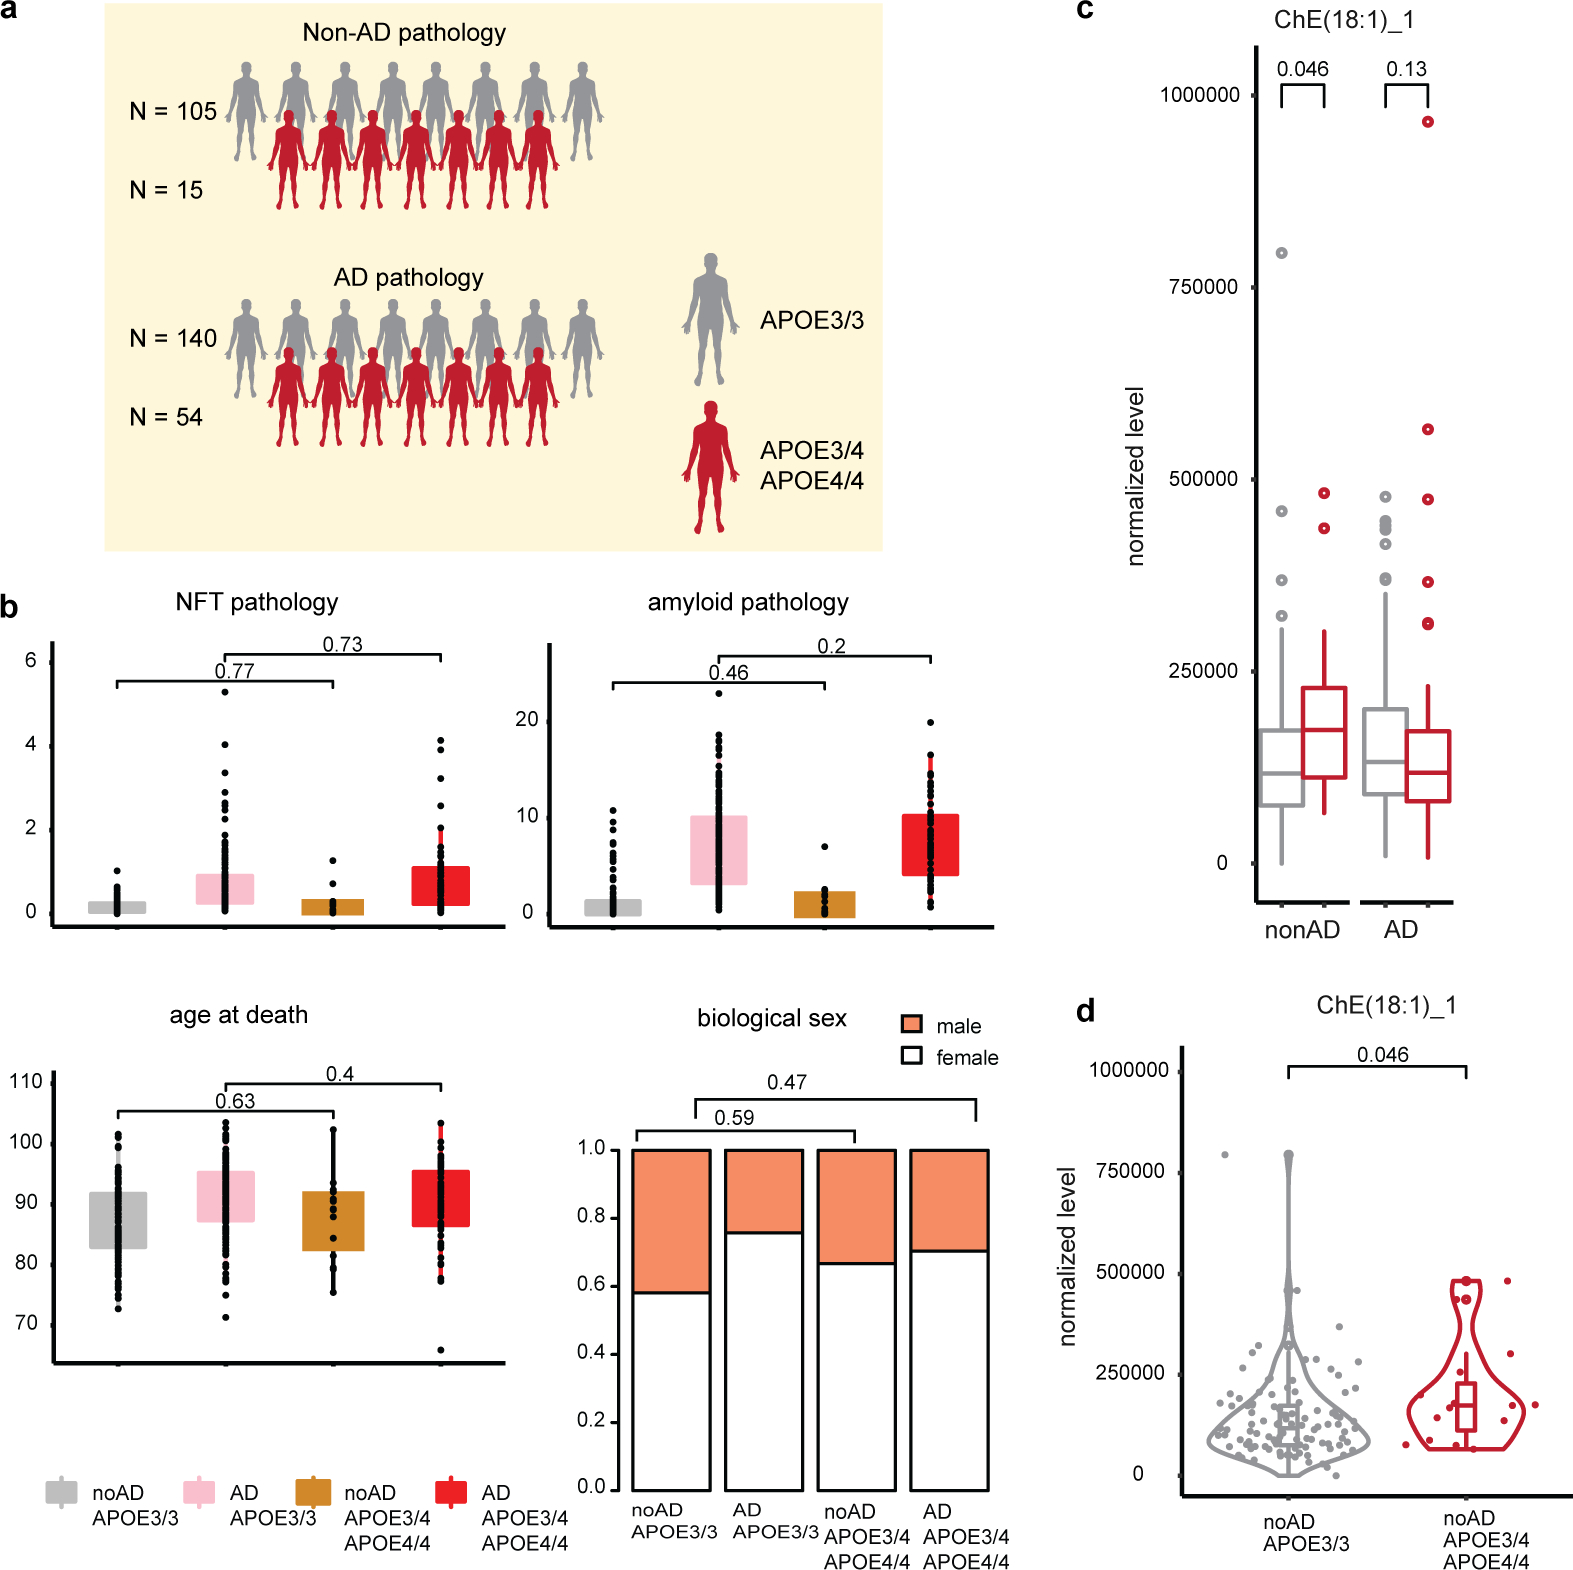
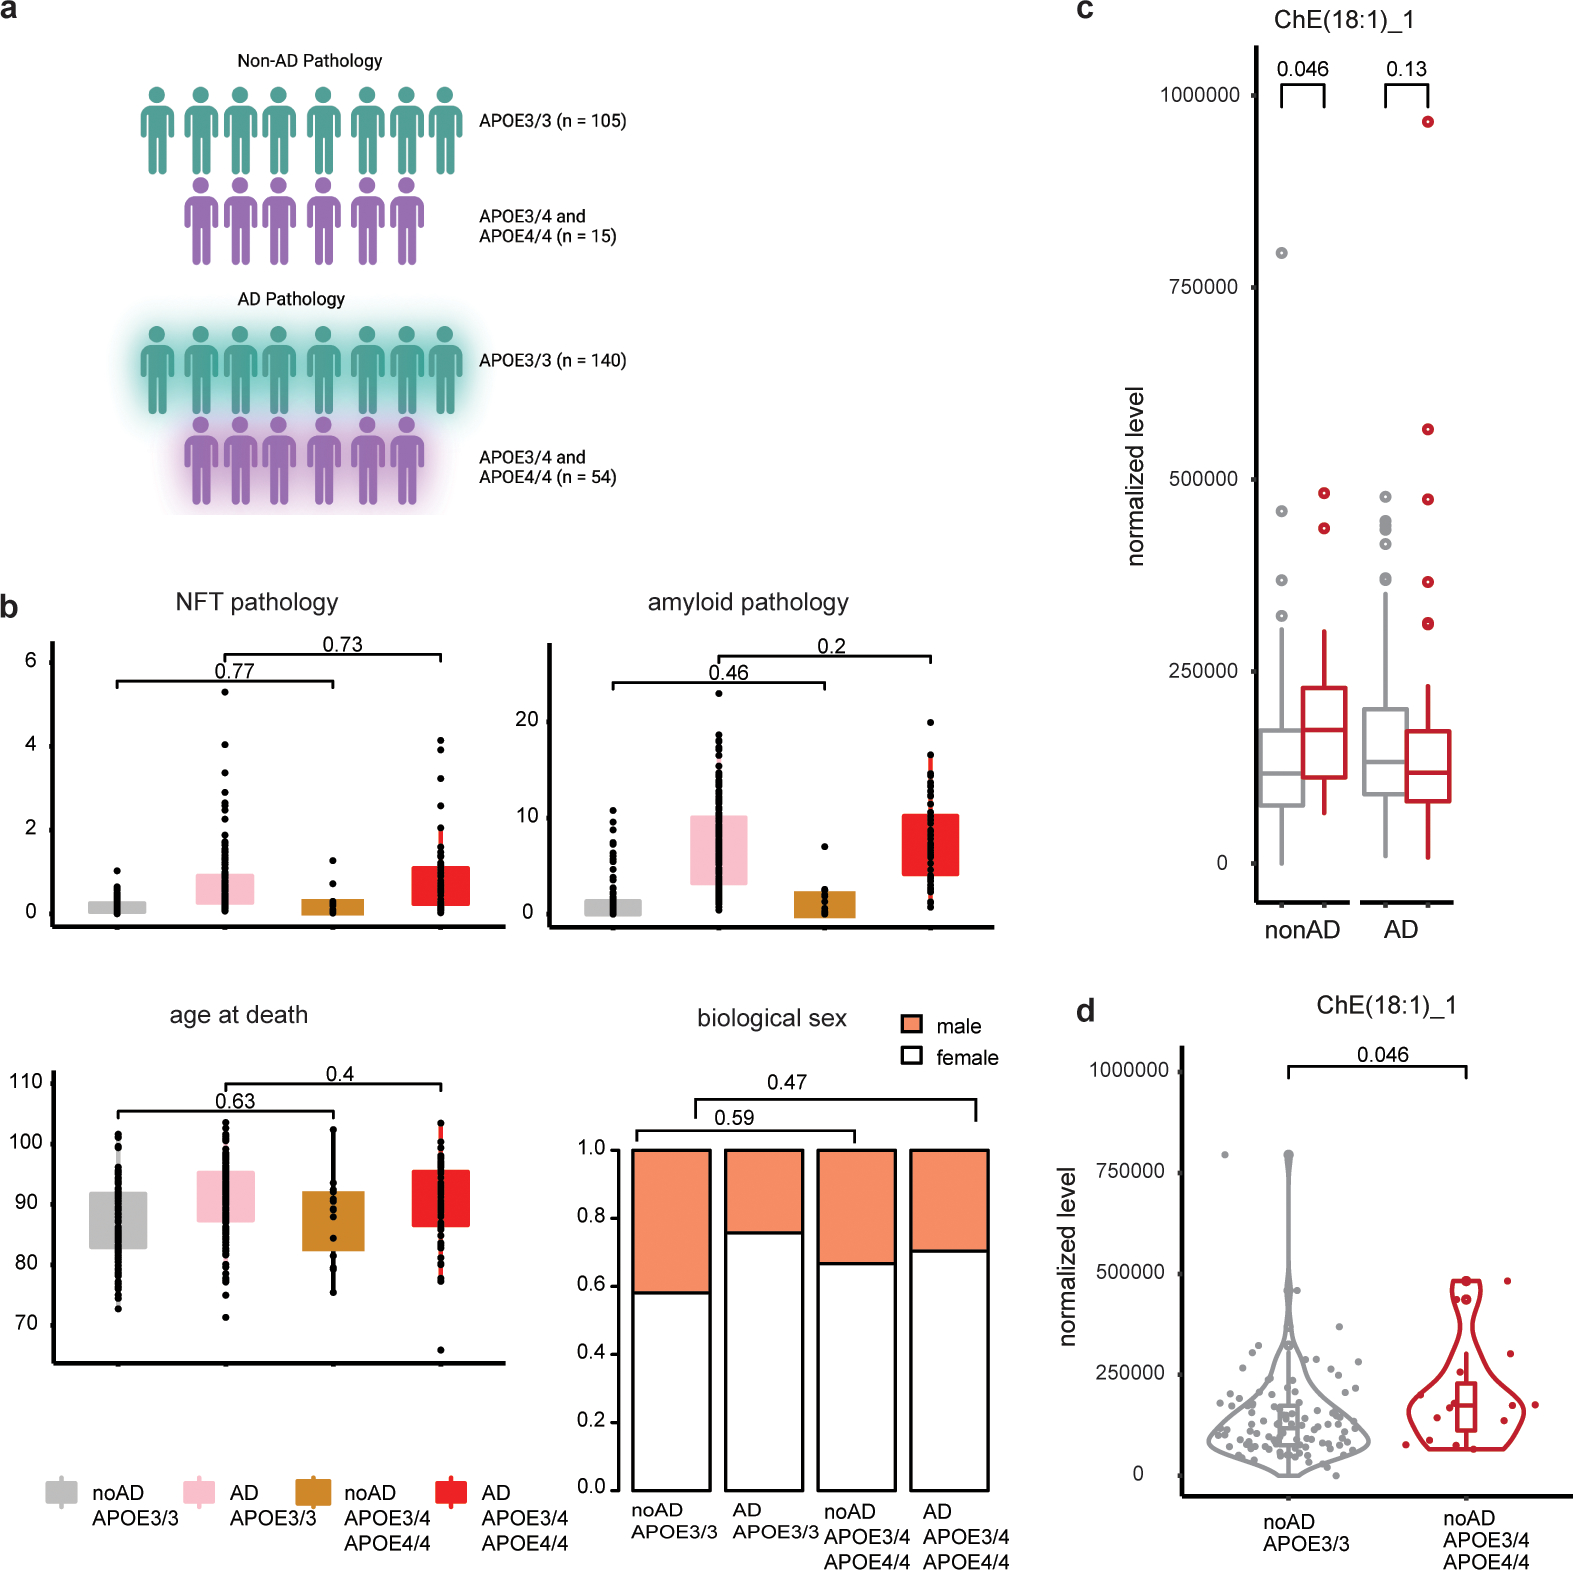
a, Overview of ROSMAP cohorts on which lipidomic analysis was performed. Cartoons generated with BioRender b, Cohort clinicopathological characteristics. NFT = neurofibrillary tangles (p values calculated with Wilcoxon rank-sum test, two-sided). c, A single cholesterol ester (ChE) species passed quality control (see Methods) and showed significant (p<0.05, Wilcoxon rank-sum test, two-sided) differential concentration when comparing APOE3/3 vs APOE3/4 and APOE4/4-carriers stratified by pathology. ChE(18:1) indicates a ChE with carboxylate position 18 and one unsaturated fatty acid bond. d, Distribution of the concentration of ChE species from c) (p-value = 0.046, Wilcoxon rank-sum test, two-sided). Boxplots indicate median, 25th and 75th percentiles.
Extended Data Fig. 4: Lipid droplets in human and mouse brain.
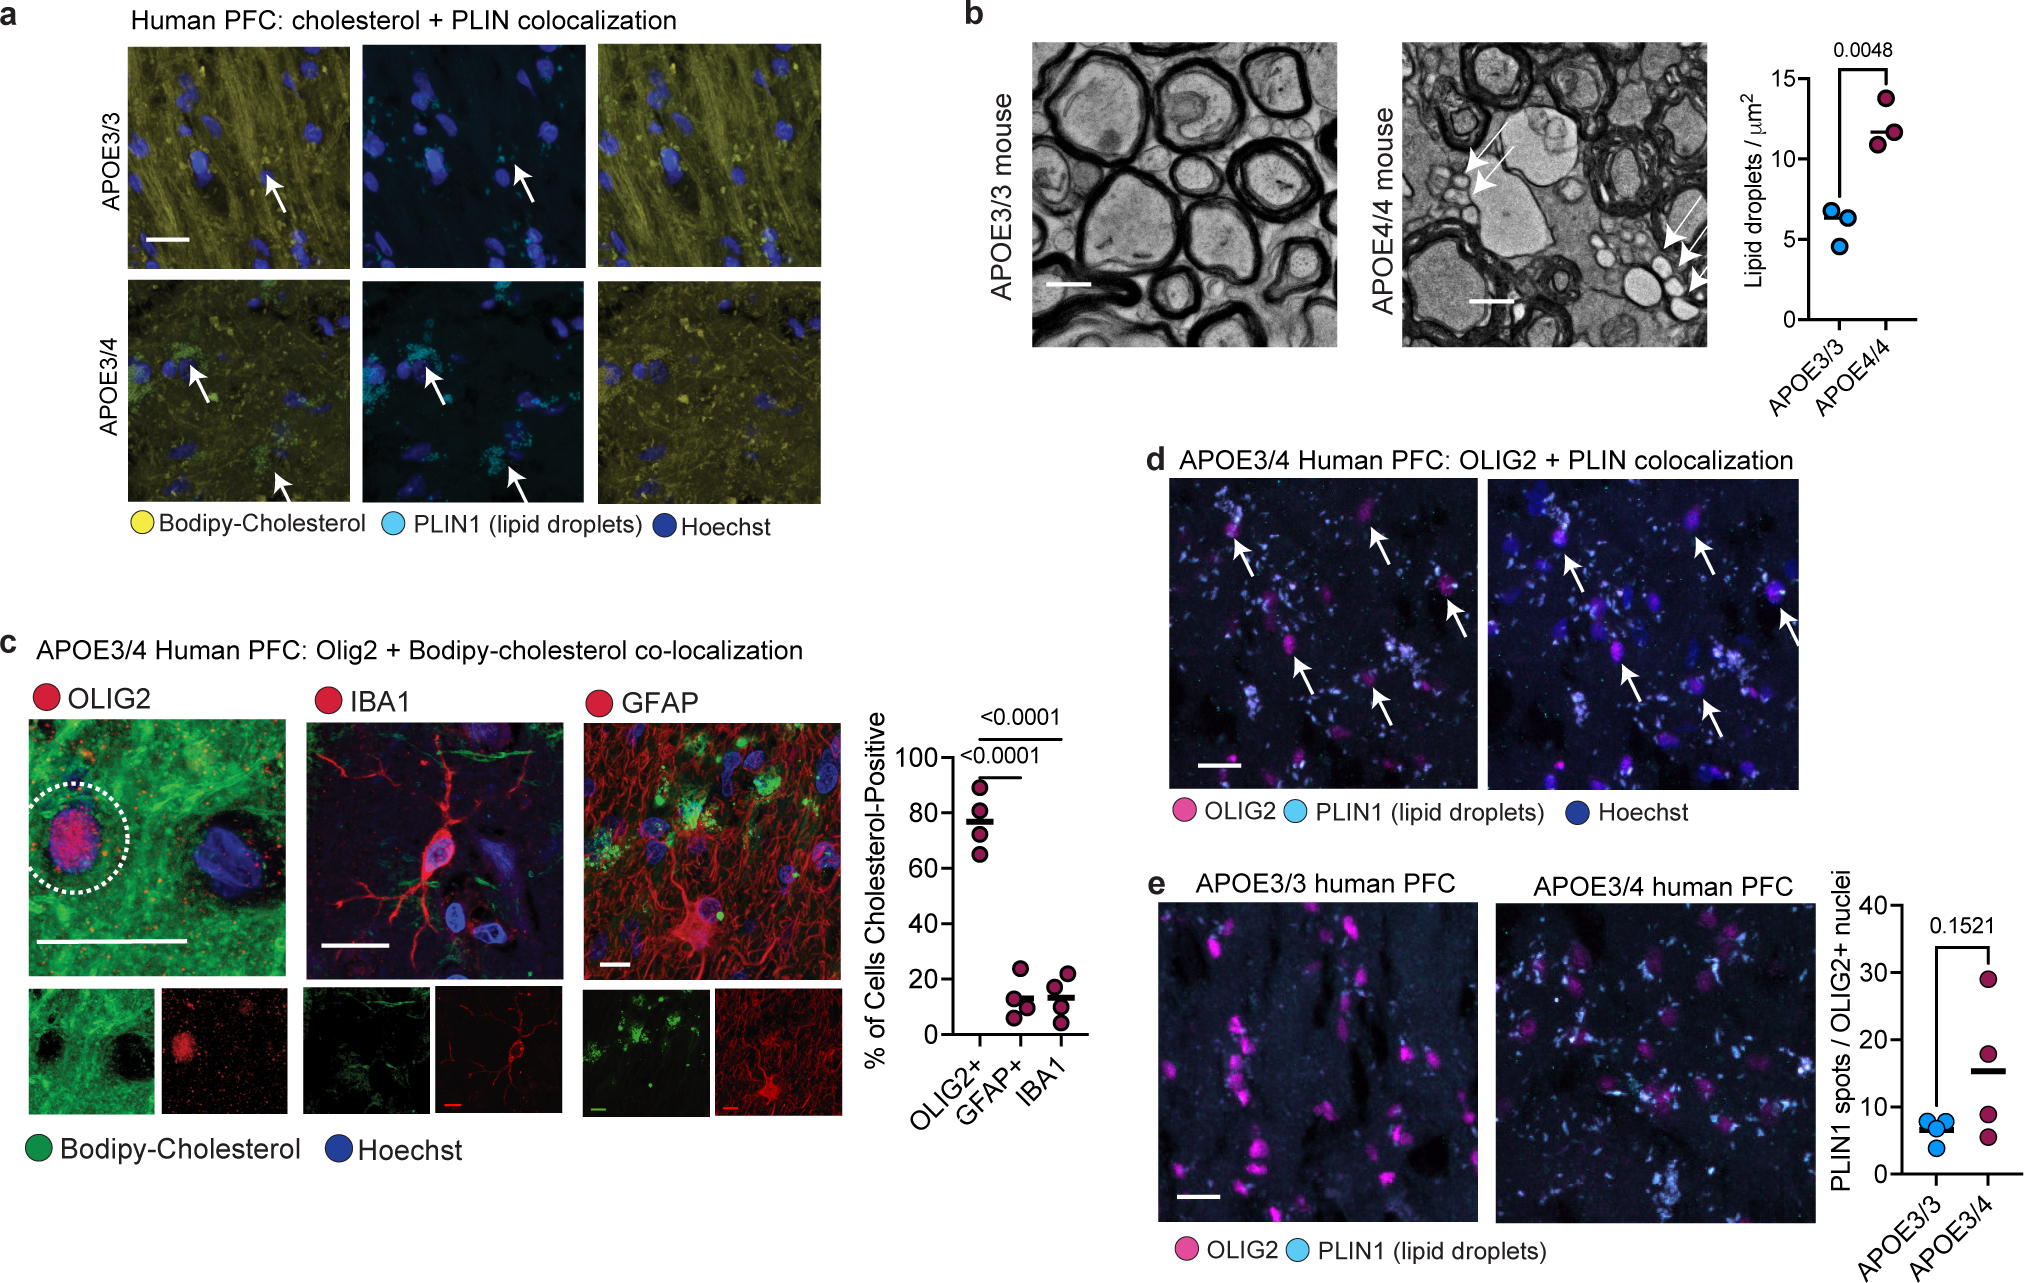
a, Co-localization of immunohistochemistry against lipid-droplet associated protein perilipin-1 (PLIN1) with Bodipy-cholesterol staining in the human prefrontal cortex from APOE3/3 and APOE3/4 individuals (n=3 imaged per genotype). Cell nuclei stained with Hoechst dye. b, Transmission electron microscopy (TEM) on corpus callosum from six-month-old APOE3-TR and APOE4-TR mice (males, n=3 per genotype). The number of lipid droplets was quantified in four 1 μm2 areas per image from three images per mouse. Right panel, dots represent mean value per mouse and bar represents mean value for group, p value was calculated using unpaired, two-tailed student’s t-test. c, Representative images of Bodipy-cholesterol staining, with markers for microglia (IBA1), astrocytes (GFAP) and oligodendrocytes (OLIG2) in the prefrontal cortex of APOE4-carriers (n = four individuals). Dotted outline in the OLIG2 panel depicts the 2 μm radius around the nucleus that was quantified for the presence of Bodipy-cholesterol. Scale bar 10 μm. Bodipy-cholesterol staining was quantified for cell type based on localization with cell type-specific markers. Bars depict means from different biological replicates. P values calculated using unpaired, two-tailed student’s t-test. The dotted outline in the OLIG2 panel depicts the 2 μm radius around the nucleus that was quantified for the presence of Bodipy-cholesterol. d, Co-localization of perilipin-1 (PLIN1) immunoreactivity around OLIG2-positive nuclei in prefrontal cortex from an APOE3/4 individual. e, Quantification of the number of perilipin-1 punctae around representative OLIG2-positive nuclei in APOE3/3 and APOE3/4 individuals (n=4 per genotype). The number of Perilipin-1 punctae was determined using Imaris software. P-value was calculated using unpaired, two-tailed student’s t-test.
Extended Data Fig. 5. Comparison of post-mortem oligodendrocytes and iPSC-derived oligodendroglia.
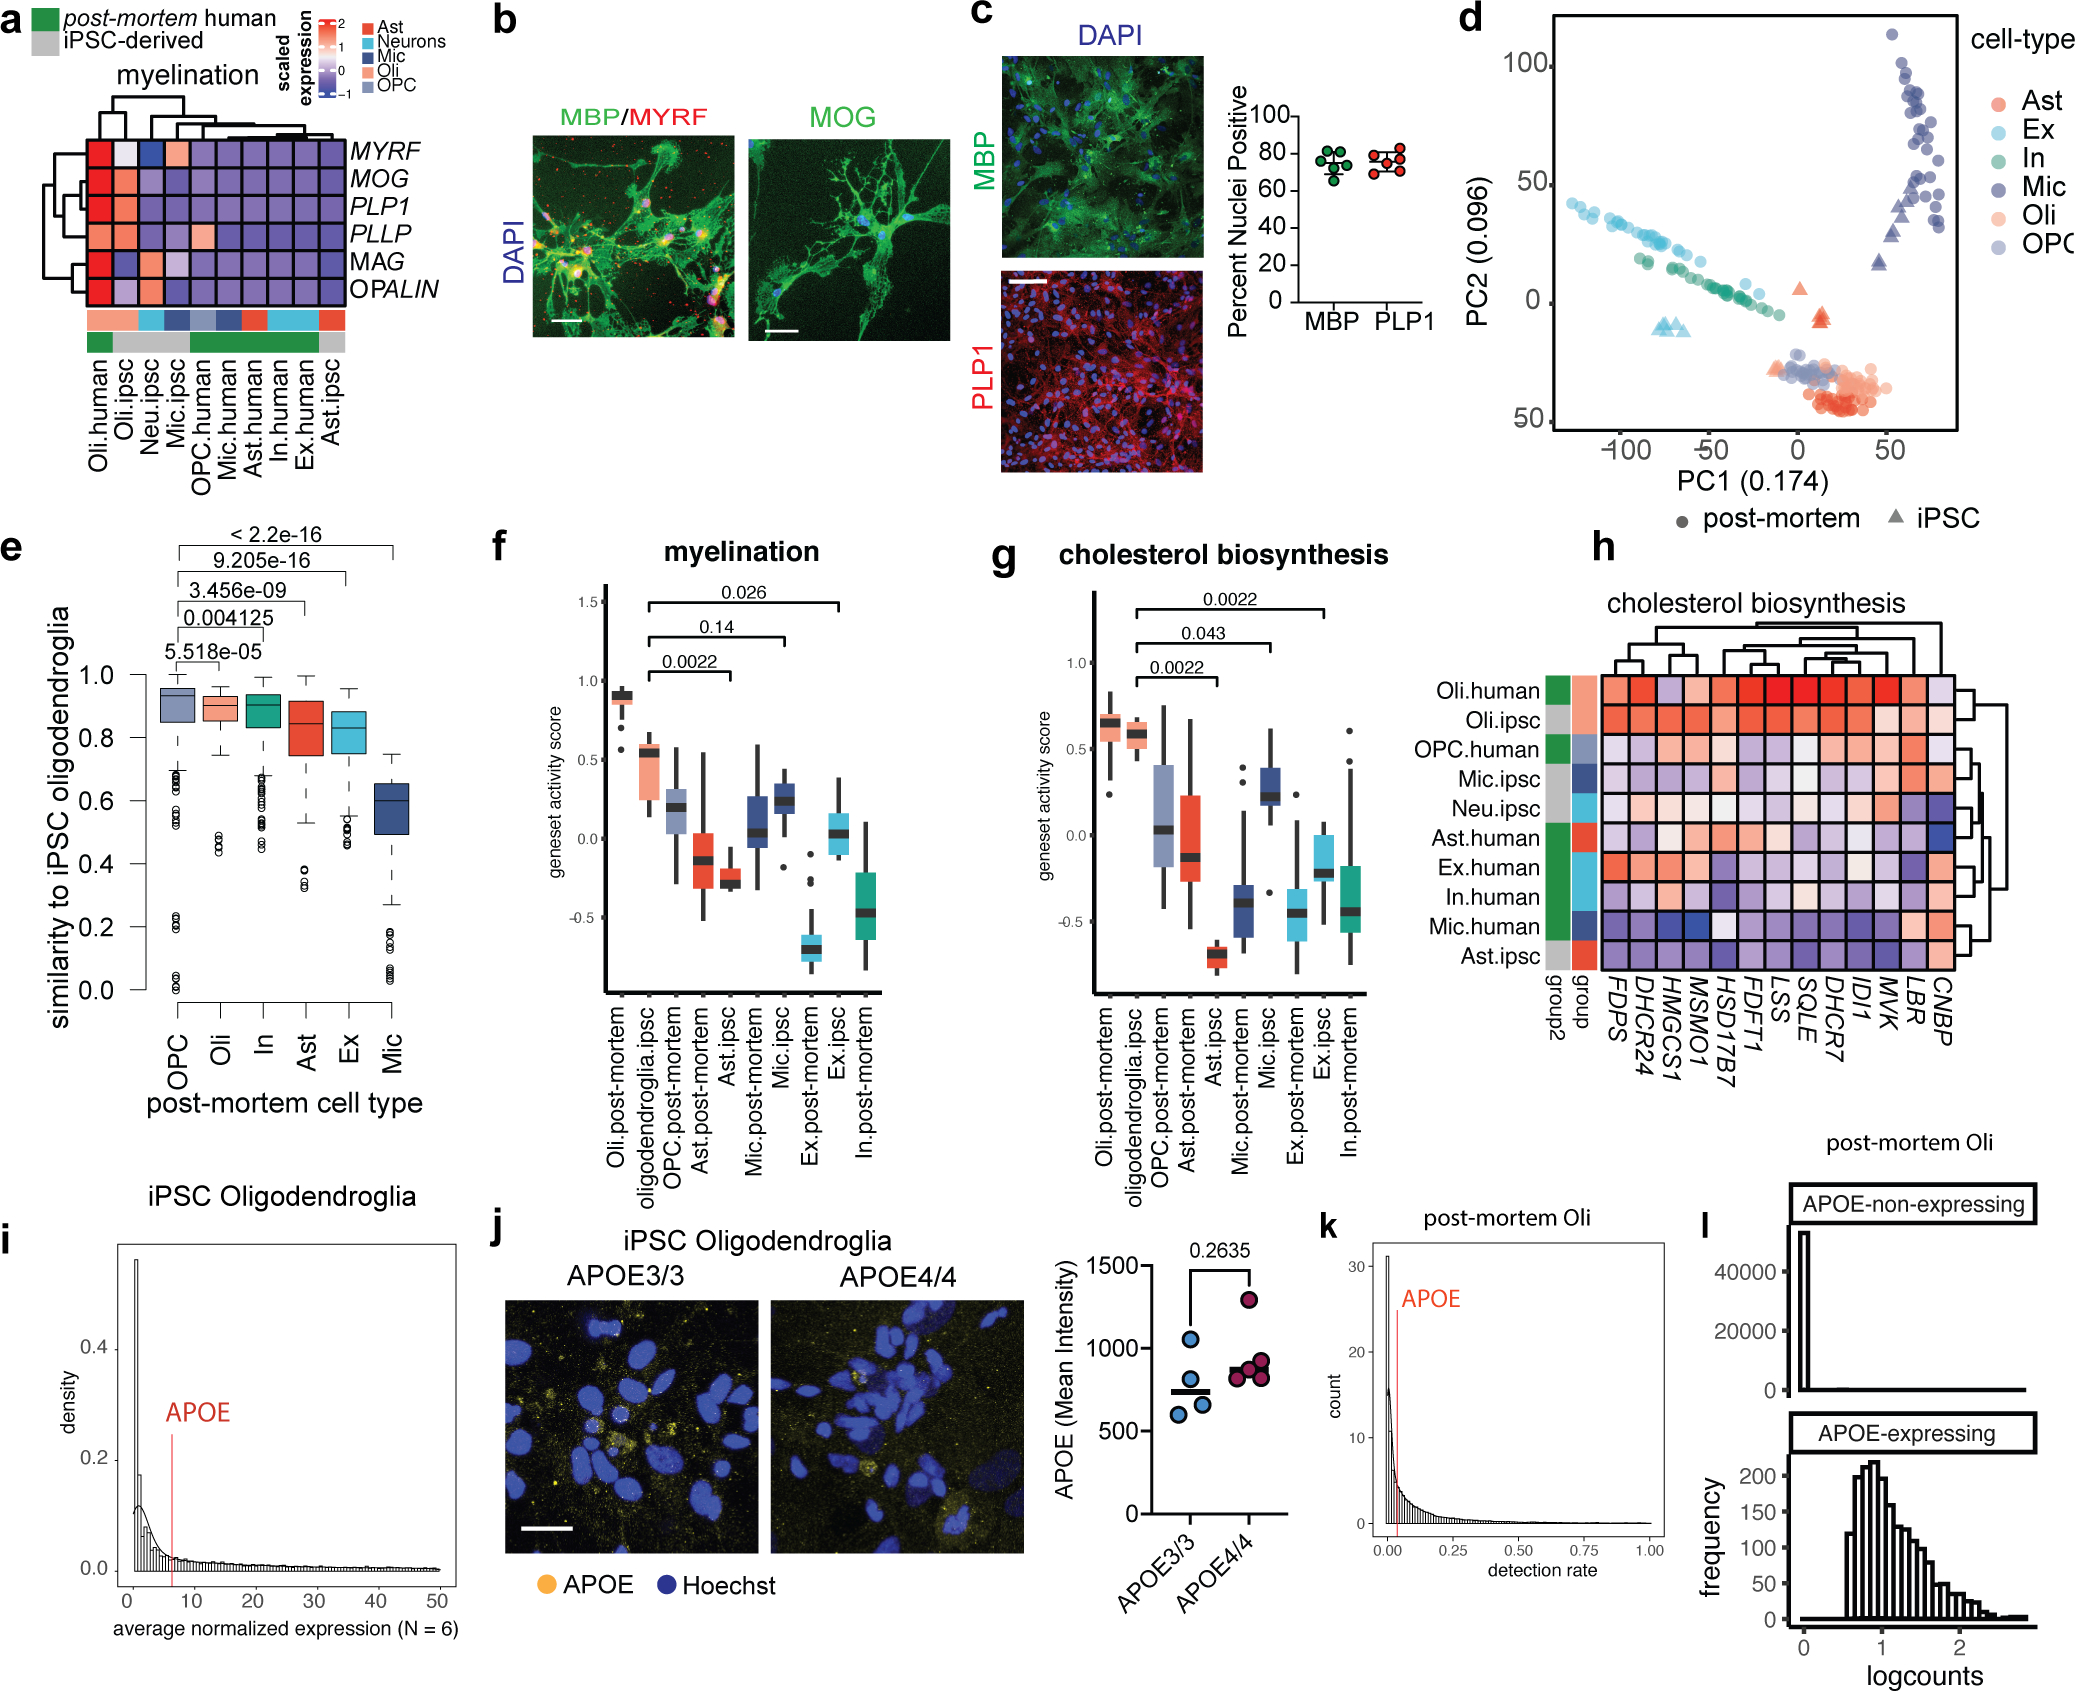
a, Comparison of the relative expression of myelination genes (MYRF, MOG, PLP1, PLLP, MAG, OPALIN) in iPSC-derived brain cell types and aggregated cell type gene expression profiles from post-mortem human brain single-nucleus data. b, Staining of MBP, MYRF, and MOG in iPSC-derived oligodendroglia. Scale bar 10 μm. c, Representative images of cultures of iPSC-derived oligodendroglia stained for PLP1 and MBP. Dots represent the percentage of nuclei positive for each marker across independent wells subjected to the same conditions (n = 5 biological replicates). Bars represent mean across all wells, error bars represent standard deviation. d, Principal component analysis of relative gene expression for post-mortem human brain cells and iPSC-derived counterparts. e, Transcriptional similarity between post-mortem human cell types and iPSC-derived oligodendroglia, p values calculated with Wilcoxon test, two-sided. Distributions represent distances between each post-mortem cell type (x-axis) and iPSC oligodendroglia in scaled gene space (N = 32 per post-mortem cell type, N = 6–8 for iPSC cell types). f-g, Gene set activity scores by GSVA on scaled expression values using genes shown in a or h, p value calculated by Wilcoxon test, two-sided. Boxplots indicate median, 25th and 75th percentiles. h, Relative expression of cholesterol-associated genes across iPSC-derived oligodendroglia, post-mortem human brain oligodendrocytes, and additional brain cell types. i, Gene expression distribution in iPSC-derived oligodendroglia. j, APOE immunoreactivity in APOE3/3 (n = 4 biological replicates) and APOE4/4 (n = 5 biological replicates) iPSC-derived oligodendroglia. Dots in right panel plots represent mean from independent images, p values were calculated with an unpaired, two-tailed student’s t-test. k, Distribution of gene nonzero detection rates in human post-mortem oligodendrocytes (snRNAseq). The nonzero APOE detection-rate is circa 4%, corresponding to circa 53rd percentile of genes. l, Distribution of expression levels for APOE-non-expressing (n = 53,095) and APOE-expressing (n = 1,882) post-mortem oligodendrocytes (snRNAseq). Groups were identified by K-means clustering on the non-zero detection rate.
Extended Data Fig. 6: Lipidomics on iPSC-derived oligodendroglia.
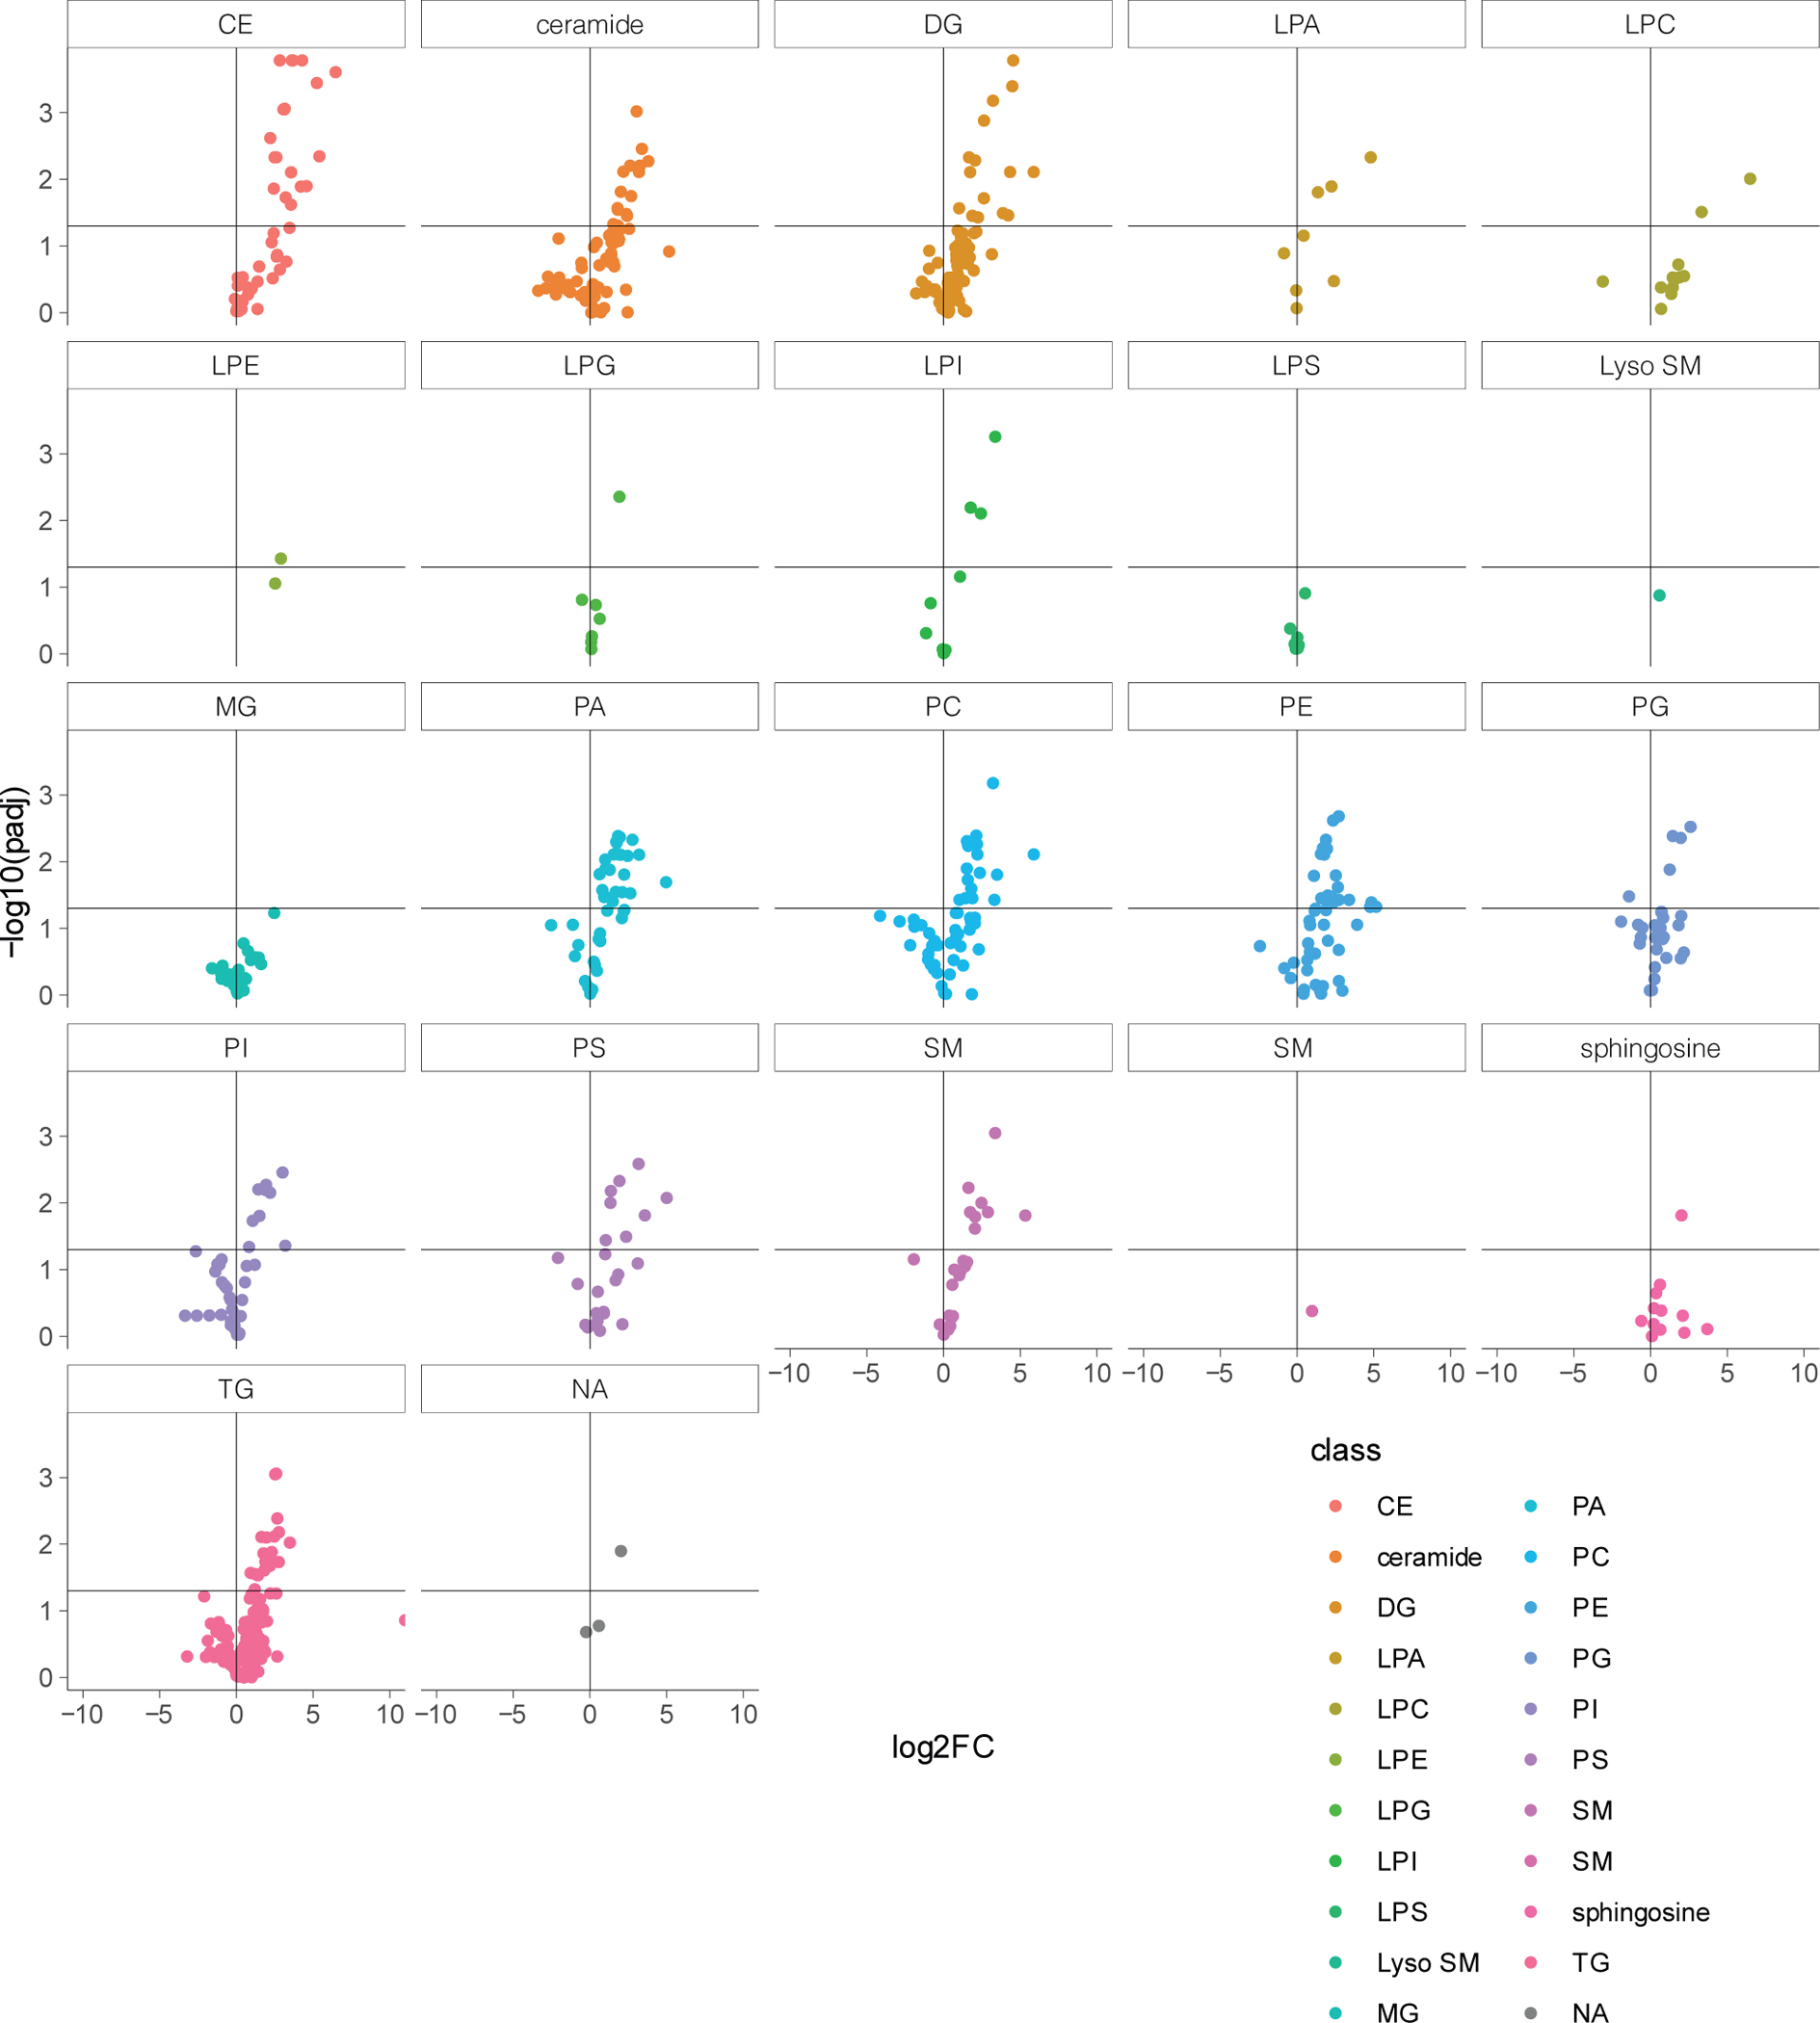
a, Volcano plots depicting differentially (adjusted p value < 0.05) detected lipid species in APOE4/4 oligodendroglia, compared to isogenic APOE3/3 controls. Each detected lipid species is organized according to lipid class, with cholesteryl esters having the highest number (15) of differentially expressed species.
Extended Data Fig. 7: Cell stress in APOE4 oligodendrocytes.
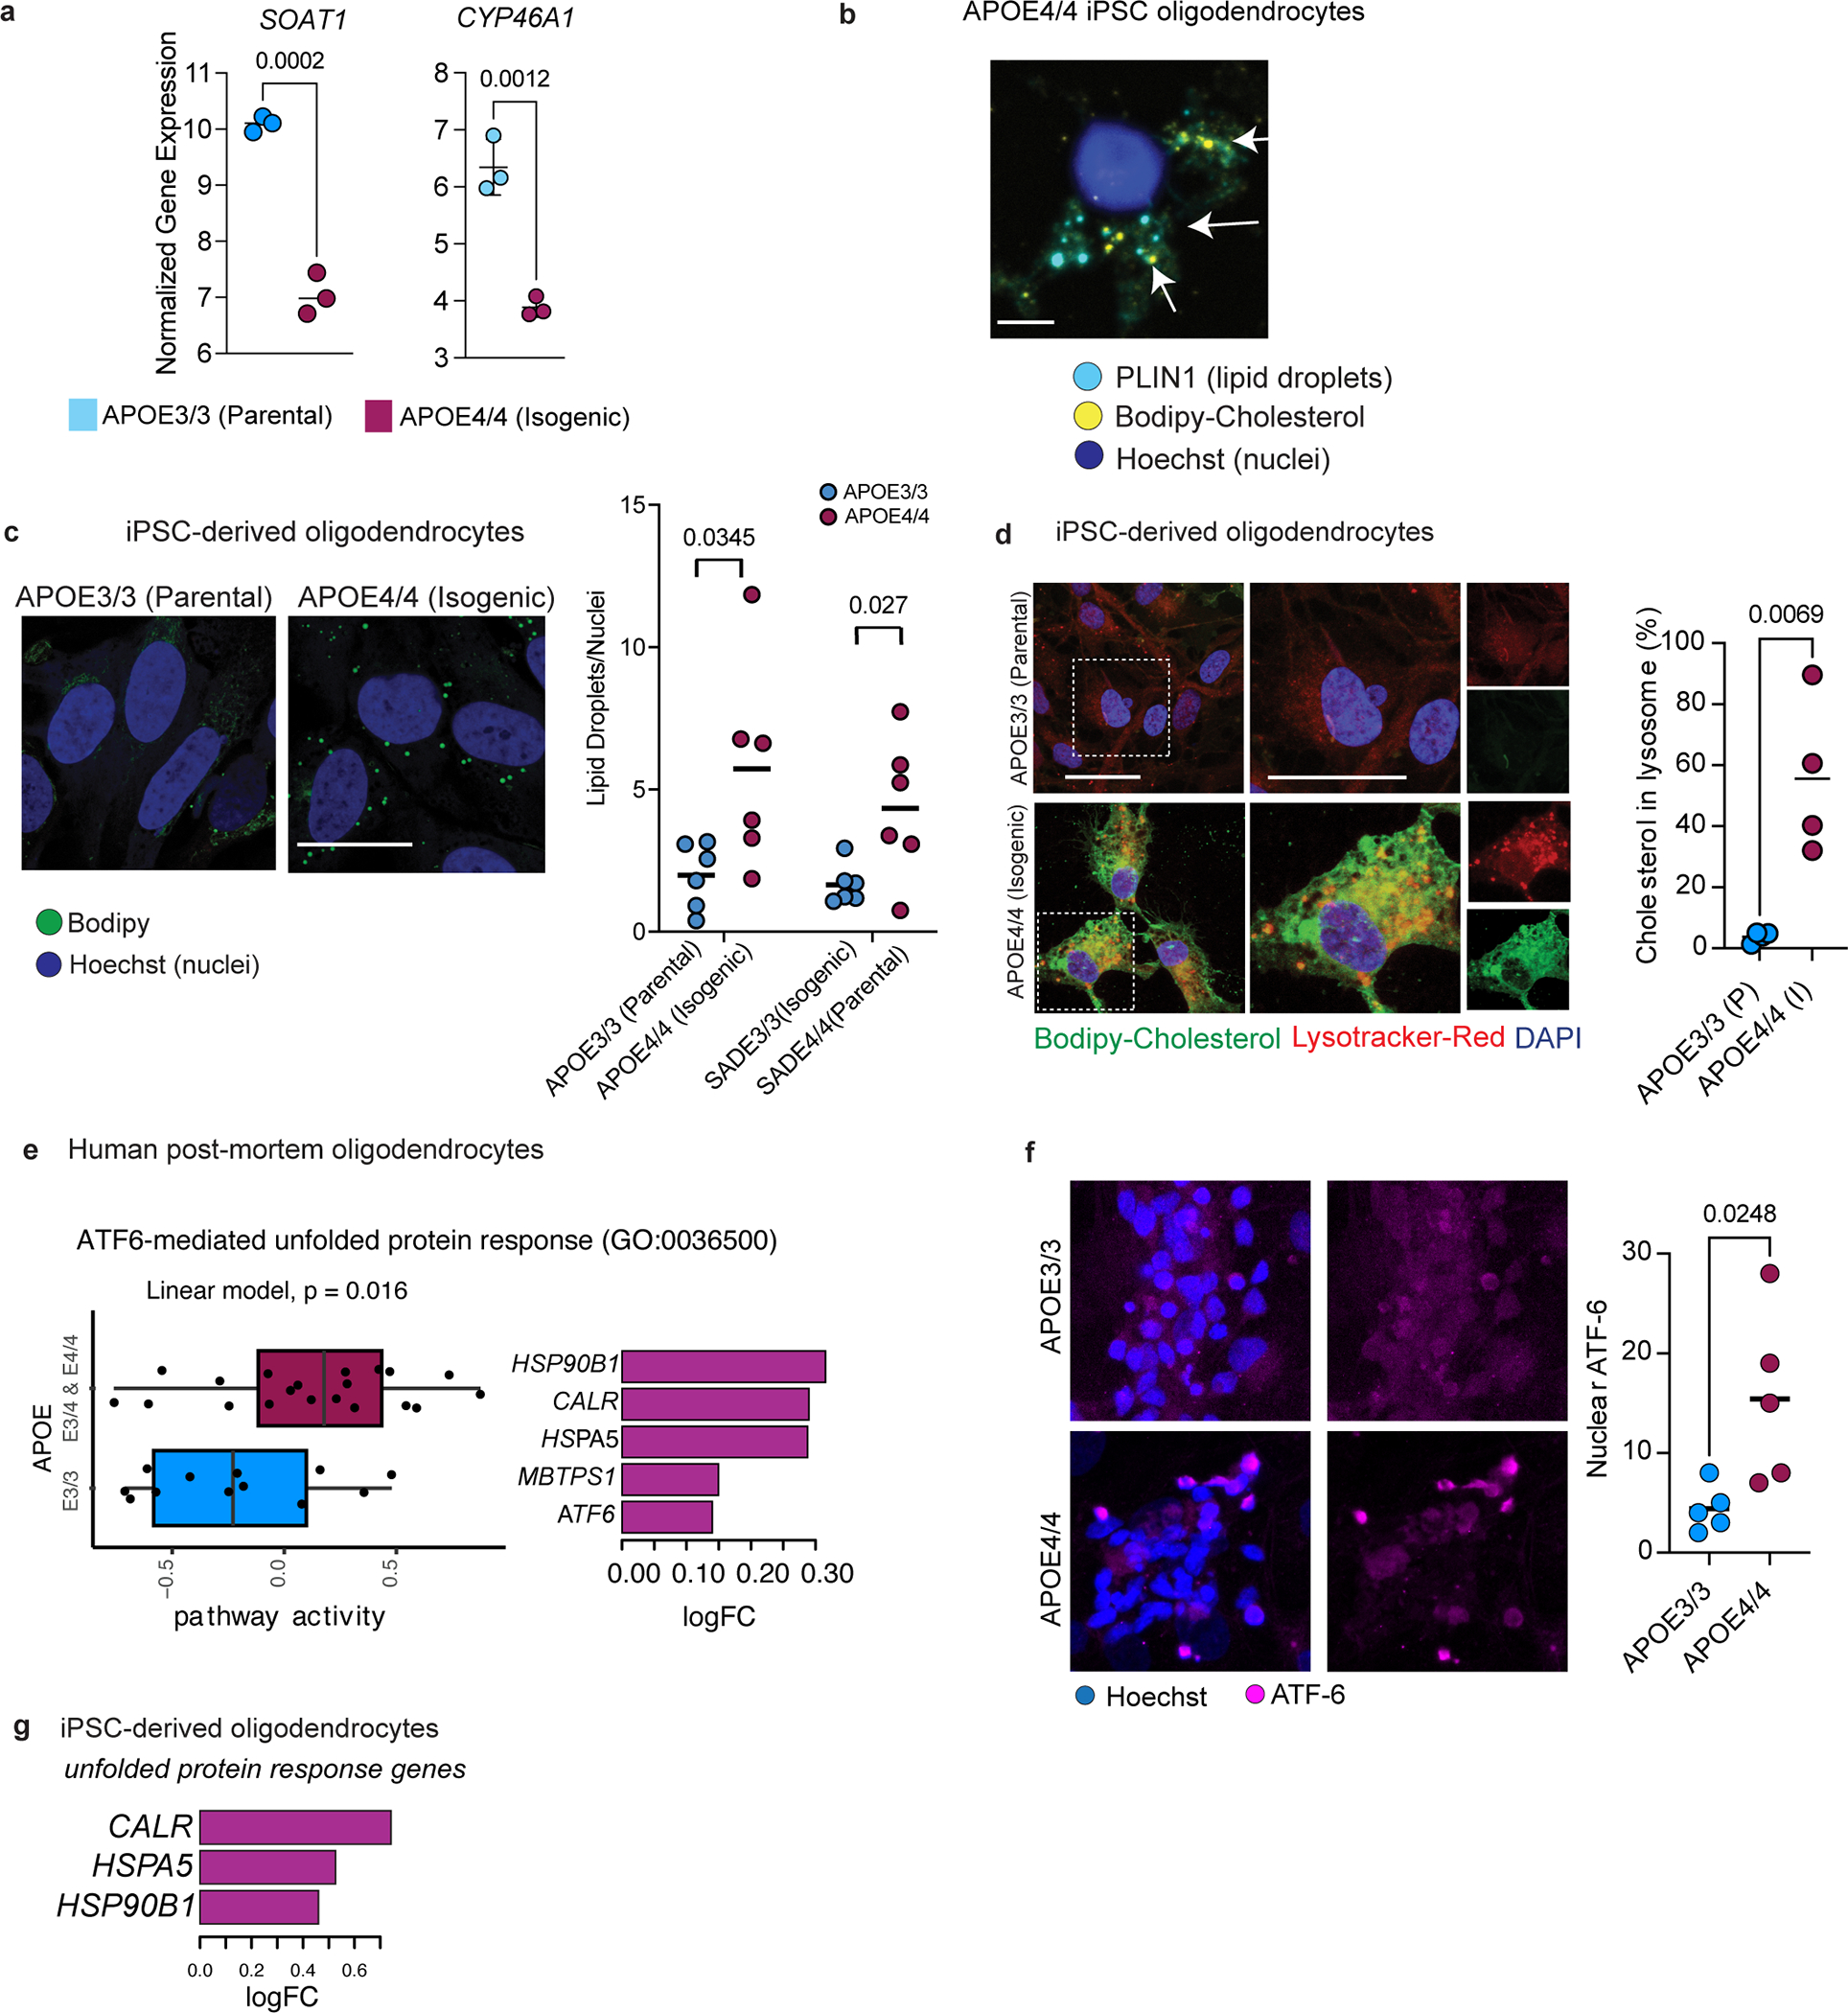
a, mRNA expression levels of SOAT1 (ACAT1) and CYP46A1 from bulk sequencing of isogenic iPSC-derived APOE3/3 and APOE4/4 oligodendroglia (n=3 biological replicates per genotype, adjusted p values shown, computed by linear model). b, Perilipin-1 (PLIN1) immunoreactivity in APOE4/4 iPSC-derived oligodendroglia, and PLIN1 co-localization with Bodipy-cholesterol staining in APOE4/4 iPSC-derived oligodendroglia. c, Representative Bodipy staining for lipid droplets (n = 6 biological replicates). Scale bar represents 10 μm. Lipid droplets were quantified in two different isogenic sets of APOE3/3 and APOE4/4 oligodendroglia, that were generated from different individuals. Data points represent biological replicates and bars show means. p values were calculated using an unpaired, two-tailed student’s t-test. d, Percent of Bodipy-cholesterol staining in lysosome. Quantification was performed using ImageJ software with the same threshold setting for all images and conditions. Data points represent the mean of four images from one biological replicate. Bars represent means from four biological replicates. p value was calculated using unpaired, two-tailed student’s t-test. e, (left) Box plot of ATF-6 mediated unfolded protein response gene set activity (computed by GSVA) in human post-mortem oligodendrocytes. unadjusted p-value = 0.016, linear model. Boxplots indicate median, 25th and 75th percentiles. (right) Pathway gene members that are differentially expressed (FDR < 0.05, negative binomial mixed model) f, Representative images of immunohistochemistry against ATF-6 protein in APOE3/3 and APOE4/4 iPSC-derived oligodendrocytes, and quantification of number of cells with nuclear ATF-6 immunoreactivity (n = 5 biological replicates). Dots represent technical replicates, and bars represent mean per genotype. p value was calculated using an unpaired, two-tailed student’s t-test. g, Fold change for unfolded protein response genes in APOE4/4 vs APOE3/3 oligodendroglia (N = 3 per genotype) from panel e (adjusted p-value < 0.05, negative binomial distribution).
Extended Data Fig. 8: Myelin expression in humans and mice.
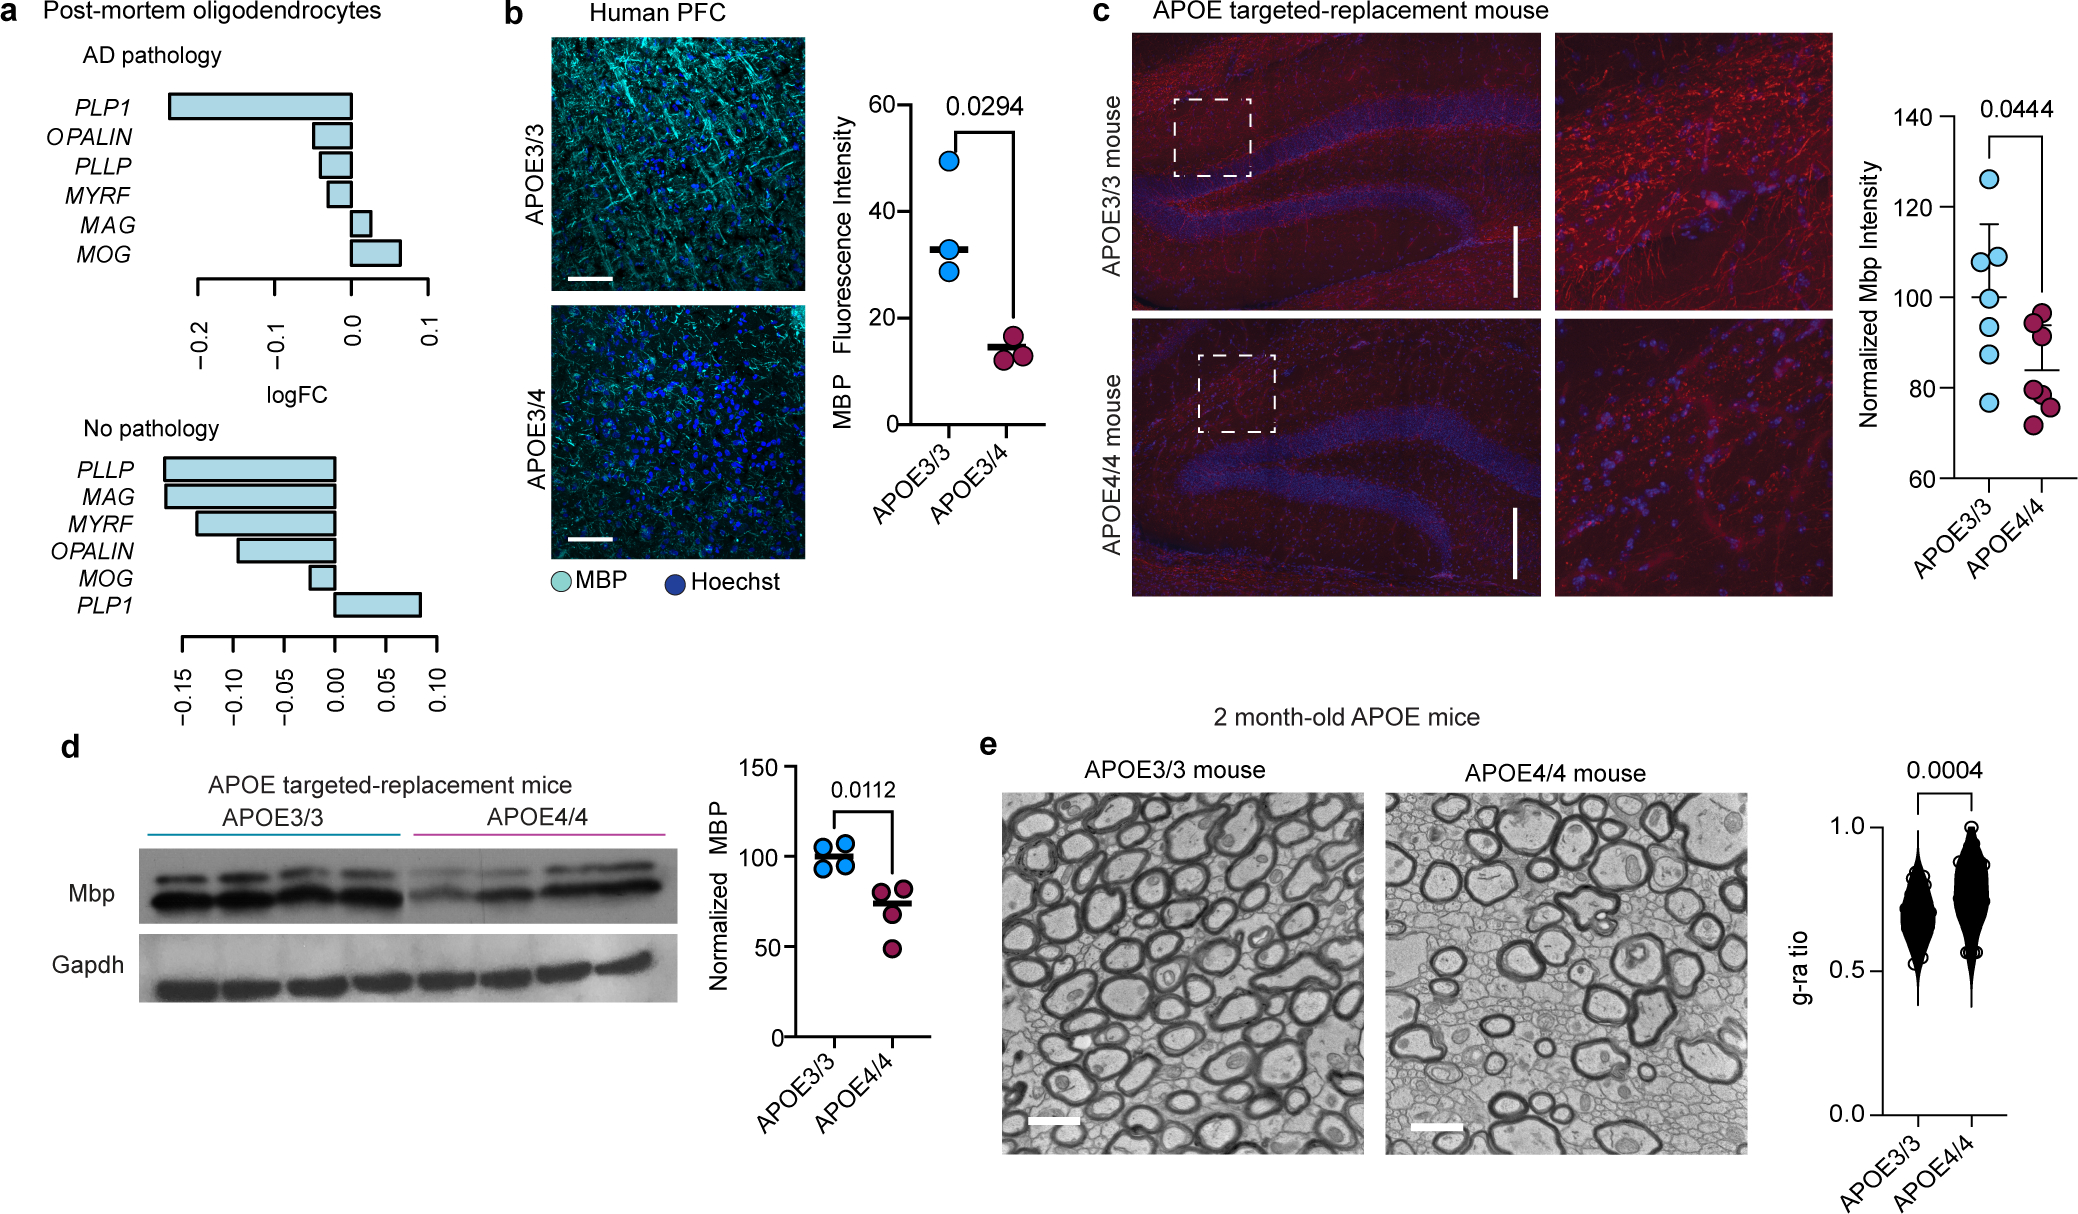
a, Myelin-associated gene expression changes in APOE3/3 vs APOE3/4 post-mortem oligodendrocytes for individuals with and without AD pathology (logFC<0 indicates down in APOE3/4; Wilcoxon test by wilcoxauc(), adjusted p value < 0.05). b, Immunohistochemistry for Myelin Basic Protein (MBP) in APOE3/3 and APOE3/4 individuals with AD diagnosis (n=3 per genotype), and quantification. Mean fluorescence intensity quantified using FIJI ImageJ software. Dots represent mean value calculated from four images from one individual, and bars represent mean value from three separate individuals for each genotype. p value was calculated using an unpaired, two-tailed student’s t-test. c, Immunohistochemistry for myelin basic protein (MBP) in hippocampal slices of APOE3/3-TR (n = 7 mice) and APOE4/4-TR (n = 7 mice) at nine months of age, quantified according to mean fluorescence intensity. Quantification was performed using ImageJ. Bars represent mean intensity from all mice for each genotype, and error bars represent standard deviation. p values were calculated using unpaired, two-tailed student’s t-test. Scale bar represent 200 μm. d, Western Blot for Myelin Basic Protein (MBP) in APOE3/3-TR (n=4) and APOE4/4-TR (n=4) mouse cortex at six months of age. Each lane is a brain lysate prepared from a different mouse. Total area and intensity of bands normalized to GAPDH was quantified via ImageJ using mean intensity for each band. Bars represent means. p value was calculated using an unpaired, two-tailed student’s t-test. e, TEM on corpus callosum from APOE3/3-TR (n=3) and APOE4/4-TR (n=3) knock-in mice at 2 months of age. G-ratio was quantified using ImageJ software as stated in Main Figure 4d). Scale bar represents 500 μm. Data points representing g-ratios for axons from each genotype, p value was calculated using an unpaired Wilcoxon test.
Extended Data Fig. 9: Myelin expression in iPSC-derived oligodendrocyte cultures.
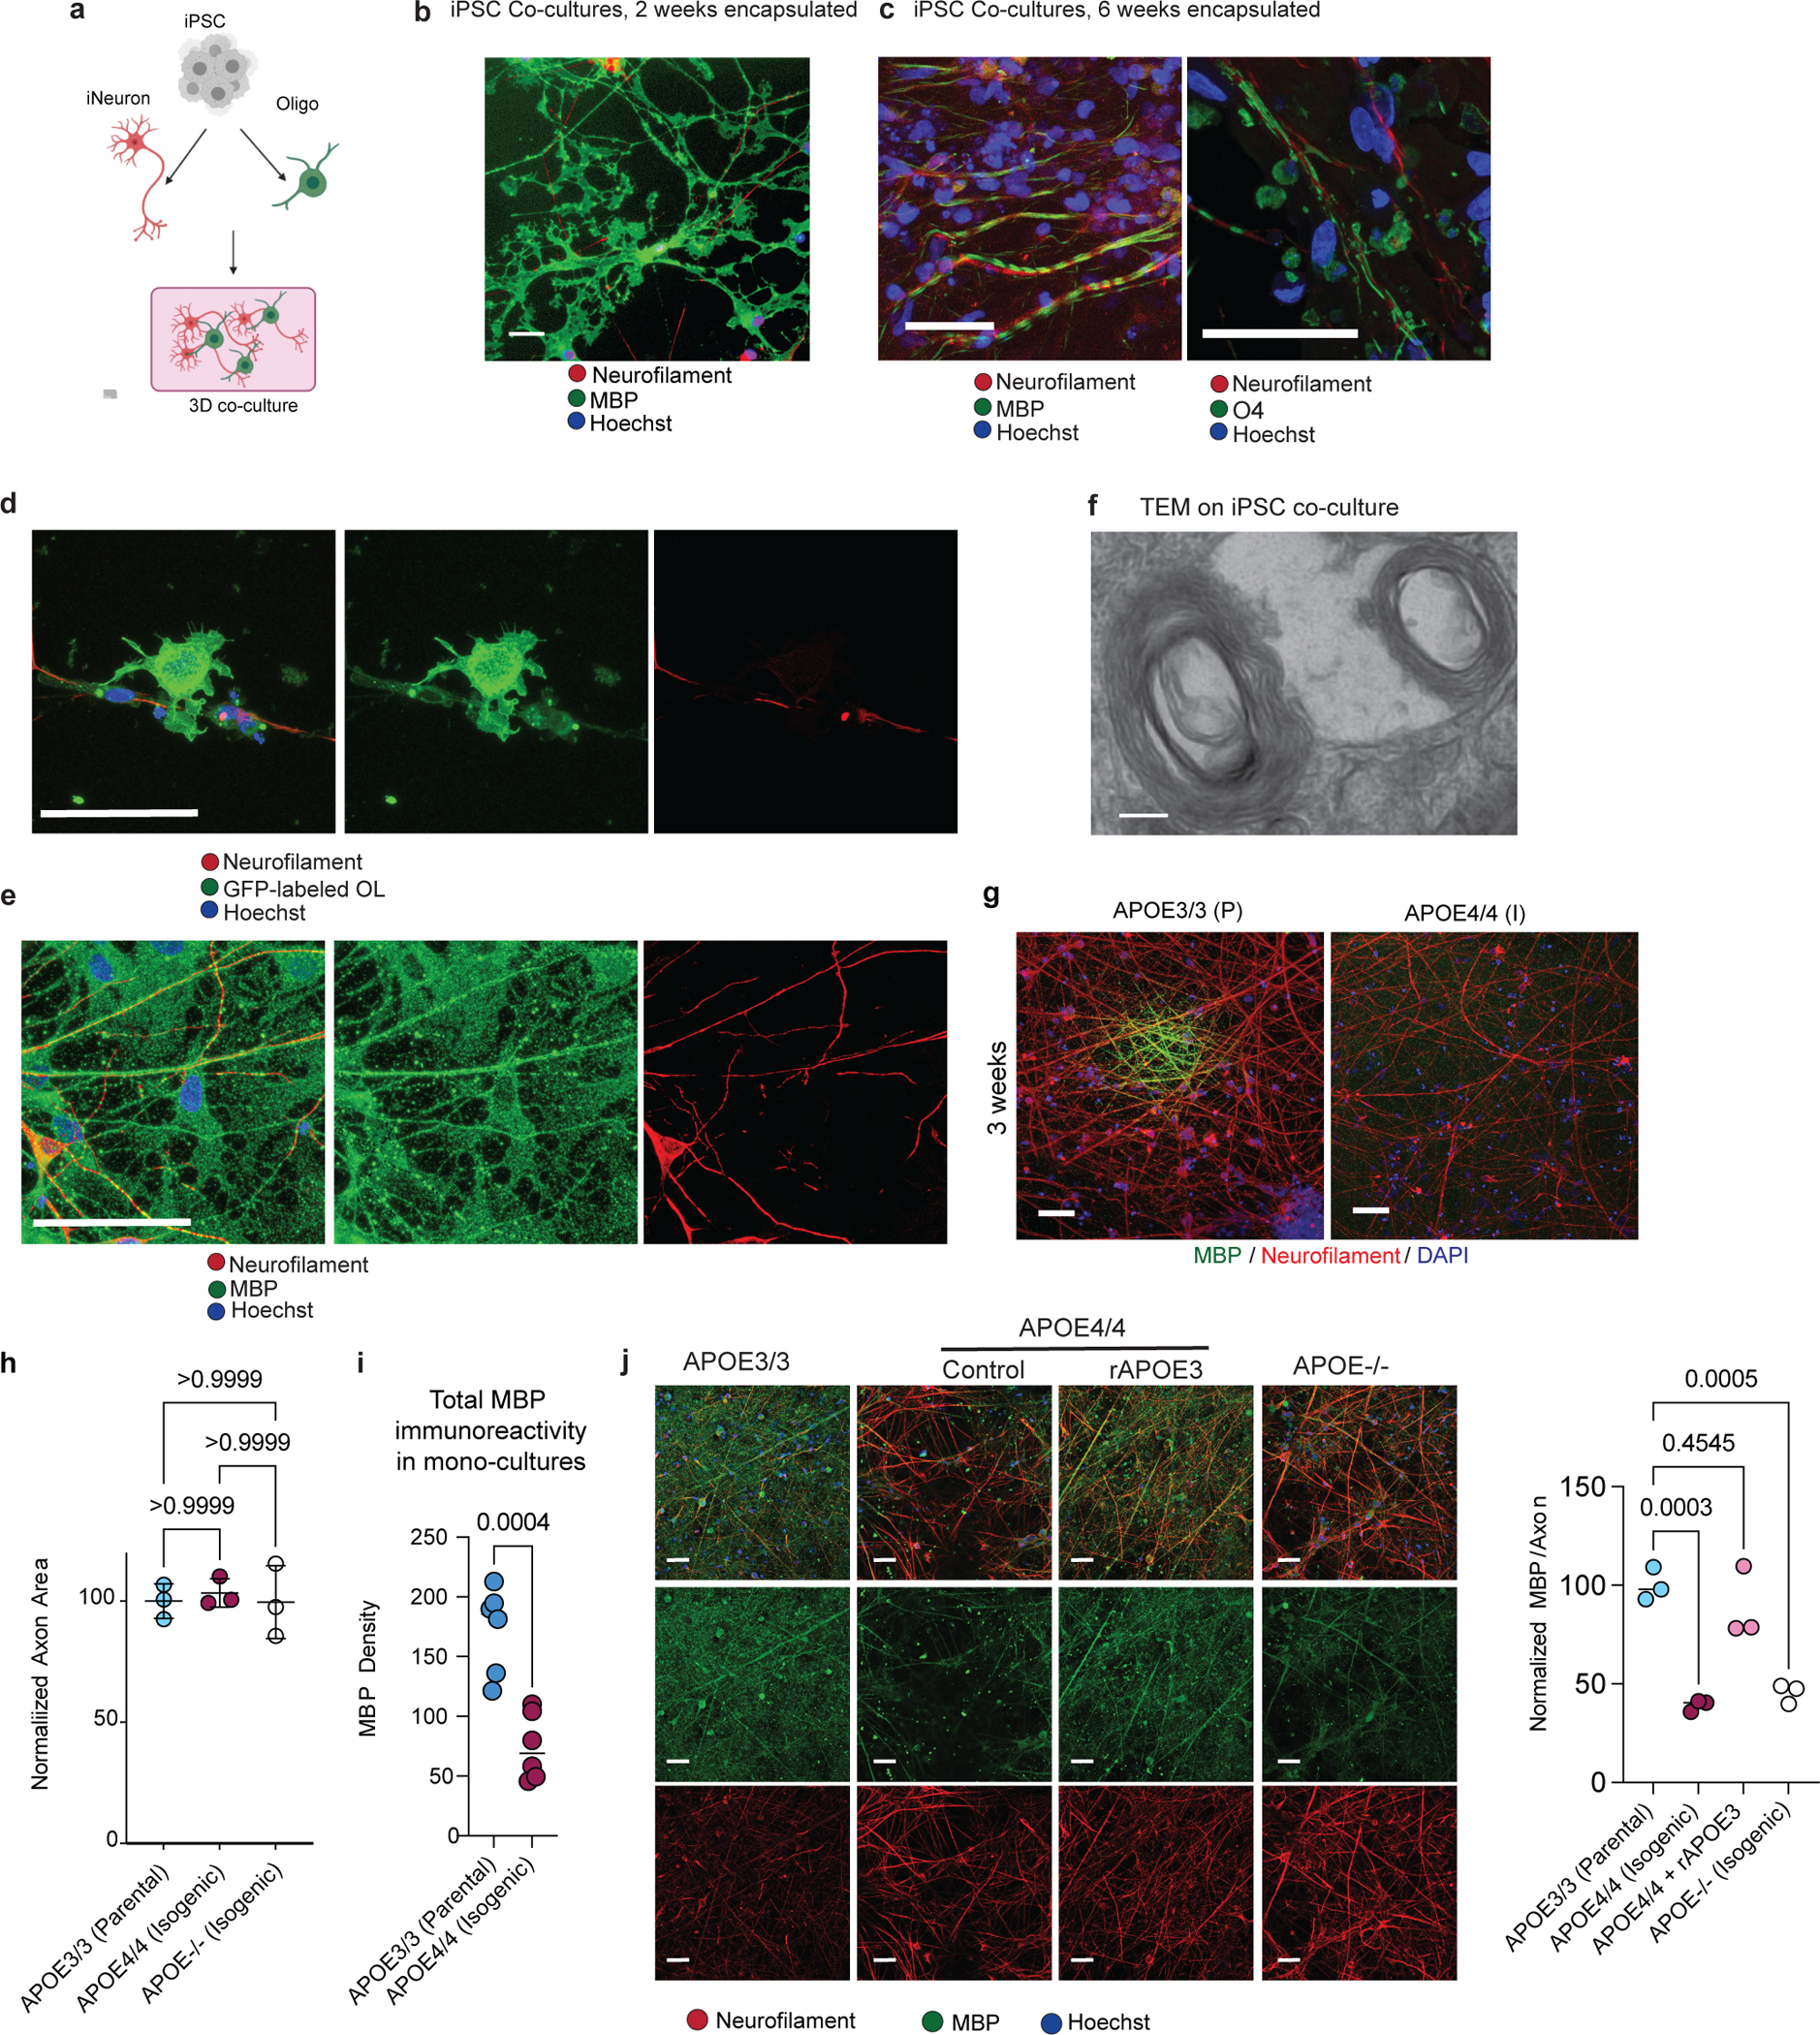
a, Schematic of iPSC-derived NGN2-induced neuron (iNeuron) and oligodendrocyte encapsulation in Matrigel. Cartoons generated with BioRender b, Representative image of Neurofilament (red), Myelin Basic Protein (green), and Hoechst (blue) immunoreactivity in iPSC-derived neuron and oligodendrocyte co-culture, after two weeks encapsulated. Scale bar represents 50 μm. c, Representative images of (left) Neurofilament (red), MBP (green), and Hoechst (blue), and (right) Neurofilament (red), O4 (green), and Hoechst (blue) immunoreactivity in iPSC-derived neuron and oligodendrocyte co-culture, after six weeks encapsulated. Scale bar represents 50 μm. d, iPSC-derived oligodendroglia were labeled with GFP to visualize cellular localization after six weeks of co-culture with NGN2-induced neurons. Scale bar represents 50 μm. e, Representative image of Neurofilament (red), MBP (green), and Hoechst (blue), and Neurofilament (red), and Hoechst (blue) immunoreactivity in iPSC-derived oligodendroglia and NGN2-induced neuron after six weeks of co-culture. Scale bar represents 50 μm. f, TEM on myelinated axon from iPSC-derived neuron and oligodendrocyte co-culture, suggesting presence of myelin rings. g, Representative images showing Neurofilament (red), MBP (green) immunoreactivity in APOE3/3 parental and APOE4/4 isogenic co-cultures after three weeks encapsulated. Scale bar represents 10 μm. h, Axonal area per co-culture, comparing APOE3/3 (parental), APOE4/4 (isogenic) and APOE−/− (isogenic) co-cultures (n = 3 biological replicates). Axonal area was calculated by measuring the area immunoreactive to neurofilament, and normalized to APOE3/3. Bars represent means, error bars represent standard deviation, and p values were calculated using one-way ANOVA with Bonferroni correction. i, MBP density between APOE3/3 (parental) and APOE4/4 (isogenic) mono-cultures (n = 6 biological replicates) P value represents unpaired, two-tailed student’s t-test. j, Representative images showing Neurofilament (red), and MBP (green) immunoreactivity in APOE3/3 (parental), APOE4/4 (isogenic), APOE4/4 (isogenic) with recombinant human APOE3 protein, and APOE knock-out (isogenic) co-culture conditions (n = 3 biological replicates). The area of neuronal axon (immunoreactive against Neurofilament) positive for MBP was calculated using Imaris, and each experimental condition was compared to the APOE3/3 control condition. P values were calculated using one-way ANOVA with Bonferroni correction.
Extended Data Fig. 10: (2-Hydroxypropyl)-beta-cyclodextrin treatment in APOE4 knock-in mice.
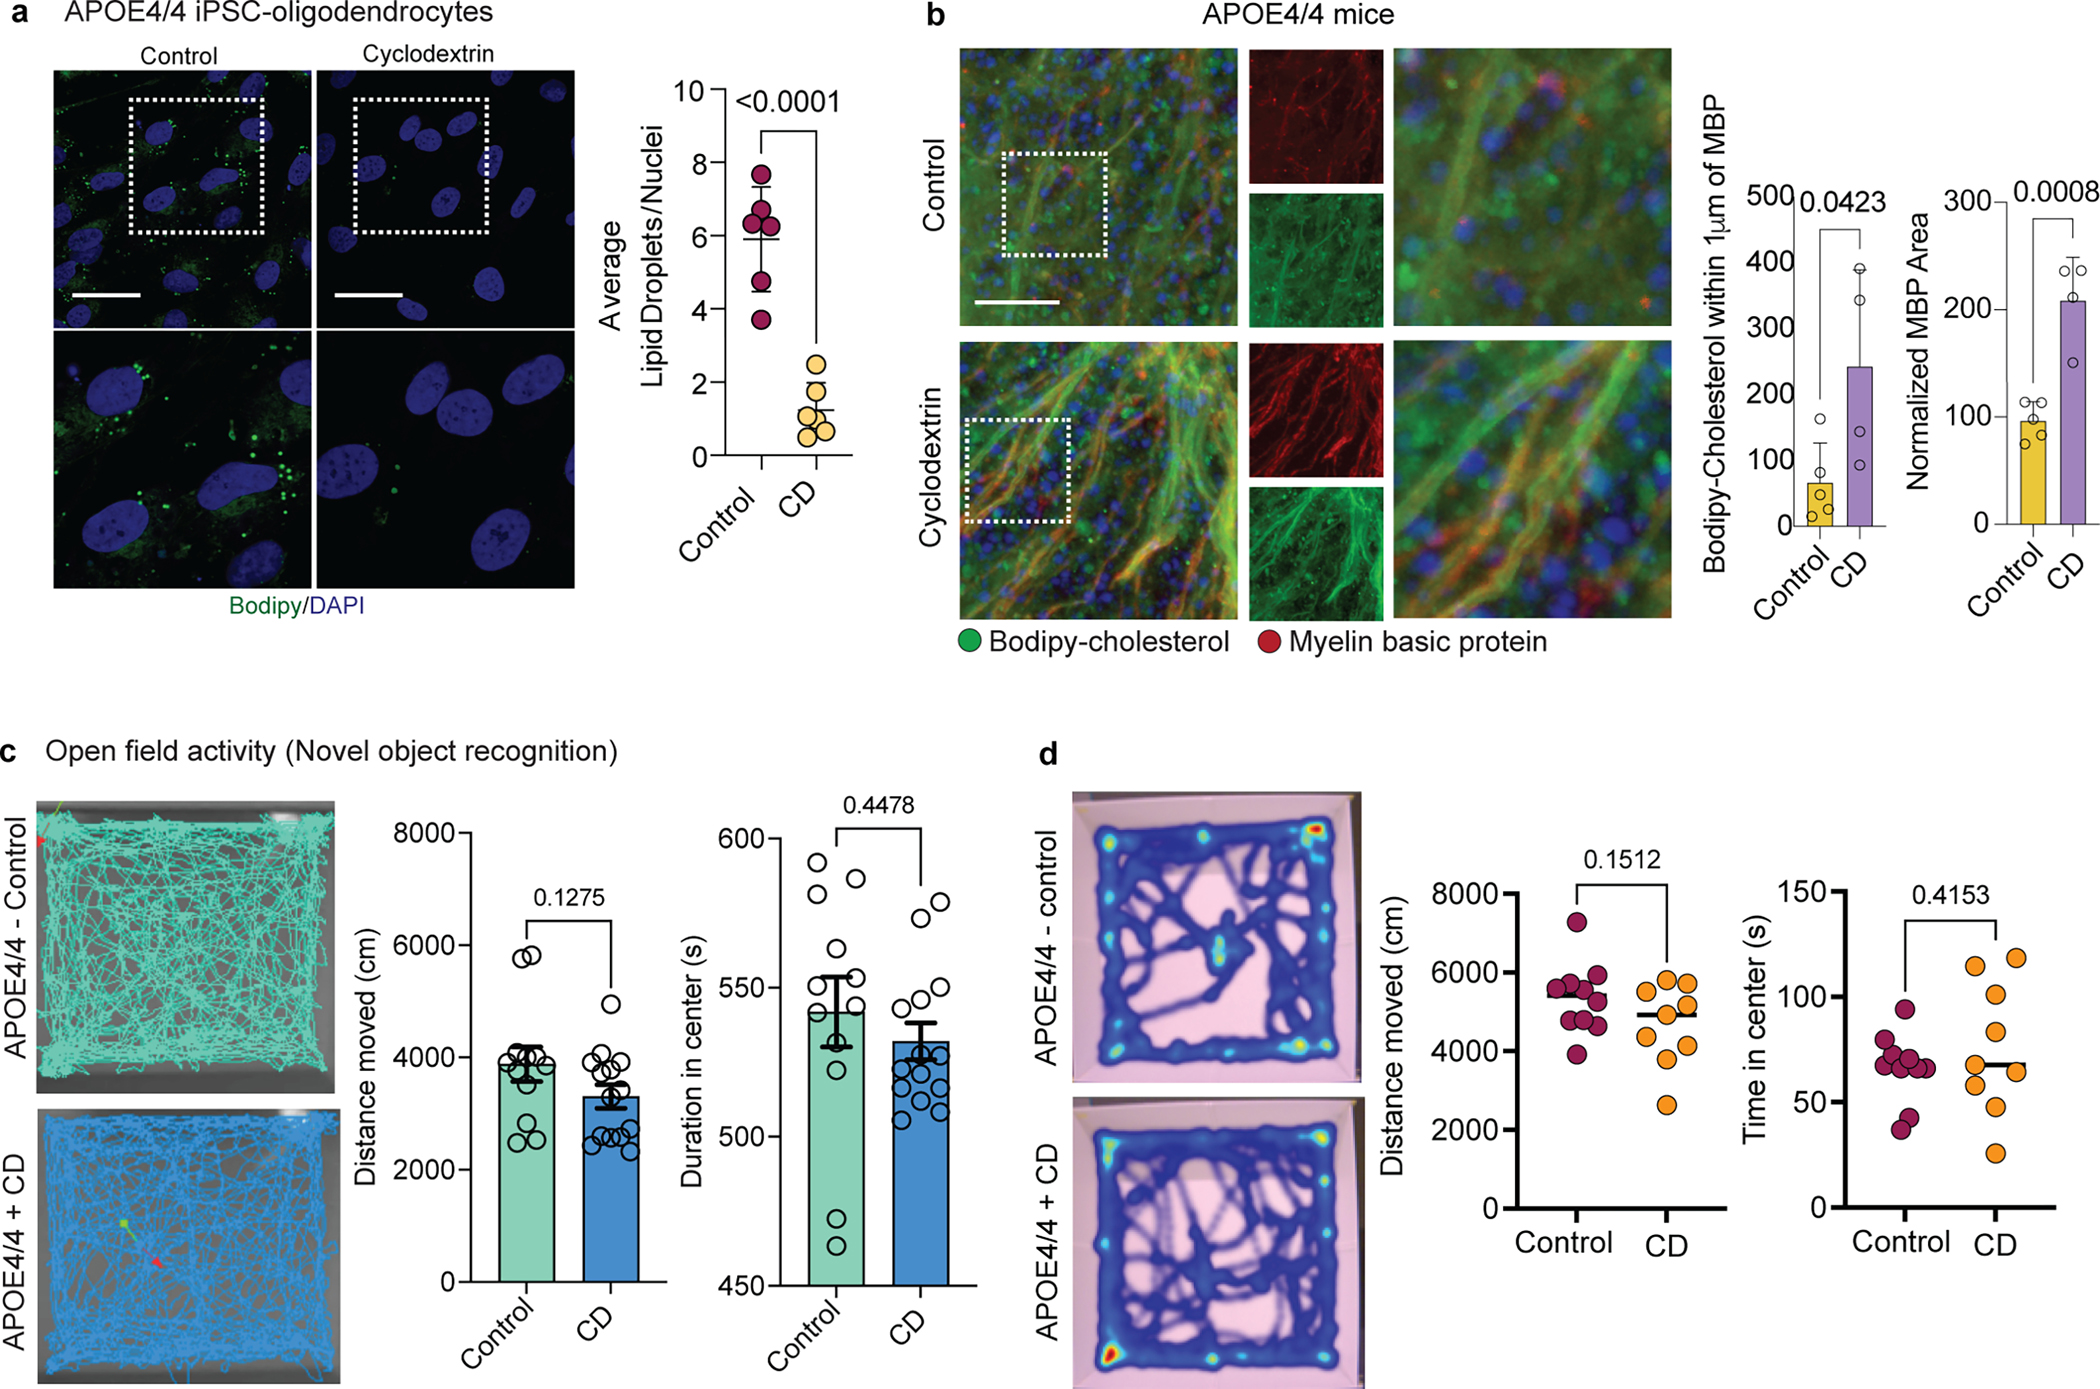
a, Bodipy (neutral lipid) staining in control and (2-Hydroxypropyl)-beta-cyclodextrin (cyclodextrin) treated iPSC-derived APOE4/4 oligodendrocytes (n = 6 biological replicates). The number of lipid droplets was normalized by the total number of cell nuclei for each image. Bars represent the mean number of droplets per cell for each condition, error bars represent standard deviation. P value was calculated using unpaired, two-tailed student’s t-test. b, MBP and Bodipy-cholesterol staining in control (n = 5 mice) and cyclodextrin-treated (n = 4 mice) APOE4/4-TR mouse brain. Scale bar represents 50 μm. Quantification of cholesterol-myelin colocalization, and MBP signal, in cyclodextrin-treated APOE4/4-TR mice. MBP-cholesterol colocalization was quantified using Imaris. MBP staining was quantified using Image J. Bars represent mean, error bars represent standard deviation, and p-value was calculated using an unpaired two-tailed student’s t-test. c, Representative activity traces for open field assay on APOE4/4-TR control- (n = 14 mice) and cyclodextrin-treated (n = 15 mice) used for Novel Object Recognition task. Distance moved (centimeters) and duration in the center (seconds) were measured and quantified using Noldus EthoVision software, with the same parameters for each animal. Dots represent individual mice, error bars are standard error of the mean, and p values were calculated using an unpaired, two-tailed student’s t-test. d, Representative activity traces for open field assay on APOE4/4-TR control- (n = 10 mice) and cyclodextrin-treated (n = 9 mice) used for the Puzzle Box task. Distance moved (centimeters) and duration in the center (seconds) were measured and quantified using Noldus EthoVision software, with the same parameters for each animal. Dots represent individual mice, error bars represent standard error of the mean, and p values were calculated using an unpaired, two-tailed student’s t-test.
Supplementary Material
Acknowledgements
We thank the individuals who donated post-mortem brain samples, and their families, for enabling this research. We thank Ying Zhou, Erica McNamara, and Thomas Garvey for administrative support and animal care. We thank Julia Maeve Bonner for input on the lipidomic analyses. We are grateful for generous support from the Robert A. and Renee E. Belfer Family, The JPB Foundation, The Carol and Gene Ludwig Family Foundation, the Cure Alzheimer’s Fund, and the National Institutes of Health (RF1 AG062377, RF1 AG054012-01, U54HG008097, and747UG3NS115064). We are also grateful for support for individuals leading this project. JWB was supported by the NIH grant UG3-NS115064, R01NS114239-01A1, Cure Alzheimer’s Fund. LAA was supported by NIH grant RF1-AG0540124 and the MIT BCS Henry E. Singleton Graduate Student Fellowship. DvM was supported by the MIT BCS Broshy Graduate Student Fellowship and the MIT BCS Halis Graduate Student Fellowship. XJ was supported by NIH grant U01-NS110453. Y-TL was supported by NIH grant R01-AG058002. WTR was supported by an Alzheimer’s Association Research Fellowship. HPC was supported by NIH grants RF1-AG054012 and RF1-AG062377. ROSMAP is supported by NIA grants P30AG20262, R01AG15819, R01AG17917, U01AG46152, U01AG 61356, and P30AG72975. ROSMAP resources requested at https://www.radc.rush.edu. Graphic illustrations generated via Biorender under agreements VI24HP0GQM and NE24HPHF0X.
Footnotes
Competing interests
The authors filed a patent application based on the findings.
Code availability
Code, along with detailed instructions on how to reproduce analyses presented herein, has been made available on Github under the following repository: https://github.com/djunamay/APOE4_impairs_myelination_via_cholesterol_dysregulation_in_oligodendrocytes
Data availability
The snRNA-seq data are available on the Synapse AD Knowledge Portal (https://www.synapse.org/#!Synapse:syn38120890/datasets/) with Synapse ID: syn38120890, including corresponding ROSMAP metadata. The data are available under the controlled use conditions set by human privacy regulations. To access the data, a data use agreement is needed. This registration is in place solely to ensure anonymity of the RSOMAP study participants. A data use agreement can be agreed with either RUSH university Medical centre (RUMC) or with SAGE, who maintains Synapse, and can be downloaded from their websites. See our code repository for a detailed list of data availability and download links.
References
- 1.Lambert JC et al. Meta-analysis of 74,046 individuals identifies 11 new susceptibility loci for Alzheimer’s disease. Nat. Genet. 45, 1452–1458 (2013). [DOI] [PMC free article] [PubMed] [Google Scholar]
- 2.Corder EH et al. Gene dose of apolipoprotein E type 4 allele and the risk of Alzheimer’s disease in late onset families. Science 261, 921–923 (1993). [DOI] [PubMed] [Google Scholar]
- 3.Strittmatter WJ et al. Apolipoprotein E: high-avidity binding to beta-amyloid and increased frequency of type 4 allele in late-onset familial Alzheimer disease. Proc. Natl. Acad. Sci. U. S. A. 90, 1977–1981 (1993). [DOI] [PMC free article] [PubMed] [Google Scholar]
- 4.Liu C-C et al. ApoE4 accelerates early seeding of amyloid pathology. Neuron 96, 1024–1032.e3 (2017). [DOI] [PMC free article] [PubMed] [Google Scholar]
- 5.Shi Y et al. ApoE4 markedly exacerbates tau-mediated neurodegeneration in a mouse model of tauopathy. Nature 549, 523–527 (2017). [DOI] [PMC free article] [PubMed] [Google Scholar]
- 6.Castellano JM et al. Human apoE isoforms differentially regulate brain amyloid-β peptide clearance. Sci. Transl. Med. 3, 89ra57 (2011). [DOI] [PMC free article] [PubMed] [Google Scholar]
- 7.Yamazaki Y, Zhao N, Caulfield TR, Liu C-C & Bu G Apolipoprotein E and Alzheimer disease: pathobiology and targeting strategies. Nat. Rev. Neurol. 15, 501–518 (2019). [DOI] [PMC free article] [PubMed] [Google Scholar]
- 8.Crean S et al. Apolipoprotein E ε4 prevalence in Alzheimer’s disease patients varies across global populations: a systematic literature review and meta-analysis. Dement. Geriatr. Cogn. Disord. 31, 20–30 (2011). [DOI] [PubMed] [Google Scholar]
- 9.Foley P Lipids in Alzheimer’s disease: A century-old story. Biochim. Biophys. Acta 1801, 750–753 (2010). [DOI] [PubMed] [Google Scholar]
- 10.Sienski G et al. disrupts intracellular lipid homeostasis in human iPSC-derived glia. Sci. Transl. Med. 13, (2021). [DOI] [PMC free article] [PubMed] [Google Scholar]
- 11.Tcw J et al. Cholesterol and matrisome pathways dysregulated in astrocytes and microglia. Cell 185, 2213–2233.e25 (2022). [DOI] [PMC free article] [PubMed] [Google Scholar]
- 12.Mathys H et al. Single-cell transcriptomic analysis of Alzheimer’s disease. Nature 570, 332–337 (2019). [DOI] [PMC free article] [PubMed] [Google Scholar]
- 13.Xu Q et al. Profile and regulation of apolipoprotein E (ApoE) expression in the CNS in mice with targeting of green fluorescent protein gene to the ApoE locus. J. Neurosci. 26, 4985–4994 (2006). [DOI] [PMC free article] [PubMed] [Google Scholar]
- 14.Lin Y-T et al. APOE4 Causes Widespread Molecular and Cellular Alterations Associated with Alzheimer’s Disease Phenotypes in Human iPSC-Derived Brain Cell Types. Neuron 98, 1141–1154.e7 (2018). [DOI] [PMC free article] [PubMed] [Google Scholar]
- 15.Bennett DA et al. Religious Orders Study and Rush Memory and Aging Project. J. Alzheimers. Dis. 64, S161–S189 (2018). [DOI] [PMC free article] [PubMed] [Google Scholar]
- 16.Wang D et al. Comprehensive functional genomic resource and integrative model for the human brain. Science 362, (2018). [DOI] [PMC free article] [PubMed] [Google Scholar]
- 17.Franzén O, Gan L-M & Björkegren JLM PanglaoDB: a web server for exploration of mouse and human single-cell RNA sequencing data. Database 2019, (2019). [DOI] [PMC free article] [PubMed] [Google Scholar]
- 18.Huang Y-WA, Zhou B, Wernig M & Südhof TC ApoE2, ApoE3, and ApoE4 Differentially Stimulate APP Transcription and Aβ Secretion. Cell 168, 427–441.e21 (2017). [DOI] [PMC free article] [PubMed] [Google Scholar]
- 19.Zalocusky KA et al. Neuronal ApoE upregulates MHC-I expression to drive selective neurodegeneration in Alzheimer’s disease. Nat. Neurosci. 24, 786–798 (2021). [DOI] [PMC free article] [PubMed] [Google Scholar]
- 20.Thadathil N et al. DNA Double-Strand Break Accumulation in Alzheimer’s Disease: Evidence from Experimental Models and Postmortem Human Brains. Mol. Neurobiol. 58, 118–131 (2021). [DOI] [PubMed] [Google Scholar]
- 21.Ye S et al. Apolipoprotein (apo) E4 enhances amyloid beta peptide production in cultured neuronal cells: apoE structure as a potential therapeutic target. Proc. Natl. Acad. Sci. U. S. A. 102, 18700–18705 (2005). [DOI] [PMC free article] [PubMed] [Google Scholar]
- 22.Hatters DM, Peters-Libeu CA & Weisgraber KH Apolipoprotein E structure: insights into function. Trends Biochem. Sci. 31, 445–454 (2006). [DOI] [PubMed] [Google Scholar]
- 23.Brun A & Englund E A white matter disorder in dementia of the Alzheimer type: a pathoanatomical study. Ann. Neurol. 19, 253–262 (1986). [DOI] [PubMed] [Google Scholar]
- 24.Bartzokis G Age-related myelin breakdown: a developmental model of cognitive decline and Alzheimer’s disease. Neurobiol. Aging 25, 5–18; author reply 49–62 (2004). [DOI] [PubMed] [Google Scholar]
- 25.Jäkel S et al. Altered human oligodendrocyte heterogeneity in multiple sclerosis. Nature 566, 543–547 (2019). [DOI] [PMC free article] [PubMed] [Google Scholar]
- 26.Law S-H et al. An Updated Review of Lysophosphatidylcholine Metabolism in Human Diseases. Int. J. Mol. Sci. 20, (2019). [DOI] [PMC free article] [PubMed] [Google Scholar]
- 27.Ye J et al. ER stress induces cleavage of membrane-bound ATF6 by the same proteases that process SREBPs. Mol. Cell 6, 1355–1364 (2000). [DOI] [PubMed] [Google Scholar]
- 28.Hapala I, Marza E & Ferreira T Is fat so bad? Modulation of endoplasmic reticulum stress by lipid droplet formation. Biol. Cell 103, 271–285 (2011). [DOI] [PubMed] [Google Scholar]
- 29.Saher G, Quintes S & Nave K-A Cholesterol: a novel regulatory role in myelin formation. Neuroscientist 17, 79–93 (2011). [DOI] [PubMed] [Google Scholar]
- 30.Ottinger EA et al. Collaborative development of 2-hydroxypropyl-β-cyclodextrin for the treatment of Niemann-Pick type C1 disease. Curr. Top. Med. Chem. 14, 330–339 (2014). [DOI] [PMC free article] [PubMed] [Google Scholar]
- 31.Leger M et al. Object recognition test in mice. Nat. Protoc. 8, 2531–2537 (2013). [DOI] [PubMed] [Google Scholar]
- 32.Chiang ACA et al. Bexarotene normalizes chemotherapy-induced myelin decompaction and reverses cognitive and sensorimotor deficits in mice. Acta Neuropathol Commun 8, 193 (2020). [DOI] [PMC free article] [PubMed] [Google Scholar]
- 33.Dean DC 3rd et al. Association of Amyloid Pathology With Myelin Alteration in Preclinical Alzheimer Disease. JAMA Neurol. 74, 41–49 (2017). [DOI] [PMC free article] [PubMed] [Google Scholar]
- 34.Dean DC 3rd et al. Brain differences in infants at differential genetic risk for late-onset Alzheimer disease: a cross-sectional imaging study. JAMA Neurol. 71, 11–22 (2014). [DOI] [PMC free article] [PubMed] [Google Scholar]
- 35.Remer J et al. Longitudinal white matter and cognitive development in pediatric carriers of the apolipoprotein ε4 allele. Neuroimage 222, 117243 (2020). [DOI] [PMC free article] [PubMed] [Google Scholar]
- 36.Gold BT, Powell DK, Andersen AH & Smith CD Alterations in multiple measures of white matter integrity in normal women at high risk for Alzheimer’s disease. Neuroimage 52, 1487–1494 (2010). [DOI] [PMC free article] [PubMed] [Google Scholar]
- 37.Bennett DA et al. Decision rules guiding the clinical diagnosis of Alzheimer’s disease in two community-based cohort studies compared to standard practice in a clinic-based cohort study. Neuroepidemiology 27, 169–176 (2006). [DOI] [PubMed] [Google Scholar]
- 38.Mohammadi S, Davila-Velderrain J & Kellis M A multiresolution framework to characterize single-cell state landscapes. Nat. Commun. 11, 5399 (2020). [DOI] [PMC free article] [PubMed] [Google Scholar]
- 39.Korsunsky I et al. Fast, sensitive and accurate integration of single-cell data with Harmony. Nat. Methods 16, 1289–1296 (2019). [DOI] [PMC free article] [PubMed] [Google Scholar]
- 40.He L et al. NEBULA is a fast negative binomial mixed model for differential or co-expression analysis of large-scale multi-subject single-cell data. Commun Biol 4, 629 (2021). [DOI] [PMC free article] [PubMed] [Google Scholar]
- 41.Hänzelmann S, Castelo R & Guinney J GSVA: gene set variation analysis for microarray and RNA-seq data. BMC Bioinformatics 14, 7 (2013). [DOI] [PMC free article] [PubMed] [Google Scholar]
- 42.Kamphorst JJ, Fan J, Lu W, White E & Rabinowitz JD Liquid chromatography-high resolution mass spectrometry analysis of fatty acid metabolism. Anal. Chem. 83, 9114–9122 (2011). [DOI] [PMC free article] [PubMed] [Google Scholar]
Associated Data
This section collects any data citations, data availability statements, or supplementary materials included in this article.
Supplementary Materials
Data Availability Statement
The snRNA-seq data are available on the Synapse AD Knowledge Portal (https://www.synapse.org/#!Synapse:syn38120890/datasets/) with Synapse ID: syn38120890, including corresponding ROSMAP metadata. The data are available under the controlled use conditions set by human privacy regulations. To access the data, a data use agreement is needed. This registration is in place solely to ensure anonymity of the RSOMAP study participants. A data use agreement can be agreed with either RUSH university Medical centre (RUMC) or with SAGE, who maintains Synapse, and can be downloaded from their websites. See our code repository for a detailed list of data availability and download links.


