Abstract
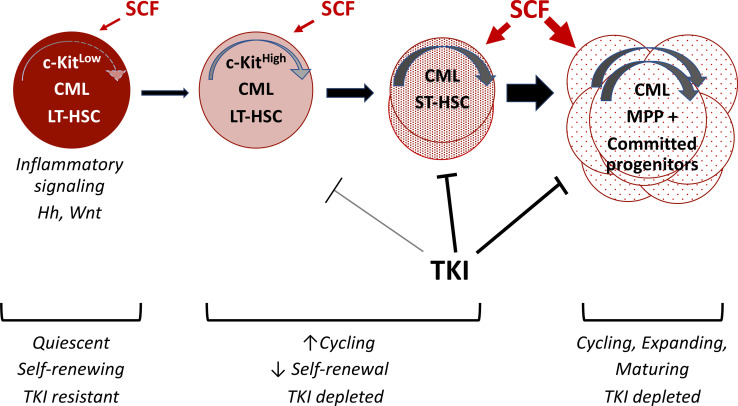
Despite the efficacy of tyrosine kinase inhibitors (TKIs) in chronic myeloid leukemia (CML), malignant long-term hematopoietic stem cells (LT-HSCs) persist as a source of relapse. However, LT-HSCs are heterogenous and the most primitive, drug-resistant LT-HSC subpopulations are not well characterized. In normal hematopoiesis, self-renewal and long-term reconstitution capacity are enriched within LT-HSCs with low c-Kit expression (c-KITlo). Here, using a transgenic CML mouse model, we found that long-term engraftment and leukemogenic capacity were restricted to c-KITlo CML LT-HSCs. CML LT-HSCs demonstrated enhanced differentiation with expansion of mature progeny following exposure to the c-KIT ligand, stem cell factor (SCF). Conversely, SCF deletion led to depletion of normal LT-HSCs but increase in c-KITlo and total CML LT-HSCs with reduced generation of mature myeloid cells. CML c-KITlo LT-HSCs showed reduced cell cycling and expressed enhanced quiescence and inflammatory gene signatures. SCF administration led to enhanced depletion of CML primitive progenitors but not LT-HSCs after TKI treatment. Human CML LT-HSCs with low or absent c-KIT expression were markedly enriched after TKI treatment. We conclude that CML LT-HSCs expressing low c-KIT levels are enriched for primitive, quiescent, drug-resistant leukemia-initiating cells and represent a critical target for eliminating disease persistence.
Keywords: Hematology, Oncology
Keywords: Adult stem cells, Growth factors, Leukemias
Introduction
Chronic myelogenous leukemia (CML) results from long-term hematopoietic stem cell (LT-HSC) transformation by the BCR-ABL1 oncogene. BCR-ABL tyrosine kinase inhibitors (TKIs) can induce deep remission and prolonged survival in patients with CML (1). However, leukemic LT-HSCs resist elimination and persist as a source of relapse in TKI-treated patients (2). Others and we have shown that CML LT-HSCs resist TKI treatment via BCR-ABL–independent mechanisms (3–5). In normal hematopoiesis, LT-HSCs demonstrate heterogeneity in differentiation and repopulation potential related to predetermined cell fate commitment (6, 7). However, CML LT-HSC heterogeneity has not been prospectively characterized, and drug-resistant LT-HSC subpopulations responsible for leukemia persistence and relapse have not been identified.
The c-Kit receptor tyrosine kinase is expressed predominately on hematopoietic stem and progenitor cells (HSPCs) and plays a crucial role in maintaining HSC function and pool size (8, 9). Stem cell factor (SCF), the ligand for c-KIT, is required for HSC maintenance in vivo (9–13). Specialized microenvironmental niches modulate LT-HSC quiescence, self-renewal, and longevity (14) and influence proliferation and lineage commitment of HSC progeny (15). SCF expression on endothelial and mesenchymal stromal niches is required for LT-HSC maintenance in adult BM (16). Interestingly, although c-Kit is required for maintaining stemness (17, 18), LT-HSCs expressing low levels of cell surface c-KIT protein (c-KITlo) exhibit enhanced self-renewal and long-term reconstitution ability compared with LT-HSCs with high c-KIT expression (c-KIThi) (19–21). These observations suggest that variability in c-KIT expression can differentiate heterogenous LT-HSC subpopulations.
CML HSPCs are reported to show altered responsiveness to SCF compared with their normal counterparts (22, 23). Leukemia-initiating cells in a CML blast crisis mouse model had variable c-KIT expression, whereas leukemia-initiating cells in chronic-phase CML were present in the c-KIT–positive fraction (24). Here we investigated whether levels of cell surface c-KIT expression could define subpopulations of CML LT-HSCs with heterogenous self-renewal and regenerative potential and differential response to TKI treatment. Our studies indicate that low c-KIT expression identifies a primitive, quiescent, treatment-resistant CML LT-HSC subpopulation with distinct regulatory characteristics.
Results
C-KITlo LT-HSCs are enriched in CML compared with normal BM.
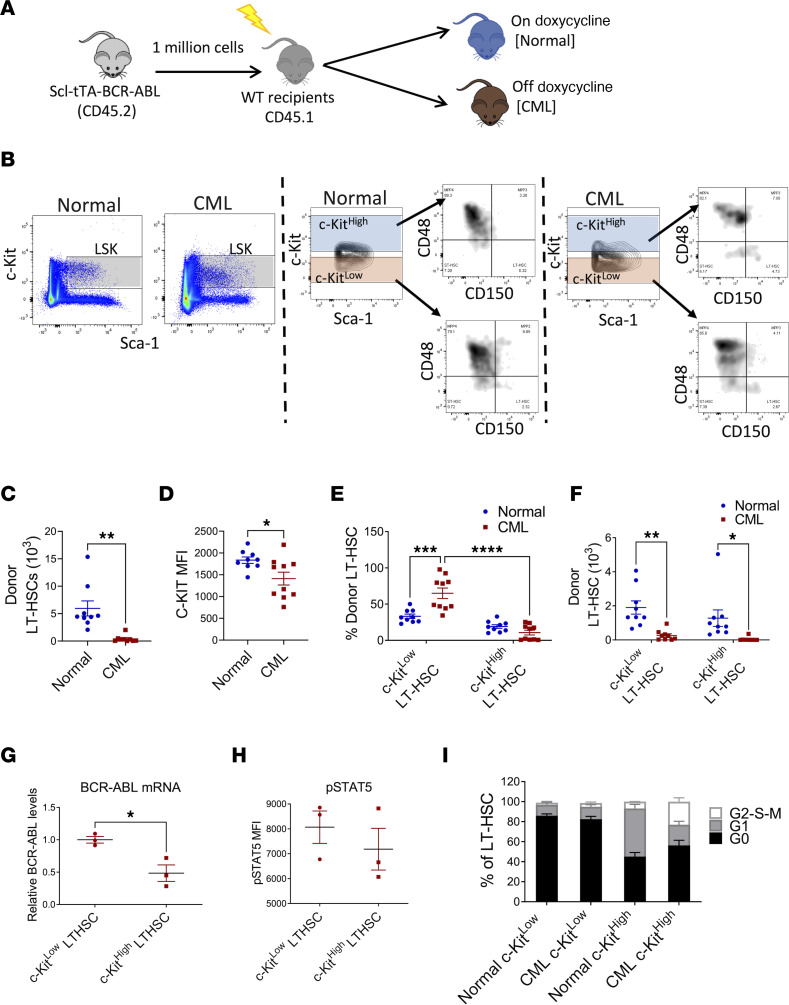
Previous studies indicate that c-KITlo LT-HSCs represent a primitive, quiescent subset with increased multi-lineage-repopulating ability (19–21). We studied c-KIT expression in CML LT-HSCs using a well-characterized transgenic Tg(Tal1-tTA)19Dgt × Tg(tetO-BCR/ABL1)2Dgt (Scl-tTA BCR-ABL) mouse model of CML. In these mice, withdrawal of tetracycline induces BCR-ABL1 expression and development of a CML-like myeloproliferative disorder. BM cells from CML mice (CD45.2) were transplanted into lethally irradiated wild-type recipients (CD45.1) to generate cohorts with similar time of onset of CML (Supplemental Figure 1, A–C; supplemental material available online with this article; https://doi.org/10.1172/jci.insight.157421DS1). A control group was maintained on doxycycline (Figure 1A). LT-HSCs (Lin–Sca-1+c-KIT+Flt3–CD150+CD48–) present within donor Lin–Sca-1+c-KIT+ (LSK) cells in control mice with the highest c-KIT expression (top 30%) were defined as c-KIThi LT-HSCs, whereas LT-HSCs with the lowest c-KIT expression (bottom 30%) were defined as c-KITlo LT-HSCs (Figure 1B). As previously described, total LT-HSC frequency and numbers were significantly reduced in BM from CML mice (Figure 1C and Supplemental Figure 1D) (25, 26). The mean fluorescence intensity (MFI) of c-KIT was significantly decreased in CML compared with control LT-HSCs (Figure 1D). Application of gates established for normal c-KIThi and c-KITlo cells to CML LT-HSCs (Figure 1B) showed increased proportions of c-KITlo LT-HSCs and reduced proportions of c-KIThi LT-HSCs in CML mice (Figure 1E), despite reduction in absolute numbers of c-KITlo LT-HSCs (Figure 1F). Therefore, CML development, though leading to depletion of LT-HSCs, is associated with proportionately greater retention of c-KITlo LT-HSCs.
Figure 1. C-KITlo LT-HSCs are increased in CML compared with normal BM.
Experimental design: BM cells from SCL-tTA mice (CD45.2) were transplanted into lethally irradiated recipients (CD45.1) and were kept on doxycycline (normal controls), or without doxycycline, resulting in BCR-ABL expression and development of CML (CML). Mice were analyzed 10 weeks posttransplant (A). Representative FACS plots showing gating strategy for c-KITlo and c-KIThi LT-HSCs in normal (left) and CML (right) mice (B). Total number of donor LT-HSCs in the BM (C). Surface c-KIT expression (MFI) on donor LT-HSC in normal and CML mice (D). Frequency (E) and absolute number (F) of donor c-KITlo and c-KIThi LT-HSCs in normal and CML mice (n = 9–10). qRT-PCR analysis of Bcr-Abl1 mRNA expression in donor c-KITlo and c-KIThi LT-HSCs in CML mice (G). Results are expressed relative to GAPDH and normalized to c-KITlo LT-HSCs. Levels of p-STAT5 expression in c-KITlo and c-KIThi LT-HSCs from CML mice measured by flow cytometry after intracellular labeling with anti–p-STAT5 antibody (H). Cell cycle analysis of freshly isolated BM cells showing percentage of G0, G1, and S-G2-M phase normal and CML c-KITlo and c-KIThi LT-HSCs (n = 4 each) (I). Compiled data are presented as mean ± SEM, *P < 0.05, **P < 0.01, ***P < 0.001, ****P < 0.0001, based on t test (C, D, and H) and 2-way ANOVA with Tukey’s test (E and F).
Quantitative reverse transcriptase PCR (qRT-PCR) analysis showed no significant difference in c-Kit mRNA expression between c-KITlo and c-KIThi LT-HSCs from normal and CML mice (Supplemental Figure 1E). To determine c-KIT localization, cell surface c-KIT was stained at saturation levels, and cells were fixed and permeabilized to separately label intracellular c-KIT. As with cell surface c-KIT, intracellular c-KIT was significantly lower in CML compared with normal LT-HSCs (Supplemental Figure 1F). Intracellular c-KIT expression was reduced in c-KITlo CML compared with normal LT-HSCs but similar in normal and CML c-KIThi LT-HSCs (Supplemental Figure 1G). These results suggest that reduced surface c-KIT levels in CML LT-HSCs are not related to reduced RNA expression or protein relocalization to the intracellular compartment but could reflect increased c-KIT protein degradation, as was reported for normal c-KITlo LT-HSCs (21). We also evaluated Bcr-Abl1 mRNA expression in CML KITlo and c-KIThi LT-HSCs using qRT-PCR (Figure 1G) and BCR-ABL signaling by measuring phosphorylated STAT5 (p-STAT5) levels in CML KITlo and c-KIThi LT-HSCs using intracellular flow cytometry (Figure 1H). CML KITlo LT-HSCs expressed higher levels of Bcr-Abl1 mRNA, but did not express significantly higher levels of p-STAT5 levels, than c-KIThi LT-HSCs.
We assessed cell cycling using DAPI and Ki-67 labeling (Figure 1I). Normal c-KITlo LT-HSCs were highly quiescent and predominantly in G0. Normal c-KIThi LT-HSCs showed substantially reduced proportions of cells in G0 and increased proportions of cells in G1 compared with normal c-KITlo LT-HSCs, suggesting a more activated state. CML c-KITlo LT-HSCs showed similarly high proportions of cells in G0 as normal KITlo LT-HSCs, indicating that they were also highly quiescent. CML c-KIThi LT-HSCs showed substantially reduced proportions of cells in G0 and increased proportions of cells in S-G2-M compared with CML c-KITlo LT-HSCs. CML c-KIThi LT-HSCs showed reduced G1 phase and increased G2-S-M phase, compared with normal c-KIThi LT-HSCs, suggesting increased progression through the cell cycle.
CML c-KITlo LT-HSCs exhibit gene signatures characteristic of primitive drug-resistant leukemia stem cells.
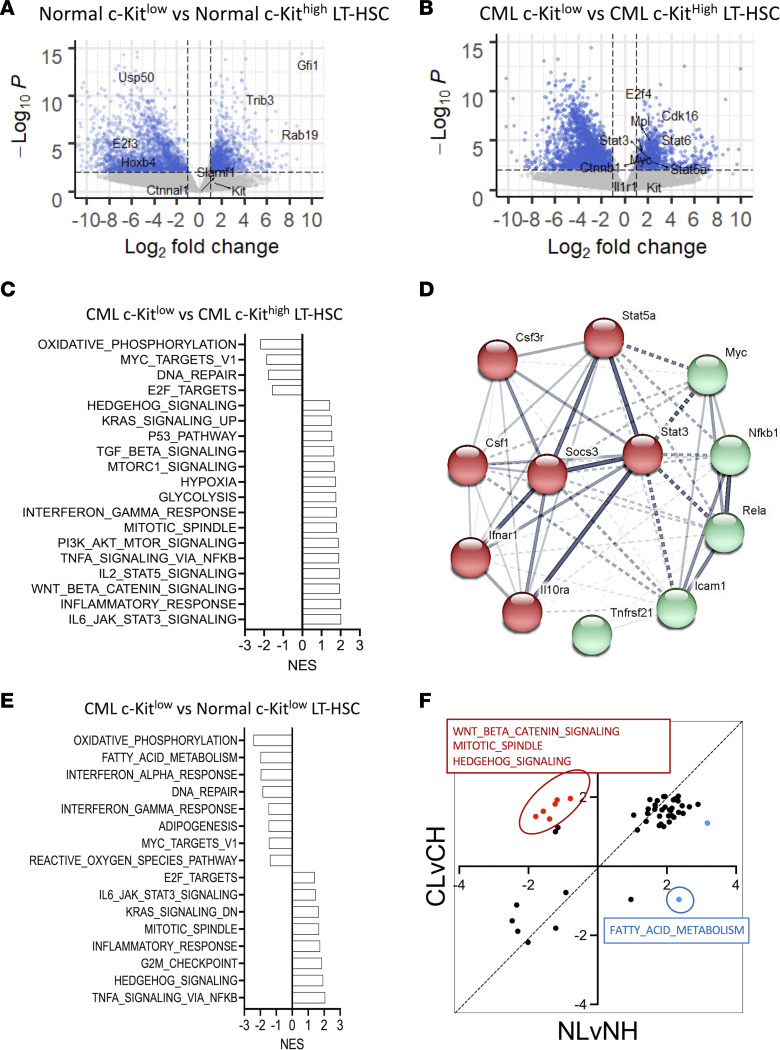
RNA-Seq analysis was performed on normal c-KIThi, normal c-KITlo, CML c-KIThi, and CML c-KITlo LT-HSCs. We compared gene expression between (a) normal c-KIThi and c-KITlo LT-HSCs, (b) CML c-KIThi and c-KITlo LT-HSCs, and (c) normal and CML c-KITlo LT-HSCs. Increased expression of several HSC-associated genes, including Trib3 and Gfi1, was seen in normal c-KITlo versus c-KIThi LT-HSCs (Figure 2A). Increased expression of several genes previously reported to be associated with CML stem cells and TKI resistance, including Myc, Mpl, Stat3, Stat5a, Stat6, and Ctnnb, was seen in CML c-KITlo versus c-KIThi LT-HSCs (Figure 2B) (27–34). Interestingly, we have previously shown that CML LT-HSCs with higher levels of MPL expression have increased leukemogenic capacity and reduced TKI sensitivity (35).
Figure 2. CML c-KITlo LT-HSCs exhibit gene signatures characteristic of primitive, drug-resistant leukemia stem cells.
Volcano plots of differential expression of normal c-KITlo LT-HSCs versus normal c-KIThi LT-HSCs (A) and CML c-KITlo LT-HSCs versus CML c-KIThi LT-HSCs (n = 3 each) (B). Known HSC drivers and markers are indicated. Normalized enrichment scores (NES) of Hallmark gene sets significantly enriched (FDR < 0.05) in CML c-KITlo LT-HSCs compared with CML c-KIThi LT-HSCs (C). Protein-protein association network analysis of leading-edge genes from the inflammation related gene sets enriched in CML c-KITlo LT-HSCs compared with CML c-KIThi LT-HSCs was performed using STRING (D). NES of Hallmark gene sets significantly enriched (FDR < 0.05) in CML c-KITlo LT-HSCs compared with normal c-KITlo LT-HSCs (E). Dot plot of NES of Hallmark gene sets significantly enriched (FDR < 0.05) in CML c-KITlo LT-HSCs compared with CML c-KIThi LT-HSCs (CL vs. CH) and normal c-KITlo LT-HSCs compared to normal c-KIThi LT-HSCs (NL vs. NH). Gene sets that are selectively enriched in CML c-KITlo LT-HSCs but not normal c-KITlo LT-HSCs are indicated in red (positively enriched) and blue (negatively enriched) (F).
Gene set enrichment analysis (GSEA) comparing normal c-KITlo and normal c-KIThi LT-HSCs showed that normal c-KITlo LT-HSCs were enriched for Hallmark gene signatures for interferon signaling, hypoxia, glycolysis, lipid metabolism, p53 signaling, and inflammatory signaling (STAT3, STAT5, TNFA), whereas normal c-KIThi LT-HSCs were enriched for oxidative phosphorylation (OXPHOS), cell cycle, MYC, and Hedgehog gene signatures (Supplemental Figure 2A). GSEA comparing CML c-KITlo and CML c-KIThi LT-HSCs showed that the latter were enriched for gene signatures for inflammatory signaling (IL-6/JAK/STAT3, IL-2/STAT5, and TNF-α/NF-κB signaling; inflammatory response); TGF-β, Wnt/β-catenin, and Hedgehog signaling; hypoxia; and glycolysis, whereas CML c-KIThi LT-HSCs were enriched for OXPHOS, Myc and E2F targets, and DNA repair (Figure 2C). Enrichment of MYC gene signatures in CML c-KIThi LT-HSCs despite reduced Myc mRNA expression could reflect posttranscriptional regulation or modulation of MYC transcriptional activity. Analysis of C2 signatures showed enrichment of inflammatory and Wnt/β-catenin signaling signatures in CML c-KITlo LT-HSCs and OXPHOS and cell proliferation signatures in CML c-KIThi LT-HSCs (Supplemental Table 1). Further analysis of genes contributing to inflammatory signaling profiles in CML c-KITlo LT-HSCs revealed increased expression of Csf1, Tnfrsf21 (DR6), IL-10 receptor, CSF3 (G-CSF) receptor, and IFN-α receptor, together with increased expression of Stat3, Stat5, Socs3, NF-kB, and c-Myc (Figure 2D and Supplemental Figure 2B).
GSEA comparing CML c-KITlo LT-HSCs and normal c-KITlo LT-HSCs showed that CML c-KITlo LT-HSCs were enriched for inflammatory signaling (TNF-α/NF-κB, IL-6/JAK/STAT3; inflammatory response), Hedgehog signaling, and cell cycle (G2M checkpoint, mitotic spindle, E2F targets) signatures, whereas normal c-KITlo LT-HSCs were enriched for OXPHOS, fatty acid metabolism, and interferon signatures (Figure 2E). Analysis of the C2 signatures data set validated enrichment of inflammatory signaling and cell cycling signatures in CML c-KITlo LT-HSCs and OXPHOS and interferon pathway signatures in normal c-KITlo LT-HSCs (Supplemental Table 1). Leading edge analysis of inflammatory signaling profiles revealed increased Socs3, Stat3, Stat5, and NF-kB expression in CML compared with normal c-KITlo LT-HSCs (Supplemental Figure 2B).
Finally, we compared gene signatures enriched in c-KITlo versus c-KIThi normal LT-HSCs (FDR < 0.05) with signatures enriched in c-KITlo versus c-KIThi CML LT-HSCs (FDR < 0.05) (Figure 2F). Inflammatory signaling, glycolysis, and hypoxia signatures were enriched in both normal and CML c-KITlo LT-HSCs compared with their c-KIThi LT-HSC counterparts, whereas OXPHOS, Myc, and cell cycle signatures were enriched in both normal and CML c-KIThi LT-HSCs compared with their c-KITlo LT-HSC counterparts (Figure 2F). On the other hand, signatures for Wnt and Hedgehog signaling, important mechanisms regulating primitive leukemia stem cells (LSCs) in CML (5, 34, 36, 37), were selectively enriched in CML c-KITlo versus c-KIThi LT-HSCs, and fatty acid metabolism signatures were selectively enriched in normal c-KITlo versus c-KIThi LT-HSCs.
In conclusion, CML c-KITlo LT-HSCs showed reduced cell cycling signatures and increased STAT3 and NF-κB gene signatures, which are gene expression characteristics similar to those reported for BCR-ABL+CD34+ cell subpopulations enriched in patients with CML following TKI treatment (38).
CML c-KITlo LT-HSCs are enriched for long-term engraftment and leukemia-generating capacity.
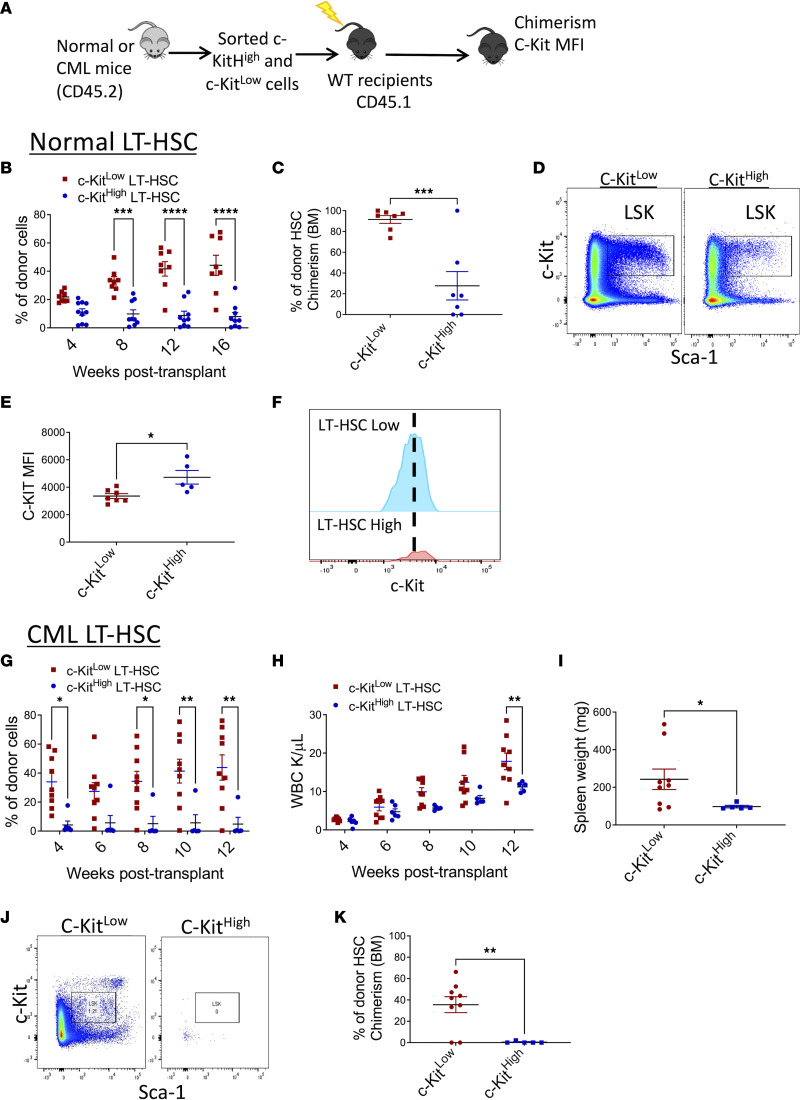
We transplanted FACS-purified c-KIThi and c-KITlo LT-HSCs (CD45.2) from CML and normal mice into lethally irradiated recipients (CD45.1) to evaluate their repopulating capacity (Figure 3A). Normal c-KITlo LT-HSCs generated significantly higher peripheral blood (PB) chimerism (Figure 3B), and BM LT-HSC chimerism, compared with c-KIThi LT-HSC (Figure 3C). LT-HSCs regenerated from c-KITlo LT-HSCs showed significantly lower c-KIT MFI than LT-HSCs regenerated from c-KIThi LT-HSCs, indicating regeneration of c-KITlo LT-HSCs after transplantation (Figure 3, D–F). Following transplantation, long-term donor chimerism was restricted to CML c-KITlo LT-HSCs, whereas CML c-KIThi LT-HSCs generated minimal engraftment (Figure 3G). Leukemia induction in recipient mice, as indicated by increased WBC counts (Figure 3H) and increased spleen weight (Figure 3I), was restricted to CML c-KITlo LT-HSCs. CML c-KITlo LT-HSCs regenerated donor LSK cells in recipient mice, whereas CML c-KIThi LT-HSCs failed to regenerate donor LT-HSCs (Figure 3, J and K), and their c-KIT MFI could not be determined. These results indicate that primitive LSCs capable of long-term engraftment and leukemia generation are restricted to CML c-KITlo LT-HSCs, whereas c-KIThi LT-HSCs lack long-term repopulating and leukemia-generating capacity.
Figure 3. Long-term repopulating and disease-generating capacity is restricted to CML c-KITlo LT-HSCs.
FACS-sorted c-KIThi and c-KITlo LT-HSCs from both normal and CML mice (CD45.2) (150 LT-HSCs together with 200,000 support BM cells [CD45.1]) were transplanted into lethally irradiated recipient (CD45.1) mice and followed for donor chimerism (A). Peripheral blood (PB) normal donor chimerism following transplantation of normal c-KITlo LT-HSCs (n = 8) and c-KIThi LT-HSCs (n = 9) (B). Representative FACS plots showing donor LSK cells in transplant recipients of normal c-KITlo LT-HSCs and c-KIThi LT-HSCs (C). Percentage of donor LT-HSC chimerism at 16 weeks following transplantation of normal c-KITlo LT-HSCs and c-KIThi LT-HSCs (D). MFI of surface c-KIT levels in donor LSK cells in recipient mice transplanted with normal c-KITlo LT-HSCs and c-KIThi LT-HSCs (E). Concatenated histogram plots showing c-KIT MFI on donor LT-HSCs in recipient mice transplanted with c-KITlo LT-HSCs and c-KIThi LT-HSCs (F). PB normal donor chimerism (G) and white blood count (WBC) (H) following transplantation of CML c-KITlo LT-HSCs (n = 8) and c-KIThi LT-HSCs (n = 5). Spleen weights in recipient mice 16 weeks following transplantation of CML c-KITlo LT-HSCs and c-KIThi LT-HSCs (I). Representative FACS plots showing donor LSK cells in recipients of CML c-KITlo LT-HSCs and c-KIThi LT-HSCs (J). Percentage of donor LT-HSC chimerism at 16 weeks following transplantation of CML c-KITlo LT-HSCs and c-KIThi LT-HSCs (K). Data represented as mean ± SEM, *P < 0.05, **P < 0.01, ***P < 0.001, ****P < 0.0001, based on 2-way ANOVA with Holm-Šídák test (B, G, and H) and t test (C, E, I, and K).
SCF stimulation drives enhanced differentiation and expansion of mature progeny from CML compared with normal LT-HSCs.
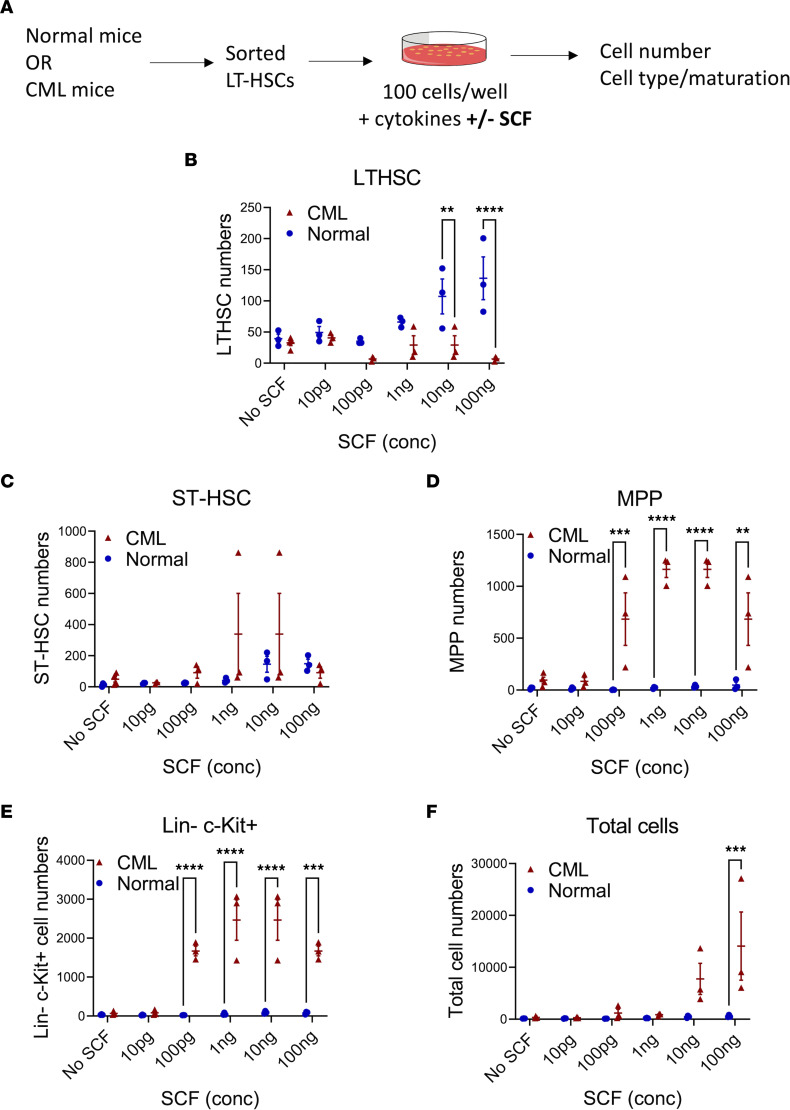
We analyzed the response of normal and CML LT-HSCs to SCF (0–100 ng/mL) stimulation in vitro (Figure 4A and Supplemental Figure 3A). For normal LT-HSCs, SCF exposure led to a dose-dependent increase in LT-HSCs and short-term HSCs (ST-HSCs) but lesser expansion of multipotent progenitors (MPPs), committed progenitors (Lin–Sca-1–c-KIT+), and total cell numbers (Figure 4, B–F). In contrast, exposure of CML LT-HSCs to SCF did not lead to significant expansion of LT-HSCs and ST-HSCs but led to significantly greater expansion of MPPs, committed progenitors, and total cell numbers compared with normal LT-HSCs (Figure 4, B–F). Therefore, SCF stimulation expands normal but not CML LT-HSCs and ST-HSCs and drives enhanced CML LT-HSC maturation and increased generation of progenitors and mature cells.
Figure 4. Differential response of normal and CML LT-HSCs to SCF.
Experimental design: LT-HSCs isolated from normal and CML mice by flow cytometry were cultured with varying concentrations of SCF (10 pg to 100 ng) and cell numbers and cell phenotypes analyzed by flow cytometry (A). Number of cells with LT-HSC (B), ST-HSC (C), MPP (D), and LSK (E) phenotype, and total number of cells (F), generated from normal and CML LT-HSCs cultured for 6 days with increasing SCF concentrations. Normal n = 3 from 3–5 mice; CML n = 3 from 3–5 mice. Data represented as mean ± SEM, **P < 0.01, ***P < 0.001, ****P < 0.0001, based on 2-way ANOVA with Holm-Šídák test.
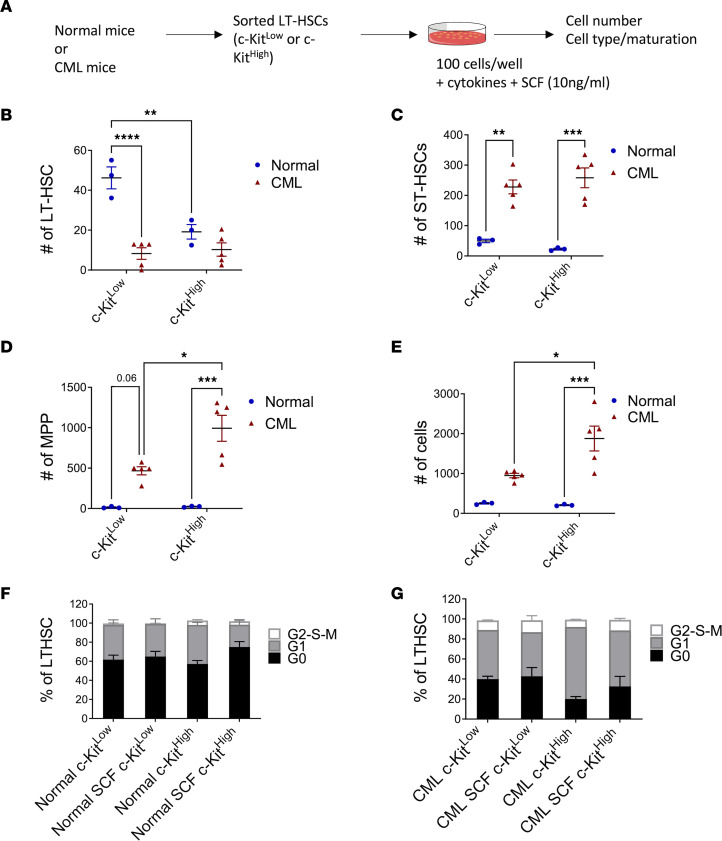
We next compared the response of c-KITlo and c-KIThi LT-HSCs to SCF (10 ng/mL) (Figure 5A). Increased numbers of LT-HSCs (Figure 5B) and ST-HSCs (Figure 5C), and similar numbers of MPPs and total cells (Figure 5, D and E), were seen after culture of normal c-KITlo LT-HSCs with SCF compared with normal c-KIThi LT-HSCs. CML c-KIThi LT-HSCs generated increased numbers of MPPs and total cells compared with CML c-KITlo LT-HSCs (Figure 5, D and E). Significantly reduced numbers of LT-HSCs but significantly higher numbers of ST-HSCs, MPPs, and total cells was seen after culture of CML c-KITlo LT-HSCs with SCF compared with normal c-KITlo LT-HSCs (Figure 5, B–E). CML c-KIThi LT-HSCs also generated higher numbers of ST-HSCs, MPPs, and total cells after culture with SCF compared with normal c-KIThi LT-HSCs (Figure 5, C–E). We conclude that SCF stimulation leads to reduced retention of LT-HSCs but increased generation of ST-HSCs and MPPs from CML compared with normal c-KITlo LT-HSCs.
Figure 5. Differential response of c-KITlo normal and CML LT-HSCs to SCF.
Experimental plan: c-KITlo and c-KIThi LT-HSCs isolated from normal and CML mice by flow cytometry were cultured with SCF (10 ng) and cell numbers and cell phenotypes analyzed by flow cytometry (A). Number of cells with LT-HSC (B), ST-HSC (C), or MPP (D) phenotype, and total number of cells (E), generated from normal and CML c-KITlo and c-KIThi LT-HSCs cultured with 10 ng SCF for 10 days (normal, n = 3, and CML, n = 5). Cell cycle analysis showing percentage of G0, G1, and S-G2-M phase normal (F) and CML (G) c-KITlo and c-KIThi LT-HSCs after culture for 24 hours in medium with and without SCF (n = 4 each). Data represented as mean ± SEM, *P < 0.05; **P < 0.01; ***P < 0.001; ****P < 0.0001, based on 2-way ANOVA with Tukey’s test.
We studied the effect of SCF stimulation on cell cycling of normal (Figure 5F) and CML (Figure 5G) c-KITlo and c-KIThi LT-HSCs. Interestingly, treatment with SCF for 24 hours did not enhance cycling of c-KITlo or c-KIThi LT-HSCs. These observations suggest that SCF mediated reduction in LT-HSCs and that expansion of ST-HSCs, MPPs, and total cell numbers may not be mediated by enhanced LT-HSC cycling.
SCF deletion enhances retention of CML c-KITlo LT-HSCs but reduces normal LT-HSCs.
SCF expressed in the BM microenvironment regulates HSC numbers and functionality (16). We sought to determine the role of in vivo SCF expression in regulating CML c-KITlo and c-KIThi LT-HSC populations. Normal and CML BM cells showed similar SCF protein levels in normal and CML BM plasma measured by ELISA and similar SCF mRNA expression in BM cells measured by qRT-PCR (Supplemental Figure 4, A and B). Using mice with an EGFP reporter targeted to the SCF locus, we found that EGFP was expressed primarily by nonhematopoietic CD45-negative cells in CML BM. The proportion of SCF-expressing CD45-negative cells was higher in CML compared with normal BM. The proportion of SCF-expressing CD45-positive cells was lower in CML compared with normal BM (data not shown). We deleted SCF expression by crossing Scffl/fl mice with UBC-Cre lines to generate Scffl/fl Ubc-cre (Cre+) mice, then treating mice with tamoxifen to induce Scf deletion (16). Scf excision was confirmed by genomic PCR and lack of Scf mRNA expression by qRT-PCR (Supplemental Figure 4, C and D). Scf-deleted mice showed significantly decreased BM cellularity, and reduced BM LT-HSCs, ST-HSCs, MPPs, granulocyte-macrophage progenitors (GMPs), and megakaryocyte-erythroid progenitors (MEPs), compared with Cre– controls (Supplemental Figure 4, E–K).
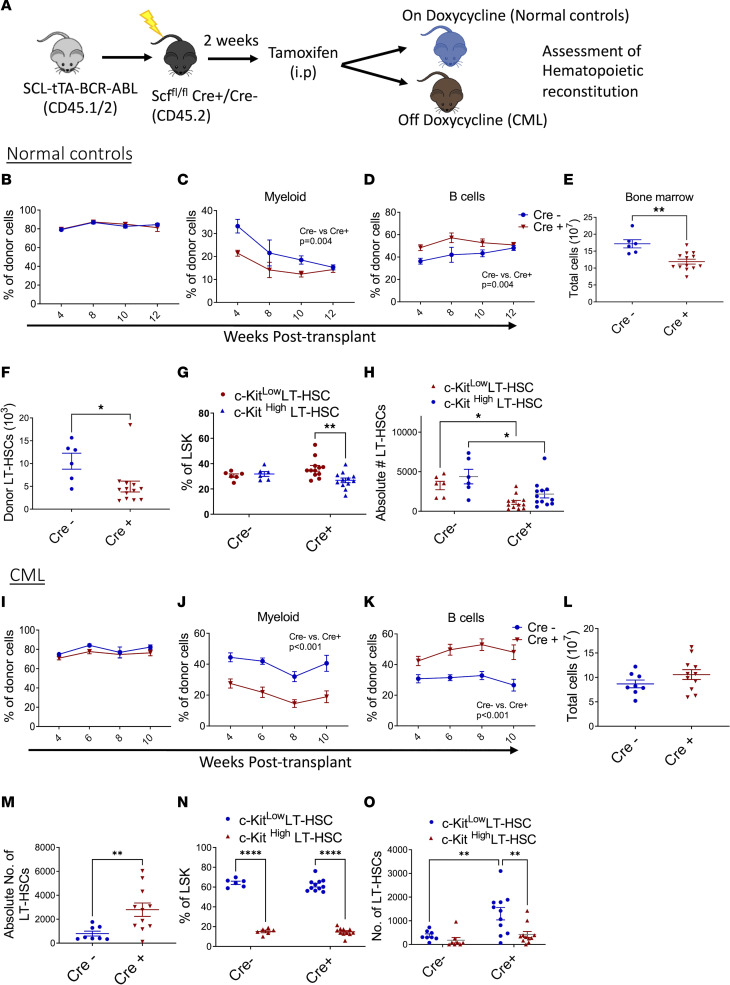
We next transplanted BM cells from Scl-tTA-BCR-ABL mice into lethally irradiated Cre+ and Cre– mice and induced Scf deletion 2 weeks posttransplant (Figure 6A). Control mice were maintained on doxycycline, to suppress BCR-ABL expression, throughout the experiment. Our previous studies have shown that the phenotype and function of BM mesenchymal cells from irradiated mice are similar to nonirradiated mice by 4 weeks after exposure (39). Total donor chimerism was similar in PB of Cre– and Cre+ (Scf-deleted) control mice, but myeloid donor chimerism was reduced and B cell donor chimerism increased in PB of Cre+ mice (Figure 6, B–D). BM cellularity and donor LT-HSC numbers were significantly reduced in Scf-deleted mice (Figure 6, E and F). The proportion of c-KIThi compared with c-KITlo donor LT-HSCs was increased in Scf-deleted mice (Figure 6G). Both c-KITlo and c-KIThi LT-HSC numbers were reduced in Scf-deleted mice (Figure 6H). To assess effects of Scf deletion on CML stem cells, doxycycline was withdrawn 4 weeks posttransplant to induce BCR-ABL expression (Figure 6A). Although total chimerism was not changed, significantly decreased myeloid and increased lymphoid chimerism were seen in Scf-deleted mice (Figure 6, I–K). Total BM cellularity and MPP and GMP numbers were not significantly altered (Figure 6L and Supplemental Figure 4, L and M). However, LT-HSC numbers were significantly increased in Scf-deleted CML mice compared with control Cre– CML mice (Figure 6M), with a significant increase in numbers of c-KITlo compared with c-KIThi LT-HSCs (Figure 6, N and O). A significant reduction in splenic LT-HSC, MPP, and GMP numbers was observed in Scf-deleted mice (Supplemental Figure 4, N–P). Therefore, deletion of Scf reduces c-KITlo LT-HSCs, total LT-HSC and progenitor numbers, and BM cellularity in normal mice, but increases c-KITlo LT-HSCs and total LT-HSCs in CML mice, while reducing splenic progenitors and circulating myeloid cells. Increased retention of CML LT-HSCs after deletion of Scf from the BM environment and reduced generation of splenic progenitors and mature myeloid cells are consistent with our observations of reduced LT-HSCs and enhanced generation of mature progeny after SCF stimulation. Similarly, depletion of normal LT-HSCs after Scf deletion is consistent with their enhanced maintenance after SCF stimulation.
Figure 6. Deletion of SCF alters c-KITlo LT-HSC numbers in vivo.
Experimental design: 1 × 10⁶ cells from SCL-tTA BCR-ABL mice were transplanted into lethally irradiated Scffl/fl-UBC-cre mice. Cre excision was induced with tamoxifen injections. Mice were subsequently kept on tetracycline (normal controls), or off doxycycline, to allow BCR-ABL expression and CML development (CML). (A). Total donor chimerism (B) and myeloid (C) and B cell (D) chimerism in PB of normal controls. Total BM cellularity (E) and number of BM LT-HSCs (F) in normal mice. Frequency of c-KITlo and c-KIThi LT-HSCs within the LSK compartment (G) and number of c-KITlo and c-KIThi LT-HSCs (H) in BM of normal mice (Cre– n = 6; Cre+ n = 13). Total donor chimerism (I) and myeloid (J) and B cell (K) chimerism in PB of CML mice. Total CML BM cellularity (L) and number of CML BM LT-HSCs (M) in CML mice. Frequency of c-KITlo and c-KIThi LT-HSCs within the LSK compartment (N), and number of c-KITlo and c-KIThi LT-HSC (O) in BM of CML mice (Cre– n = 8; Cre+ n = 11). Data represented as mean ± SEM, *P < 0.05, **P < 0.01, ****P < 0.0001, based on 2-way ANOVA with Tukey’s test (C, D, G, H, J, K, N, and O) and t test (E, F, and M).
Effect of TKI treatment on CML c-KITlo LT-HSCs.
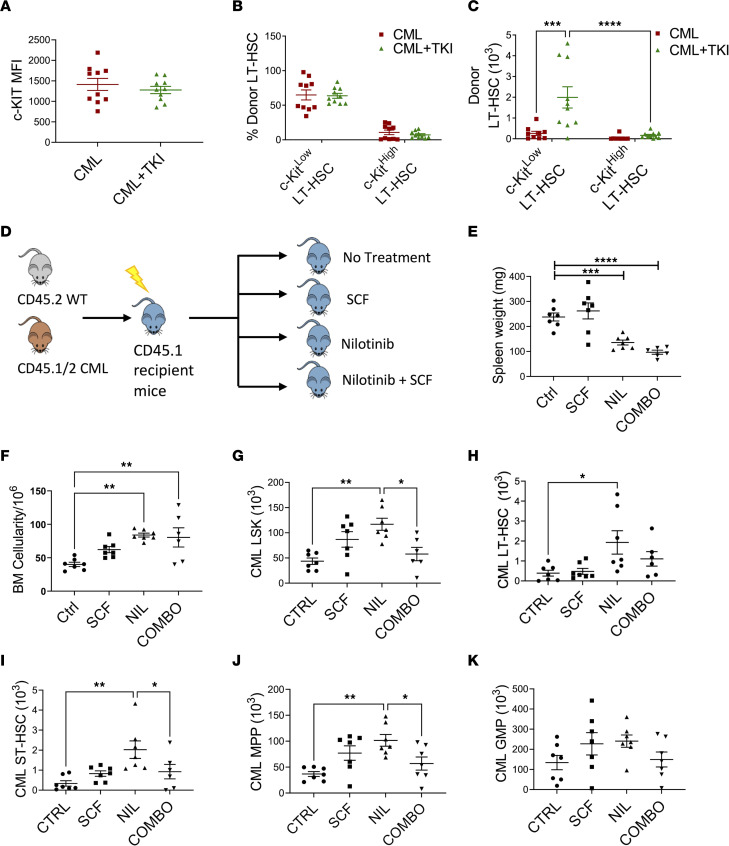
We assessed the effects of treatment with the BCR-ABL TKI nilotinib on CML c-KITlo LT-HSCs. CML mice treated with nilotinib for 2 weeks showed reduced PB WBC and spleen cellularity, but increased BM cellularity (Supplemental Figure 5, A and B) and BM LT-HSC frequency and numbers (Supplemental Figure 5, C and D), compared with vehicle-treated mice. The c-KIT MFI in LT-HSCs was not significantly different between TKI-treated and vehicle-treated mice (Figure 7A). Although the proportion of c-KITlo LT-HSCs was not changed after TKI treatment (Figure 7B), a significant increase in c-KITlo and c-KIThi LT-HSC numbers was observed (Figure 7C).
Figure 7. Effect of TKI treatment on murine leukemic LT-HSCs.
BM cells from SCL-tTA mice (CD45.2) were transplanted into lethally irradiated recipients (CD45.1) and maintained without doxycycline, resulting in development of CML after 8 weeks, then treated with vehicle (CML) or nilotinib (50 mg/kg/d) (CML+TKI) for 14 days. MFI of surface c-KIT levels on donor LT-HSC cells (A) and frequency (B) and absolute number (C) of donor c-KITlo and c-KIThi LT-HSCs in CML and CML+TKI mice (n = 9–10). Experimental design: 1 × 10⁶ CML (CD45.1/CD45.2) and normal (CD45.2) BM cells were transplanted into lethally irradiated recipient mice (CD45.1). After 8 weeks, mice were treated with vehicle (Ctrl), SCF (100 μg/kg/d), nilotinib (50 mg/kg/d) (NIL) or SCF and nilotinib combination (COMBO) for 14 days (D). Spleen weights (E), total BM cellularity (F), BM CML LSK cells (G), BM CML LT-HSCs (H), BM CML ST-HSCs (I), BM CML MPP (J), and BM CML GMP (K) numbers after treatment (n = 6–7 per arm). Data represented as mean ± SEM, *P < 0.05, **P < 0.01, ***P < 0.001, ****P < 0.0001, based on 2-way ANOVA with Tukey’s test (C) and 1-way ANOVA (E–J).
Since our results suggested that culture with SCF was associated with increased generation of mature progeny from CML LT-HSCs, we evaluated the effects of SCF treatment in vivo on CML LT-HSC response to TKI treatment. BM cells from CML and normal mice were transplanted into lethally irradiated mice, and after 8 weeks mice were treated with nilotinib, SCF, or a combination of nilotinib and SCF for 2 weeks (Figure 7D). Both nilotinib- and combination-treated mice showed decreased circulating neutrophils compared with controls (Supplemental Figure 5E). Nilotinib markedly reduced spleen weight (Figure 7E and Supplemental Figure 5F) but significantly increased BM cellularity and donor LSK cells, LT-HSCs, ST-HSCs, and MPPs (P < 0.05) compared with controls (Figure 7, F–K). Compared with mice treated with nilotinib alone, mice treated with SCF in combination with nilotinib showed significantly reduced LSK cell numbers, with reduced ST-HSC and MPP numbers (Figure 7, I and J). However, reduction in LT-HSC numbers was not statistically significant (Figure 7H). Nilotinib- and combination-treated mice showed a significant reduction in splenic GMP, without significant change in splenic LSK cells, LT-HSCs, ST-HSCs, and MPPs (Supplemental Figure 5, G–K). Combination treatment did not alter normal LSK cell and progenitor populations when compared to nilotinib, but combination treatment compared with nilotinib reduced ST-HSC counts (Supplemental Figure 5, L–O). These results indicate that nilotinib treatment reduces disease burden but enhances retention of CML stem cells. Short-term supplementary SCF treatment enhances elimination of CML ST-HSCs and MPPs but not primitive LT-HSCs in nilotinib-treated mice.
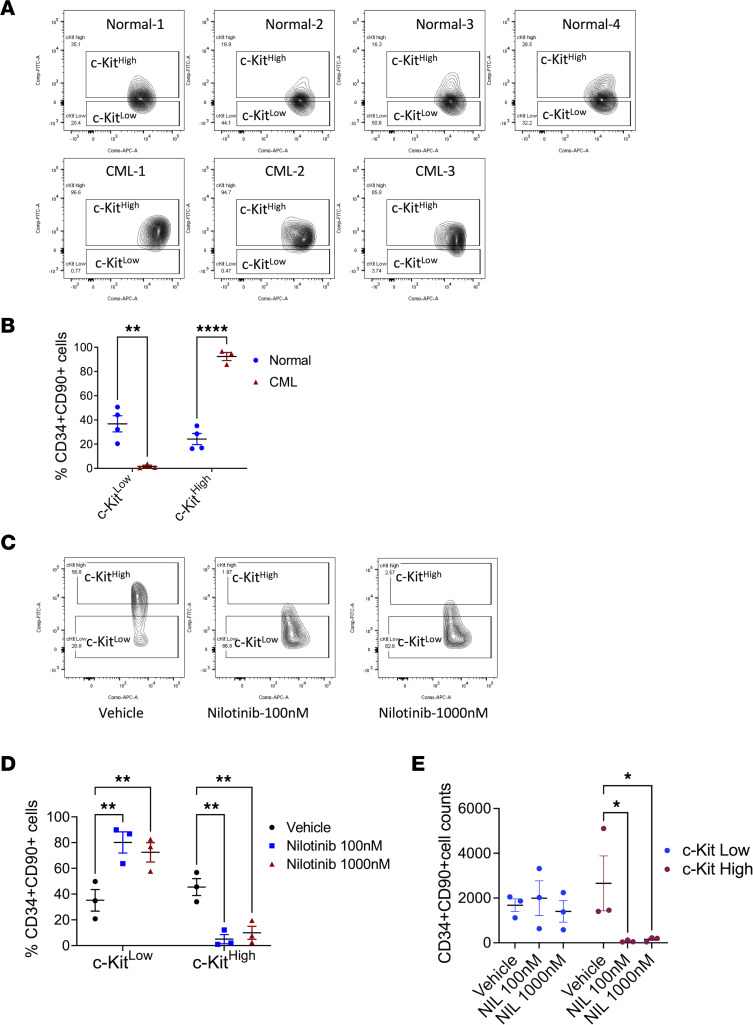
We further studied the effect of TKI treatment on human c-KITlo versus c-KIThi CML LT-HSCs. As with murine LT-HSCs, normal human LT-HSCs (CD34+CD38–CD90+) with the highest c-KIT expression (top 30%) were defined as c-KIThi LT-HSCs, and LT-HSCs with the lowest c-KIT expression (bottom 30%) were defined as c-KITlo LT-HSCs. Using the normal LT-HSC gates, increased proportions of human CML LT-HSCs were c-KIThi LT-HSCs, and reduced proportions were c-KITlo LT-HSCs, differing from our observations with murine stem cells (Figure 8, A and B). However, a significant reduction in proportions of c-KIThi CML LT-HSCs and increase in proportions of c-KITlo CML LT-HSCs were seen following culture of CML CD34+ cells with nilotinib for 7 days (Figure 8, C and D). CML c-KIThi LT-HSC numbers were significantly reduced whereas c-KITlo LT-HSC numbers were maintained after nilotinib treatment (Figure 8E). These results suggest that c-KIThi CML LT-HSCs were selectively depleted while c-KITlo CML LT-HSCs were preserved after TKI treatment.
Figure 8. Effect of TKI treatment on human CML c-KITlo LT-HSCs.
CD34+ cells from BM from patients with CML (n = 3) and healthy individuals (n = 4) were analyzed by flow cytometry, and LT-HSCs (CD34+CD38–CD90+) with high c-KIT expression (top 30%, c-KIThi) and low c-KIT expression (bottom 30%, c-KITlo) were identified, following the scheme used in Figure 1. Flow plots showing c-KIT expression in LT-HSCs are shown (A) with compiled data (B). CML CD34+ cells were cultured for 7 days in vitro without TKI (vehicle) or with nilotinib 100 nM and 1,000 nM and CD34+CD90+ cells were analyzed. Flow plots showing c-KIT expression are shown in C and compiled data for the proportion of c-KITlo and c-KIThi CD34+CD90+ cells in D and for number of c-KITlo and c-KIThi CD34+CD90+ cells in E. Data represented as mean ± SEM, *P < 0.05, **P < 0.01, ****P < 0.0001, based on 2-way ANOVA with Tukey’s test.
Discussion
TKI treatment does not eliminate primitive, quiescent CML LT-HSCs (2), which persist as a source of leukemia recurrence when treatment is discontinued. A subset of patients with CML can successfully maintain remission after stopping TKI treatment (40). However, long-term persistence of BCR-ABL1+ cells is observed, and early and late recurrences may be seen, indicating the importance of better understanding the heterogeneity of the regenerative and leukemogenic potential of CML LT-HSCs (41, 42). Here we identify variable expression of c-Kit as an important determinant of LT-HSC potential and TKI resistance in CML.
Previous studies showed that primitive, quiescent, self-renewing LT-HSCs are enriched within the c-KITlo subset in normal adult BM (21). Here we show that long-term repopulating and leukemia-initiating capacity is restricted to CML c-KITlo LT-HSCs, which are more quiescent, whereas CML c-KIThi LT-HSCs show increased cycling and lack repopulating potential. Therefore, CML c-KITlo LT-HSCs lie at the apex of the leukemia cell hierarchy. BCR-ABL was expressed and BCR-ABL signaling was active in CML c-KITlo LT-HSCs. CML LT-HSCs showed altered response to SCF stimulation with increased generation of progenitors and mature cells compared with LT-HSCs. SCF exposure was associated with reduced retention of LT-HSCs and increased generation of ST-HSCs and MPPs from CML c-KITlo LT-HSCs compared with normal c-KITlo LT-HSCs. Loss of SCF from perivascular and endothelial niches decreased normal HSC frequency and reconstitution ability (16). In contrast, deletion of SCF in CML mice reduced leukemia burden but increased retention of CML c-KITlo LT-HSCs. These observations suggest that SCF signaling promotes maturation of CML c-KITlo LT-HSCs toward c-KIThi LT-HSCs and expansion of their progeny. The effects of SCF deletion differed from those of deleting the chemokine CXCL12 from BM mesenchymal stem cells niches, a deletion that increases LSC cycling and self-renewal and accelerates leukemia development (39).
Heterogeneity in cell surface c-KIT expression on CML LT-HSCs was not related to differences in transcript levels. Previous studies also showed similar c-Kit mRNA expression in normal c-KITlo and c-KIThi HSCs (20). Cell surface c-KIT expression is regulated by activation and internalization of the protein after SCF binding, recruitment of signaling proteins, ubiquitination, and degradation (43). New c-KIT protein production is necessary for receptor reappearance on the cell surface. Reduced intracellular c-KIT expression in CML LT-HSCs may therefore reflect increased c-KIT protein degradation. Shin et al. showed a role for c-Cbl, an E3 ubiquitin ligase, in regulating c-KIT levels in LT-HSCs (21). Since c-CBL is prominently tyrosine-phosphorylated in BCR-ABL–expressing cells, reduced intracellular c-KIT levels could reflect altered c-CBL activity (44).
We report observations that CML c-KIThi LT-HSCs were depleted and CML c-KITlo LT-HSCs were maintained and enriched after TKI treatment. Importantly, these observations were validated with human CML LT-HSCs. These results indicate that CML LT-HSCs with low or absent c-KIT expression represent a TKI-resistant subpopulation and are consistent with the observation that primitive CD34+ cells that persist in CML patients on TKI treatment are characterized by lack of c-KIT expression (42). SCF stimulation failed to enhance LT-HSC cycling, and supplementary SCF treatment reduced CML ST-HSCs, MPPs, committed progenitors, and cell numbers in TKI-treated mice but failed to deplete CML LT-HSCs. Several BCR-ABL–targeting TKIs, including imatinib, nilotinib, dasatinib, and ponatinib, have c-KIT–inhibitory activity in addition to ABL kinase–inhibitory activities (45). However, Corbin at al. reported that c-KIT inhibition by TKI contributes to effects on CML progenitors but not stem cells (46).
CML c-KITlo LT-HSCs expressed gene signatures for inflammatory signaling and quiescence, which are also characteristic of LT-HSC subpopulations that persist in patients with CML following TKI treatment (38). CML c-KITlo LT-HSCs were also enriched for signatures for Wnt and Hedgehog signaling, important developmental regulators for CML LSC maintenance and self-renewal (5, 34, 36, 37). Finally, CML c-KITlo LT-HSCs showed altered metabolic gene signatures, with increased glycolytic but reduced oxidative and fatty acid metabolism gene signatures. CML primitive progenitors are reported to have enhanced OXPHOS and to be sensitive to mitochondrial inhibitors (47). The present studies indicate differences in metabolic gene signatures among primitive CML LT-HSCs with high and low c-KIT expression and suggest that heterogeneous LT-HSC subpopulations may have different metabolic dependencies.
In conclusion, our results provide improved resolution of the heterogeneity of CML LT-HSC populations based on different levels of c-KIT expression. Leukemia-initiating cells with in vivo regenerating capacity are enriched within the CML c-KITlo LT-HSC population and depleted within the c-KIThi LT-HSC population. c-KITlo LT-HSCs are resistant to TKIs and are enriched after TKI treatment. Human CML LT-HSCs with low or absent c-KIT expression are enriched after exposure to TKIs, consistent with the observation that CML stem cells persisting in TKI-treated patients with CML lack c-KIT expression, supporting the clinical relevance of our work. Thus, our studies identify and characterize a quiescent, treatment-resistant, primitive leukemia-initiating subpopulation in CML that is an important target for further studies aimed at eliminating persistent disease.
Methods
Animal studies
UBC-cre (B6.Cg-Ndor1Tg(UBC-cre/ERT2)1Ejb/1J), ScfΔ/Δ (Kitltm2.1Sjm/J), Scfgfp/+ (Kitltm1.1Sjm/J), and C57BL/6 mice were from The Jackson Laboratory, and C57BL/6.SJL mice from Charles River Laboratories. Scl-tTA-BCR-ABL mice were maintained on doxycycline chow (Envigo). For transplantation, mice were lethally irradiated at 4 Gy times 2 doses, 4 hours apart, and total BM or FACS-sorted LT-HSCs were transplanted along with 2 × 10⁵ support BM cells via intravenous injection. Mice received sulfatrim food (TestDiet) posttransplantation. Experiments were performed using mice of both sexes at 6–12 weeks old. Mice were randomly divided into experimental groups. Mice were subjected to 12-hour light/12-hour dark cycles and controlled ambient room temperature and humidity. All mice were maintained in Association for Assessment and Accreditation of Laboratory Animal Care International–accredited, specific pathogen–free animal care facilities, and procedures were conducted in accordance with federal guidelines using protocols approved by the Institutional Animal Care and Use Committee at the University of Alabama at Birmingham (UAB). Animal models utilized in this study are summarized in the Supplemental Methods.
Human samples
BM and PB were obtained from patients with CML seen at the UAB. Normal PB stem cells were obtained from transplant donors also recruited at the UAB. Mononuclear cells were isolated by Ficoll-Hypaque (Sigma Diagnostics) centrifugation. CD34+ cells were isolated using immunomagnetic beads (Miltenyi Biotec). Sample acquisition was approved by the UAB Institutional Review Board in accordance with assurances filed with the Department of Health and Human Services and requirements of the Declaration of Helsinki. Informed consent was obtained from patients and healthy donors.
Drug administration
Tamoxifen (75 mg/kg, Cayman Chemical) in corn oil was administered intraperitoneally for 5 days to Ubc-ScfΔ/Δ-cre mice. Nilotinib (50 mg/kg/day in 0.5% methylcellulose + 0.5% Tween-80, Novartis) was administered by oral gavage. SCF (100 μg/kg, PeproTech) was administered intraperitoneally for 2 weeks. For in vitro analysis, cells were cultured with 5 μM nilotinib, 10 ng/mL SCF, or combination, for 7 days.
Flow cytometry
BM cells were isolated by crushing in PBS with 2% heat-inactivated fetal bovine serum (Thermo Fisher Scientific). Spleen cells were obtained by crushing and filtering through a 70 μm filter mesh (Thermo Fisher Scientific). PB, BM, and spleen cells were labeled with relevant antibodies as summarized in the Supplemental Methods, including anti-CD45.1, anti-CD45.2, anti–Gr-1, anti–Mac-1, anti-B220, anti-CD19, and anti-CD3; lineage cocktail (anti-ter119, anti-CD3e, anti-Nk1.1, anti-CD4, anti-CD19, anti–Gr-1, anti–Mac-1, anti-B220, anti-CD8a, and anti-CD8b); and anti–c-KIT (2B8), anti–Sca-1, anti-Flt3, anti-CD150, anti-CD48, anti-CD127, anti-CD16/32, anti-CD34, anti-CD105, anti-CD41, anti-CD71, and anti-Ter119. For transplanted mice, donor cells were selected based on CD45.2 or CD45.1/2 expression as appropriate. Mature populations were identified as follows: myeloid cells (Gr-1+Mac-1+), B cells (B220+CD19+), and T cells (CD3+). Hematopoietic stem/progenitor populations included GMPs (Lin–Sca-1–c-KIT+CD34+FcgR+), MEPs (Lin–Sca-1–c-KIT+CD34–FcgR–), MPPs (Lin–Sca-1+c-KIT+Flt3–CD48+), ST-HSCs (Lin Sca-1+c-KIT+Flt3–CD150–CD48–), and LT-HSCs (Lin–Sca-1+c-KIT+Flt3–CD150+CD48–). To assess BM stromal populations, long bones were crushed, and fragments were digested with collagenase II (50 U/mL, MilliporeSigma), dispase II (200 U/mL, MilliporeSigma), and DNase I (100 U/mL, MilliporeSigma); washed; and mixed with the BM supernatant. Cells were labeled with anti-CD45, anti-Ter119, anti-CD31, anti-CD51, anti–Sca-1, and anti-CD140a antibodies and DAPI/Aqua blue (Thermo Fisher Scientific) or Fixable Dye eFluor 450. Cells were analyzed on LSR Fortessa, FACS LSR II, or FACSAria II (BD Biosciences) and data processed using FlowJo LLC.
For cell cycle analysis, BM cells were stained for stem cell markers, fixed using BD Cytofix/Cytoperm (BD Biosciences), and then stained with Ki-67 and DAPI and analyzed using flow cytometry. For intracellular flow cytometry for p-STAT5, lineage-negative cells were enriched from BM using lineage microbeads and the autoMACS Pro Separator (both Miltenyi Biotec), labeled with antibodies for stem cell markers, fixed with 4% paraformaldehyde, permeabilized with Cytofix/Cytoperm, and stained with p-STAT5–PE (1:50 dilution, Cell Signaling Technology).
In vitro culture
Murine cells.
Immature cells were enriched from BM using lineage microbeads and the autoMACS Pro Separator and stained with antibodies against lineage markers; anti-Flt3, anti–c-KIT, anti–Sca-1, anti-CD150, and anti-CD48 (Thermo Fisher Scientific); and DAPI. Samples were sorted using a FACSAria II. Cells were cultured in U-bottom, 96-well plates (100 cells/well) in StemSpan SFEM II medium (StemCell Technologies) with penicillin/streptomycin (Invitrogen, Thermo Fisher Scientific), antibiotic/antimycotic (HyClone), and erythropoietin, thrombopoietin (TPO), IL-3, IL-6, FLT3, GMSCF (all 10 ng/mL; PeproTech), and SCF at 37°C and 5% CO2. Cell populations were enumerated by adding Countbright beads (Thermo Fisher Scientific); Lin– (anti-ter119, anti-IgG, anti-CD3e, anti-Nk1.1, anti-CD4, anti-CD19, anti–Gr-1, anti-B220, anti-CD8a, and anti-CD8b); anti-CD11b, anti–Sca-1, anti-CD117, anti-Flt3, anti-CD150, anti-CD48, and DAPI or Fixable Dye eFluor 450 to wells and analyzed on an LSR Fortessa.
Human cells.
Human CD34+ cells were cultured in StemSpan SFEM II media supplemented with human IL-3 (20 ng/mL), G-CSF (20 ng/mL), FLT3 ligand (50 ng/mL), TPO (25 ng/mL), SCF (25 ng/mL) (PeproTech), SR1 (500 nM), UM729 (1 μM, IRIC), penicillin, and glutamine for 7 days with or without TKI (nilotinib 100 nM, 1,000 nM).
SCF ELISA
BM was extracted from femurs in 100 μL of PBS; cells were pelleted at 1,000g for 10 minutes at 4°C; and supernatant containing BM plasma was obtained. SCF concentrations were analyzed using a mouse Quantikine SCF ELISA Kit (R&D Systems, Bio-Techne).
Genomic PCR and qRT-PCR
Genomic PCR was performed as described in Ding et al. (16). For qRT-PCR, RNA was extracted (Qiagen) and converted to cDNA (Invitrogen, Thermo Fisher Scientific). c-KIT (Mm00445212_m1) and SCF (Mm00442972_m1) expression were measured using TaqMan probes (Invitrogen, Thermo Fisher Scientific) using a QuantStudio 6 (Thermo Fisher Scientific). Expression levels were normalized to GAPDH (Mouse GAPDH VIC-MGB, Applied Biosystems, Thermo Fisher Scientific). For Bcr-Abl1 mRNA measurements, RNA was extracted from c-KITlo and c-KIThi cells LT-HSCs using the RNeasy Plus Micro Kit (Qiagen), cDNA was synthesized using the Superscript III first strand kit (Invitrogen, Thermo Fisher Scientific), and qRT-PCR was performed using TaqMan universal PCR master mix kit and the QuantStudio 6 Flex (Applied Biosystems, Thermo Fisher Scientific). Primer and probe sequences for B3A2 were as previously described (48).
RNA-Seq analysis
RNA was extracted from normal and leukemic BM c-KITlo and c-KIThi LT-HSCs using RNeasy Plus Micro Kit (Qiagen), with 4 biological replicates per group. Sequencing libraries were prepared with the SMARTer Ultra Low Input RNA Kit for Sequencing (v4, TaKaRa) and Nextera XT DNA Library Preparation Kit (96 samples, Illumina). Sequencing was performed using the HiSeq 2500 platform with the HiSeq SBS Kit V4 (Illumina). STAR (version 2.5.3a) was used to align RNA-Seq FASTQ reads to the mouse reference genome (Gencode Release M11), and reads mapping to each gene were enumerated using HTSeq-count50. Normalization and differential expression analysis was done using DESeq2 (Bioconductor) (49). Volcano plots were created using the R statistical program. Enrichment of gene signatures was analyzed using GSEA, Broad Institute (50). Protein-protein association network analysis was performed using STRING (STRINGv11) (51). Heatmaps were created using Heatmapper (52).
Data sharing
The RNA-Seq data have been deposited in the NCBI’s Gene Expression Omnibus (accession number GSE180496) (https://www.ncbi.nlm.nih.gov/geo/query/acc.cgi?acc=GSE180496). For original data, please contact the corresponding author at r.bhatia@uabmc.edu.
Statistics
Unless otherwise specified, results obtained from independent experiments are reported as means ± SEM of multiple replicates, and statistical analyses were performed using unpaired, nonparametric, 2-tailed t test or 2-way ANOVA, adjusting for multiple comparisons with Tukey’s test or Holm-Šídák test as indicated (GraphPad Prism version 6.0). Data were examined for normality by evaluating skewness and for equivalence of variance by comparing variance between groups. P values less than 0.05 were considered statistically significant.
Study approval
All mouse experiments were approved by the Institutional Animal Care and Use Committee at the UAB. Studies using human samples were approved by the UAB Institutional Review Board in accordance with assurances filed with the Department of Health and Human Services. Written informed consent was obtained from patients and healthy donors.
Author contributions
MS designed, planned, and conducted experiments; analyzed data; and wrote the manuscript. HK and SQ designed, planned, and conducted experiments; HL, MH, and AA conducted experiments; JH and DKC analyzed the data; and AP and RSW reviewed and edited the manuscript. RB designed the experiments, analyzed data, and wrote the manuscript.
Supplementary Material
Acknowledgments
This work was supported by NIH grants R01 CA172447 and R01 CA248794 to RB. We thank the HudsonAlpha Institute for Biotechnology Sequencing Facility, Huntsville, Alabama, for performing RNA-Seq and the UAB Comprehensive Flow Cytometry Core and Animal Resource Center for providing help with FACS sorting and maintaining mice colonies, respectively.
Version 1. 11/22/2022
In-Press Preview
Version 2. 01/10/2023
Electronic publication
Footnotes
Conflict of interest: The authors have declared that no conflict of interest exists.
Copyright: © 2023, Shah et al. This is an open access article published under the terms of the Creative Commons Attribution 4.0 International License.
Reference information: JCI Insight. 2023;8(1):e157421.https://doi.org/10.1172/jci.insight.157421.
Contributor Information
Mansi Shah, Email: mansi.manoj.shah@gmail.com.
Harish Kumar, Email: harishkumar@uabmc.edu.
Shaowei Qiu, Email: sqiu@uabmc.edu.
Hui Li, Email: huili@uabmc.edu.
Mason Harris, Email: masonharris@uabmc.edu.
Jianbo He, Email: jianbo@uab.edu.
Ajay Abraham, Email: ajayabrams@gmail.com.
David K. Crossman, Email: dkcrossm@uab.edu.
Andrew Paterson, Email: andrewpaterson@uabmc.edu.
Robert S. Welner, Email: rwelner@uab.edu.
Ravi Bhatia, Email: rbhatia@uabmc.edu.
References
- 1.Druker BJ, et al. Five-year follow-up of patients receiving imatinib for chronic myeloid leukemia. N Engl J Med. 2006;355(23):2408–2417. doi: 10.1056/NEJMoa062867. [DOI] [PubMed] [Google Scholar]
- 2.Chu S, et al. Persistence of leukemia stem cells in chronic myelogenous leukemia patients in prolonged remission with imatinib treatment. Blood. 2011;118(20):5565–5572. doi: 10.1182/blood-2010-12-327437. [DOI] [PMC free article] [PubMed] [Google Scholar]
- 3.Chu S, et al. BCR/ABL kinase inhibition by imatinib mesylate enhances MAP kinase activity in chronic myelogenous leukemia CD34+ cells. Blood. 2004;103(8):3167–3174. doi: 10.1182/blood-2003-04-1271. [DOI] [PubMed] [Google Scholar]
- 4.Corbin AS, et al. Human chronic myeloid leukemia stem cells are insensitive to imatinib despite inhibition of BCR-ABL activity. J Clin Invest. 2011;121(1):396–409. doi: 10.1172/JCI35721. [DOI] [PMC free article] [PubMed] [Google Scholar]
- 5.Zhang B, et al. Microenvironmental protection of CML stem and progenitor cells from tyrosine kinase inhibitors through N-cadherin and Wnt-β-catenin signaling. Blood. 2013;121(10):1824–1838. doi: 10.1182/blood-2012-02-412890. [DOI] [PMC free article] [PubMed] [Google Scholar]
- 6.Copley MR, et al. Hematopoietic stem cell heterogeneity takes center stage. Cell Stem Cell. 2012;10(6):690–697. doi: 10.1016/j.stem.2012.05.006. [DOI] [PubMed] [Google Scholar]
- 7.Muller-Sieburg CE, et al. Stem cell heterogeneity: implications for aging and regenerative medicine. Blood. 2012;119(17):3900–3907. doi: 10.1182/blood-2011-12-376749. [DOI] [PMC free article] [PubMed] [Google Scholar]
- 8.Ikuta K, Weissman IL. Evidence that hematopoietic stem cells express mouse c-kit but do not depend on steel factor for their generation. Proc Natl Acad Sci U S A. 1992;89(4):1502–1506. doi: 10.1073/pnas.89.4.1502. [DOI] [PMC free article] [PubMed] [Google Scholar]
- 9.Russell ES. Hereditary anemias of the mouse: a review for geneticists. Adv Genet. 1979;20:357–459. doi: 10.1016/S0065-2660(08)60549-0. [DOI] [PubMed] [Google Scholar]
- 10.Broudy VC. Stem cell factor and hematopoiesis. Blood. 1997;90(4):1345–1364. doi: 10.1182/blood.V90.4.1345. [DOI] [PubMed] [Google Scholar]
- 11.Czechowicz A, et al. Efficient transplantation via antibody-based clearance of hematopoietic stem cell niches. Science. 2007;318(5854):1296–1299. doi: 10.1126/science.1149726. [DOI] [PMC free article] [PubMed] [Google Scholar]
- 12.Ogawa M, et al. Expression and function of c-kit in hemopoietic progenitor cells. J Exp Med. 1991;174(1):63–71. doi: 10.1084/jem.174.1.63. [DOI] [PMC free article] [PubMed] [Google Scholar]
- 13.Zsebo KM, et al. Stem cell factor is encoded at the Sl locus of the mouse and is the ligand for the c-kit tyrosine kinase receptor. Cell. 1990;63(1):213–224. doi: 10.1016/0092-8674(90)90302-U. [DOI] [PubMed] [Google Scholar]
- 14.Morrison SJ, Spradling AC. Stem cells and niches: mechanisms that promote stem cell maintenance throughout life. Cell. 2008;132(4):598–611. doi: 10.1016/j.cell.2008.01.038. [DOI] [PMC free article] [PubMed] [Google Scholar]
- 15.Rieger MA, Schroeder T. Instruction of lineage choice by hematopoietic cytokines. Cell Cycle. 2009;8(24):4019–4020. doi: 10.4161/cc.8.24.10261. [DOI] [PubMed] [Google Scholar]
- 16.Ding L, et al. Endothelial and perivascular cells maintain haematopoietic stem cells. Nature. 2012;481(7382):457–462. doi: 10.1038/nature10783. [DOI] [PMC free article] [PubMed] [Google Scholar]
- 17.Thoren LA, et al. Kit regulates maintenance of quiescent hematopoietic stem cells. J Immunol. 2008;180(4):2045–2053. doi: 10.4049/jimmunol.180.4.2045. [DOI] [PubMed] [Google Scholar]
- 18.Waskow C, et al. Hematopoietic stem cell transplantation without irradiation. Nat Methods. 2009;6(4):267–269. doi: 10.1038/nmeth.1309. [DOI] [PubMed] [Google Scholar]
- 19.Grinenko T, et al. Clonal expansion capacity defines two consecutive developmental stages of long-term hematopoietic stem cells. J Exp Med. 2014;211(2):209–215. doi: 10.1084/jem.20131115. [DOI] [PMC free article] [PubMed] [Google Scholar]
- 20.Matsuoka Y, et al. Low level of c-kit expression marks deeply quiescent murine hematopoietic stem cells. Stem Cells. 2011;29(11):1783–1791. doi: 10.1002/stem.721. [DOI] [PubMed] [Google Scholar]
- 21.Shin JY, et al. High c-Kit expression identifies hematopoietic stem cells with impaired self-renewal and megakaryocytic bias. J Exp Med. 2014;211(2):217–231. doi: 10.1084/jem.20131128. [DOI] [PMC free article] [PubMed] [Google Scholar]
- 22.Agarwal R, et al. Long-term culture of chronic myelogenous leukemia marrow cells on stem cell factor-deficient stroma favors benign progenitors. Blood. 1995;85(5):1306–1312. doi: 10.1182/blood.V85.5.1306.bloodjournal8551306. [DOI] [PubMed] [Google Scholar]
- 23.Moore S, et al. Stem cell factor as a single agent induces selective proliferation of the Philadelphia chromosome positive fraction of chronic myeloid leukemia CD34(+) cells. Blood. 1998;92(7):2461–2470. doi: 10.1182/blood.V92.7.2461. [DOI] [PubMed] [Google Scholar]
- 24.Neering SJ, et al. Leukemia stem cells in a genetically defined murine model of blast-crisis CML. Blood. 2007;110(7):2578–2585. doi: 10.1182/blood-2007-02-073031. [DOI] [PMC free article] [PubMed] [Google Scholar]
- 25.Reynaud D, et al. IL-6 controls leukemic multipotent progenitor cell fate and contributes to chronic myelogenous leukemia development. Cancer Cell. 2011;20(5):661–673. doi: 10.1016/j.ccr.2011.10.012. [DOI] [PMC free article] [PubMed] [Google Scholar]
- 26.Zhang B, et al. Altered microenvironmental regulation of leukemic and normal stem cells in chronic myelogenous leukemia. Cancer Cell. 2012;21(4):577–592. doi: 10.1016/j.ccr.2012.02.018. [DOI] [PMC free article] [PubMed] [Google Scholar]
- 27.Abraham SA, et al. Dual targeting of p53 and c-MYC selectively eliminates leukaemic stem cells. Nature. 2016;534(7607):341–346. doi: 10.1038/nature18288. [DOI] [PMC free article] [PubMed] [Google Scholar]
- 28.Eiring AM, et al. β-catenin is required for intrinsic but not extrinsic BCR-ABL1 kinase-independent resistance to tyrosine kinase inhibitors in chronic myeloid leukemia. Leukemia. 2015;29(12):2328–2337. doi: 10.1038/leu.2015.196. [DOI] [PMC free article] [PubMed] [Google Scholar]
- 29.Kuepper MK, et al. Stem cell persistence in CML is mediated by extrinsically activated JAK1-STAT3 signaling. Leukemia. 2019;33(8):1964–1977. doi: 10.1038/s41375-019-0427-7. [DOI] [PubMed] [Google Scholar]
- 30.Nair RR, et al. Role of STAT3 in transformation and drug resistance in CML. Front Oncol. 2012;2:30. doi: 10.3389/fonc.2012.00030. [DOI] [PMC free article] [PubMed] [Google Scholar]
- 31.Nie ZY, et al. De-regulated STAT5A/miR-202-5p/USP15/caspase-6 regulatory axis suppresses CML cell apoptosis and contributes to Imatinib resistance. J Exp Clin Cancer Res. 2020;39(1):17. doi: 10.1186/s13046-019-1502-7. [DOI] [PMC free article] [PubMed] [Google Scholar]
- 32.Sharma M, et al. Gene expression profiling of CD34(+) cells from patients with myeloproliferative neoplasms. Oncol Lett. 2021;21(3):204. doi: 10.3892/ol.2021.12465. [DOI] [PMC free article] [PubMed] [Google Scholar]
- 33.Stella S, et al. Suppression of survivin induced by a BCR-ABL/JAK2/STAT3 pathway sensitizes imatinib-resistant CML cells to different cytotoxic drugs. Mol Cancer Ther. 2013;12(6):1085–1098. doi: 10.1158/1535-7163.MCT-12-0550. [DOI] [PubMed] [Google Scholar]
- 34.Su W, et al. Sonic hedgehog maintains survival and growth of chronic myeloid leukemia progenitor cells through β-catenin signaling. Exp Hematol. 2012;40(5):418–427. doi: 10.1016/j.exphem.2012.01.003. [DOI] [PubMed] [Google Scholar]
- 35.Zhang B, et al. Heterogeneity of leukemia-initiating capacity of chronic myelogenous leukemia stem cells. J Clin Invest. 2016;126(3):975–991. doi: 10.1172/JCI79196. [DOI] [PMC free article] [PubMed] [Google Scholar]
- 36.Irvine DA, et al. Deregulated hedgehog pathway signaling is inhibited by the smoothened antagonist LDE225 (sonidegib) in chronic phase chronic myeloid leukaemia. Sci Rep. 2016;6:25476. doi: 10.1038/srep25476. [DOI] [PMC free article] [PubMed] [Google Scholar]
- 37.Zeng X, et al. Targeting Hedgehog signaling pathway and autophagy overcomes drug resistance of BCR-ABL-positive chronic myeloid leukemia. Autophagy. 2015;11(2):355–372. doi: 10.4161/15548627.2014.994368. [DOI] [PMC free article] [PubMed] [Google Scholar]
- 38.Giustacchini A, et al. Single-cell transcriptomics uncovers distinct molecular signatures of stem cells in chronic myeloid leukemia. Nat Med. 2017;23(6):692–702. doi: 10.1038/nm.4336. [DOI] [PubMed] [Google Scholar]
- 39.Agarwal P, et al. Mesenchymal niche-specific expression of Cxcl12 controls quiescence of treatment-resistant leukemia stem cells. Cell Stem Cell. 2019;24(5):769–784. doi: 10.1016/j.stem.2019.02.018. [DOI] [PMC free article] [PubMed] [Google Scholar]
- 40.Mahon FX, et al. Discontinuation of imatinib in patients with chronic myeloid leukaemia who have maintained complete molecular remission for at least 2 years: the prospective, multicentre Stop Imatinib (STIM) trial. Lancet Oncol. 2010;11(11):1029–1035. doi: 10.1016/S1470-2045(10)70233-3. [DOI] [PubMed] [Google Scholar]
- 41.Ross DM, et al. Long-term treatment-free remission of chronic myeloid leukemia with falling levels of residual leukemic cells. Leukemia. 2018;32(12):2572–2579. doi: 10.1038/s41375-018-0264-0. [DOI] [PubMed] [Google Scholar]
- 42.Warfvinge R, et al. Single-cell molecular analysis defines therapy response and immunophenotype of stem cell subpopulations in CML. Blood. 2017;129(17):2384–2394. doi: 10.1182/blood-2016-07-728873. [DOI] [PMC free article] [PubMed] [Google Scholar]
- 43.Yee NS, et al. Mechanism of down-regulation of c-kit receptor. Roles of receptor tyrosine kinase, phosphatidylinositol 3’-kinase, and protein kinase C. J Biol Chem. 1994;269(50):31991–31998. doi: 10.1016/S0021-9258(18)31793-9. [DOI] [PubMed] [Google Scholar]
- 44.Bhat A, et al. Interactions of CBL with BCR-ABL and CRKL in BCR-ABL-transformed myeloid cells. J Biol Chem. 1997;272(26):16170–16175. doi: 10.1074/jbc.272.26.16170. [DOI] [PubMed] [Google Scholar]
- 45.Hantschel O, et al. Target spectrum of the BCR-ABL inhibitors imatinib, nilotinib and dasatinib. Leuk Lymphoma. 2008;49(4):615–619. doi: 10.1080/10428190801896103. [DOI] [PubMed] [Google Scholar]
- 46.Corbin AS, et al. KIT signaling governs differential sensitivity of mature and primitive CML progenitors to tyrosine kinase inhibitors. Cancer Res. 2013;73(18):5775–5786. doi: 10.1158/0008-5472.CAN-13-1318. [DOI] [PMC free article] [PubMed] [Google Scholar]
- 47.Kuntz EM, et al. Targeting mitochondrial oxidative phosphorylation eradicates therapy-resistant chronic myeloid leukemia stem cells. Nat Med. 2017;23(10):1234–1240. doi: 10.1038/nm.4399. [DOI] [PMC free article] [PubMed] [Google Scholar]
- 48.Branford S, et al. Monitoring chronic myeloid leukaemia therapy by real-time quantitative PCR in blood is a reliable alternative to bone marrow cytogenetics. Br J Haematol. 1999;107(3):587–599. doi: 10.1046/j.1365-2141.1999.01749.x. [DOI] [PubMed] [Google Scholar]
- 49.Love MI, et al. Moderated estimation of fold change and dispersion for RNA-seq data with DESeq2. Genome Biol. 2014;15(12):550. doi: 10.1186/s13059-014-0550-8. [DOI] [PMC free article] [PubMed] [Google Scholar]
- 50.Subramanian A, et al. Gene set enrichment analysis: a knowledge-based approach for interpreting genome-wide expression profiles. Proc Natl Acad Sci U S A. 2005;102(43):15545–15550. doi: 10.1073/pnas.0506580102. [DOI] [PMC free article] [PubMed] [Google Scholar]
- 51.Szklarczyk D, et al. STRING v11: protein-protein association networks with increased coverage, supporting functional discovery in genome-wide experimental datasets. Nucleic Acids Res. 2019;47(d1):D607–D613. doi: 10.1093/nar/gky1131. [DOI] [PMC free article] [PubMed] [Google Scholar]
- 52.Babicki S, et al. Heatmapper: web-enabled heat mapping for all. Nucleic Acids Res. 2016;44(w1):W147–W153. doi: 10.1093/nar/gkw419. [DOI] [PMC free article] [PubMed] [Google Scholar]
Associated Data
This section collects any data citations, data availability statements, or supplementary materials included in this article.


