Abstract
Background
Substantial interreader variability exists for common tasks in CT imaging, such as detection of hepatic metastases. This variability can undermine patient care by leading to misdiagnosis.
Purpose
To determine the impact of interreader variability associated with (a) reader experience, (b) image navigation patterns (eg, eye movements, workstation interactions), and (c) eye gaze time at missed liver metastases on contrast-enhanced abdominal CT images.
Materials and Methods
In a single-center prospective observational trial at an academic institution between December 2020 and February 2021, readers were recruited to examine 40 contrast-enhanced abdominal CT studies (eight normal, 32 containing 91 liver metastases). Readers circumscribed hepatic metastases and reported confidence. The workstation tracked image navigation and eye movements. Performance was quantified by using the area under the jackknife alternative free-response receiver operator characteristic (JAFROC-1) curve and per-metastasis sensitivity and was associated with reader experience and image navigation variables. Differences in area under JAFROC curve were assessed with the Kruskal-Wallis test followed by the Dunn test, and effects of image navigation were assessed by using the Wilcoxon signed-rank test.
Results
Twenty-five readers (median age, 38 years; IQR, 31–45 years; 19 men) were recruited and included nine subspecialized abdominal radiologists, five nonabdominal staff radiologists, and 11 senior residents or fellows. Reader experience explained differences in area under the JAFROC curve, with abdominal radiologists demonstrating greater area under the JAFROC curve (mean, 0.77; 95% CI: 0.75, 0.79) than trainees (mean, 0.71; 95% CI: 0.69, 0.73) (P = .02) or nonabdominal subspecialists (mean, 0.69; 95% CI: 0.60, 0.78) (P = .03). Sensitivity was similar within the reader experience groups (P = .96). Image navigation variables that were associated with higher sensitivity included longer interpretation time (P = .003) and greater use of coronal images (P < .001). The eye gaze time was at least 0.5 and 2.0 seconds for 71% (266 of 377) and 40% (149 of 377) of missed metastases, respectively.
Conclusion
Abdominal radiologists demonstrated better discrimination for the detection of liver metastases on abdominal contrast-enhanced CT images. Missed metastases frequently received at least a brief eye gaze. Higher sensitivity was associated with longer interpretation time and greater use of liver display windows and coronal images.
© RSNA, 2022
Summary
Variation in radiologist performance for liver metastasis detection on contrast-enhanced abdominal CT scans can be explained by using insights from eye tracking, differences in reader expertise, and differences in image navigation patterns.
Key Results
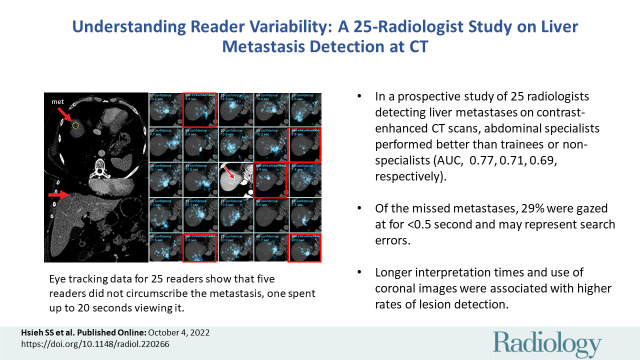
■ In a prospective study of 25 radiologists detecting liver metastases on contrast-enhanced abdominal CT scans, abdominal subspecialists had better diagnostic performance (mean area under the jackknife alternative free-response receiver operating characteristic [JAFROC] curve = 0.77) than did trainees (mean area under the JAFROC curve = 0.71, P = .02) or nonabdominal specialists (mean area under the JAFROC curve = 0.69, P = .03).
■ Of the missed metastases, 29% were gazed at for less than 0.5 second and may represent search errors.
■ Longer interpretation times (P = .003) and greater use of coronal images (P < .001) were associated with rates of lesion detection.
Introduction
Radiologists detect abnormalities with different levels of performance, and this variability can undermine patient care. While substantial effort has been invested in reducing CT image noise, minimal efforts have been made to address differences that exist among readers themselves (1,2). Errors in detection have been ascribed to factors such as the time of day (3) and reader fatigue (4). Interreader variability might also be explained by differences in reader experience. Trainees or subspecialists reading outside their specialty have been shown to achieve lower performance than subspecialists reading within their area of expertise (5). The benefit of subspecialization for routine diagnostic tasks, such as hepatic metastasis detection, is less clear (6) and warrants investigation, as there is limited evidence that experience affects performance (7).
Interreader variability might be explained by patterns of image navigation. Modern picture archiving and communication system workstations present the reader with multiple ways to display and navigate volumetric CT image data (eg, liver vs routine abdominal display windows, zoom, axial-coronal correlation). Readers have multiple ways to visually interrogate image data, and there may be certain navigation patterns that result in improved performance or confidence. For example, use of coronal reformations has been shown to improve reader confidence but not sensitivity or specificity in the detection of hepatocellular carcinoma nodules (8). The importance of navigation patterns has been shown in fields other than radiology. In gastroenterology, a strong association between longer colonoscope withdrawal time and higher rates of adenoma detection led to the adoption of withdrawal time as a key quality indicator (9). Likewise, the identification of effective navigation patterns could improve quality within radiology practices.
Understanding interreader variability might be facilitated by categorizing errors as either search or classification errors. Visual search errors occur when a lesion is missed because the eye never gazes (fixates) at it. Cognitive classification errors occur when the lesion is not reported (ie, not recognized), even after the eye gazes at it (10). A failure in either process leads to missed lesions. Thus, addressing the problem of interreader variability requires a correct understanding of whether errors occur in the search for or classification of lesions. Eye tracking has been used to measure the frequency of each error type, and thresholds between 600 and 1000 msec have sometimes been used to delineate between search and classification errors, although specific thresholds have not been validated in cross-sectional imaging (11,12). Some authors also describe recognition errors as an intermediate category between search and classification (10). Rubin et al (13) used eye tracking to classify why readers missed synthetically inserted 5-mm lung nodules on volumetric CT scans and found that 49% of missed nodules were attributed to search errors while 51% were attributed to classification errors.
Lesions are heterogeneous in nature, and readers who are skilled at identifying one type of lesion may be weak at identifying another type of lesion (ie, an interaction between readers and lesion features). Unsupervised machine learning algorithms can cluster data without manual input (14) and may be an effective tool with which to reveal these interactions. A prior study showed that small size, low contrast, and absence of rim enhancement predicted missed detection of hepatic metastases (15).
The purpose of our study was to determine the impact of interreader variability associated with (a) reader experience, (b) image navigation patterns (eye movements, workstation interactions), and (c) eye gaze time on missed liver metastases on contrast-enhanced abdominal CT scans.
Materials and Methods
Our institutional review board approved this Health Insurance Portability and Accountability Act–compliant study. All participating radiologists (readers) provided written informed consent.
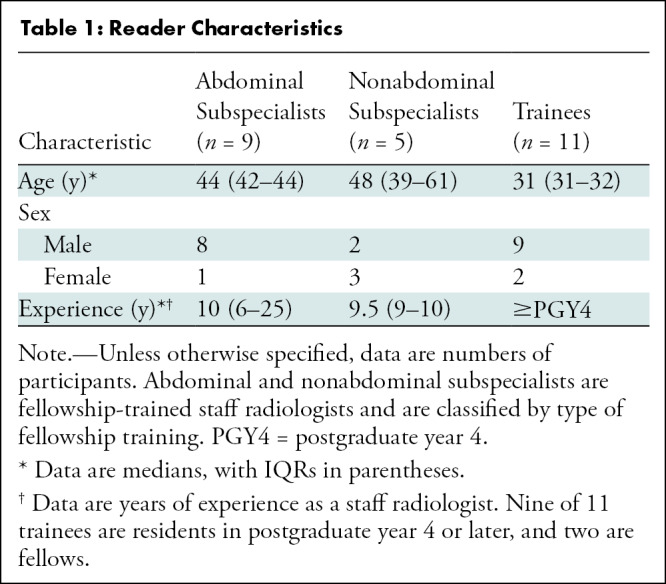
We conducted a prospective observational study in which 25 radiologists (Table 1) were recruited as a convenience series from one academic center to read 40 contrast-enhanced abdominal CT studies between December 2020 and February 2021 to identify hepatic metastases. CT studies were selected to be challenging to improve the discriminatory power of our study, and details of the selection process are described in Appendix S1 (online). Thirty-two studies contained 91 hepatic metastases proven by histopathology or progression; the other eight had no metastases. Readers marked every presumed metastasis by circumscribing it and then rated their confidence that the lesion was a metastasis.
Table 1:
Reader Characteristics
Imaging Protocol
In the imaging protocol, as previously described (16), iodine-enhanced imaging was performed with 128-section CT scanners (Definition, Definition Flash, or Definition AS+; Siemens Healthcare) at a routine radiation dose level (200 quality reference milliampere-seconds with a vendor-supplied voltage selection tool [CARE kV] and a mean volumetric CT dose index of 16 mGy) in the portal phase of enhancement. Images were reconstructed with 3-mm-thick axial and coronal sections with a 2-mm section interval using a filtered back projection algorithm and a medium smooth (B30f) kernel. Livers were segmented into standard Couinaud segments using a custom-developed workstation (Analyze-14.0; Mayo Clinic), with segmentation confirmed by a radiologist not participating in image evaluation (J.G.F., with 22 years of experience). Ground truth for liver metastases was determined with either histopathologic analysis or progression.
Observer Study
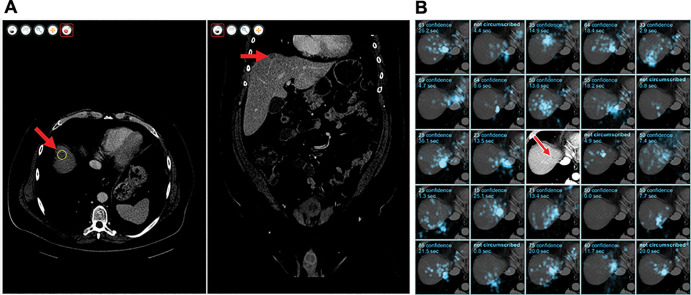
A custom viewing workstation was adapted from prior studies to collect data on image navigation patterns and integrate them with a commercial eye tracker (17). The workstation was configured so that axial and coronal stacks of images were displayed side by side, and the readers were able to scroll, pan, zoom, and change window level and window width (routine protocol: 40 and 400 HU, respectively; liver protocol: 125 and 225 HU, respectively). The workstation display is shown in Figure 1.
Figure 1:
(A) Graphic user interface of the workstation software. A metastasis (arrow) has been circumscribed in the axial stack (left) using liver window settings and can also be seen in the coronal stack (right). (B) Eye-tracking data for an example metastasis for 24 of the 25 readers. Each of the 24 subpanels shows gaze in a cyan overlay for a reader, the confidence score of the circumscription or a comment that the metastasis was not circumscribed, and the duration of gaze near the metastasis. Five of 24 readers did not circumscribe this metastasis, including one who gazed at this metastasis for 20 seconds. The central subpanel was replaced to show the metastasis itself (arrow) without the overlay.
The eye tracker (Eyelink Portable Duo; SR-Research) tracked retinal movement and gaze location at 500 Hz. These data were translated into Digital Imaging and Communications in Medicine coordinates. The reader workstation emitted audio biofeedback when data could not be measured. The accuracy of this technique was previously validated and was estimated to be 1° (17), corresponding to approximately 15 mm of patient anatomy under typical conditions, compared with a median metastasis diameter of 6 mm.
Before image interpretation, a member of the research team met with each reader to calibrate the eye tracker using vendor-provided software (Popup Calibration, version 2.0; SR-Research), and the principal investigator (J.G.F.) reviewed workstation functionality and provided instructions for reader confidence, as previously described (1). Readers sat approximately 50 cm from a diagnostic-quality monitor that measured 76 cm diagonally. The calibration procedure was repeated until the average visual gaze error was less than 1°. Most readers completed training, calibration, and interpretation of 40 studies within 4 hours.
Readers reviewed each CT study and circumscribed suspected hepatic metastases on the axial stack. After circumscription, the reader provided a confidence score between 0 and 100, where higher confidence scores indicated greater confidence of malignancy and lower confidence scores indicated probably benign entities or possible false detections due to noise or artifacts. Readers were instructed that a score of 0 indicated a certainly benign lesion that would be ignored in later analysis. Readers were not provided with any clinical information alongside the CT study. Studies were read in the same order by all readers.
Image Analysis
The primary outcome was diagnostic performance, as measured both by area under the jackknife alternative free-response receiver operating characteristic (JAFROC) curve and per-metastasis sensitivity, similar to past work (1).
JAFROC is an area under the receiver operating characteristic curve measurement. In conventional receiver operating characteristic curve analysis, the per-study sensitivity is plotted against 1 minus the per-study specificity. To accommodate multiple metastases, in JAFROC, the per-metastasis sensitivity is plotted against 1 minus the per-study specificity, where only the false-positive finding of highest confidence for each study is used to determine per-study specificity. To improve statistical power, we used the JAFROC-1 variant, wherein false-positive findings of studies both with and without metastases are included to determine per-study specificity (18). Other area under the receiver operating characteristic curve measurements have been proposed, but we selected JAFROC-1 for its greater statistical power given the characteristics of our data set. JAFROC is also known for its ability to make comparisons across modalities, which was not relevant in this study.
Sensitivity was defined as the proportion of metastases in the reference standard that were circumscribed. A metastasis was considered circumscribed (ie, true-positive detection) if the reader provided a circumscription within three sections of the reference standard circumscription, with a confidence score greater than zero, with the center point contained in the reference standard circumscription, and with a diameter between 50% and 300% of the reference standard circumscription.
We collected data on image navigation, including the total interpretation time, time in liver windows, time in enlarged or zoomed images (axial images only), number of scrolls in the axial stack, and number of scrolls in the coronal stack. A scroll was defined as the movement of an image stack by one section. We tracked the number of times a reader gazed at the same metastasis in both the axial plane and the coronal plane (a correlated view), regardless of whether the metastasis was eventually circumscribed.
Gaze time near metastases was calculated including all gaze times (axial, coronal, possibly over multiple fixations) within 40 Digital Imaging and Communications in Medicine pixels (approximately 25 mm of patient anatomy) and two sections (3 mm thick for both axial and coronal images) of the reference standard. The 40-pixel tolerance accommodates the effective area of the fovea and the inaccuracy of the eye tracker. To understand gaze distributions throughout the liver, we created a stereologic grid of points with a spacing of 40 pixels and five sections. Points outside the liver segmentation were excluded. Gaze in axial images within 40 pixels of these grid points was computed to understand the distribution of gaze time throughout the liver. Finally, we tracked gaze time in each liver segment, without any tolerance for the fovea area or eye tracker inaccuracy.
Statistical Analyses
The JAFROC scores, sensitivity, number of false-positive circumscriptions, and interpretation time were compared across groups with the Kruskal-Wallis test using the null hypothesis that mean values were equal across groups. When the null hypothesis was rejected, pairwise comparisons were completed using the Wilcoxon rank sum test. Differences in mean confidence scores by reader experience groups were assessed for both true-positive and false-positive marks using linear mixed effects regression analysis to account for clustering by reader.
For each navigation variable, the 25 readers were divided into two groups depending on whether their results were greater than or less than the median value. The results of the median reader were excluded. An unpaired t test was used to evaluate (for each navigation variable) whether the two groups were different in sensitivity, false-positive rate, or JAFROC score.
In examining the relationship between sensitivity and interpretation time, the 25 readers were divided into three groups according to post hoc interpretation time thresholds, and the Wilcoxon rank sum test was used to determine if sensitivity in these groups was different.
The association between gaze time and sensitivity at an anatomic location was evaluated using linear regression. The P value of the linear term is reported.
For unsupervised learning to identify interactions between readers and metastases, we formulated a matrix of confidence scores C, with Cij being the confidence that the ith reader provided for the jth metastasis. A confidence value of zero was used if the metastasis was not circumscribed. This matrix was analyzed and permuted using a two-dimensional dendrogram, also known as the clustergram, and this result was manually inspected to identify clusters of readers who circumscribed clusters of metastases with differentially high or low confidence.
Statistical analyses were completed (R.E.C., M.P.J., S.S.H.) using statistical software (MATLAB 2020a, MathWorks; R, version 4.0.3, R Project for Statistical Computing). Throughout this work, P < .05 was indicative of a significant difference.
Results
Reader Experience
Twenty-five radiologists were recruited. Table 1 summarizes reader characteristics.
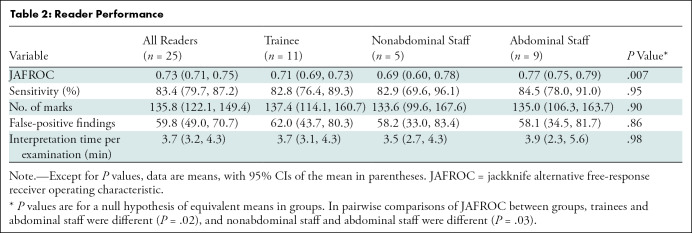
Table 2 summarizes performance by reader experience. We found a difference among groups in mean JAFROC (trainees, 0.71 [95% CI: 0.69, 0.73]; nonabdominal staff, 0.69 [95% CI: 0.60, 0.78]; abdominal staff, 0.77 [95% CI: 0.75, 0.79]; P = .007). In pairwise comparisons of JAFROC, the JAFROC of abdominal staff differed from that of trainees (P = .02) and nonabdominal staff (P = .03). We found no significant difference between groups in terms of sensitivity (trainees: 83% [829 of 1001; 95% CI: 76, 89]; nonabdominal staff: 83% [377 of 455; 95% CI: 70, 96]; abdominal staff: 84% [692 of 819; 95% CI: 78, 91]; P = .96). There was no significant difference in the number of false-positive findings between groups (P = .86).
Table 2:
Reader Performance
Figure 2 shows confidence scores for true-positive and false-positive circumscriptions. Although sensitivity and false-positive rate were similar across groups, abdominal staff had greater mean confidence in true-positive circumscriptions than did trainees (mean difference, 15; 95% CI: 13, 17) or nonabdominal staff (mean difference, 13; 95% CI: 11, 16) (P < .001 for all), explaining their better JAFROC performance. The mean confidence scores for false-positive circumscriptions were different between trainees and nonabdominal staff (mean difference, 6; 95% CI: 3, 9) and between trainees and abdominal staff (mean difference, 5; 95% CI: 2, 8) (P < .001 for all). All other pairwise comparisons were not significant.
Figure 2:
Confidence scores for true- and false-positive circumscriptions by reader experience. Missed lesions (false-negative findings) do not have a confidence score and are not indicated on these histograms. Abdominal subspecialists indicated greater mean confidence for true-positive markings than did the other readers (P < .001), and trainees indicated less mean confidence for false-positive markings than did the other readers (P < .001). FP = false-positive, TP = true-positive.
Image Navigation Patterns
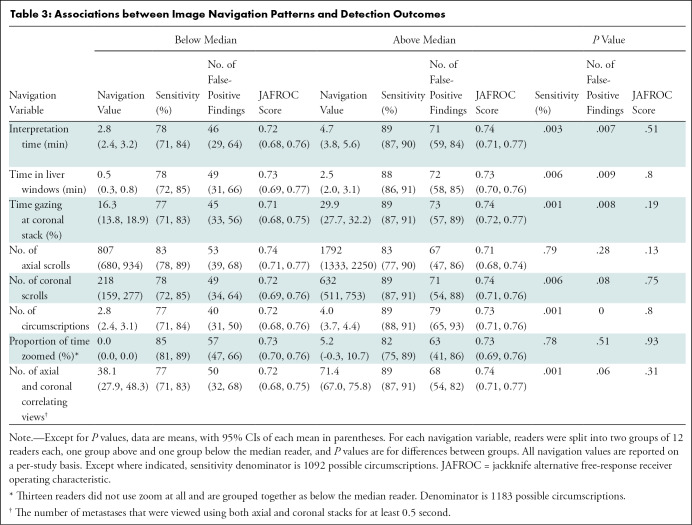
Table 3 summarizes the associations between performance outcomes and image navigation patterns. We found significant associations between sensitivity and the following six navigation variables: interpretation time, time in liver windows, time spent gazing at coronal images, coronal scrolls, number of circumscriptions, and correlating views between axial and coronal images (all P ≤ .01). In contrast, we found no significant associations between JAFROC-1 and any navigation variable (all P > .1). Figure 3 shows that longer interpretation times are associated with higher sensitivity. In a post hoc analysis, we found that sensitivity for readers with interpretation times less than 3 minutes (n = 6) (mean sensitivity, 74% [402 of 546]; 95% CI: 66, 81) was associated with reduced sensitivity compared with readers with interpretation times between 3 and 4 minutes (n = 11) (mean sensitivity, 85% [846 of 1001]; 95% CI: 79, 91) (P = .02); however, sensitivity of readers with interpretation times between 3 and 4 minutes was not different from that of readers with interpretation times greater than 4 minutes (n = 8) (mean sensitivity, 89% [650 of 728]; 95% CI: 87, 92) (P = .17).
Table 3:
Associations between Image Navigation Patterns and Detection Outcomes
Figure 3:
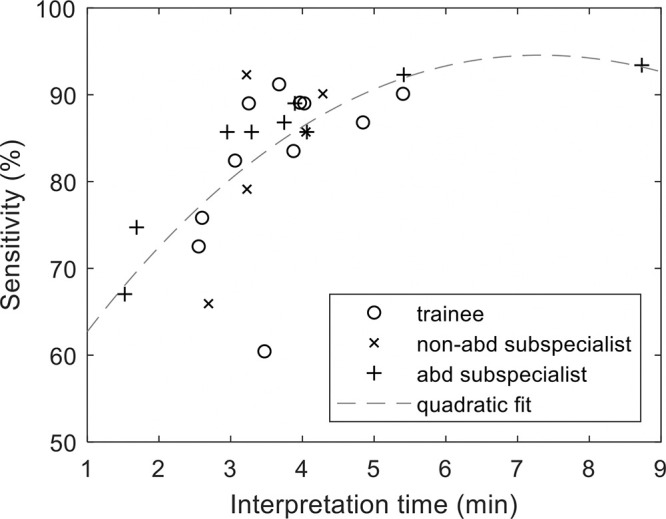
Graph shows longer interpretation time is associated with higher sensitivity. abd = abdominal.
Eye Gaze Time on Missed Metastases
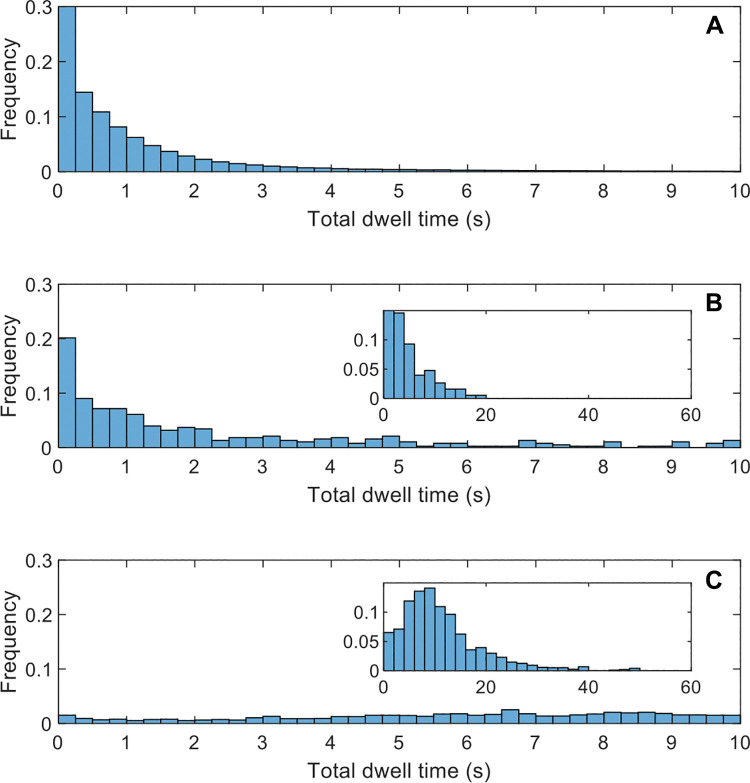
To understand the proportion of false-negative interpretations that could be ascribed to search or classification processes, we measured gaze time for missed (uncircumscribed) metastases. Figure 4 shows that of 377 missed metastases, 267 (71%), 149 (40%), and 26 (7%) occurred after a gaze time longer than 0.5, 2.0, and 10.0 seconds, respectively. Prior studies suggest that gaze times of less than 0.5 second represent search errors, and gaze times longer than 2 seconds represent classification or decision errors (11,12). For comparison, the average gaze time in circumscribed metastases was 11.3 seconds, including time during circumscription.
Figure 4:
Graphs show gaze time distributions. Frequency is normalized so that the sum of all bars is 100%. Insets in B and C show a modified x-axis range to capture gaze times longer than 10 seconds. All histograms use bar widths of 0.25 second, except for the insets, which use 2 seconds. (A) Gaze for a stereologic grid of points in the liver, indicating that most of the liver was examined, at least briefly. (B) Gaze time for missed metastases (false-negative findings). Inset shows a modified x-axis range to capture gaze times longer than 10 seconds. (C) Gaze time for detected metastases (true-positive findings).
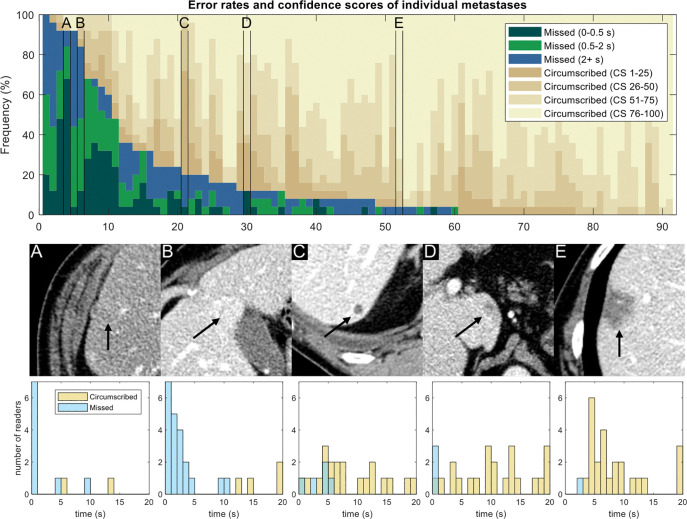
The bar plot in Figure 5 shows the error rates and detection confidence for individual metastases. Metastasis features are diverse, and the reasons why a reader might miss a metastasis are similarly diverse.
Figure 5:
Detection rates and confidence scores for each metastasis. Each column represents a different metastasis (n = 91). Dark colors indicate missed metastases (false-negative findings), and different shades correspond to the eye gaze time. Tan shades indicate confidence for circumscribed metastases (1 = low confidence, 100 = high confidence). Metastases are sorted according to the number of false-negative errors. (A–E) Five selected metastases are marked in the plot and are shown for illustrative purposes; arrows indicate metastasis. Eye gaze histograms are shown below the images. An eye gaze longer than 20 seconds was placed into the 20-second bin. (A) Metastasis was frequently missed (23 of 25 readers) and was associated with short gaze times, implying visual search errors. (B) Metastasis also was frequently missed (21 of 25 readers) and was associated with longer gaze times, implying classification errors. (C) Metastasis was missed by only five readers, usually with long gaze times or when circumscribed readers indicated low confidence. (D) Metastasis was missed by three readers, all with short gaze times. (E) Metastasis was circumscribed by all but one reader. CS = confidence score.
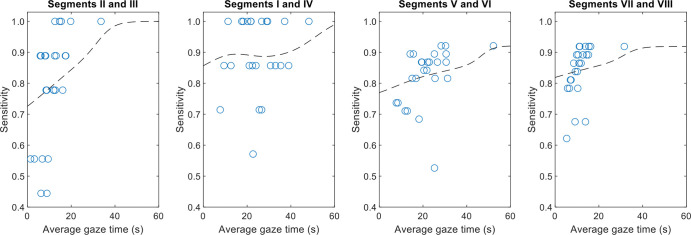
Figure 6 shows sensitivity as a function of gaze time by anatomic location. Gaze time was predictive of sensitivity in each liver segment, especially for segments II and III. The median gaze time for these segments was only 12 seconds. Readers with a longer than median gaze time detected an average of 8.1 out of nine possible metastases, whereas readers with a shorter than median gaze time detected an average of 6.2 out of nine possible metastases.
Figure 6:
Graphs show sensitivity as a function of gaze time in liver segments grouped by location, along with a smoothed trend line. In most cases, longer gaze time in segments indicated higher sensitivity in those segments. Linear associations were significant for segments II and III (P = .002), V and VI (P = .04), and VII and VIII (P = .02) but not for segments I and IV (P = .27).
Unsupervised Learning
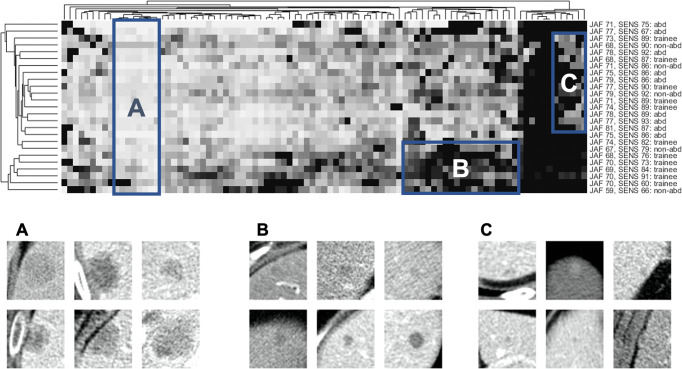
Figure 7 shows the clustergram of reader confidence scores, with phylogenetic trees that show similarities between metastases or readers (eg, metastases that were missed by the same readers are grouped together). Box A shows metastases that were easily found by all readers. Box B shows 20 related metastases (as indicated by the phylogenetic tree) that were circumscribed with lower confidence by a group of related readers. This group included five trainees, one nonabdominal subspecialist, and no abdominal subspecialists. Box B provides a concrete example of the differences in confidence scores by reader experience shown earlier in Figure 2. Box C shows difficult-to-detect metastases (ie, low sensitivity). These were detected by readers from all experience groups, illustrating the lack of association seen between sensitivity and reader experience groups (Table 1).
Figure 7:
Clustering of metastasis features and reader confidence. Top: Clustergram of the reader confidence matrix. Columns correspond to metastases (n = 91), rows correspond to readers (n = 25), and brightness corresponds to reader confidence. Columns and rows are permuted to bring clusters together, with phylogenetic trees on the top and left to show empirically discovered relationships between similar metastases or readers. Reader data are shown on the right (abd = abdominal subspecialist, non-abd = nonabdominal subspecialist), including the jackknife alternative free-response receiver operator characteristic curve score (JAF) and sensitivity (SENS). Boxes A, B, and C show three areas of interest. Box A encompasses a group of metastases that were found by nearly all readers (ie, easy, nondiscriminatory). Box B encompasses a group of metastases that were scored with lower confidence for five trainees and one nonabdominal subspecialist. Box C encompasses a group of metastases that were challenging to detect: approximately half of the readers were able to detect these lesions, with no clear connection between reader experience and detection rate. Bottom: Close-up images of six metastases randomly selected from each of the corresponding boxes in the top panel.
Discussion
Interreader variability can be attributed to several sources. In our 25-reader study, we explained this variability for liver metastasis detection on CT scans by using insights from eye tracking, differences in expertise, and differences in image navigation patterns. We found higher area under the jackknife alternative free-response receiver operating characteristic curve for abdominal subspecialists (mean, 0.77) than for trainees (mean, 0.71; P = .02) or nonabdominal subspecialists (mean, 0.69; P = .03), but we found no evidence of difference in sensitivity among groups. Several image navigation patterns were associated with higher sensitivity, including interpretation time, use of liver windows, and use of coronal reformations. Eye-tracking data showed that 71% of missed metastases received a gaze of at least 0.5 second, indicating that visual search was not the dominant source of error.
Detection is often modeled as a process consisting of two components: search and classification (10,19). More extensive image navigation enables a more effective search; hence, it is unsurprising that longer interpretation times were associated with higher sensitivity. However, image navigation variables were not associated with improved JAFROC because a longer reader search time yielded more false-positive findings, as well as more true-positive findings. Only reader experience was associated with improved JAFROC, as abdominal staff reported higher confidence for true-positive findings than did other reader groups. Our results are consistent with those of a prior study that reviewed errors in neuroradiology and found that interpretation errors were less common in more experienced staff and that perception errors were more common with faster reading rates (20).
The eye-tracking data showed that most missed metastases received some gaze, implying that search errors were not the sole cause of failed detection. This finding is consistent with chest radiographic (12) and mammographic (11) studies. In volumetric imaging, Rubin et al (13) found that for lung nodules, half of false-negative findings could be attributed to failed search, and Lago et al (21) found that for microcalcifications in breast tomosynthesis, extending search time increased sensitivity. Classification of hepatic metastases may be harder than these tasks, as readers must differentiate metastases from benign lesions.
New reconstruction algorithms or artificial intelligence systems that detect hepatic metastases could reduce interreader variability. We used only filtered back projection in this work. Iterative or deep learning reconstruction algorithms are associated with modest reductions in dose and may improve the conspicuity of subtle lesions (2). Artificial intelligence systems are still under development but could highlight suspicious areas and may reduce search errors for subtle metastases or classification errors for ambiguous lesions (22); however, the long-term impact of such systems on reader performance remains uncertain (23).
Our study had several limitations. First, the eye tracker had finite accuracy. While the eye tracker was calibrated to better than 1° of accuracy for all readers and recalibration was performed approximately every hour, interim changes in head position could increase errors. Calibration errors could explain the short apparent gaze times (<2 seconds) in a subset (7%) of circumscribed metastases and may have led to an underestimation of gaze time in missed metastases. Second, we used studies intentionally selected for difficult-to-detect metastases to discriminate performance; the error rates and other findings may be different in routine clinical practice because of the heightened expectation of disease. Third, we studied only the detection of hepatic metastases. While we are interested in the problem of interreader variability more generally, we selected only one task for this study, and our findings may not be generalizeable to other tasks. Fourth, our study was observational and did not enable us to differentiate correlation from causation.
In summary, we have examined the impact of different sources of interreader variability, including reader experience, image navigation patterns, and eye gaze time on missed metastases. Defining a more effective training program from these insights is a subject of future work.
Supported by the National Institutes of Health (R01 EB017095).
Disclosures of conflicts of interest: S.S.H. No relevant relationships. D.A.C. No relevant relationships. A.I. No relevant relationships. H.G. No relevant relationships. P.S.P. No relevant relationships. M.P.J. No relevant relationships. S.L. No relevant relationships. L.Y. No relevant relationships. J.L.F. No relevant relationships. D.R.H. No relevant relationships. R.E.C. No relevant relationships. C.H.M. International Society of Computed Tomography board member. J.G.F. No relevant relationships.
Abbreviation:
- JAFROC
- jackknife alternative free-response receiver operating characteristic
References
- 1. Fletcher JG , Fidler JL , Venkatesh SK , et al . Observer performance with varying radiation dose and reconstruction methods for detection of hepatic metastases . Radiology 2018. ; 289 ( 2 ): 455 – 464 . [DOI] [PMC free article] [PubMed] [Google Scholar]
- 2. Mileto A , Guimaraes LS , McCollough CH , Fletcher JG , Yu L . State of the art in abdominal CT: the limits of iterative reconstruction algorithms . Radiology 2019. ; 293 ( 3 ): 491 – 503 . [DOI] [PubMed] [Google Scholar]
- 3. Patel AG , Pizzitola VJ , Johnson CD , Zhang N , Patel MD . Radiologists make more errors interpreting off-hours body CT studies during overnight assignments as compared with daytime assignments . Radiology 2020. ; 297 ( 2 ): 374 – 379 . [DOI] [PubMed] [Google Scholar]
- 4. Ruutiainen AT , Durand DJ , Scanlon MH , Itri JN . Increased error rates in preliminary reports issued by radiology residents working more than 10 consecutive hours overnight . Acad Radiol 2013. ; 20 ( 3 ): 305 – 311 . [DOI] [PubMed] [Google Scholar]
- 5. Branstetter BF 4th , Morgan MB , Nesbit CE , et al . Preliminary reports in the emergency department: is a subspecialist radiologist more accurate than a radiology resident? Acad Radiol 2007. ; 14 ( 2 ): 201 – 206 . [DOI] [PubMed] [Google Scholar]
- 6. Levine MS , Laufer I . What price, abdominal radiology? AJR Am J Roentgenol 2003. ; 181 ( 5 ): 1175 – 1179 . [DOI] [PubMed] [Google Scholar]
- 7. Tsurusaki M , Numoto I , Oda T , et al . Assessment of Liver Metastases Using CT and MRI Scans in Patients with Pancreatic Ductal Adenocarcinoma: Effects of Observer Experience on Diagnostic Accuracy . Cancers (Basel) 2020. ; 12 ( 6 ): 1455 . [DOI] [PMC free article] [PubMed] [Google Scholar]
- 8. Marin D , Catalano C , De Filippis G , et al . Detection of hepatocellular carcinoma in patients with cirrhosis: added value of coronal reformations from isotropic voxels with 64-MDCT . AJR Am J Roentgenol 2009. ; 192 ( 1 ): 180 – 187 . [DOI] [PubMed] [Google Scholar]
- 9. Rex DK , Schoenfeld PS , Cohen J , et al . Quality indicators for colonoscopy . Gastrointest Endosc 2015. ; 81 ( 1 ): 31 – 53 . [DOI] [PubMed] [Google Scholar]
- 10. Brunyé TT , Drew T , Weaver DL , Elmore JG . A review of eye tracking for understanding and improving diagnostic interpretation . Cogn Res Princ Implic 2019. ; 4 ( 1 ): 7 . [DOI] [PMC free article] [PubMed] [Google Scholar]
- 11. Mello-Thoms C , Hardesty L , Sumkin J , et al . Effects of lesion conspicuity on visual search in mammogram reading . Acad Radiol 2005. ; 12 ( 7 ): 830 – 840 . [DOI] [PubMed] [Google Scholar]
- 12. Kundel HL , Nodine CF , Carmody D . Visual scanning, pattern recognition and decision-making in pulmonary nodule detection . Invest Radiol 1978. ; 13 ( 3 ): 175 – 181 . [DOI] [PubMed] [Google Scholar]
- 13. Rubin GD , Roos JE , Tall M , et al . Characterizing search, recognition, and decision in the detection of lung nodules on CT scans: elucidation with eye tracking . Radiology 2015. ; 274 ( 1 ): 276 – 286 . [DOI] [PubMed] [Google Scholar]
- 14. Shah SJ , Katz DH , Selvaraj S , et al . Phenomapping for novel classification of heart failure with preserved ejection fraction . Circulation 2015. ; 131 ( 3 ): 269 – 279 . [DOI] [PMC free article] [PubMed] [Google Scholar]
- 15. Pillai PS , Hsieh S , Holmes D III , Carter R , Fletcher JG , McCollough C . Individualized and generalized learner models for predicting missed hepatic metastases . In: Mello-Thoms CR, Taylor-Phillips S. , ed . Proceedings of SPIE: medical imaging 2022—image perception, observer performance, and technology assessment . Vol 12035 . San Diego, Calif: : International Society for Optical Engineering; , 2022. ; SPIE, 2022 . [DOI] [PMC free article] [PubMed] [Google Scholar]
- 16. Fletcher JG , Yu L , Fidler JL , et al . Estimation of observer performance for reduced radiation dose levels in CT: eliminating reduced dose levels that are too low is the first step . Acad Radiol 2017. ; 24 ( 7 ): 876 – 890 . [DOI] [PMC free article] [PubMed] [Google Scholar]
- 17. Gong H , Hsieh SS , Holmes DR 3rd , et al . An interactive eye-tracking system for measuring radiologists’ visual fixations in volumetric CT images: Implementation and initial eye-tracking accuracy validation . Med Phys 2021. ; 48 ( 11 ): 6710 – 6723 . [DOI] [PMC free article] [PubMed] [Google Scholar]
- 18. Chakraborty DP . Validation and statistical power comparison of methods for analyzing free-response observer performance studies . Acad Radiol 2008. ; 15 ( 12 ): 1554 – 1566 . [DOI] [PMC free article] [PubMed] [Google Scholar]
- 19. Nodine CF , Kundel HL . Using eye movements to study visual search and to improve tumor detection . RadioGraphics 1987. ; 7 ( 6 ): 1241 – 1250 . [DOI] [PubMed] [Google Scholar]
- 20. Patel SH , Stanton CL , Miller SG , Patrie JT , Itri JN , Shepherd TM . Risk factors for perceptual-versus-interpretative errors in diagnostic neuroradiology . AJNR Am J Neuroradiol 2019. ; 40 ( 8 ): 1252 – 1256 . [DOI] [PMC free article] [PubMed] [Google Scholar]
- 21. Lago MA , Jonnalagadda A , Abbey CK , et al . Under-exploration of Three-Dimensional Images Leads to Search Errors for Small Salient Targets . Curr Biol 2021. ; 31 ( 5 ): 1099 – 1106.e5 . [DOI] [PMC free article] [PubMed] [Google Scholar]
- 22. Ardila D , Kiraly AP , Bharadwaj S , et al . End-to-end lung cancer screening with three-dimensional deep learning on low-dose chest computed tomography . Nat Med 2019. ; 25 ( 6 ): 954 – 961 [Published correction appears in Nat Med 2019;25(8):1319.]. [DOI] [PubMed] [Google Scholar]
- 23. Fenton JJ , Taplin SH , Carney PA , et al . Influence of computer-aided detection on performance of screening mammography . N Engl J Med 2007. ; 356 ( 14 ): 1399 – 1409 . [DOI] [PMC free article] [PubMed] [Google Scholar]


