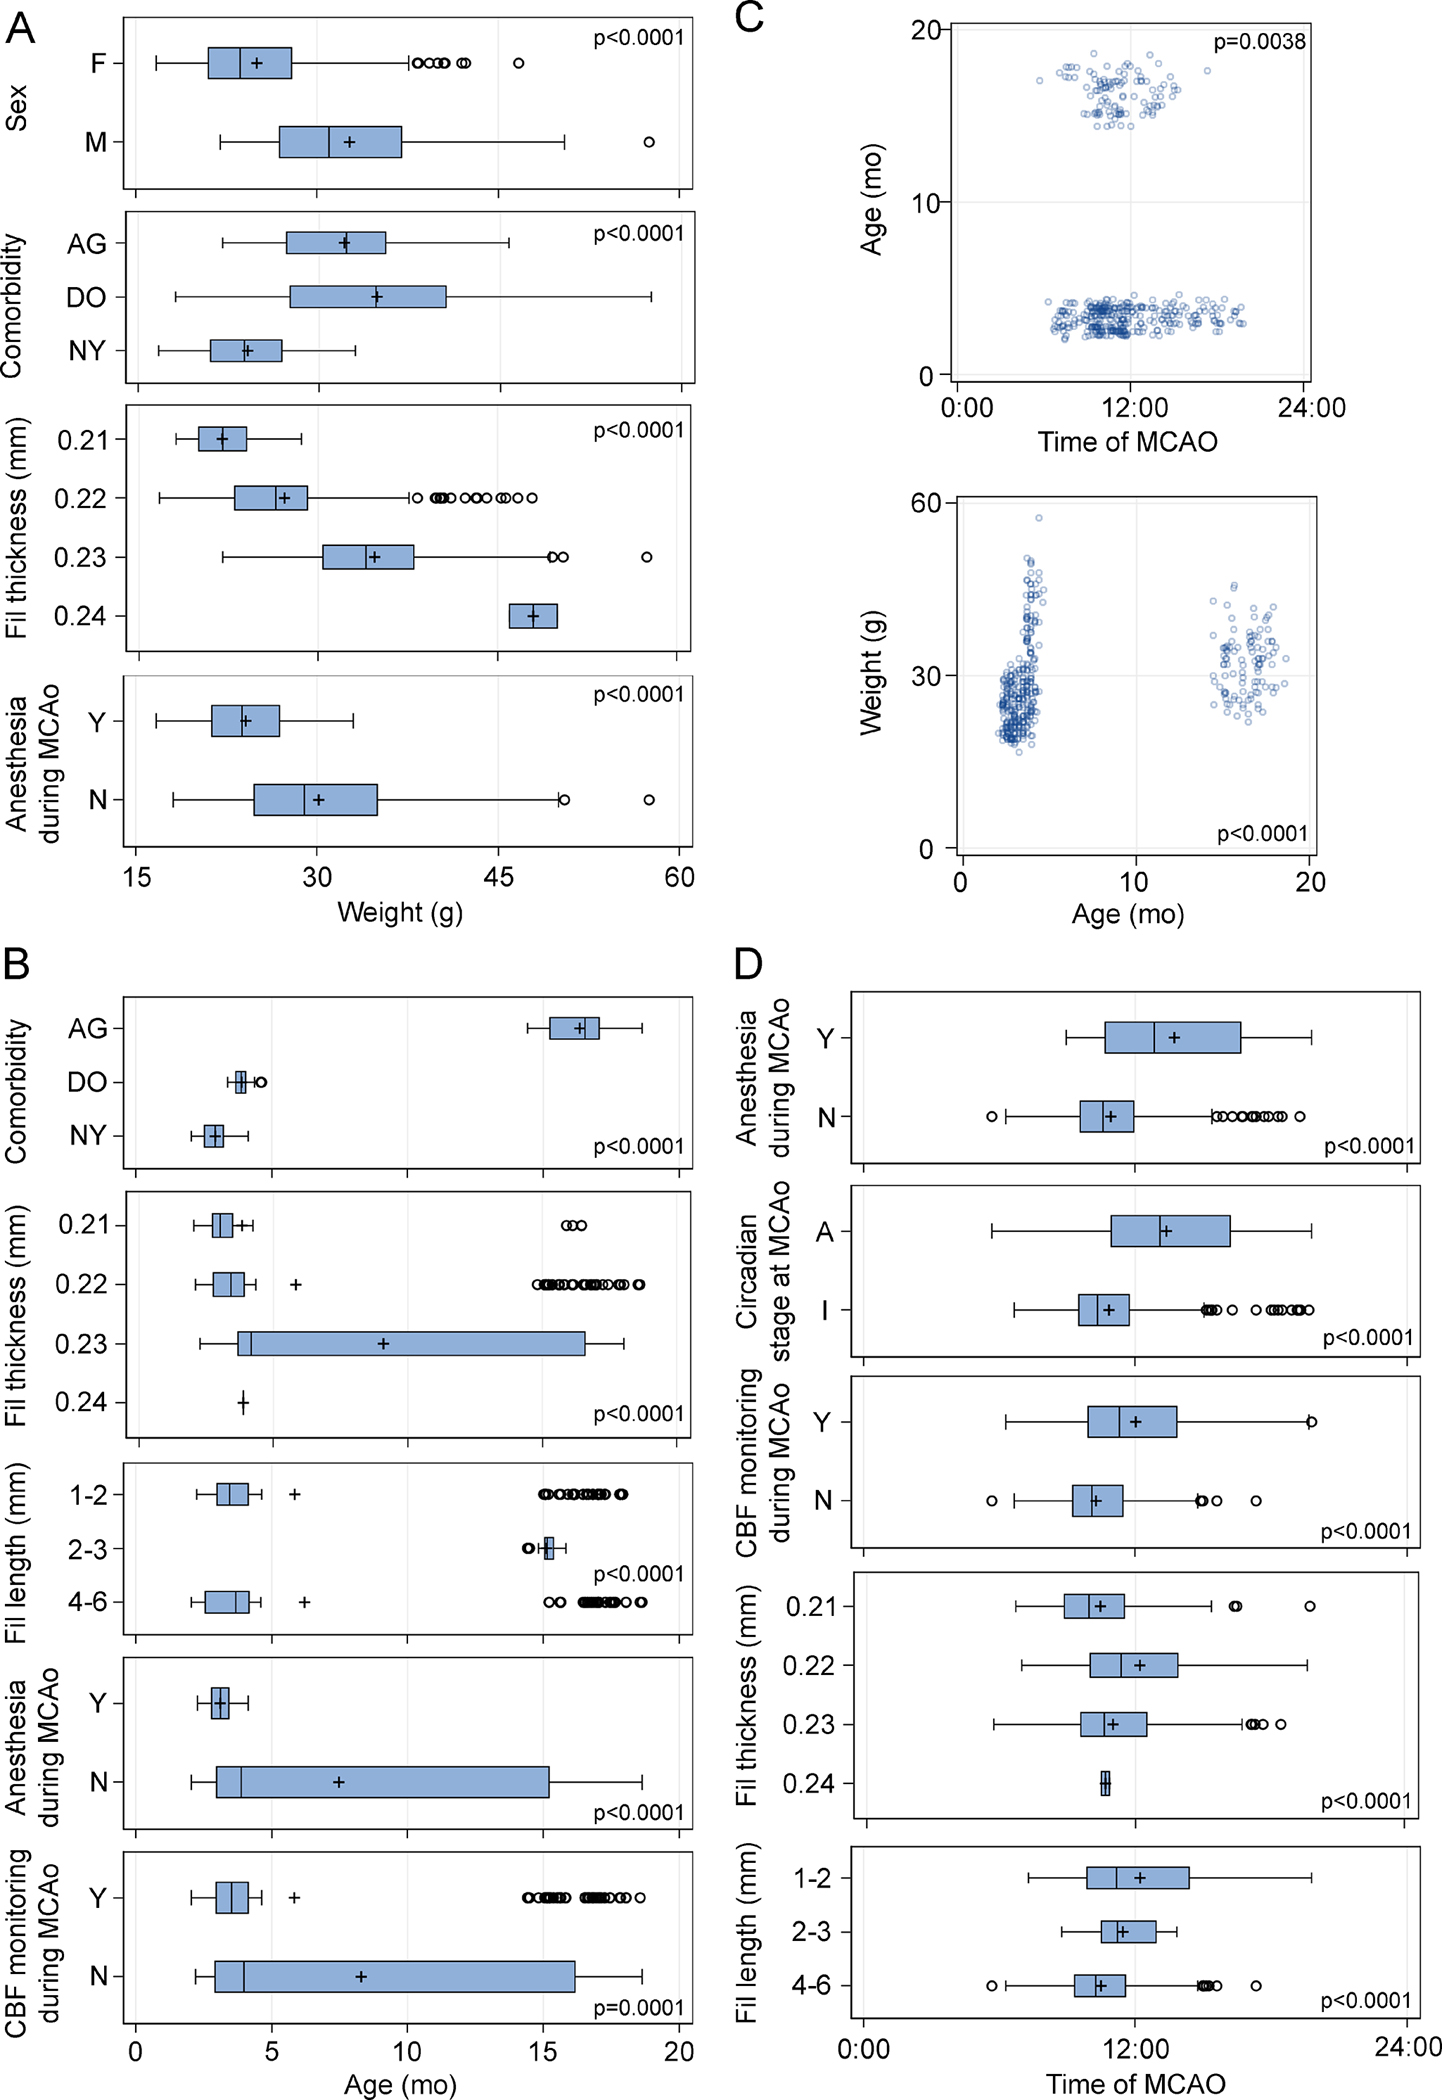
Figure 3. Bivariate associations of numerical independent variables.

Whisker-box and scatter plots show statistically significant associations (i.e., covariance) of independent variables with weight (A), age (B and C), and time of day at MCAo (D), analyzed using t-test, one-way ANOVA, or general linear model. Circles in the box-whisker plots indicate data points outside the 1.5x interquartile range (IQR). All p-values are adjusted by FDR. A, active; AG, aged mice; DO, diet-induced obese mice; F, female; I, inactive; M, male; N, no; NY, normal young mice; Y, yes.
