

Abstract
Although the modifications of the aging face have been widely described, to our knowledge, there are no studies that quantitatively analyze the degree of soft tissues facial ptosis. Using a specific iPhone application, the faces of a heterogeneous group of volunteers were scanned and studied with the aim to virtually measure the entity of facial ptosis.Two facial scans, upright and supine, were performed by using the Bellus3D Face app for iPhone in a sample of 60 volunteers. We virtually superimposed the two scans, and then, we calculated the discrepancy between them through the Geomagic Design X 3D software. A multivariate regression statistical model was used to analyze the correlation between the mean discrepancy values compared to three main variables: age, BMI and gender. Mean ptosis increases with age (coeff. = 0.02; 95% CI = 0.01–0.02, p < 0.001), BMI (coeff. = 0.03; 95% CI = 0.01–0.05; p < 0.001) and has been found higher in females (female versus male: coeff. = 0.22; 95% CI = 0.13–0.31; p < 0.001). The method we used allowed us to measure the degree of ptosis, and to make a complete morphological study of the effect of gravity on the facial surface in a very accurate, low cost and easily reproducible way.
Keywords: Facial ptosis, BMI, Age, Aging face, iPhone app, Virtual planning
Introduction
Ptosis is defined as the drooping or sagging of a part of the body [1]. It is particularly evident and widely studied in the facial district, where soft tissue ptosis can have both esthetic and functional results. The ptosis of the facial soft tissues can be an isolated problem without an apparent cause, due to the para-physiological soft tissue drooping related to the aging effect, or it can be associated with pathological conditions affecting bone, muscles, connective or nerves [2].
The face can be considered as a stratification of five layers: skin, subcutaneous tissue, Superficial Musculo-Aponeurotic System (SMAS), sub-Smas space (which can be either deep fat or an areolar and undermic plane), and deep facial fascia. The areolar space acts as a sliding plane between the muscular layer and the deep layer, allowing mimic expressions. [3] This physiological movement of the superficial planes with respect to the deep ones is contained by retaining ligaments that fix the superficial composite layer (skin, subcutaneous and SMAS) to the deep ones thus delimiting the areolar spaces. In the aging- or fatty-face, these anchoring structures contribute to soft tissue ptosis and to the formation of wrinkles and furrows due to the elastin’s degeneration, fall of hydration and mass increase [3, 4].
Both the age and the weight can affect the degree of facial ptosis: Facial aging is a multifactorial process, and the onset and rate of these changes vary between individuals of different genders and ethnicities [5]; physiological and morphological changes occur both at the level of hard and soft tissues, involving the facial bones, ligaments, muscles, fascia, fat and skin as a whole [6, 7]. Moreover, the superficial fat compartments undergo biochemical changes and lose stability, due to changes in aging facial bone, ligamentous fatigue, skin laxity overlying, and altered physiology of mimic muscles. Due to these conditions, the superficial fatty compartments tend to yield by gravity and become ptotic, remaining hung on the retaining ligaments [4].
Several authors [8–11] have highlighted the role of the retaining ligaments on the aging face focusing on their effects on the degree of ptosis in cadaveric specimens. To the best of our knowledge, this is a first in vivo evaluation of the facial ptosis by using a 3D facial scan app available on iPhone.
The study aims to quantitatively measure the degree of facial ptosis in a heterogeneous sample of population, according to three variables: gender, age and body mass index (BMI).
Patients and Methods
Our clinical trial is a cohort study conducted at the Maxillofacial Surgery Unit of the University Hospital Federico II of Naples (Italy). During the period between January 2020 and June 2020, we included 132 consecutive patients admitted to our Unit who accepted to undergo our trial that was carried out in accordance with the Helsinki Declaration and our Local Ethics Committee.
Only the patients without any facial soft tissues alterations were included (ex: sinusal pathologies, deviations of the nasal septum, confined oral pathologies). Patients with pathologies of the facial soft tissues or bones, pathologies of the major salivary glands, facial dysmorphisms, patients with connective tissue diseases, minors patients and patients who refused the trial have been excluded. Overall, 60 patients meet the inclusion criteria and were admitted in the study.
Regardless of the type of pathology, patients were stratified according to three variables: gender, BMI and age. Age was considered as a progressive variable, with values between 18 (minimum age) and 80 (maximum age) years old; BMI was considered as a progressive variable, from 16 to 40; the gender was considered as a dichotomous variable.
With the aim of studying gravitational tissue drooping in the heterogeneous group of patients, each patient underwent a 3D scan of the face twice: A first scan was done in a vertical position, and a second scan in a horizontal supine position. To perform the vertical facial scans, we positioned the patients in an upright position with the Frankfurt plane parallel to the ground; for horizontal scans, patients were supine on a semi-rigid surface with the Frankfurt plane perpendicular to the ground. In all cases, the axis of the iPhone chamber was perpendicular to the patient's Frankfurt plane and centered with respect to their face. We asked patients to place their hair behind their ears to expose their entire face, to remove any interfering accessories such as earrings or piercings, and also, we asked male patient to shave. Figures 1 and 2 illustrate the facial scanning procedures.
Fig. 1.

3D facial scan in upright position a, 3D Facial scan in supine position b
Fig. 2.

3D facial scan reconstruction in upright position a, 3D facial scan reconstruction in supine position b
For 3D patient facial scans, we used the Bellus3D Face Camera Pro System© (model number FCP01, Bellus 3D Face App, Bellus 3D Inc.) available for iPhone X, Xs, Xs Max, XR, 11, 11 Pro or 11 Pro Max. The app provides a face scan wizard very simple to run. At the end of the procedure an Object file (Obj), containing the downloadable face scan, was generated. The type of scan that we set up was an HD 24 MB file size with 250,000 triangles and 4 K color texture map. Each face scan was imported into the Geomagic Design X 3D software (2019, 3D Systems, Raindrop Geomagic GmbH, North Carolina, the USA). For each patient, the vertical and horizontal scans were superimposed by the automatic alignment function (Fig. 3). For each patient’s face, discrepancy levels were measured in millimeters (minimum, maximum, med values and standard deviation). We studied the variation in the average discrepancy levels (full face) according to gender, age and BMI.
Fig. 3.

Superimposition of upright and supine facial scans and measurement of millimetric discrepancy using GeoMagic software
Statistical analyses were performed using Stata software (version 13; StataCorp LP, College Station, TX). Demographic and clinical features are presented as means, median or proportions, as appropriate. Normal distribution of variables was evaluated with Shapiro–Wilk test and graphical approaches. Correlation between gender and mean ptosis was performed through Student’s t test. Correlation between BMI and age with mean ptosis was performed using a Pearson correlation test. Two multivariate linear regression models were used to assess correlation between age, gender and BMI (independent variables) and mean ptosis (dependent variable). Results were considered statistically significant for p < 0.05.
Results
Among 132 patients analyzed, 60 patients meet the inclusion criteria and were admitted in the study. 72 patients were excluded because they were suffering from soft or hard tissue pathologies with altered facial eurythmy.
We enrolled 33 females (55%) and 27 males (45%). Mean age was 46.5 (range 18 – 80) years old. Mean BMI was 25.1 (2.6 standard deviation, range 20 – 30). Demographic features for enrolled subjects are detailed in Table 1; Maximal, minimal and mean overall ptosis were 2.69 mm (SD 0.74), 0.09 mm (SD 0.07) and 1.05 mm (SD 0.38), respectively (Table 2).
Table 1.
Demographic features in our samples
| Population characteristic | |
|---|---|
| Subjects | 60 |
| Gender | Female, N (%) 33 (55) |
| Male, N (%) 27 (45) | |
| Age, Median (Range) (years) | 46,5 (18–80) |
| BMI, mean ± SD (Range) | 25.1 ± 2.6 (20 -30) |
Table 2.
Extent of ptosis in our samples
| Ptosis value (mm) | |
|---|---|
| Overall maximal ptosis value, mean ± SD | 2.69 ± 0.74 |
| Overall minimal ptosis value, mean ± SD | 0.09 ± 0.07 |
| Overall mean ptosis value, mean ± SD | 1.05 ± 0.38 |
Overall, mean ptosis was not different between gender (p = 0.1). Mean ptosis correlated with age (r = 0.84, p < 0.001) and with BMI (r = 0.60, p < 0.001).
At multivariate regression model, mean ptosis level correlated with all the variables: with age (coeff. = 0.02 95% CI = 0.01–0.02, p < 0.001), gender (female versus male: coeff. = 0.22 95% CI = 0.13–0.31, p < 0.001) and BMI (coeff. = 0.03 95% CI = 0.01–0.05, p < 0.001).
The graphs below display marginal prediction for mean ptosis for age (Fig. 4), gender (Fig. 5) and BMI (Fig. 6).
Fig. 4.

Marginal prediction for mean ptosis for age
Fig. 5.
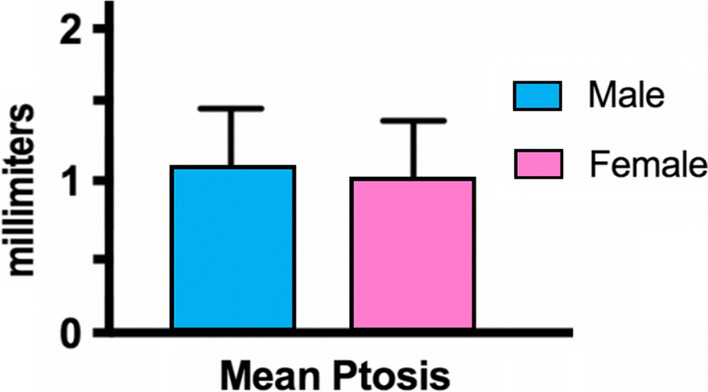
Marginal prediction for mean ptosis for gender
Fig. 6.

Marginal prediction for mean ptosis for BMI
All the statistical correlation indices between the mean ptosis of our sample and the three independent variables (age, gender and BMI) are summarized in Table 3.
Table 3.
Statistical correlation’s indexes
| Mean ptosis for | p value | r | Coefficient | 95% C.I | |
|---|---|---|---|---|---|
| Gender | T Student's test | 0,01 | / | / | / |
| Multivariate regression model (female vs male) | < 0,001 | / | 0,22 | 0,13—0,31 | |
| Age | Pearson test | < 0,001 | 0,84 | / | / |
| Multivariate regression model (female vs male) | < 0,001 | / | 0,02 | 0,01—0,02 | |
| BMI | Pearson test | < 0,001 | 0,6 | / | / |
| Multivariate regression model (female vs male) | < 0,001 | / | 0,03 | 0,01—0,05 |
Discussion
Ptosis in the medical literature is classified according to various criteria, such as age at onset, etiology, and severity. Based on age at onset, ptosis can be congenital or acquired [6]; on the etiology, it can be myogenic, neurogenic, aponeurotic, mechanical or traumatic; on severity, it can have different entities (minimal, moderate, severe) depending on the number of millimeters of the ptosic tissues [2, 12, 13]. Aponeurotic ptosis, also called “senile,” is the most common cause of acquired ptosis [14]. The long-term effect of gravity determines the senescent slippage of the aponeurosis, causing involuntary age-related changes of face in the elderly [2].
An important contribute on the description of facial layers and retaining ligaments was given by Mendelson et al. [15–20], which performed facial dissection on 16 fresh cadavers ages 12 to 89 years and tissue samples from varying age groups were examined histologically. The areolar cleavage plane overlying is a true anatomical space, with specific boundaries, and it is reinforced by retaining ligaments. Histologically, the floor is formed by a thin layer of dense connective tissue, which undergoes minor deterioration in architectural arrangement with age. The roof, lined by a thin transparent and adherent membrane, has a less dense collagen network and contains more elastin. With age, there is a significant reduction in the collagen density of the roof. [15] This plane is avascular, ligamentous, and allows for easy surgical dissection. It is also easy to identify, as it is bright white reflective differs from the yellow fat subcutaneous layer [3]. The filling of this space (i.e., iatrogenic hyaluronic acid) is fundamental for the support of soft tissues and to counteract facial ptosis.
The retaining ligaments have been variously studied in the literature: Mac Gregor [21, 22], Psillakis[23], Furnas [8], Stuzin[24]. They are of two main types: the properly osteocutaneous one (zygomatic, Mac Gregor, mandibular ligament) and fascial ones (platysma-cutaneous, masseteric-cutaneous, parotid-cutaneous or platysma-auricular) [3]. These ligaments, together with the deep mimic muscles, form boundaries that separate the fat compartments: Especially in the central facial area, they cross the facial layers perpendicularly and anchor the superficial structures to the deeper layers [21]. In this way, these ligaments anchor the skin tissues to the deep planes in some specific points and at the same time divide the facial fat into separate, independent compartments with a heterogenous ultrastructure [3, 4]. This subdivision determines heavier fat filling areas, which tend to droop, and cutaneous furrows between them.
The fatty tissue of the face, as illustrated by Cotofona et al. [4], can be divided into a superficial (subcutaneous) fat and a deep fat, located below the Smas. In both cases, the fat is divided into distinct compartments, separated by bands and septa. Each fat compartment provides volume and filling to the face. With aging, the fat and the ligaments that keep it in place undergo biochemical alterations that make the fatty areas less toned and more yielding, moreover with the increase of the BMI also the mass of the facial fat increases, making it more ptotic.
In our trial, we selected only patients without pathologies that could alter the normal facial soft tissue ptosis. The assumption we have considered is that the millimetric measurement of the discrepancy between the vertical and horizontal facial scan is the numerical data that corresponds to the ptosis of the tissues, which moves according to gravity; so, for each patient, the mean ptosis we considered corresponds to the average millimeter discrepancy between the vertical and horizontal scan. The analysis of the results shows that there is a statistically significant correlation between mean ptosis and age and between mean ptosis and BMI; Student’s T test showed no correlation between average ptosis and gender. However, as shown in Graphs 4, 5 and 6, mean ptosis correlates with all the three studied variables at the multivariate regression model: The model showed a strong correlation between average ptosis and age (coeff. = 0.02, 95% CI = 0.01–0.02, p < 0.001), with BMI (coeff. = 0.03, 95% CI = 0.01–0.05, p < 0.001), and also, a statistically significant correlation with gender was highlighted (female versus male: coeff. = 0.22, 95% CI = 0.13–0.31, p < 0.001).
Our results suggest that age and BMI correlate very closely with the amount of soft tissues ptosis, both in the Pearson test and in the multivariate regression model. For gender, Student’s T test did not show statistically significant correlation with mean ptosis. This suggests that overall, there was not large difference in mean ptosis between males and females. However, the multivariate regression model showed a significant correlation between gender and mean ptosis (see Table 3). The interpretation of this data suggests that between males and females, there is a difference in ptosis adding at the same age and BMI variable. In particular, with increasing age and BMI, ptosis becomes greater in women, and the difference between males and females increases. This difference in face aging between gender could be correlated with a different biochemical and morphological composition of the retaining ligaments and of the fat compartments of the face.
Analyzing the superimpositions of facial scans in upright and supine position, it was very interesting to note that the points of more discrepancy (red points on Fig. 7a) frequently correspond to the fat compartments, i.e., nasogenian, labiomental, subpalpebral and submental. Moreover, the points of minor discrepancy (green points on Fig. 7a), corresponding to the points of greatest fixity, are located in the areas close to the retention ligaments described on the cadaver by Mendelson, and with the furrows between fat compartments (Fig. 7b). This has led us to assume that there may be a close correspondence between ptosis and the topography of the retention ligaments distribution.
Fig. 7.

a Color map showing the points of minor (on green) and major (on red) discrepancy; b anatomical illustration showing the retention ligaments between the fat compartments
Given this consideration, it is interesting to underline that the mean ptosis we measured is mainly influenced by the points of maximum ptosis in correspondence with the fat compartments, and it is precisely there that the maximum correlation with aging and fat gain was observed. On the contrary, in the furrows and in the points of lesser ptosis, the correlation with the independent variables tends to decrease because the ptosis is minimal in almost the entirety of the sample. Our research has for sure some limitations, two of them that should be considered are the small sample pool took in exam and the geometrical variables of the 3D images. We were able to recruit 60 patients that met all the inclusion criteria and from the analysis that we conducted, it is possible to notice good resolution of the application in detecting depressed and prominent area of the face creating a good quality 3D object easy to compare. We are although aware that bigger samples could improve the results focusing on smaller details. Moreover, it is important to underline how the research is burdened by a procedural bias following the semi-automized process of superimposition. In fact, this process is achieved in two steps, and the first one is operator related followed by an automized process. The first step may have led to little discrepancies in matching the 3D meshes one over the other missing the perfect superimposition of depressed and prominent areas of the face. This limit could be exceeded in the future with the implementation in the software of a fully automated process of superimposition based on anatomical landmarks recognized by the machine.
Conclusion
In conclusion, the method we used allowed us not only to measure the minimum, the average and the maximum ptosis of the face, but also to make a complete morphological study of the effect of gravity on the facial surface. At the multivariate regression model, mean ptosis correlated with all the studied variables (BMI, gender, age), and the statistical correlation’s indexes were highly significant. The 3D facial scans obtained with Bellus3D Face Camera Pro System© for iPhone were found to be very accurate, low cost and easily reproducible.
The obtained encouraging results suggest that the proposed method is effective, and it could be a starting point for further studies on the subject in order to confirm the results obtained.
Funding
This research did not receive any specific grant from funding agencies in the public, commercial or not-for-profit sectors.
Declaration
Conflict of interest
The authors declare that they have no conflict of interest.
Ethical Approval
No general ethical approval was needed, with only a signed patient required by the hospital.
Footnotes
Publisher's Note
Springer Nature remains neutral with regard to jurisdictional claims in published maps and institutional affiliations.
References
- 1.Bron AJ, Tripathi RC, Tripathi BJ. Wolff’s anatomy of the eye and orbit 2 The ocular appendages: Eyelids, conjunctiva and lacrimal apparatus. London: Chapman and Hall Medical; 1997. pp. 30–72. [Google Scholar]
- 2.Finsterer J (2003) Ptosis: causes, presentation, and management. Aesthetic Plast Surg 27(3):193–204. Epub 2003 Aug 21. Review. PubMed PMID:12925861 [DOI] [PubMed]
- 3.Saban Y, Polselli R, Bertossi D, East C, Gerbault O. Facial layers and facial fat compartments: focus on midcheek area. Facial Plast Surg. 2017;33(5):470–482. doi: 10.1055/s-0037-1606855. [DOI] [PubMed] [Google Scholar]
- 4.Cotofana S, Fratila AA, Schenck TL, Redka-Swoboda W, Zilinsky I, Pavicic T. The anatomy of the aging face: a review. Facial Plast Surg. 2016;32(3):253–260. doi: 10.1055/s-0036-1582234. [DOI] [PubMed] [Google Scholar]
- 5.Ko AC, Korn BS, Kikkawa DO. The aging face. Surv Ophthalmol. 2017;62(2):190–202. doi: 10.1016/j.survophthal.2016.09.002. [DOI] [PubMed] [Google Scholar]
- 6.Richard MJ, Morris C, Deen BF, Gray L, Woodward JA. Analysis of the anatomic changes of the aging facial skeleton using computer-assisted tomography. Ophthalmic Plast Reconstr Surg. 2009;25(5):382–386. doi: 10.1097/IOP.0b013e3181b2f766. [DOI] [PubMed] [Google Scholar]
- 7.Mendelson B, Wong CH. Changes in the facial skeleton with aging: implications and clinical applications in facial rejuvenation. Aesthetic Plast Surg. 2012;36(4):753–760. doi: 10.1007/s00266-012-9904-3. [DOI] [PMC free article] [PubMed] [Google Scholar]
- 8.Furnas DW. The retaining ligaments of the cheek. Plast Reconstr Surg. 1989;83(1):11–16. doi: 10.1097/00006534-198901000-00003. [DOI] [PubMed] [Google Scholar]
- 9.Brandt MG, Hassa A, Roth K, Wehrli B, Moore CC. Biomechanical properties of the facial retaining ligaments. Arch Facial Plast Surg. 2012;14(4):289–294. doi: 10.1001/archfaci.2011.1533. [DOI] [PubMed] [Google Scholar]
- 10.Thornton GM, Lemmex DB, Ono Y, et al. Aging affects mechanical properties and lubricin/PRG4 gene expression in normal ligaments. J Biomech. 2015;48(12):3306–3311. doi: 10.1016/j.jbiomech.2015.06.005. [DOI] [PubMed] [Google Scholar]
- 11.Abbate V, Romano A, AlQahtani A, et al. Midcheek endoscopic anatomy. Head Neck. 2016;38(Suppl 1):E268–E273. doi: 10.1002/hed.23984. [DOI] [PubMed] [Google Scholar]
- 12.Beard C. A new classification of blepharoptosis. Int Ophthalmol Clin. 1989;29:214. doi: 10.1097/00004397-198902940-00002. [DOI] [PubMed] [Google Scholar]
- 13.Baggio E, Ruban JM. Postoperative ptosis: etiopathogenesis, clinical analysis, and therapeutic management. Apropos of a series of 43 cases. J Fr Ophtalmol. 1998;21:361–373. [PubMed] [Google Scholar]
- 14.Cohen AJ (2001) Ptosis, adult. Emedicine, December 12
- 15.Mendelson BC, Freeman ME, Wu W, et al. Surgical Anatomy of the Lower Face: The Premasseter Space, the Jowl, and the Labiomandibular Fold. Aesth Plast Surg. 2008;32:185–195. doi: 10.1007/s00266-007-9060-3. [DOI] [PubMed] [Google Scholar]
- 16.Mendelson BC, Wong CH. Surgical anatomy of the middle premasseter space and its application in sub-SMAS face lift surgery. Plast Reconstr Surg. 2013;132(1):57–64. doi: 10.1097/PRS.0b013e3182910b70. [DOI] [PubMed] [Google Scholar]
- 17.Mendelson B, Wong C (2012) Anatomy of the sgeing face. In: Plastic Surgery. 3rd ed., New York, NY: Elsevier
- 18.Mendelson BC. Anatomic study of the retaining ligaments of the face and applications for facial rejuvenation. Aesthetic Plast Surg. 2013;37(3):513–515. doi: 10.1007/s00266-013-0066-8. [DOI] [PMC free article] [PubMed] [Google Scholar]
- 19.Mendelson BC (1995) Extended sub-SMAS dissection and cheek elevation. Clin Plast Surg 22(2): 325–39; discussion 897–911. [PubMed]
- 20.Mendelson BC, Muzaffar AR, Adams WP (2002) Surgical anatomy of the midcheek and malar mounds. Plast Reconstr Surg 110(3): 885–96; discussion 897–911 [DOI] [PubMed]
- 21.Rohrich RJ, Pessa JE (2007) The fat compartments of the face: anatomy and clinical implications for cosmetic surgery. Plast Reconstr Surg 119(07):2219–2227, discussion 2228–2231 [DOI] [PubMed]
- 22.McGregor M (1959) Face Lift Techniques. Proceedings of the 1st Annual Meeting of the California Society of Plastic Surgeons. In: Yosemite, CA
- 23.Psillakis JM, Rumley TO, Camargos A. Subperiosteal approach as an improved concept for correction of the aging face. Plast Reconstr Surg. 1988;82(03):383–394. doi: 10.1097/00006534-198809000-00001. [DOI] [PubMed] [Google Scholar]
- 24.Stuzin JM, Baker TJ, Gordon HL (1992) The relationship of the superficial and deep facial fascias: relevance to rhytidectomy and aging. Plast Reconstr Surg 89(03):441–449, discussion 450–451 [PubMed]