

Abstract
Certain microalgal species can grow under high CO2 concentrations providing potential for mitigating CO2 pollution in flue gas produced by power plants. Microalga Scenedesmus obliquus strain HTB1 was isolated from the Chesapeake Bay and grow rapidly in a high level of CO2. However, little is known about the molecular responses of HTB1 to high CO2 levels. Here, we investigated how HTB1 responds to 10% CO2 using the time‐resolved transcriptome analysis. Gene expression profiles indicated that HTB1 responds quickly (in 2 h) and becomes adaptive within 12 h when exposed to 10% CO2. Interestingly, certain genes of light‐harvesting, chlorophyll synthesis and carbon fixation (i.e. rbcS) were up‐regulated at 10% CO2, and these functional responses are consistent with the increased photosynthesis efficiency and algal biomass under 10% CO2. Nitrate assimilation was strongly enhanced, with amino acid biosynthesis and aminoacyl tRNA biosynthesis genes being markedly up‐regulated, indicating that HTB1 actively takes up nitrogen and accelerates protein synthesis at 10% CO2. Carbon metabolism including fatty acid biosynthesis and TCA cycle was enhanced at 10% CO2, supporting the earlier observation of increased lipid content of Scenedesmus sp. under high CO2 levels. Interestingly, key genes like RuBisCO (rbcL) and carbonic anhydrase in carboxysomes did not respond actively to 10% CO2, implying that exposure to 10% CO2 has little impact on the carbon concentrating mechanisms and CO2 fixation of the Calvin cycle. It appears that HTB1 can grow rapidly at 10% CO2 without significant metabolic changes in carbon fixation and ATP synthesis.
HTB1 cells are able to grow rapidly in 10% CO2 without substantial changes in their metabolic activities related to photosynthesis, carbon fixation, and ATP synthesis. HTB1 may prefer to grow with 10% CO2 over the air, making it an ideal candidate strain to be used for capturing CO2 in the flue gas.

INTRODUCTION
Since industrialization, a significant amount of greenhouse gases (water vapour, CO2, CH4, NOx, O3, etc.) has been produced and discharged into the atmosphere resulting in global warming. Global warming necessitates the reduction of accumulated greenhouse gases in the atmosphere. Regarding the treatment of greenhouse gases, especially the significant quantity of CO2 emissions generated since the industrial revolution, biological, physical and chemical mitigation methods have been developing rapidly in recent years (Huang et al., 2014; Rau, 2011; Song et al., 2020; Wang et al., 2008). Although excessive CO2 emissions can be reduced by physical and chemical conversions, the complicated reactions and expensive material consumption make these unsuitable for sustainable development (Brennecke & Gurkan, 2010; Xiong et al., 2017). Biological conversion by microalgae is a promising approach to increase CO2 sequestration due to the ability of microalgae to capture CO2 and achieve high biomass in an environmentally friendly, safe and sustainable way (Rodas‐Zuluaga et al., 2021; Song et al., 2020; Toledo‐Cervantes et al., 2018). The harvested biomass can be used as feedstocks for valuable natural products, including renewable biofuel, proteins, livestock feed, lipids and other bioproducts (Chiu et al., 2009; Cheng et al., 2015; Ji et al., 2017; Liu et al., 2019). However, the emission sources usually contain a large concentration of CO2 (5%–15%), which is much higher than that in aquatic environments (0.04%), and many microalgae cannot survive in such high CO2 concentrations.
Microalgae that can grow in high CO2 conditions have the potential to be used for carbon capture. Several microalgal strains have been found to tolerate high CO2 concentrations, such as Chlamydomonas reinhardtii (Choi et al., 2021), Scenedesmus sp. (Liu et al., 2019), Botryococcus braunii (Rodas‐Zuluaga et al., 2021), Desmodesmus sp. (Yang et al., 2020), Chlorella sp. (Rodas‐Zuluaga et al., 2021) and Spirulina sp. (Duarte et al., 2020). Different microalgal strains have different capacities for CO2 fixation, growth rate and production of value‐added compounds under the same CO2 concentration. Ma et al. (2019) found that Scenedesmus obliquus PF3 can accumulate more biomass in high CO2 concentrations than that of Chlorella sp. WT and Chlorella sp. MTF‐7. Rodas‐Zuluaga et al. (2021) found that the CO2 concentration (0.03%–20%) acted as the inhibition factor of B. braunii, but Scenedesmus sp. showed increases in growth rate, biomass, protein production and carbohydrate production. Compared to other strains (Chlorella sp. L166, Chlorella sp. UTEX1602, and Spirulina sp. FACHB‐439), Scenedesmus sp. 336 exhibited higher productivity of pigments, lipid and carbohydrates with the treatment of 15% CO2 (Song et al., 2020). Another study indicated that Scenedesmus obliquus SJTU‐3 has higher maximum biomass production and lipid productivity than Chlorella pyrenoidosa SJTU‐2 under optimal CO2 concentration (Tang et al., 2011). Therefore, Scenedesmus strains have attracted more attention as suitable microalgae with the potential to alleviate greenhouse gas effects and increase valuable natural compounds production. However, most studies have been conducted on the physiological characteristics of Scenedesmus sp., but few studies have focused on the global transcriptional analysis to reveal the mechanism of rapid growth and accumulation of value‐added compounds under high CO2 concentrations.
Transcriptomic approaches make it possible to fully explore the genetic bases and metabolic regulation pathways of microalgae. Such studies could greatly improve the current understanding of the molecular mechanisms involved in the responses to high CO2. For example, functions related to carbon fixation, TCA cycle, ATP generation and glycolysis were found to be important for Chlorella LAMB 31 to grow under 40% CO2 concentration (Li et al., 2021a). Carbon fixation and nitrogen metabolism played significant roles for Chlorella PY‐ZU1 when the microalga was grown with 15% CO2 (Huang et al., 2017).
To address the above questions, we tracked the transcriptomic profile of S. obliquus HTB1 over 2, 12, 24 h and day 4 during microalgal adaption to 10% CO2 concentration. HTB1 (originally named E7A) was isolated from Back River in Baltimore, MD, and has been shown to proliferate in a wide range of CO2 concentrations (2%–20%) and grow vigorously in large bioreactors (500 L) charged with the flue gas (Liu et al., 2013). This finding indicated that HTB1 has great potential for carbon emission reduction in large‐scale cultivation systems. However, we know little about how S. obliquus HTB1 responds to high CO2 at the molecular level. In this study, we aimed to explore the differences in the transcriptional response of HTB1 to 10% CO2 at varied time points. We chose 10% CO2 because it is close to the CO2 level of flue gas produced by power plants.
EXPERIMENTAL PROCEDURES
Algal culture and CO2 manipulation
Scenedesmus obliquus (strain HTB1) was isolated and maintained in our laboratory at the Institute of Marine and Environmental Technology (IMET), University of Maryland Center for Environmental Science. HTB1 stands for HY‐TEK Bio strain 1 and was isolated for HY‐TEK Bio, LLC through a joint research effort. HY‐TEK Bio permitted the use of strain HTB1 for this study. The HTB1 culture was maintained and grown in BG‐11 medium (Rippka et al., 1979) with air aeration, and the medium was prepared using deionized water, which was 0.22‐μm filtered and autoclaved. The experimental design included two groups, the air group and the 10% CO2 group. Each condition was set up in triplicate (duplicate for RNA‐seq). After incubating HTB1 to the last stage of the exponential phase three times, cells were collected by centrifugation (4000 rpm for 5 min at room temperature), and the cell pellet was suspended and inoculated into six bottles at a starting OD680 value of 0.75. Experimental cultures were grown in 2 L glass bottles with 1.6 L BG‐11 medium at 25°C under a 16:8 h light: dark cycle with a light intensity of 30–100 μE/m2/s provided by 54‐watt white fluorescent lights. The light intensity was adjusted based on cell density. At the beginning of the experiment (low cell density), the light density was 30 μE/m2/s, while at the end of the experiment (high cell density), the light density was 100 μE/m2/s. The CO2 gas used in this study was purchased from Airgas USA, LLC (CD USP50), and it was delivered by a constant bubbling flow rate. The CO2 concentration was determined by GasLab® Sensor Configuration and Data Logging Software (https://www.co2mete r.com/pages/downloads). Cell density (optical density at 680 nm) and pH were monitored at 2, 12, 24 h and then once each day afterwards, and the pH of samples (5 ml) was determined immediately upon sampling. The following formula was used to calculate intrinsic growth rates: μ = ln(N 2/N 1)/(t 2/t 1), where N 2 and N 1 are the OD values at time t 2 and t 1 respectively (Levasseur et al., 1993).
Measurement of photochemical efficiency and adenosine triphosphate (ATP) content
In this study, the maximum photochemical efficiency (Fv/Fm) was quantified by Phyto‐PAM Phytoplankton Analyzer (Walz, Germany) as previously described (Dong et al., 2014). Briefly, a 1 ml sample was collected from each culture at 2, 12, 24 h and then each day of the experiment afterwards. The samples were kept in darkness for 20 min before determining Fv/Fm. Besides, samples were also collected at 2, 12, 24 h, day 4 and day 7 for ATP measurement. According to the manufacturer’s instructions, the cellular ATP content was assayed by the BacTiter‐Glo Microbial cell viability assay kit (Promega, USA). The ATP luminescence signal was detected using a microplate reader (Varioskan Flash; Thermo Scientific, USA).
RNA extraction
At 2, 12, 24 h and day 4, 50 ml of each culture was harvested and centrifuged at 4000 rpm for 5 min at 4°C. The cell pellets were immediately flash‐frozen with liquid N2 and then stored at −80°C until RNA extraction. Total RNA was extracted using Trizol reagent (Invitrogen, USA) according to the manufacturer's protocol. The extracted RNA integrity was assessed on Agilent 2100 bioanalyser (Agilent, USA), while concentration was quantified on Nanodrop (ND‐2000 spectrophotometer; Thermo Scientific).
Library construction and RNA sequencing
Approximately, 1 μg total RNA from each sample was used as input material to generate a cDNA library. Briefly, the poly(A) mRNA was isolated from total RNA samples using oligo (dT) magnetic beads and then cut into short fragments by 5× fragmentation buffer. Next, the first strand of cDNA was synthesized by the reaction using short mRNA fragments, dNTPs, random N6 primers and RNase inhibitors. Then, the second strand of cDNA was synthesized using GEX Second Strand buffer, dNTPs, RNaseH and DNA polymerase. After this, the double‐stranded cDNAs were purified using QIAquick PCR Purification Kit (Qiagen, China) and resolved with EB buffer for end reparation and single nucleotide A (adenine) addition. Next, cDNAs were ligated to sequencing adapters using MinElute PCR Purification Kit (Qiagen), and then the obtained products were purified by 1% agarose gel electrophoresis and amplified using PCR. Lastly, the constructed cDNA library of HTB1 was subjected to sequence on the BGISEQ‐500 platform with paired‐end reads of 100 nucleotides at BGI Genomics (Wuhan, China).
To obtain clean data, low‐quality and adaptor‐polluted raw reads, as well as reads with over‐ambiguous ‘N’ nucleotides, were removed from raw data, and the Q20 of the clean reads in each sample was over 96.5%. After the quality control procedure, the clean reads were mapped to reference gene sequences by Bowtie2 (v2.2.5) (Langmead & Salzberg, 2012), and the gene expression levels were calculated for each sample by RSEM (v1.2.8) (Li & Dewey, 2011). Transcriptome de novo assembly was accomplished by Trinity software (v2.0.6) with default parameters based on the clean reads we mentioned above (Grabherr et al., 2011).
Functional annotation and differentially expressed gene (DEG) analysis
For functional annotation, the resulting transcripts were annotated to seven public databases, including NCBI‐Nt, NCBI‐Nr, SwissProt, Pfam, KOG, GO and KEGG. Furthermore, genes with fold change ≥2 and adjusted p‐value (Q‐value) ≤0.001 were accepted as DEGs between different samples. The fold change values were determined by DEGseq: a R package. The Q‐values were obtained based on multiple testing (Benjamini & Hochberg, 1995) and statistical significance analysis (Storey & Tibshirani, 2003) methods. The functional enrichment analysis of DEGs was conducted according to the KEGG pathway databases (http://www.genome.jp/kegg).
Statistical analysis
Assumption of normal distribution was performed using the Shapiro–Wilk W test, on our physiological data sets before statistical analyses. Normal distribution was verified for all of our data. Differences in physiological parameters between the air group and the 10% CO2 group were assessed by the independent‐samples t‐test, using SPSS (version 17.0) statistical software. p < 0.05 was considered statistically significant.
Accession number
All the transcriptomic sequencing raw data in this study was submitted to the GenBank’s Sequence Read Archive (SRA) database (https://www.ncbi.nlm.nih.gov/) under the accession number PRJNA750395.
RESULTS
Physiological responses to high CO2 exposure
The air group and 10% CO2 group had a similar growth trend in the first 2 days, and the CO2 group grew slightly faster than the air group after day 2 (Figure 1A). From day 3, HTB1 with 10% CO2 grew faster than HTB1 with air, and the OD value in the air group was significantly lower than that in the 10% CO2 group (Figure 1A, p < 0.05). On day 8, OD680 values of the air group and CO2 group reached 3.02 ± 0.15 and 3.48 ± 0.04 respectively. Also, we found that the intrinsic growth rates in the air group and the 10% CO2 group were 0.17 ± 0.06 and 0.19 ± 0.01 day−1 during 8‐days cultivation respectively. Furthermore, a significant difference in intrinsic growth rate was observed between these two groups (p < 0.01). These data suggest that HTB1 grows faster with 10% CO2 compared to its growth with air. The pH value in the air treatment was 6.95 ± 0.19 at 2 h and reached 9.34 ± 0.19 on day 8, while the pH value in the 10% CO2 group was 5.68 ± 0.15 at 2 h and increased to 6.57 ± 0.05 on day 8. Moreover, the pH value in the air group was significantly higher than that in the CO2 group at all time points (Figure 1B, p < 0.01). Interestingly, the maximum quantum efficiency (Fv/Fm) in the air group was higher than that in the CO2 group during the first 12 h. However, after day 3, the Fv/Fm in the air group was lower than that in the CO2 group, and significant differences were observed on days 3, 5 and 7 (Figure 1C, p < 0.05). The cellular ATP content in the air group was significantly higher than that in the CO2 group, at all sampling points (Figure 1D, p < 0.01).
FIGURE 1.
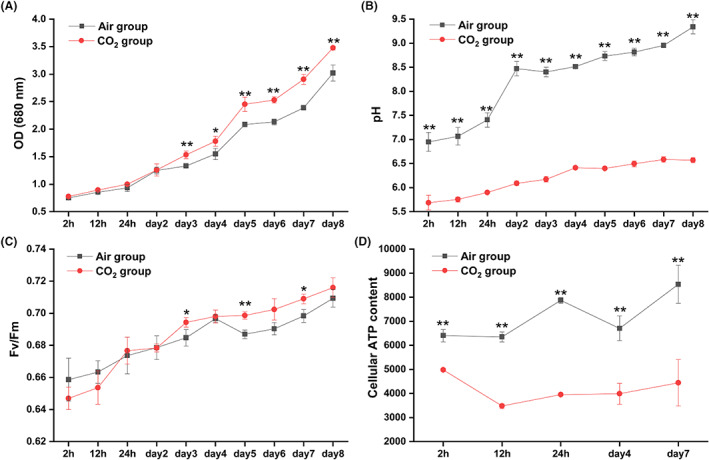
Physiological responses of HTB1 under air and 10% CO2 conditions. (A) Growth curves; (B) pH trends; (C) Fv/Fm; (D) Cellular ATP content. Data points represent means and error bars are standard deviation (SD), n = 3 (triplicates cultures); * indicates significant differences at 0.05 level; ** indicates significant differences at 0.01 level. Samples for transcriptomic analysis were collected at 2, 12, 24 h and day 4
Transcriptome sequencing results of the two treatments
After adaptor/primer trimming and quality filtering, over 6.17 Gb clean reads were obtained for each sample, and each clean reads dataset exhibited a Q30 (an error probability of 0.1%) that was 88.75 or higher. De novo assembly of these datasets generated 68,905 unigenes with an average length of 1146 bp, N50 of 1467 bp and N90 of 573 bp. The assembled unigenes were submitted to diverse public databases, and 59,249 unigenes (85.99%) matched functionally annotated genes (Table S1).
Differential gene expression profiles under high CO2 exposure
In total, 13,395, 11,144, 13,033 and 11,240 differentially expressed genes (DEGs) were identified at 2, 12, 24 h and day 4 respectively. Of these, 1303 DEGs were shared at all time points, and higher numbers of unique DEGs appeared at 2 h (4998) and 24 h (4261) respectively (Figure 2A, Table 1). To further explore the functional significance of transcriptional changes under high CO2 conditions, the KEGG pathway enrichment analysis was performed. When all the KEGG pathways significantly enriched by DEGs in any time points were considered together, 25 pathways were obtained (Q‐value < 0.05) (Figure 2B). Interestingly, 21 pathways enriched with DEGs occurred at 2 h, but only a few pathways were activated at 12, 24 h or day 4, suggesting that the most active cellular metabolic responses happened at 2 h. Among these 25 enriched pathways, 13 of them were only enriched at 2 h, including fatty acid metabolism, carbon metabolism, aminoacyl‐tRNA biosynthesis and so on (Figure 2B). Interestingly, selenocompound metabolism and ribosome biogenesis were only enriched at 12 h, while RNA transport and porphyrin and chlorophyll metabolism were uniquely enriched at 24 h. No unique significantly enriched KEGG pathway was found on day 4 (Figure 2B). Certain pathways, such as nitrogen metabolism, phenylpropanoid biosynthesis, MAPK signalling pathway, alanine, aspartate and glutamate metabolism and ABC transporters were significantly enriched at least at two time points, which may indicate that these pathways play important roles in adapting to 10% CO2.
FIGURE 2.
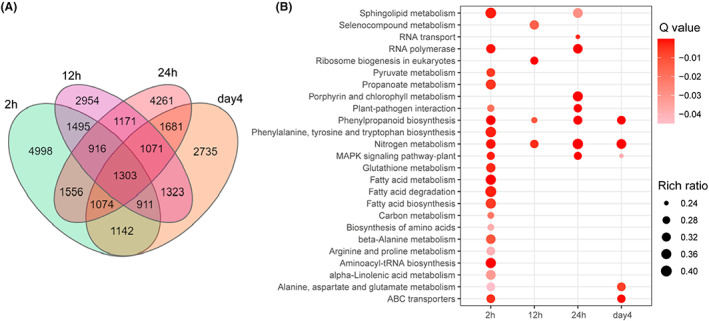
Differential gene expression profile at varied time points. (A) Venn diagram of DEGs at multiple time points. (B) Significant KEGG pathway enrichment of DEGs at multiple points (Q‐value <0.05). Circle colour strength represents Q‐value. ‘Rich ratio’ is the ratio of the DEGs number to the number of genes in the specific pathway
TABLE 1.
The number of up‐regulated and down‐regulated DEGs of HTB1 at varied time points
| Sampling time | Up‐regulated (%) | Down‐regulated (%) | Total regulated |
|---|---|---|---|
| 2 h | 6735 (50.3) | 6660 (49.7) | 13,395 |
| 12 h | 6379 (57.2) | 4765 (42.8) | 11,144 |
| 24 h | 7848 (60.2) | 5185 (39.8) | 13,033 |
| Day 4 | 5579 (49.6) | 5661 (50.4) | 11,240 |
Photosynthesis, carbon fixation and porphyrin and chlorophyll metabolism
In search of DEGs involved in photosynthesis, we found that many genes encoding photosynthesis antenna proteins (Lhca and Lhcb) exhibited significant changes under high CO2 conditions, especially the remarkable upregulation of Lhcb genes at 24 h and day 4 (Figure 3, Table S2). Furthermore, genes encoding photosystem II (PS II) and photosynthesis electron transport chain (ETC) exhibited slight upregulation at 12 and 24 h, while PS II, ETC and ATP synthesis genes were down‐regulated on day 4 (Figure 3, Table S2).
FIGURE 3.
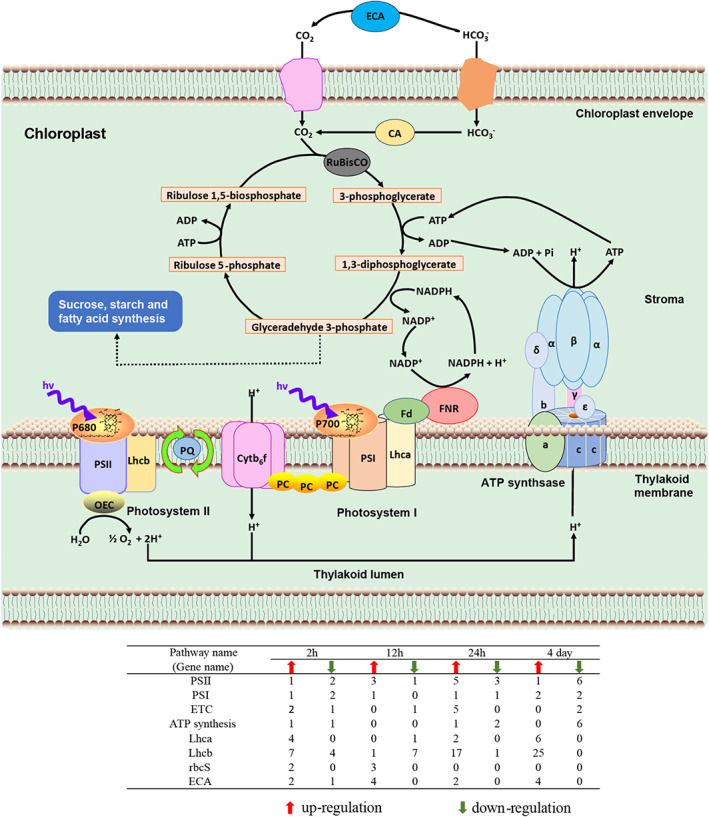
DEGs involved in photosynthesis and carbon fixation at varied time points. CA, intracellular carbonic anhydrase; Cytb6f, cytochrome b 6 f complex; ECA, extracellular carbonic anhydrase; ETC, electron transport chain; Fd, ferredoxin; FNR, ferredoxin–NADP+ reductase; Lhca, light‐harvesting complex I chlorophyll a/b binding protein; Lhcb, light‐harvesting complex II chlorophyll a/b binding protein; OEC, oxygen‐evolving complex; PC, plastocyanin; PQ, plastoquinone; PS I, photosystem I; PS II, photosystem II; rbcS, ribulose‐1,5‐bisphosphate carboxylase/oxygenase small chain; α, β, γ, δ, ε, a, b, c, F‐type H+‐transporting ATPase subunit α,β, γ, δ, ε, a, b, c
The small subunit of ribulose‐1,5‐bisphosphate carboxylase/oxygenase (RbcS) was up‐regulated at 2 and 12 h, but the large subunit (RbcL) displayed no significant changes in expression at any time point (Figure 3, Table S2). Interestingly, the expression of extracellular carbonic anhydrase (ECA) genes was significantly up‐regulated at all time points (Figure 3, Table S2). The gamma‐carbonic anhydrase (γ‐CA) displayed no significant changes in expression (Table S2), suggesting that the expression of these genes was not sensitive in response to high CO2 exposure at the transcriptional level.
Expression profiles of the genes involved in the porphyrin and chlorophyll metabolism showed significant differences under the 10% CO2 condition (Figure S1A, Table S2). In this pathway, 24 (up, 19; down, 5), 21 (up, 6; down, 15), 45 (up, 34; down, 11) and 34 (up, 24; down, 10) DEGs were enriched at 2, 12, 24 h and day 4 respectively (Figure S1A, Table S2).
Activated MAPK signalling and accelerated cell division
The MAPK signalling pathway was strongly influenced by 10% CO2 exposure. A total of 73 (48 up and 25 down), 44 (27 up and 17 down), 81 (57 up and 24 down) and 60 genes (33 up and 27 down) involved in the MAPK signalling pathway showed significant regulation at 2, 12, 24 h and day 4 respectively (Figure S1D, Table S8). Significant changes in MAPK1_3 (24), MAPK6 (day 4), MAPK8 (12 h and day 4), MAPKKK13 (2 h) and MAPKKK_ANP1 (12 and 24 h) were observed, and all of them were up‐regulated under 10% CO2 condition (Table S8).
MAPK signalling pathway plays a critical role in regulating many physiological processes, particularly the cell division cycle (Wilkinson & Millar, 2000). In comparison to 2 and 12 h, the expression levels of cell cycle‐related genes differed significantly at 24 h and day 4 under 10% CO2 condition, with 28 (22 up and 6 down) and 11 DEGs (10 up and 1 down) respectively (Figure S1E, Table S2).
Nitrogen metabolism, amino acid biosynthesis and aminoacyl tRNA biosynthesis
Many genes involved in the nitrogen metabolism pathway were differentially expressed under 10% CO2 condition, with 10 (out of 18) genes, 11 (out of 14) genes, 10 (out of 13) genes and 6 (out of 18) genes being significantly up‐regulated at 2, 12, 24 h and day 4 respectively (Figure S3, Table S5). Interestingly, NAD(P)H‐dependent nitrate reductase (NR) was dramatically up‐regulated at all time points (Figure S3, Table S2). At 12 and 24 h, a higher number of up‐regulated glutamine synthetase (glnA) and glutamate dehydrogenase (GDH) genes were identified compared to that of down‐regulated genes, but this trend was not observed on day 4. Here, two glnA genes and two glutamate dehydrogenase (NADP+) (gdhB) genes were found to significantly change the expression on day 4, and all of them were down‐regulated (Figure S3, Table S5).
Amino acid biosynthesis‐related processes were strongly influenced by the high CO2 exposure (Figure 2B). It has been found that a couple of pathways, such as the TCA cycle, pentose phosphate pathway and glycolysis, are tightly connected with the biosynthesis of amino acids in cells (Araújo et al., 2014). Based on our RNA‐seq data, the biosynthesis of the amino acid pathway was reconstructed (Figure S4, Table S6). Furthermore, 52 (43 up and 9 down), 45 (32 up and 13 down), 41 (26 up and 15 down) and 50 DEGs (27 up and 23 down) associated with biosynthesis of amino acids were observed at 2, 12, 24 h and day 4 respectively (Figure S1B and S3, Table S6).
Furthermore, we searched for aminoacyl tRNA biosynthesis genes and found that 43 genes, 23 genes, 18 genes and 21 genes showed significant regulation under the high CO2 condition at 2, 12, 24 h and day 4 respectively. Of these, 33, 16, 12 and 14 genes were significantly up‐regulated across the four time points (Figure S1C, Table S7).
Differentially expressed genes in carbon metabolism and energy metabolism
In this study, genes encoding critical enzymes of glycolysis, hexokinase (HK), were found notably regulated by 10% CO2 exposure at all time points (Figure S3, Table S3). Furthermore, several genes involved in the pentose phosphate pathway (PPP) also exhibited significant changes under high CO2 exposure, with 9 DEGs, 4 DEGs, 2 DEGs and 2 DEGs being found at 2, 12, 24 h and day 4 respectively (Figure S3, Table S3). Glucose‐6‐phosphate 1‐dehydrogenase (G6PDH) is generally considered the rate‐limiting enzyme in PPP (Elhefny et al., 2011). Our data show that G6PDH was significantly up‐regulated at 2 and 12 h under 10% CO2 condition, but remarkably down‐regulated on day 4 (Figure S3, Table S3).
A total of 27 TCA cycle‐related genes were differentially expressed between the air group and the CO2 group, including citrate synthase (CS), ATP citrate (pro‐S)‐lyase (ACL), malate dehydrogenase (MDH), isocitrate dehydrogenase (IDH1), pyruvate carboxylase (PC) and so on (Figure S3, Table S3). Specifically, 16 genes (out of 20), 8 genes (out of 9), 6 genes (out of 7) and 6 genes (out of 8) displayed significant upregulation at 2, 12, 24 h and day 4 respectively (Figure S3, Table S3).
In addition, 14 DEGs associated with fatty acid biosynthesis were identified in this study. Of these, 10 genes (out of 12), 2 genes (out of 2), 3 genes (out of 3) and 1 gene (out of 2) displayed significant upregulation under high CO2 conditions at 2, 12, 24 h and day 4 respectively (Figure S3, Table S3). Acetyl‐CoA carboxylase (ACCase) has been generally considered the rate‐limiting enzyme for fatty acid biosynthesis (Ohlrogge & Jaworski, 1997). It is interesting to find that genes encoding enzymes for acetyl‐CoA carboxylase carboxyl transferase subunit alpha (accA), acetyl‐CoA carboxylase biotin carboxyl carrier protein (accB) and ACCase, biotin carboxylase subunit (accC) were induced under 10% CO2 exposure at 2 h, but there were no significant changes at other time points (Figure S3, Table S3). It is noteworthy that the Delta‐9 desaturase (∆9D) gene exhibited upregulation at 2, 24 h and day 4 (Figure S3, Table S3).
Furthermore, some genes involved in oxidative phosphorylation were significantly regulated, including several subunits of the complex I (NADH dehydrogenase), IV (cytochrome c oxidase) and V (ATP synthase) (Figure S3, Table S4). Interestingly, complex IV was significantly up‐regulated at every time point (Table S5). Moreover, P‐type H+‐transporting ATPase (P‐ATPase) was strongly up‐regulated at 2, 12 h and day 4. Unlike P‐ATPase, F‐type H+‐transporting ATPase/F‐type H+/Na+‐transporting ATPase (F‐ATPase) was dramatically down‐regulated on day 4. Meanwhile, we also found that V‐type H+‐transporting ATPase (V‐ATPase) exhibited upregulation at 2 h, but had the opposite expression pattern at the other three time points (Figure S3, Table S4).
ABC transporter genes
In this study, the ABC transporter family was also found to be strongly influenced by the high CO2 exposure, especially for the ABC transporter C family (ABCC). At every time point, a lower number of up‐regulated ABCC genes were identified compared to that of down‐regulated genes, suggesting the expression of ABCC genes was always significantly suppressed under the high CO2 condition (Figure S5, Table S9).
DISCUSSION
This study is set to explore the time‐resolved transcriptome of S. obliquus HTB1 grown with air and 10% CO2 respectively. Results showed that under 10% CO2 condition, many KEGG pathways were strongly enriched at 2 h, but only a few pathways were significantly affected at 12, 24 h and day 4 (Figure 2B). This indicated that the 10% CO2 treatment induced dramatic responses of transcriptional regulation in HTB1 at the early stage of the experiment, and HTB1 quickly adapted to 10% CO2 within 12 h. To further explore the basic genes involved in HTB1 acclimating to high CO2, we examined the time‐resolved transcriptional responses in photosynthesis, carbon acquisition, nitrogen utilization, carbon metabolism, energy metabolism, cell division and signal transduction changes across varied time points.
Changes in the growth, carbon acquisition and photosynthesis
Promoted chlorophyll synthesis and light‐harvesting to increase photosynthetic efficiency and carbon fixation
In algae, photosynthesis occurs in a specialized intracellular organelle – the chloroplast. As shown in Figure 3, many genes encoding light‐harvesting complex proteins (LHCs) were significantly up‐regulated under 10% CO2 condition, especially at 24 h and day 4. Notable upregulation of LHCs genes implied that HTB1 actively harvested photons under the 10% CO2 condition, converting more light energy into redox energy for photosynthesis. LHCs are categorized into Lhca and Lhcb, which operate as the antennas for capturing photon energy and transferring the excitation energy to the reaction centres of PSI and PSII respectively (Ruban, 2015; Sheng et al., 2019). It appears that exposure to 10% CO2 enhances the light‐harvesting activity of HTB1 compared to the growth with air. The fact that HTB1 grew faster and had a higher Fv/Fm ratio under 10% CO2 condition (vs. air, after day 1, Figure 1A,C) supports that exposure to 10% CO2 poses a positive impact on the growth and photosynthesis efficiency of HTB1. Consistently, previous studies have demonstrated that both S. obliquus and Scenedesmus sp. have the best growth potential at 10% CO2 (Ho et al., 2010; Huang et al., 2020; Tang et al., 2011). Furthermore, the study on Scenedesmus sp. also showed that high CO2 concentrations (50%–70%) resulted in reduced photochemical efficiency through damage to PS II, whereas low CO2 concentrations (1%–30%) did not (Huang et al., 2020). Although a down‐regulated pattern of PS II related genes was observed on day 4, the 10% CO2 group still exhibited a higher maximum quantum efficiency (Fv/Fm) than the air group. This finding indicates that Lhcb, rather than other PS II genes, served as critical components to enhance photosynthesis efficiency. Similarly, 2% CO2 exposure can promote the growth of C. subellipsoidea, but significantly inhibit the expression of PS I and PS II related genes (Peng et al., 2016).
In addition, our transcriptomic data also indicated that exposure to 10% CO2 has a significant impact on the porphyrin and chlorophyll metabolism of HTB1. In particular, genes encoding magnesium chelatase (MgCh) were significantly up‐regulated at 2, 24 h and day 4, but slightly down‐regulated at 12 h. MgCh, a three‐subunit enzyme (ChlI, ChlD and ChlH), catalyses the insertion of Mg2+ into protoporphyrin IX, which is considered the first committed step in the chlorophyll biosynthetic pathway (Farmer et al., 2019). Expression patterns of MgCh indicated that chlorophyll synthesis appeared to be enhanced at 2, 24 h and day 4, but suppressed at 12 h. This is consistent with the dynamic light‐harvesting capacity described above, indicating that chlorophylls indeed play a vital role in photosynthetic light‐harvesting. Noteworthy, it is not clear why Lhcb and MgCh were down‐regulated at 12 h. Similar to our study, the previous study has shown that Chlorella PY‐ZU1 exposed to 15% CO2 always has a higher chlorophyll content than when exposed to air during the entire cultivation period (Huang et al., 2017). Taken together, we concluded that when exposed to 10% CO2, HTB1 enhanced the activity of light‐harvesting complex and chlorophyll synthesis to maintain a fast growth rate and high photosynthesis efficiency.
Under 10% CO2, HTB1 did not exhibit significant changes in the expression of the large subunit of ribulose‐1,5‐bisphosphate carboxylase/oxygenase gene (RuBisCO) or RbcL, but the small subunit RuBisCO gene (RbcS) was markedly up‐regulated at 2 and 12 h. These results suggest that the enhanced carbon fixation was mainly regulated by RbcS at the earlier stage. Similarly, Li et al. (2021a) reported that RbcS, not RbcL, serves a central role in carbon fixation when a Chlorella sp. was exposed to 40% CO2. Interestingly, rapid cell growth and increased carbon fixation rate were found in C. subellipsoidea C‐169 when exposed to high CO2 concentration, but no significant upregulation of RuBisCO was observed (Peng et al., 2016). A study on Chlorella PY‐ZU1 showed that under high CO2 conditions, the transcript abundance of RuBisCO increased 16.3 times compared with that under the air condition (Huang et al., 2017). These findings indicated that RuBisCO of different microalgae possesses different adaption strategies to high CO2 stress. In the present study, we found that only RbcS was notably up‐regulated, suggesting that RbcS plays a vital role in acclimating to high CO2 exposure and supporting robust cell growth.
Exposure to 10% CO2 did not affect the gene expression of intracellular carbonic anhydrase (CA) but up‐regulated the expression of extracellular CA (ECA) in HTB1 at all time points. It is well known that high CO2 concentrations (≥1%) often inhibit the activity of carbonic anhydrase (CA) and the CO2‐concentrating mechanism (CCM) in microalgae (Brueggeman et al., 2012; Huang et al., 2017). For example, CAs were barely expressed in Chlorella PY‐ZU1 when cultivated under 15% CO2 condition, and CCM was inactive (Huang et al., 2017). Microalgae generally regulate the uptake of /CO2 by intracellular CA (Li et al., 2021b). Similar to the RbcL gene, intracellular CA genes are not sensitive to 10% CO2 exposure, suggesting that 10% CO2 was not too high for HTB1 growth because it seems CCM still works. Furthermore, it is unknown why ECA genes were up‐regulated at high CO2 concentration in this study, which is in contrast to previous studies on other microalgae.
Enhanced cell cycle and MAPK signalling pathway were responsible for faster growth
At 24 h and day 4, a set of cell cycle genes displayed significant upregulation, which was consistent with the faster growth rate under the high CO2 condition. Cell division is a complex and dynamic process mainly driven by a set of enzymes widely known as cyclin‐dependent kinases (CDKs) and cyclins (Wilkinson & Millar, 2000). It has been proposed that MAPK signal transduction is responsible for cell cycle progression events, especially in modulating the G1‐S phase transition by inducing the expression of CDKs and cyclins essential for entry to the S phase (Meloche & Pouysségur, 2007). In this study, at each time point, most of the DEGs involved in the MAPK signalling pathway were up‐regulated. It has been suggested that MAPK cascades are organized in a three‐tiered architecture: MAPKKK, MAPKK and MAPK (Wilkinson & Millar, 2000; Zhang et al., 2013). Interestingly, all DEGs annotated as MAPK cascades were up‐regulated under 10% CO2 exposure. Therefore, we concluded that activation of the MAPK signal transduction induced the cell cycle progression and then promoted cell proliferation of HTB1. Elevated CO2 concentration with decreased pH also enhances the growth rate of other freshwater microalgae, e.g. Scenedesmus bajacalifornicus (Patil & Kaliwal, 2017), Dunaliella sp. (Moghimifam et al., 2019) and Chlorella fusca (Moraes et al., 2020).
Accelerated amino acid synthesis and associated translation activity through accelerated nitrate utilization
Under 10% CO2 exposure, we observed that HTB1 up‐regulated the NAD(P)H‐dependent nitrate reductase (NR) genes at every time point, indicating the elevation of nitrogen acquisition capacity under high CO2 conditions, which can potentially assimilate more into ammonium. It is widely acknowledged that glutamine synthetase/glutamate synthase (GS/GOGAT) and glutamate dehydrogenase (GDH) are responsible for most of the ammonium introduced into nitrogenous compounds, which mainly occurs in the chloroplast (Peng et al., 2016; Vega, 2018; Zhang et al., 2021). In the present study, a high number of up‐regulated GS/GOGAT and GDH genes were observed in comparison with that of down‐regulated genes at 12 and 24 h, but all DEGs involved in GS/GOGAT and GDH were down‐regulated on day 4. Together, up‐regulated NR, GS/GOGAT and GDH genes (12 and 24 h) indicate an enhanced ammonium assimilation capacity at the early stage of cultivation, which might supply substantial ammonium for cellular anabolism of HTB1. Strikingly, on the 4th day, upregulation of NR potentially indicates that ammonium production was enhanced, but this result was not reflected in ammonium consumption because GS/GOGAT and GDH were significantly down‐regulated, which might reduce the synthesis of nitrogenous compounds at later time points.
Based on our transcriptomic data, the interconnection between the amino acid (AA) biosynthesis pathway and central carbon metabolism (e.g. TCA cycle, pentose phosphate pathway and glycolysis) was constructed (Figure S4). As shown in Figure S4, the carbon backbones of amino acids are mainly obtained from the pentose phosphate pathway (erythrose‐4‐phosphate, ribose‐5‐phosphate), glycolysis (pyruvate, phosphoenolpyruvate and glyceraldehyde‐3‐phosphate) and the TCA cycle (2‐oxoglutarate, oxaloacetate), which are the same as previously reported (Buchanan et al., 2015). The major metabolic reactions involved in the synthesis of essential amino acids, as well as the enzymes that catalyse them, are mainly located in plastids (Lancien et al., 2007). In total, 23 kinds of AAs can be synthesized by HTB1, including histidine, tyrosine, phenylalanine, glycine, serine, cysteine, etc. (Figure S4). Most importantly, 10% CO2 exposure strongly altered the gene expression involved in AA biosynthesis, with most being up‐regulated. Meanwhile, our transcriptomic data also showed that the ratio of up‐regulated genes to down‐regulated genes involved in AA biosynthesis decreased gradually with the extension of cultivation time. Such regulation of these genes is strong evidence that the AA biosynthesis apparatus was activated under 10% CO2 condition, but the activation of AA biosynthesis in HTB1 cells gradually weakened over time. This may be due to the downregulation of GS/GOGAT and GDH genes, which could reduce the ammonium consumption incorporated into the AA biosynthesis pathway. Consistently, previous findings indicated that under elevated CO2 conditions, the AA content of S. obliquus indeed increases (Liu et al., 2019).
Aminoacyl tRNA synthetases (aaRSs) are essential for the faithful translation of the genetic code, as they catalyse the charging of tRNAs with their homologous amino acids. And the tRNA‐aminoacylation machinery mainly serves in the cytoplasmic compartment (Galani et al., 2001). It is worth noting that expression of aaRSs genes were induced at each time point, but this induction decreased gradually over time. Such a regulation pattern is similar to the AA biosynthesis we described above. As previously reported, protein synthesis is tightly coordinated with AA biosynthesis and aaRSs (O'Donoghue & Luthey‐Schulten, 2003; Zaher & Green, 2009). AAs regulation is one of the most important parts of protein biosynthesis, and it occurs quickly, accurately and efficiently in the ribosomal complex (just taking 60 ms to add a correct AA to the polypeptide) (Zaher & Green, 2009). To match such high speed and efficiency, aaRSs are essential and responsible for charging their corresponding tRNAs with the correct AA before protein synthesis (O'Donoghue & Luthey‐Schulten, 2003). Under elevated CO2 conditions, upregulation of amino acid biosynthesis and aaRSs genes induced translation and accelerated protein synthesis in S. dohrnii (Thangaraj & Sun, 2020). Interestingly, we observed a similar expression pattern with S. dohrnii; therefore, we concluded the protein synthesis machinery of HTB1 was also activated under 10% CO2 exposure.
Enhanced oxidative phosphorylation and P‐ATPases were mainly responsible for pH homeostasis
As described above, many genes involved in oxidative phosphorylation were differentially expressed between the air group and the 10% CO2 group, especially for genes encoding cytochrome c oxidase (COX) and ATP synthases (ATPases). COX is the terminal enzyme of mitochondrial respiration, which is an exergonic process, and the energy released can be used in creating proton gradients for ATP synthesis or ion transport (Capaldi, 1990). It has been demonstrated that F‐ATPase is mainly for ATP synthesis, and P‐ATPase and V‐ATPase are responsible for pH homeostasis within cells (Perzov et al., 2001). In this study, genes encoding COX were up‐regulated at each time point, indicating that mitochondrial respiration was strongly enhanced under the high CO2 condition, which can further promote ATP synthesis or ion transport. However, it is worth noting that F‐ATPase only showed down‐regulation on day 4, which potentially indicates that ATP production in HTB1 cells may not be significantly different between the two treatments before day 4. As shown in Figure 1D, the cellular ATP content under the 10% CO2 condition was always significantly lower than that under the air condition (p < 0.01). This finding potentially suggests that the rapid cell growth is accompanied by high consumption of ATP, which would explain why the cellular ATP content in the CO2 group was always significantly lower than that in the air group. In a repeated experiment, a similar trend was observed that cellular ATP content in the 10% CO2 group was indeed lower than that in the air group (Figure S2). In addition, we also suspect that when exposed to high CO2 concentration, HTB1 cells enhanced mitochondrial respiration to promote ion transport rather than ATP synthesis.
Furthermore, genes encoding P‐ATPase displayed significant upregulation under the high CO2 condition, particularly at 2, 12 h and day 4. P‐ATPases are located in the plasma membrane and are responsible for consuming ATP and exporting H+ out of the cells, which can generate an electrochemical gradient across the plasma membrane to drive nutrient uptake by channel proteins and carriers (Sondergaard et al., 2004). Under high CO2 exposure, more extracellular CO2 could produce a surplus H+ in HTB1 cells, and upregulation of P‐ATPase might be an adaptive mechanism to maintain intracellular pH homeostasis, as well as to facilitate nutrient uptake. Meanwhile, we also found that V‐ATPase was strongly up‐regulated at 2 h, but down‐regulated at 12, 24 h and day 4. V‐ATPases contribute to ATP hydrolysis and pump H+ from the cytoplasm to the vacuole (Mijaljica et al., 2011). It has been found that Chlorococcum littorale rapidly drops its cytoplasmic pH at the beginning of the acclimation process under high CO2 exposure, and then recovers to normal levels after the acclimation process, accompanied by an increase of the V‐ATPase activity (Sasaki et al., 1999). A time‐resolved study on Chlorella sp. LAMB 31 also indicated that the activation of V‐ATPase plays a vital role in maintaining cytoplasmic pH levels under high CO2 conditions (Li et al., 2021a). Unlike the above microalgae, our findings revealed that HTB1 likely adopted another strategy to maintain cytoplasmic pH. Based on our transcriptomic data, we suspect that when HTB1 experiences high CO2 exposure, both P‐ATPase and V‐ATPase are important for maintaining a stable intracellular pH at the beginning of the acclimation process (2 h), while P‐ATPase plays a major role in maintaining pH homeostasis after the acclimation process.
Reprogramming of carbon metabolism prepared for acclimating to high CO2 concentration
As shown in Figure 2B, the carbon metabolism pathway was significantly enriched under 10% CO2 condition. The carbon metabolism pathway mainly includes glycolysis, the pentose phosphate pathway, the TCA cycle and fatty acid synthesis. The changes in gene expression of these processes are shown in Figure S3 and Table S7. Genes encoding the key enzymes hexokinase (HK) in glycolysis were notably up‐regulated at all time points (Figure 4 and S3), potentially suggesting that the HTB1 cells need to consume more glucose to cope with high CO2 concentration. There is evidence that elevated glucose consumption can provide more NADH, FADH2 and building blocks for nucleic acid, fatty acid and protein synthesis to promote cell proliferation (Lunt & Vander Heiden, 2011). Meanwhile, most DEGs encoding the TCA cycle were predominantly up‐regulated under high CO2 exposure, especially at 2 h. The TCA cycle is the main pathway that not only produces NADH and FADH2 for generating metabolic energy, but also provides intermediates for other cellular physiological processes (e.g. carbon fixation, nitrogen metabolism and fatty acid synthesis) (Allen et al., 2011; Peng et al., 2016; Sun et al., 2016). In this study, upregulation of TCA cycle genes potentially indicates that more intermediates and metabolic energy were generated through the enhanced TCA cycle to support robust cell growth and accelerated cellular anabolism in HTB1 under high CO2 exposure. Such regulation was also observed earlier in other high CO2‐tolerant microalgae, such as C. subellipsoidea (Peng et al., 2016), Chlorella sp. LAMB 31 (Li et al., 2021a) and Chlorella protothecoides (Gao et al., 2014).
FIGURE 4.
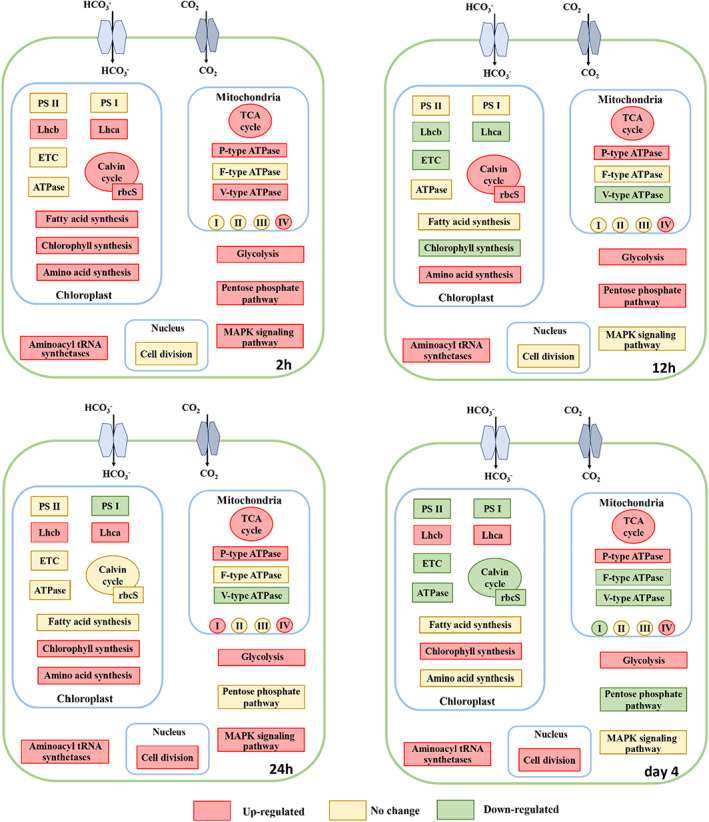
Schematic representation of biological pathway in HTB1 at varied time points. ETC, electron transport chain; Lhca, light‐harvesting complex I chlorophyll a/b binding protein; Lhcb, light‐harvesting complex II chlorophyll a/b binding protein; PS I, photosystem I; PS II, photosystem II; rbcS, ribulose‐1,5‐bisphosphate carboxylase/oxygenase small chain; I, NADH dehydrogenase; II, succinate dehydrogenase; III, cytochrome c reductase; IV, cytochrome c oxidase; glycolysis, hexokinase
Interestingly, most of the fatty acid synthesis genes were up‐regulated at 2 h with 10% CO2. Delta‐9 desaturase (∆9D) was up‐regulated at 2, 24 h and day 4. Desaturase plays a vital role in the synthesis of polyunsaturated fatty acids (FUFA). Together, these results suggest that fatty acid synthesis and FUFA synthesis of HTB1 were enhanced under high CO2 exposure. High CO2 can lead to an accumulation of both fatty acid and FUPA in S. obliquus cells when they are exposed to 10%–50% CO2 (Tang et al., 2011). Additionally, we found that glucose‐6‐phosphate 1‐dehydrogenase (G6PDH), a critical enzyme for the pentose phosphate pathway (which occurs in the cytoplasm, Figure 4), was significantly up‐regulated at 2 and 12 h, but down‐regulated on day 4. The pentose phosphate pathway is the main pathway for producing NADPH in cells that is necessary for carbon assimilation and fatty acid synthesis (Gao et al., 2014; Peng et al., 2016). In accordance with the enhanced pentose phosphate pathway to generate more NADPH at the early stage of the experiment (2 and 12 h), the carbon fixation and fatty acid synthesis were indeed accelerated under high CO2 exposure. However, on day 4, the downregulation trend of the pentose phosphate pathway was not reflected in the subsequent anabolism, and this inconsistency requires further investigation.
Remodelling of ABC transporter
As previously reported, ABC transporters are a large family of membrane proteins that have multiple functions, such as ion transport, secondary metabolite transport, antibiotic transport, heavy metal detoxification and phytohormone transport (Davidson et al., 2008; Gu et al., 2019; Rees et al., 2009). In the present study, we found that many genes involved in ABC transporter families were down‐regulated under the high CO2 condition, especially for the ABC transporter C family (ABCC) (Figure S5). The ABC transporter subfamilies exhibited different expression profiles at 10% CO2, and the expression levels of ABCC were more sensitive to 10% CO2 than other ABC transporter subfamilies. Overall, high CO2 inhibited the expression of ABC transporters in HTB1, suggesting that the transport of secondary metabolites, ions, phytohormones, heavy metals and toxic metabolites was impaired.
CONCLUSION
This report disclosed the time‐course molecular regulating mechanisms of S. obliquus HTB1 in response to 10% CO2 at the transcriptional level by combining analysis of photosynthesis, carbon metabolism, nitrogen metabolism, cell cycle and signal transduction. Under 10% CO2 condition, the growth rate of HTB1 was accelerated, which was supported by the enhanced cell cycle and MAPK signal transduction. Meanwhile, an increase in nitrate utilization was observed, accompanied by the increased capacity of amino acid synthesis and protein synthesis in 10% CO2. Furthermore, certain upregulation of genes related to light capture (Lhca and Lhcb), carbon fixation (RbcS), chlorophyll synthesis (MgCh) and carbon metabolism (e.g. HK, G6PDH, ACCase, and ∆9D) were observed, but we did not observe the increased activity of RbcL gene and decreased activity of intracellular CA genes. This implies that exposure to 10% CO2 has little impact on the genes associated with the carboxysomes in HTB1. In addition, the upregulation of genes in oxidative phosphorylation (COX) together with P‐ATPases was mainly responsible for the pH homeostasis. In summary, HTB1 cells appear to respond actively to the exposure of 10% CO2 within 2 h and quickly adapt to the condition afterwards (12 h to day 4). Compared to the earlier studies where CO2‐tolerant microalgae were exposed to high CO2 concentrations (40%–70%), much less gene regulation related to PS II, PS I, ECT, CCM and ATP synthesis were observed when HTB1 cells were grown in 10% CO2. Our study suggests that HTB1 cells are able to grow rapidly in 10% CO2 without substantial changes in their metabolic activities related to photosynthesis, carbon fixation and ATP synthesis. HTB1 may prefer to grow with 10% CO2 over the air, making it an ideal candidate strain to be used for capturing CO2 in the flue gas.
AUTHOR CONTRIBUTION
Hualong Wang and Feng Chen designed and performed experiments. Mei Zhang and Feng Chen wrote the manuscript.
CONFLICT OF INTEREST
All the authors declare that there are no conflicts of interest regarding this article.
Supporting information
Figure S1.
Appendix S1.
ACKNOWLEDGEMENTS
We acknowledge the funding supports (NoA#4701, #5214, #5417, #5903 and #6511) from the Maryland Industrial Partnership Program, the Maryland Department of Natural Resource and HY‐TEK Bio, LLC. We also wish to thank Robert M. Mroz and Lauren Wagner for the English proofreading.
Zhang, M. , Wang, H. & Chen, F. (2023) Time‐resolved transcriptome analysis of Scenedesmus obliquus HTB1 under 10% CO2 condition. Microbial Biotechnology, 16, 448–462. Available from: 10.1111/1751-7915.14100
Mei Zhang and Hualong Wang contributed equally to this work.
Funding Information
We acknowledge the funding supports (NoA#4701, #5214, #5417, #5903 and #6511) from the Maryland Industrial Partnership Program, the Maryland Department of Natural Resource and HY‐TEK Bio, LLC.
DATA AVAILABILITY STATEMENT
The data is avaliable on NCBI now. Here is the link: https://www.ncbi.nlm.nih.gov/bioproject/PRJNA750395/
REFERENCES
- Allen, A.E. , Dupont, C.L. , Oborník, M. , Horák, A. , Nunes‐Nesi, A. , McCrow, J.P. et al. (2011) Evolution and metabolic significance of the urea cycle in photosynthetic diatoms. Nature, 473, 203–207. [DOI] [PubMed] [Google Scholar]
- Araújo, W.L. , Martins, A.O. , Fernie, A.R. & Tohge, T. (2014) 2‐Oxoglutarate: linking TCA cycle function with amino acid, glucosinolate, flavonoid, alkaloid, and gibberellin biosynthesis. Frontiers in Plant Science, 5, 552. [DOI] [PMC free article] [PubMed] [Google Scholar]
- Benjamini, Y. & Hochberg, Y. (1995) Controlling the false discovery rate: a practical and powerful approach to multiple testing. Journal of the Royal Statistical Society Series B Statistical Methodology, 57, 289–300. [Google Scholar]
- Brennecke, J.F. & Gurkan, B.E. (2010) Ionic liquids for CO2 capture and emission reduction. The Journal of Physical Chemistry, 1, 3459–3464. [Google Scholar]
- Brueggeman, A.J. , Gangadharaiah, D.S. , Cserhati, M.F. , Casero, D. , Weeks, D.P. & Ladunga, I. (2012) Activation of the carbon concentrating mechanism by CO2 deprivation coincides with massive transcriptional restructuring in Chlamydomonas reinhardtii . Plant Cell, 24, 1860–1875. [DOI] [PMC free article] [PubMed] [Google Scholar]
- Buchanan, B.B. , Gruissem, W. & Jones, R.L. (2015) Biochemistry and molecular biology of plants. American Society of Plant Physiologists. Rockville, MA: John Wiley & Sons. [Google Scholar]
- Capaldi, R.A. (1990) Structure and function of cytochrome C oxidase. Annual Review of Biochemistry, 59, 569–596. [DOI] [PubMed] [Google Scholar]
- Cheng, H.H. , Whang, L.M. , Chan, K.C. , Chung, M.C. , Wu, S.H. , Liu, C.P. et al. (2015) Biological butanol production from microalgae‐based biodiesel residues by Clostridium acetobutylicum . Bioresource Technology, 184, 379–385. [DOI] [PubMed] [Google Scholar]
- Chiu, S.Y. , Kao, C.Y. , Tsai, M.T. , Ong, S.C. , Chen, C.H. & Lin, C.S. (2009) Lipid accumulation and CO2 utilization of Nannochloropsis oculata in response to CO2 aeration. Bioresource Technology, 100, 833–838. [DOI] [PubMed] [Google Scholar]
- Choi, H.I. , Hwang, S.‐W. , Kim, J. , Park, B. , Jin, E. , Choi, I.‐G. et al. (2021) Augmented CO2 tolerance by expressing a single H+‐pump enables microalgal valorization of industrial flue gas. Nature Communications, 12, 1–15. [DOI] [PMC free article] [PubMed] [Google Scholar]
- Davidson, A.L. , Dassa, E. , Orelle, C. & Chen, J. (2008) Structure, function, and evolution of bacterial ATP‐binding cassette systems. Microbiology and Molecular Biology Reviews, 72, 317–364. [DOI] [PMC free article] [PubMed] [Google Scholar]
- Dong, H.P. , Huang, K.X. , Wang, H.L. , Lu, S.H. , Cen, J.Y. & Dong, Y.L. (2014) Understanding strategy of nitrate and urea assimilation in a Chinese strain of Aureococcus anophagefferens through RNA‐Seq analysis. PLoS One, 9, e111069. [DOI] [PMC free article] [PubMed] [Google Scholar]
- Duarte, J.H. , Fanka, L.S. & Costa, J.A.V. (2020) CO2 biofixation via Spirulina sp. cultures: evaluation of initial biomass concentration in tubular and raceway photobioreactors. Bioenergy Research, 13, 939–943. [Google Scholar]
- Elhefny, A. , Kuliyev, A. & Gyulakhmedov, S. (2011) Regulation of glucose‐6‐phosphate dehydrogenase in plants. Journal of Plant Production, 2, 949–957. [Google Scholar]
- Farmer, D.A. , Brindley, A.A. , Hitchcock, A. , Jackson, P.J. , Johnson, B. , Dickman, M.J. et al. (2019) The ChlD subunit links the motor and porphyrin binding subunits of magnesium chelatase. The Biochemist, 476, 1875–1887. [DOI] [PMC free article] [PubMed] [Google Scholar]
- Galani, K. , Großhans, H. , Deinert, K. , Hurt, E.C. & Simos, G. (2001) The intracellular location of two aminoacyl‐tRNA synthetases depends on complex formation with Arc1p. The EMBO Journal, 20, 6889–6898. [DOI] [PMC free article] [PubMed] [Google Scholar]
- Gao, C.F. , Wang, Y. , Shen, Y. , Yan, D. , He, X. , Dai, J.B. et al. (2014) Oil accumulation mechanisms of the oleaginous microalga Chlorella protothecoides revealed through its genome, transcriptomes, and proteomes. BMC Genomics, 15, 1–14. [DOI] [PMC free article] [PubMed] [Google Scholar]
- Grabherr, M.G. , Haas, B.J. , Yassour, M. , Levin, J.Z. , Thompson, D.A. , Amit, I. et al. (2011) Trinity: reconstructing a full‐length transcriptome without a genome from RNA‐Seq data. Nature Biotechnology, 29, 644. [DOI] [PMC free article] [PubMed] [Google Scholar]
- Gu, S. , Xiao, S.W. , Zheng, J.W. , Li, H.Y. , Liu, J.S. & Yang, W.D. (2019) ABC transporters in Prorocentrum lima and their expression under different environmental conditions including okadaic acid production. Marine Drugs, 17, 259. [DOI] [PMC free article] [PubMed] [Google Scholar]
- Ho, S.H. , Chen, W.M. & Chang, J.S. (2010) Scenedesmus obliquus CNW‐N as a potential candidate for CO2 mitigation and biodiesel production. Bioresource Technology, 101, 8725–8730. [DOI] [PubMed] [Google Scholar]
- Huang, B. , Shan, Y. , Yi, T. , Tang, T. , Wei, W. & Quinn, N.W. (2020) Study on high‐CO2 tolerant Scenedesmus sp. and its mechanism via comparative transcriptomic analysis. Journal of CO₂ Utilization, 42, 101331. [Google Scholar]
- Huang, J.J. , Xia, J. , Yang, Z. , Guan, F.F. , Cui, D. , Guan, G.H. et al. (2014) Improved production of a recombinant Rhizomucor miehei lipase expressed in Pichia pastoris and its application for conversion of microalgae oil to biodiesel. Biotechnology for Biofuels, 7, 1–11. [DOI] [PMC free article] [PubMed] [Google Scholar]
- Huang, Y. , Cheng, J. , Lu, H.X. , He, Y. , Zhou, J.H. & Cen, K.F. (2017) Transcriptome and key genes expression related to carbon fixation pathways in Chlorella PY‐ZU1 cells and their growth under high concentrations of CO2 . Biotechnology for Biofuels, 10, 1–10. [DOI] [PMC free article] [PubMed] [Google Scholar]
- Ji, M.‐K. , Yun, H.‐S. , Hwang, J.‐H. , Salama, E.‐S. , Jeon, B.‐H. & Choi, J. (2017) Effect of flue gas CO2 on the growth, carbohydrate and fatty acid composition of a green microalga Scenedesmus obliquus for biofuel production. Environmental Technology, 38, 2085–2092. [DOI] [PubMed] [Google Scholar]
- Lancien, M. , Lea, P.J. & Azevedo, R.A. (2007) Amino acid synthesis in plastids. In: The structure and function of plastids. New York City: Springer, pp. 355–385. [Google Scholar]
- Langmead, B. & Salzberg, S.L. (2012) Fast gapped‐read alignment with Bowtie 2. Nature Methods, 9, 357. [DOI] [PMC free article] [PubMed] [Google Scholar]
- Levasseur, M. , Thompson, P.A. & Harrison, P.J. (1993) Physiological acclimation of marine phytoplankton to different nitrogen sources 1. Journal of Phycology, 29, 587–595. [Google Scholar]
- Li, B. & Dewey, C.N. (2011) RSEM: accurate transcript quantification from RNA‐Seq data with or without a reference genome. BMC Bioinformatics, 12, 1–16. [DOI] [PMC free article] [PubMed] [Google Scholar]
- Li, J. , Pan, K.H. , Tang, X.X. , Li, Y. , Zhu, B.H. & Zhao, Y. (2021a) The molecular mechanisms of Chlorella sp. responding to high CO2: a study based on comparative transcriptome analysis between strains with high‐and low‐CO2 tolerance. Science of the Total Environment, 763, 144185. [DOI] [PubMed] [Google Scholar]
- Li, Y. , Zhen, Y. , Zhu, J.B. , Liu, Q. , Yu, Z.G. & Liu, D.Y. (2021b) Regulation of carbon assimilation in Skeletonema costatum under diel variations. Science of the Total Environment, 786, 147533. [Google Scholar]
- Liu, X. , Wang, K.J. , Wang, J.Y. , Zuo, J.N. , Peng, F. , Wu, J. et al. (2019) Carbon dioxide fixation coupled with ammonium uptake by immobilized Scenedesmus obliquus and its potential for protein production. Bioresource Technology, 289, 121685. [DOI] [PubMed] [Google Scholar]
- Liu, Z. , Zhang, F. & Chen, F. (2013) High throughput screening of CO2‐tolerating microalgae using GasPak bags. Aquatic Biosystems, 9, 23. [DOI] [PMC free article] [PubMed] [Google Scholar]
- Lunt, S.Y. & Vander Heiden, M.G. (2011) Aerobic glycolysis: meeting the metabolic requirements of cell proliferation. Annual Review of Cell and Developmental Biology, 27, 441–464. [DOI] [PubMed] [Google Scholar]
- Ma, S.S. , Li, D. , Yu, Y.L. , Li, D.L. , Yadav, R.S. & Feng, Y.J. (2019) Application of a microalga, Scenedesmus obliquus PF3, for the biological removal of nitric oxide (NO) and carbon dioxide. Environmental Pollution, 252, 344–351. [DOI] [PubMed] [Google Scholar]
- Meloche, S. & Pouysségur, J. (2007) The ERK1/2 mitogen‐activated protein kinase pathway as a master regulator of the G1‐to S‐phase transition. Oncogene, 26, 3227–3239. [DOI] [PubMed] [Google Scholar]
- Mijaljica, D. , Prescott, M. & Devenish, R.J. (2011) V‐ATPase engagement in autophagic processes. Autophagy, 7, 666–668. [DOI] [PubMed] [Google Scholar]
- Moghimifam, R. , Niknam, V. , Ebrahimzadeh, H. & Hejazi, M.A. (2019) The influence of different CO2 concentrations on the biochemical and molecular response of two isolates of Dunaliella sp. (ABRIINW‐CH2 and ABRIINW‐SH33). Journal of Applied Phycology, 32, 1–13. [Google Scholar]
- Moraes, L. , Santos, L.O. & Costa, J.A. (2020) Bioprocess strategies for enhancing biomolecules productivity in Chlorella fusca LEB 111 using CO2 a carbon source. Biotechnology Progress, 36, e2909. [DOI] [PubMed] [Google Scholar]
- O'Donoghue, P. & Luthey‐Schulten, Z. (2003) On the evolution of structure in aminoacyl‐tRNA synthetases. Microbiology and Molecular Biology Reviews, 67, 550–573. [DOI] [PMC free article] [PubMed] [Google Scholar]
- Ohlrogge, J.B. & Jaworski, J.G. (1997) Regulation of fatty acid synthesis. Annual Review of Plant Biology, 48, 109–136. [DOI] [PubMed] [Google Scholar]
- Patil, L. & Kaliwal, B. (2017) Effect of CO2 concentration on growth and biochemical composition of newly isolated indigenous microalga Scenedesmus bajacalifornicus BBKLP‐07. Applied Biochemistry and Biotechnology, 182, 335–348. [DOI] [PubMed] [Google Scholar]
- Peng, H.F. , Wei, D. , Chen, G. & Chen, F. (2016) Transcriptome analysis reveals global regulation in response to CO2 supplementation in oleaginous microalga Coccomyxa subellipsoidea C‐169. Biotechnology for Biofuels, 9, 1–17. [DOI] [PMC free article] [PubMed] [Google Scholar]
- Perzov, N. , Padler‐Karavani, V. , Nelson, H. & Nelson, N. (2001) Features of V‐ATPases that distinguish them from F‐ATPases. FEBS Letters, 504, 223–228. [DOI] [PubMed] [Google Scholar]
- Rau, G.H. (2011) CO2 mitigation via capture and chemical conversion in seawater. Environmental Science and Technology, 45, 1088–1092. [DOI] [PubMed] [Google Scholar]
- Rees, D.C. , Johnson, E. & Lewinson, O. (2009) ABC transporters: the power to change. Nature Reviews. Molecular Cell Biology, 10, 218–227. [DOI] [PMC free article] [PubMed] [Google Scholar]
- Rippka, R. , Deruelles, J. , Waterbury, J.B. , Herdman, M. & Stanier, R.Y. (1979) Generic assignments, strain histories and properties of pure cultures of cyanobacteria. Microbiology, 111, 1–61. [Google Scholar]
- Rodas‐Zuluaga, L.I. , Castañeda‐Hernández, L. , Castillo‐Vacas, E.I. , Gradiz‐Menjivar, A. , López‐Pacheco, I.Y. , Castillo‐Zacarías, C. et al. (2021) Bio‐capture and influence of CO2 on the growth rate and biomass composition of the microalgae Botryococcus braunii and Scenedesmus sp. Journal of CO₂ Utilization, 43, 101371. [Google Scholar]
- Ruban, A.V. (2015) Evolution under the sun: optimizing light harvesting in photosynthesis. Journal of Experimental Botany, 66, 7–23. [DOI] [PubMed] [Google Scholar]
- Sasaki, T. , Pronina, N.A. , Maeshima, M. , Iwasaki, I. , Kurano, N. & Miyachi, S. (1999) Development of vacuoles and vacuolar H+‐ATPase activity under extremely high CO2 conditions in Chiorococcum littorale cells. Plant Biology, 1, 68–75. [Google Scholar]
- Sheng, X. , Watanabe, A. , Li, A.J. , Kim, E. , Song, C.H. , Murata, K. et al. (2019) Structural insight into light harvesting for photosystem II in green algae. Nature Plants, 5, 1320–1330. [DOI] [PubMed] [Google Scholar]
- Sondergaard, T.E. , Schulz, A. & Palmgren, M.G. (2004) Energization of transport processes in plants. Roles of the plasma membrane H+‐ATPase. Plant Physiology, 136, 2475–2482. [DOI] [PMC free article] [PubMed] [Google Scholar]
- Song, C.F. , Hu, X.F. , Liu, Z.Z. , Li, S.H. & Kitamura, Y. (2020) Combination of brewery wastewater purification and CO2 fixation with potential value‐added ingredients production via different microalgae strains cultivation. Journal of Cleaner Production, 268, 122332. [Google Scholar]
- Storey, J.D. & Tibshirani, R. (2003) Statistical significance for genomewide studies. PNAS, 100, 9440–9445. [DOI] [PMC free article] [PubMed] [Google Scholar]
- Sun, Z.L. , Chen, Y.F. & Du, J.C. (2016) Elevated CO2 improves lipid accumulation by increasing carbon metabolism in Chlorella sorokiniana . Plant Biotechnology Journal, 14, 557–566. [DOI] [PMC free article] [PubMed] [Google Scholar]
- Tang, D.H. , Han, W. , Li, P.L. , Miao, X.L. & Zhong, J.J. (2011) CO2 biofixation and fatty acid composition of Scenedesmus obliquus and Chlorella pyrenoidosa in response to different CO2 levels. Bioresource Technology, 102, 3071–3076. [DOI] [PubMed] [Google Scholar]
- Thangaraj, S. & Sun, J. (2020) The biotechnological potential of the marine diatom Skeletonema dohrnii to the elevated temperature and pCO2 concentration. Marine Drugs, 18, 259. [DOI] [PMC free article] [PubMed] [Google Scholar]
- Toledo‐Cervantes, A. , Morales, T. , González, Á. , Muñoz, R. & Lebrero, R. (2018) Long‐term photosynthetic CO2 removal from biogas and flue‐gas: exploring the potential of closed photobioreactors for high‐value biomass production. Science of the Total Environment, 640, 1272–1278. [DOI] [PubMed] [Google Scholar]
- Vega, J.M. (2018) Nitrogen and sulfur metabolism in microalgae and plants: 50 years of research. Prog Bot, 81, 1–40. [Google Scholar]
- Wang, B. , Li, Y.Q. , Wu, N. & Lan, C.Q. (2008) CO2 bio‐mitigation using microalgae. Applied Microbiology, 79, 707–718. [DOI] [PubMed] [Google Scholar]
- Wilkinson, M.G. & Millar, J.B. (2000) Control of the eukaryotic cell cycle by MAP kinase signaling pathways. The FASEB Journal, 14, 2147–2157. [DOI] [PubMed] [Google Scholar]
- Xiong, G. , Yu, B. , Dong, J. , Shi, Y. , Zhao, B. & He, L.N. (2017) Cluster‐based MOFs with accelerated chemical conversion of CO2 through C‐C bond formation. Chemical Communications, 53, 6013–6016. [DOI] [PubMed] [Google Scholar]
- Yang, J. , Zhang, C.Y. & Hu, H.H. (2020) Screening high CO2‐tolerant oleaginous microalgae from genera Desmodesmus and Scenedesmus . Applied Biochemistry, 192, 211–229. [DOI] [PubMed] [Google Scholar]
- Zaher, H.S. & Green, R. (2009) Fidelity at the molecular level: lessons from protein synthesis. Cell, 136, 746–762. [DOI] [PMC free article] [PubMed] [Google Scholar]
- Zhang, M. , Zhen, Y. , Mi, T.Z. & Lin, S.J. (2021) Integrated Transcriptome Sequencing (RNA‐seq) and proteomic studies reveal resource reallocation towards energy metabolism and Defense in Skeletonema marinoi in response to CO2 increase. American Society for Microbiology, 87, e02614‐02620. [DOI] [PMC free article] [PubMed] [Google Scholar]
- Zhang, S.Z. , Xu, R.R. , Luo, X.C. , Jiang, Z.S. & Shu, H.R. (2013) Genome‐wide identification and expression analysis of MAPK and MAPKK gene family in Malus domestica . Gene, 531, 377–387. [DOI] [PubMed] [Google Scholar]
Associated Data
This section collects any data citations, data availability statements, or supplementary materials included in this article.
Supplementary Materials
Figure S1.
Appendix S1.
Data Availability Statement
The data is avaliable on NCBI now. Here is the link: https://www.ncbi.nlm.nih.gov/bioproject/PRJNA750395/