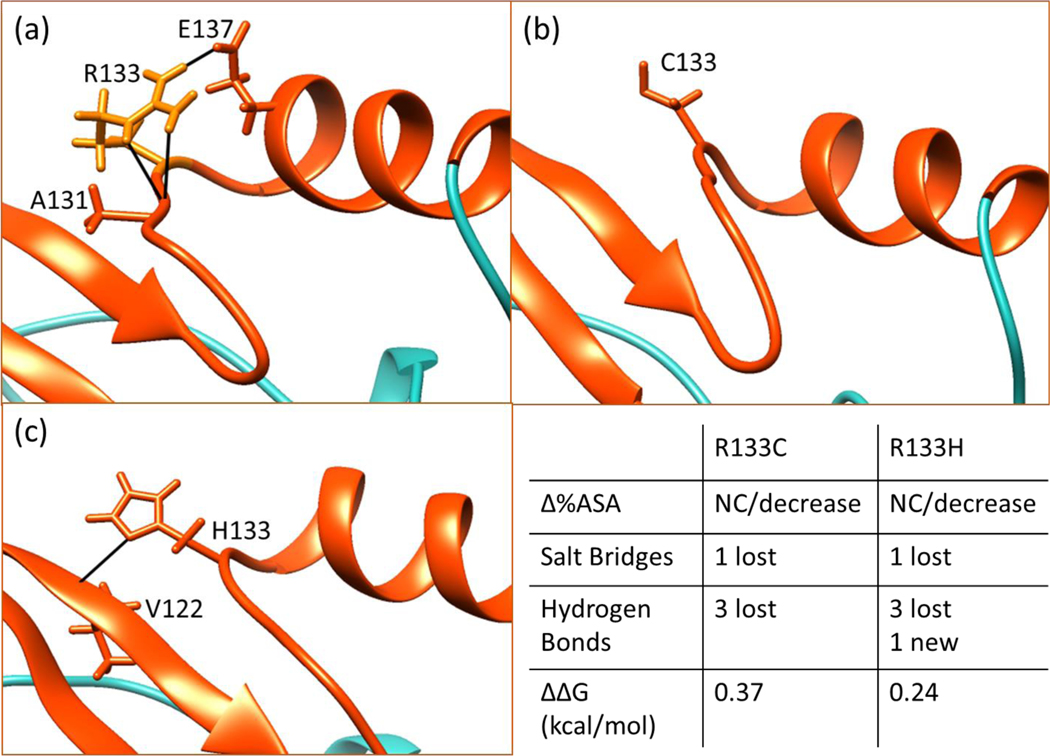
Figure 6.
Hydrogen bonding network of position 133 in WT (a), R133C (b) and R133H (c). The summary of changes in structure and folding free energy caused by these mutations are given in the bottom right panel. The C-terminal loop is shown in turquoise color for clarity and other parts are in orange/red in Figures 6 through 9. Also, the structures shown in Figures 6–9 are minimized wild-type NMR structures and minimized mutant structures obtained by in silico mutating the NMR structure. The ΔΔG values shown in Figures 6 and 7 are from CD experiments.

