

Abstract
Beyond reduced audibility, there is convincing evidence that the auditory system adapts according to the principles of homeostatic plasticity in response to a hearing loss. Such compensatory changes include modulation of central auditory gain mechanisms. Earplugging is a common experimental method that has been used to introduce a temporary, reversible hearing loss that induces changes consistent with central gain modulation. In the present study, young, normal-hearing adult participants wore a unilateral earplug for two weeks, during which we measured changes in the acoustic reflex threshold (ART), loudness perception, and cortically-evoked (40 Hz) auditory steady-state response (ASSR) to assess potential modulation in central gain with reduced peripheral input. The ART decreased on average by 8 to 10 dB during the treatment period, with modest increases in loudness perception after one week but not after two weeks of earplug use. Significant changes in both the magnitude and hemispheric laterality of source-localized cortical ASSR measures revealed asymmetrical changes in stimulus-driven cortical activity over time. The ART results following unilateral earplugging are consistent with the literature and suggest that homeostatic plasticity is evident in the brainstem. The novel findings from the cortical ASSR in the present study indicates that reduced peripheral input induces adaptive homeostatic plasticity reflected as both an increase in central gain in the auditory brainstem and reduced cortical activity ipsilateral to the deprived ear. Both the ART and the novel use of the 40-Hz ASSR provide sensitive measures of central gain modulation in the brainstem and cortex of young, normal hearing listeners, and thus may be useful in future studies with other clinical populations.
Keywords: Auditory deprivation, central gain, acoustic reflex threshold, auditory steady state response, loudness perception, Contour test
1. Introduction
The auditory system, like other sensory systems, has an intrinsic ability to adapt to changes in peripheral input. Adaptation to changes in acoustic input is reflective of central auditory system homeostatic plasticity and has been studied in the context of such processes as loudness perception and intensity discrimination (McKinney et al., 1999; Munro, 2008; Munro and Trotter, 2006; Olsen et al., 1999; Philibert et al., 2002; Robinson and Gatehouse, 1995). While central auditory plasticity ideally functions to maintain stable auditory perception, it also may lead to undesirable consequences. For instance, auditory disorders such as tinnitus (phantom sound perceptions, in the absence of an external source of sound) and hyperacusis (abnormal loudness growth and suprathreshold sound sensitivity) have been associated with maladaptive processes in the central auditory pathway, often following a hearing loss (Gu et al., 2010; Noreña, 2011; Noreña and Farley, 2013; Schaette and Kempter, 2009, 2006; Schaette and McAlpine, 2011). An understanding of the adaptive and maladaptive mechanisms associated with plasticity will help improve auditory models that incorporate plasticity effects, shape perspectives on targeted therapies for management of disorders like tinnitus and hyperacusis, and inform clinical guidelines regarding the timeline and expectations for rehabilitation.
A common approach to simulate the sound deprivation effects of peripheral hearing loss in humans has been the use of short term, continuous attenuation through earplugging. Earplugging introduces a temporary, reversible hearing loss and has been useful for investigating subsequent changes in auditory perception and processing in the central auditory pathway (Brotherton et al., 2017, 2016; Formby et al., 2003, 2007; Maslin et al., 2013; Munro and Blount, 2009; Munro et al., 2014). Formby et al. (2003) demonstrated the effects of acoustic attenuation via bilateral earplugging based on changes in categorical loudness judgements as assessed by the Contour Test of Loudness Perception (Contour test; Cox et al., 1997). The Contour test involves presentation of pulsed warble tones ascending in level to a listener who judges the loudness of the tones by reporting one of seven numerical values corresponding to a continuum of categories from “Very soft” through “Uncomfortably loud.” After two weeks of continuous acoustic attenuation from wearing bilateral earplugs, subjects rated the same sounds as being louder than before earplug use. Formby et al. (2003) reported that study participants matched their pre-treatment loudness category ratings at sound levels 5 to 9 dB lower for the higher loudness categories (i.e., Categories 4 to 7), indicating that continuous partial deprivation of acoustic input led to a progressive increase in loudness perception over time, ostensibly attributed to central auditory plasticity or gain. Formby et al. (2007) subsequently replicated their findings in a second study in which participants wore earplugs bilaterally for a 4-week treatment period. Munro et al. (2014), using unilateral earplugging for 1 week, demonstrated a similar reduction in loudness perception in the plugged ear of 5 dB for low (500 Hz) and 8 dB for high (2000 Hz) frequency warble tones.
Central auditory plasticity associated with the adaptation to acoustic attenuation is consistent with homeostatic plasticity; a process thought to regulate the functional stability of neural activity in response to a persistent alteration in auditory input. Homeostatic mechanisms have been demonstrated in vitro as a selective strengthening and weakening of synapses that serve to stabilize neuronal activity while maintaining neural network selectivity (Turrigiano, 1999, 2012). Homeostatic plasticity in the intact brain is not likely due to a simple synaptic mechanism but rather a complex interaction among multiple forms of excitatory, inhibitory, and intrinsic plasticity that operate at multiple neuronal levels and on different temporal and spatial scales to ensure compensatory balance across neural circuits (Turrigiano, 2012). The functional consequence of homeostatic plasticity is a change (increase or decrease) in the potentiation of neural activity in the central pathway, referred to as “central gain,” and often described as “an internal volume control” (e.g., Brotherton et al., 2015). Physiological evidence of central gain modulation in the auditory system has been shown in animal models following cochlear damage as increased spontaneous activity in the cochlear nucleus and inferior colliculus (e.g., Kaltenbach et al., 2002; Manzoor et al., 2013), and auditory cortex (e.g., Noreña and Eggermont, 2003), and as enhanced stimulus-driven activity in the central pathway and cortex (e.g., Chambers et al., 2016; Hickox and Liberman, 2014; Salvi et al., 2000). While an internal volume control seems appealing in the case of hearing loss, excessive central gain of spontaneous activity, as well as potential contributions from stochastic resonance, may partially explain the perception of tinnitus (Hébert et al., 2013; Noreña, 2011; Noreña and Farley, 2013; Schaette and Kempter, 2008, 2006; Schaette and McAlpine, 2011; Schilling et al., 2021) and reduced sound tolerance in the case of hyperacusis (Gu et al., 2010; Knudson et al., 2014; Noreña and Farley, 2013). Though there is ample evidence of such gain processes in animal models, there is less understanding about the nature and extent of such a self-regulating gain mechanism in the human central auditory system. While some studies indicate that multiple gain mechanisms may be at work in the human auditory pathway (Maslin et al., 2013a, 2013b; Munro et al., 2014; Parry et al., 2019), it is not clear to what extent each mechanism contributes to the purported gain control following acoustic deprivation. The present study was motivated by these yet unanswered questions as well as the need for identifying reliable measures of central auditory gain modulation for future clinical application.
1.1. Evidence of central gain in the auditory brainstem
Although the adaptive plasticity of behavioral loudness judgments in response to earplugging is likely dependent on higher level (i.e., cortical) gain processes within the auditory system, subcortical evidence of gain-related plasticity has been demonstrated in the brainstem following earplugging. In rats, Clarkson et al. (2016) showed that unilateral earplugging for 10 days lead to poorer ABR thresholds but increased relative gain in the cochlear nucleus and lateral lemniscus, as demonstrated by increased ABR amplitude ratios for waves II/I and IV/I. Notably, following earplug removal and 10-days of recovery, the gain increase persisted in the lateral lemniscus but returned to baseline in the cochlear nucleus. In humans, the acoustic reflex threshold (ART) has been used to document changes in brainstem neural function following auditory attenuation via unilateral earplugs (Brotherton et al., 2017, 2016; Maslin et al., 2013; Munro and Blount, 2009; Munro et al., 2014) as well as following auditory enhancement with monaural amplification (Munro et al., 2007; Munro and Merrett, 2013). The acoustic reflex engages a brainstem pathway that includes ipsilateral and contralateral brainstem nuclei (i.e., CN, SOC) and terminates with bilateral contraction of the stapedius muscle in the middle ear (Borg, 1973; Pascal et al., 1998). Activation of this reflex pathway is measured with an ear canal probe system that detects a brief change in the admittance of the middle ear system and can be elicited with a range of stimuli (e.g., pure tones, broadband noise) and sound levels. The ART corresponds to the lowest sound pressure level that elicits a reliable reflex. The earplugging studies have shown that prolonged acoustic attenuation leads to a decrease in the minimum sound pressure level required to elicit the ART relative to baseline measurements (Brotherton et al., 2017, 2016; Maslin et al., 2013; Munro and Blount, 2009), consistent with an increase in central gain. Conversely, enhanced auditory input via short-term and long-term experience with monaural amplification results in an increase in the ART (Munro et al., 2007; Munro and Merrett, 2013), consistent with reduced central gain. While these changes in ART suggest that central gain changes are detectable at an early processing stage in the auditory pathway, it has not been clearly established in humans whether these effects are maintained or further modulated at higher (i.e., cortical) levels of auditory processing in the same individuals (e.g., Maslin et al., 2013b).
1.2. Evidence of central gain in the auditory cortex
Investigations in animal models have shown that reduced peripheral input due to permanent conductive hearing loss can disrupt cortical function (Xu et al., 2007) without altering brainstem function (Yao & Sanes, 2018). Human subjects with permanent unilateral conductive hearing loss, on the other hand, have shown increased cortical activity (Parry et al., 2019) but reduced or altered hemispheric asymmetry (Maslin et al., 2013a). Moreover, human subjects with temporary, reversible conductive hearing loss from earplugging have shown no change in cortical measures with functional magnetic resonance imaging (fMRI) following treatment (Maslin et al., 2013b). Thus, the cortical effects of peripheral deprivation on central gain modulation in the cortex, in auditory systems with otherwise normal cochlear function, is less than clear, and may be due to differences in measures used to quantify central gain changes across studies.
Some evidence of cortically-mediated gain may be gleaned from changes in auditory middle latency responses (MLRs), reflecting contributions from thalamocortical sources (Musiek and Nagle, 2018), that were measured pre- and post-treatment for mildly hyperacusic hearing-impaired persons using bilateral sound generators over several months (Formby et al., 2017c). In this study, participants simultaneously achieved significant incremental changes in their loudness judgements over the treatment period as well as improvements in MLR latency measures. These promising but limited findings suggest the possibility of identifying neural correlates of central-gain mediated loudness growth in the cortex.
Electrophysiological evaluation of loudness growth in humans has also been investigated using the auditory steady-state response (ASSR), also known as the envelope-following response (EFR). The ASSR has been proposed as a physiological measure that parallels loudness growth (Kubota et al., 2019; Ménard et al., 2008; Van Eeckhoutte et al., 2018a, 2018b, 2016). The ASSR is phase-locked to the envelope periodicity of a modulated tone or noise and can be measured with standard clinical instrumentation with as few as three electrodes or with multi-channel electroencephalography (EEG) systems (Picton et al., 2005, 2003). Clinically, the 80-Hz ASSR has been used to assess brainstem processing as a steady-state alternative to the traditional transient-evoked auditory brainstem response (ABR); however, the utility of this response is manifold. For example, the 80-Hz ASSR has been shown to be a viable method for indexing loudness recruitment resulting from cochlear hearing loss at the level of the brainstem (Kubota et al., 2019) and for indexing loudness perception at higher levels of the auditory system. Ménard et al. (2008) showed that in normal-hearing listeners (i.e., without loudness recruitment) there was a higher correlation between 80-Hz ASSR amplitude growth and behaviorally obtained loudness growth functions than between ASSR amplitude growth and stimulus intensity growth functions. Van Eeckhoutte et al. (2016) also showed that 40-Hz ASSR magnitude growth functions and loudness growth functions were almost identical in shape for normal-hearing and hearing-impaired subjects and that ASSR amplitudes were a good predictor of behavioral loudness scaling results, especially for hearing-impaired subjects. Additionally, the utility of the ASSR has been demonstrated in the animal literature as a potential tool for investigating central gain-related changes in the context of aging and hearing loss in rats. Lai et al. (2017) reported enhanced EFR amplitudes in aged animals (16 to 90 Hz modulation rates) and attributed the increase to a compensatory increase in central gain. Given the results from these studies, the ASSR may be a useful, objective tool for investigating central gain-related changes following both acoustic attenuation and enhancement.
1.3. Neural generators of the ASSR
Neural generators of the ASSR are known to exist throughout the auditory pathway; however, contributions from dominant sources can vary depending on the stimulus modulation rate, such that higher modulation rates (e.g., 80 Hz) are thought to reflect dominant activity in the brainstem, whereas slower modulation rates (e.g., 40 Hz) reflect dominant contributions from cortical sources within and beyond the auditory cortex (AC; Herdman et al., 2002; Picton et al., 2003; Luke et al., 2017; Farahani et al., 2017, 2019). As such, the cortically-evoked 40-Hz ASSR would be useful for investigating whether changes in peripheral input (e.g., sound attenuation or enhancement) might alter auditory processing at higher levels of the auditory system, and for further investigating changes in loudness perception that may result from changes in central gain (Formby et al., 2017a).
To identify specific cortical generators of the ASSR, a variety of imaging and source localization techniques have been used to evaluate cortical and subcortical contributions to the ASSR. Reyes et al. (2004) used positron emission tomography (PET) to demonstrate peak activation in the right and left primary auditory cortices, the left medial geniculate body, as well as the right middle frontal gyrus in response to a unilaterally presented (right ear) amplitude modulated (AM) tone. Both EEG and magnetoencephalography (MEG) studies of the ASSR also have demonstrated contributions from the left and right primary and secondary auditory cortices and some non-primary cortical sources (Farahani et al., 2019, 2017; Gutschalk et al., 1999; Herdman et al., 2002; Luke et al., 2017; Pantev et al., 1996; Roß et al., 2005). Luke et al. (2017) used EEG to investigate source localization of the ASSR for acoustic and electric (i.e., cochlear implant) hearing and showed a complex pattern of hemispheric laterality that depended on both modulation rate and ear of stimulation. Specifically, for those with acoustic hearing, a right hemisphere dominance was observed for 40-Hz modulation rates regardless of whether the stimulus was presented monaurally to either ear or diotically to both ears. For those with electric hearing, the hemisphere contralateral to the implanted ear was preferentially activated. Similarly, investigations of permanent unilateral hearing loss have shown hemispheric differences in the distribution of cortical activity depending on the ear of stimulation (Han et al., 2021). If the ASSR is to serve as an index of cortical change in central gain following changes in peripheral input, it is important to evaluate contributions from both right and left hemispheres, especially if the experimental paradigms induce differences across ears.
1.4. Study Objectives
The present study was designed to investigate effects of short-term, unilateral auditory deprivation via earplugging on central gain changes across the auditory system using both subjective and objective outcome measures. The test battery reflects a combination of outcome measures (Contour test, ARTs) previously used to index auditory changes over time following different acoustic treatments, as well as an electrophysiological correlate of central gain (ASSR). To our knowledge, the latter has not been investigated following continuous acoustic attenuation in humans. If changes are observed in the cortically-evoked ASSR following earplugging, then both the ART and ASSR will inform current perspectives on central gain modulation in the auditory pathway from brainstem to cortex.
Here, we hypothesize that unilateral earplugging increases central gain, resulting in a reduction in the ART in the plugged ear following unilateral auditory attenuation, consistent with previous literature (Brotherton et al., 2019, 2017, 2016; Munro et al., 2014). We also hypothesize that unilateral earplugging modulates central gain in the cortex as reflected in altered loudness judgements and cortically-evoked ASSR measures. It is unknown whether central gain changes in the ART brainstem measures will be mirrored in the cortical ASSR measures or if more complex patterns will emerge. To examine potential effects across the entire system, it is of interest to investigate changes in both the plugged ear and not-plugged ear to determine possible cross-ear effects, as has been reported by Munro et al. (2009, 2014), as well as potential hemispheric asymmetries (e.g., Han et al., 2021; Maslin et al., 2013a; Xie et al., 2019).
2. Methods
2.1. Participants
A total of 12 normal-hearing participants were enrolled (11 females, 1 male; median 21.4 years, range 20–35 years). Each participant underwent a standard intake protocol including pure tone air- and bone-conduction audiometry, immittance testing (tympanometry, ARTs), and speech-in-noise testing using the Hearing-In-Noise Test (HINT). Normal hearing sensitivity was defined as pure-tone thresholds <25 dB HL at octave frequencies from 250 Hz to 8000 Hz, bilaterally, with no asymmetry between ears that exceeds 10 dB at any frequency (see Figure 1). Additionally, cognitive function was screened using the Montreal Cognitive Assessment (MoCA; Nasreddine et al., 2005). All participants denied any consistent use of earplugs. Participants were compensated monetarily for their time. Unless otherwise stated, data from 12 participants were included in the analysis for the measures obtained. All procedures were approved by the University of South Florida Institutional Review Board.
Figure 1:

Average audiometric profile of participants (n=12). Error bars indicate ±1 standard deviation.
Previous literature (e.g., Edgar et al., 2014), as well as unpublished pilot data from our lab, indicate that the cortical ASSR in response to monaural stimulus delivery is processed differently in the right and left hemispheres; therefore, to control for potential ear effects on cortical function, the plugged ear was fixed for all participants. The left ear was chosen for plugging based on the predominant right-hemisphere laterality of the ASSR (Luke et al., 2017; Roß et al., 2005, 2000). Participants wore a single silicone earplug (Mack’s Pillow Soft silicone putty earplug) in the left ear. During the first visit, each participant was trained on the proper earplug insertion technique and demonstrated the ability to place the earplug correctly in the ear. After the participant demonstrated proper insertion technique, probe-microphone attenuation measurements were recorded. The sound attenuation produced by the earplug was measured using a commercial probe-microphone system (Audioscan Verifit 2). A probe tube connected to the measuring microphone was inserted into the unoccluded left ear canal to a standard insertion depth of 28 mm. The real-ear unaided response (REUR) was recorded using pink noise presented at 65 dB SPL from the system loudspeaker placed ~18 inches in front (0 degrees azimuth) of the participant. The experimenter then held the probe in place while the participant was instructed to insert the earplug according to the training. After the earplug was in place, the real-ear occluded response (REOR) was recorded. Attenuation from the earplug was measured as the difference between the REOR and the REUR. Proper earplug insertion technique was ensured by repeating this procedure three to five times, or until measurements were repeatable within ±3 dB at 500 Hz and 3000 Hz. Participants were instructed to wear the earplug for 23 hours/day, with one hour provided for bathing and to allow for the ear canal to dry before reinsertion. Participants were provided with a record sheet to track the time of day that the earplug was removed and when it was reinserted, providing a reminder to consistently wear the earplug as directed. Participants wore the earplug for a total duration of two weeks. Brotherton et al. (2017) reported measurable changes in ARTs within the first 4 days of earplug use, and therefore two weeks were judged to be more than sufficient to document changes in central gain. Additionally, earplug attenuation was measured on the participant’s last visit to provide a final record of the attenuation achieved during the study. During these measurements, the participants were not coached or guided on earplug insertion. Using the methods described previously, three consecutive earplug insertions and probe-microphone measurements were taken for each participant.
2.2. Testing Schedule for Recurrent Measures
Recurrent test measures were obtained at four time points over the duration of the study. Baseline measures were obtained prior to treatment on Day 0 (the day of the earplug fitting) and repeated at each subsequent test session at Week 1 and Week 2. After the Week 2 visit and following the two weeks of continuous earplug use between Day 0 and Week 2, participants terminated the use of the earplug. They returned for a final appointment at Week 4, following two weeks of no earplug use. One participant did not complete Week 1 testing due to illness and thus has missing data for this one visit, but all other data from this participant were included in the analyses. The testing order (ART, Contour, ASSR, audiometry) was consistent for each participant; however, individual conditions and initial test ear for each participant were randomized for each test across visits. Each visit was approximately 2.5 hours in duration, including breaks, and participants were instructed to reinsert the earplug during any breaks in testing.
2.2.1. Acoustic Reflex Thresholds (ARTs)
Participants were seated in a sound-attenuating booth for all test measures. Previous research has shown that changes in reflex thresholds start to return to baseline values as soon as several hours following earplug removal (Brotherton et al., 2017); therefore, we streamlined each test session to complete all measures as efficiently as possible. Immittance measures were performed with a GSI Tympstar Pro using a standard 226-Hz probe tone. Tympanometry was performed prior to measuring the ARTs to ensure consistent middle ear function and to obtain the Equivalent Ear Canal Volume (ECV) and static tympanometric peak pressure (TPP). ARTs were measured at the TPP on the day of testing. While broadband noise (BBN) stimuli may elicit ARTs at lower sound pressure levels than with tones (Dallos, 1964; Gelfand and Piper, 1984), BBN stimuli also can become quite loud as the presentation level is increased. As an alternative, a high-band noise (HBN; 1600 to 4000 Hz) was used as the eliciting stimulus in the present study. This choice of stimulus was based on evidence that frequency specificity of the HBN is more closely aligned with the frequencies attenuated by the earplug, while still producing lower ARTs over tones. The ART was defined as the minimum sound pressure level required to activate the acoustic reflex with a criterion change in admittance of at least a 0.015 mmho (also specified as equivalent ml or cm3). Stimuli were 1s fixed-duration pulse trains and were presented at an initial level of 60 dB HL. The stimulus level was increased in 5-dB steps until a reflex was determined. The stimulus level then was increased by 5 dB to confirm reflex growth. This step estimated the expected range of the acoustic reflex and expedited the measurement process, which is important following earplug removal. The stimulus level then was decreased by 10 dB and subsequently increased in 1-dB steps until a reflex was obtained. The acoustic reflex was confirmed by a present and consistent change in admittance on two out of three repetitions. The stimulus was then increased by 1 to 2 dB to confirm reflex growth. Given that all participants wore an earplug in the left ear, the researcher measuring the reflex thresholds was not blinded to plugged ear, which may introduce possible bias in the measures.
2.2.2. Loudness Perception
To quantify potential changes in loudness perception following treatment, categorical loudness judgments were obtained following the Contour test protocol outlined by Cox et al. (1997). The Contour test was administered prior to treatment on Day 0, and then at each test session during the treatment, and then two weeks following termination of earplug use. Stimuli were pulse trains of four, 250-ms, 3000 Hz warble (6% amplitude modulated) tones. Stimulus timing was verified using a Tektronix 2012C digital storage oscilloscope and was comparable to pulsed warble tone stimuli produced by a GSI 61 audiometer. All stimuli were generated digitally in MATLAB, converted to analog signals using a TDT RZ6 (Tucker-Davis Technologies), and routed to circumaural headphones (RadioEar DD450) via TDT headphone buffers (HB6 or HB7). Stimuli were calibrated in dBA using a Larson-Davis 831 sound level meter with a ½” pressure microphone (B&K 4143) mounted in a 6-cc flat-plate coupler. Stimuli were presented in ascending order starting at 5 dB above the participant’s thresholds at the test frequency and increased in 5-dB steps. After each stimulus presentation, participants were instructed to assign one of seven loudness categories to the stimulus intensity via verbal response, ranging from “Very Soft” (1) to “Uncomfortably Loud” (7). After rating a single presentation judged to be a 7 (“Uncomfortably Loud”), the intensity reset to the starting intensity and the participant repeated the Contour test two additional times. The sound level (in dB HL) for a given response category was taken as the median value of levels assigned to each category.
2.2.3. Auditory Steady State Response (ASSR)
EEG data were recorded using a high-speed amplifier, eego™ software (Advanced Neuro-Technology - ANT), and an active-shield, Waveguard™ cap with 64 sintered Ag/AgCl electrodes (International 10–20 electrode system). The impedance at each of the 64 electrode sites was maintained at 10 kOhm or lower during recording. Additional bipolar electrodes were placed on the outer canthus of both eyes and above and below the left eye to monitor eye movements. Data were collected and digitized at a rate of 4000 Hz. The carrier stimulus for the ASSR was a continuous 3000-Hz pure tone, sinusoidally amplitude-modulated at a rate of 39.9 Hz (hereafter referred to as “40-Hz”), which maximized activation of generator sites within the cortex. The level of the ASSR stimulus was set individually for each participant based on their Contour test results on Day 0 for Category 6. Category 6 is defined perceptually as “loud, but OK.” The mean level of Category 6 for the right and left ears across all participants was 87.25 dB HL (± 12 dB). The level for each ear of each individual was converted to dB SPL, and those levels were used for each subsequent test session. The ASSR stimuli were generated digitally in MATLAB, converted to analog signals (TDT RZ6), and routed to circumaural headphones (RadioEar DD450) via headphone buffers (TDT HB6 or HB7). Stimuli were calibrated using a Larson-Davis 831 sound level meter with a ½” pressure microphone (B&K 4143) mounted in a 6-cc flat-plate coupler. The amplitude-modulated tone was presented monaurally to each ear continuously for 5 minutes while the participant watched a close-captioned video on a monitor positioned in front of the participant. Presentation order for each ear (e.g., right, or left ear first) was counter balanced across participants and visits.
The EEG data were processed offline using Brainstorm (Tadel et al., 2011) software executed in the MATLAB environment. Raw EEG data were preprocessed by notch-filtering (60 Hz) and band-passed filtering (0.1 Hz to 100 Hz). To reduce artifact components, vertical and horizontal eye movements and other movement artifacts were analyzed using the signal space projection (SSP; Uusitalo and Ilmoniemi, 1997) implemented in Brainstorm. Data were also visually inspected for artifacts not identified through previous steps. The responses were then re-referenced to the average of all electrodes. The preprocessed data were epoched in 1-sec intervals (300 epochs/condition), baseline corrected, and averaged across epochs for analysis at the sensor level. Additional source localization analyses were completed in Brainstorm using dynamic statistical parametric mapping (dSPM; Dale et al., 2000), a method that provides normalized responses for comparison across individuals and has been shown to localize deeper sources within the cortex (Stropahl et al., 2018) than some other methods (e.g., sLORETA - low low-resolution electromagnetic tomography; MNLS - minimum norm least squares; Bradley et al., 2016). Head model estimates for source localization were computed using OpenMEEG (Gramfort et al., 2010; Kybic et al., 2005), an open-source platform that employs a symmetric boundary element method (BEM) to generate a head model with three realistic layers representing the scalp, inner skull and outer skull. EEG time waveforms for both sensor and source levels were analyzed using the fast Fourier transform (FFT) magnitude spectrum. The ASSR magnitude was computed as the signal-to-noise ratio (SNR) with the signal magnitude at the modulation frequency divided by the root mean square (rms) of the magnitudes ± 5 Hz on either side of the modulation frequency. Representative grand average sensor FFTs for all 64 electrodes across all participants at baseline (Day 0) are shown in Figure 2 (panel A).
Figure 2:

Representative grand average sensor FFT for 64-electrodes (panel A) across participants; Representative grand average (FFT) of source localized data in eight auditory regions of interest (panel B) across participants.
The source-localized data were analyzed for four auditory regions-of-interest (ROIs) in each hemisphere determined from the Destrieux atlas (Destrieux et al., 2010). The ROIs included the transverse temporal gyrus (i.e., Heschl’s gyrus), lateral posterior superior temporal gyrus, planum temporale, and transverse temporal sulcus. FFTs were computed for the source data, with the response magnitudes at the modulation frequency analyzed relative to estimates of the noise floor in frequency bins ± 5 Hz around the modulation frequency. Representative grand average source FFTs for the designated ROIs from each hemisphere, averaged across all participants at baseline (Day 0), are shown in Figure 2 (panel B).
2.2.4. Audiometric Monitoring
To monitor for potential changes in audiometric thresholds during the study, an abbreviated set of pure-tone air conduction thresholds were measured (500, 1000, 2000, 3000, 4000, 6000 Hz) at the end of each session at Week 1 and Week 2. A complete audiogram (250 to 8000 Hz, octave and interoctave intervals) was completed on Day 0 and at the end of the Week 4 visit.
2.3. Statistical analysis
Data were inspected prior to analysis to ensure parametric methods were appropriate. Repeated-measures analysis of variance (ANOVA) procedures were used to evaluate changes in following measures: (1) ARTs between ears (plugged, not-plugged) and across time (Day 0, Week 1, Week 2, Week 4), (2) Contour Test between ears (plugged, not-plugged), loudness categories (7 levels), and across time (Day 0, Week 1, Week 2, Week 4); (3) ASSR between ears (plugged, not-plugged), hemispheres (right, left), and across time (Day 0, Week 1, Week 2, Week 4); and (4) pure-tone audiometry between ears (plugged, no-plugged), frequency (500, 1000, 2000, 4000, 6000 Hz), and across time (Day 0, Week 1, Week 2, Week 4). To test for significance, all analyses used an alpha value of p < 0.05 or lower, and when significant differences were observed, post-hoc analyses were completed using pairwise comparisons or paired t-tests with Bonferroni correction for multiple comparisons. When significant deviations from sphericity on Mauchly’s test were found (Greenhouse & Geiser, 1959), degrees of freedom were adjusted using the Greenhouse-Geisser correction. Such adjustments are noted in corresponding statistical tables. Statistical analyses for all data were performed using SPSS version 25.
3. Results
3.1. Attenuation measurements
Average attenuation values from earplug attenuation measurements during the first visit are shown in Figure 3, with the maximum attenuation (mean = −32.7 dB, ± 1.29 dB, SEM) observed at 3000 Hz. There is a possibility that the low-frequency attenuation (below 1000 Hz) is underestimated due to potential slit leaks caused by probe tube placement between the wall of the ear canal and the earplug. As noted above, participants consistently inserted the earplugs and achieved attenuation values of ± 3 dB at 500 and 3000 Hz.
Figure 3:

Average attenuation measurements from earplugs across all participants (n=12) measured at Day 0. A negative shift indicates a decrease in sound level measured with a probe tube located 3–5 mm from the eardrum. Error bars indicate ±1 SEM.
3.2. Acoustic Reflex Thresholds
Results for the ART measure time (visit) series are shown in Figure 4, with raw thresholds in dB HL (panel A) and the change from baseline data in dB (panel B). A clear reduction in ART is seen in the plugged-ear, evident at both Weeks 1 and 2, and a subsequent return to baseline ART two weeks after earplug removal. A small increase in the ART of the not-plugged ear occurred that was not significantly different than that at Day 0. As shown in Figure 4, panel B, there was an average decrease of 8 to 10 dB in the plugged ear, and a 1 to 3 dB increase in ARTs of the not-plugged ear.
Figure 4:
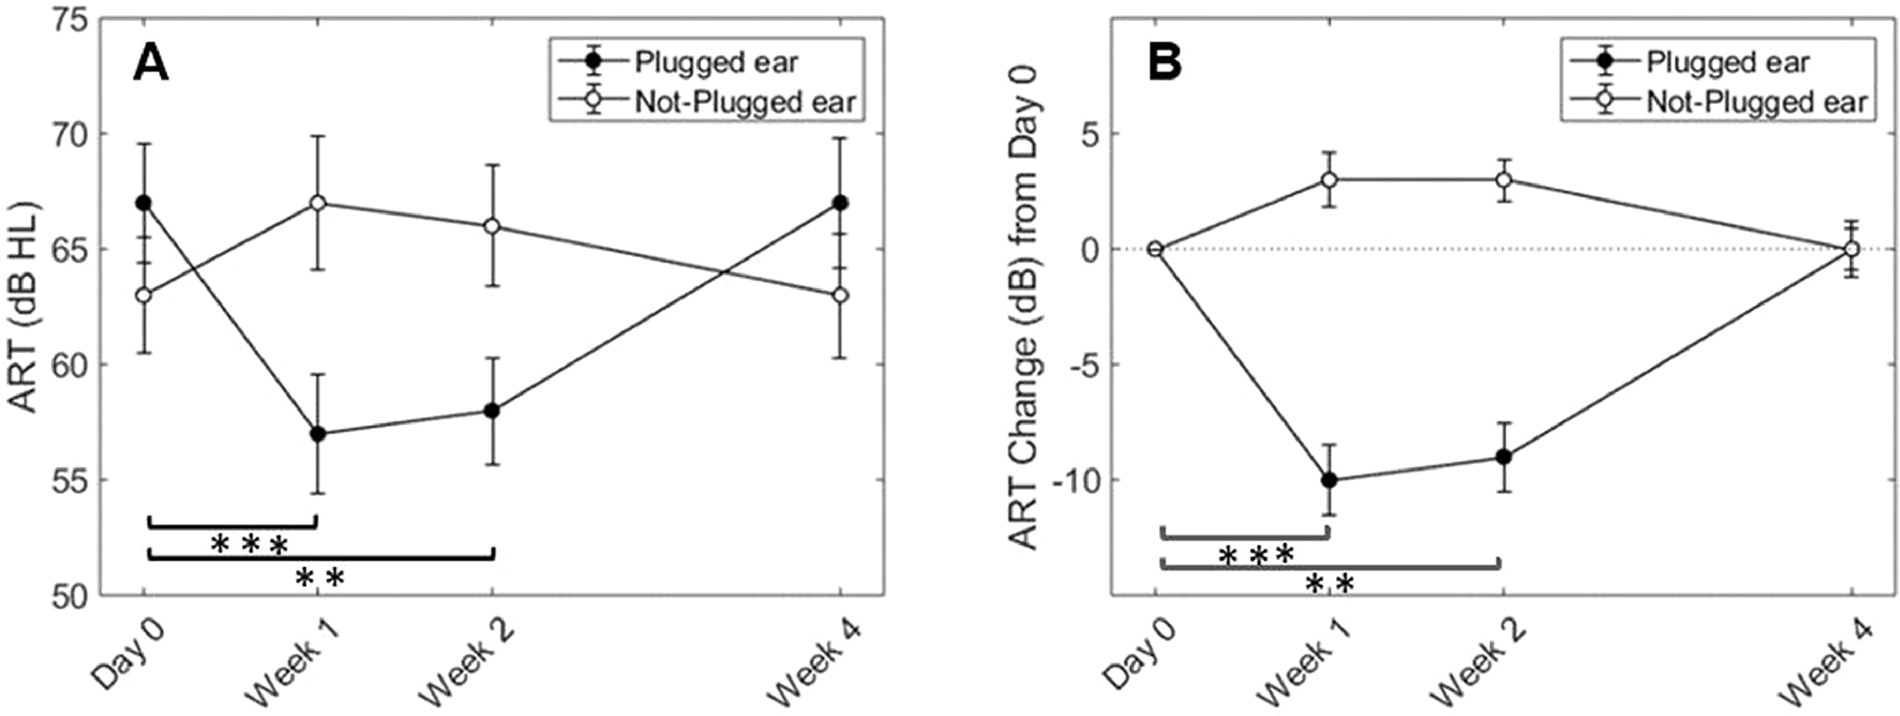
Average raw ARTs over time (panel A) and change in ARTs relative to baseline (panel B) for high-band noise. Open circles represent the not-plugged (right) ear and filled circles represent the plugged (left) ear. Error bars indicate ±1 SEM. Brackets and asterisks indicate significance of post hoc tests between Day 0 and Week 1 (p < 0.001***) and between Day 0 and Week 2 (p = 0.002**) in the plugged ear only.
Raw reflex threshold data were compared between ears (plugged and not-plugged) as well as over time within the same ear using a two-factor (earplug [2; right/left], test session [4; Day 0, Week 1, Week 2, Week 4]), repeated-measures ANOVA with Greenhouse-Geisser correction (see Table 1). As reported in Table 1, there was a significant main effect of test session, and a significant test session-by-ear interaction, and no significant effect of ear. To evaluate each ear independently, we completed two separate one-way ANOVAs and post-hoc pairwise comparisons with Bonferroni correction for multiple comparisons. In the plugged (left) ear, there was a significant main effect of test session (F3, 30 = 27.27, p < 0.001), with significant differences between the ARTs at Day 0 (baseline) and after 1 week (p < 0.001) and 2 weeks (p = 0.002) of earplug use, but no significant difference between Day 0 and Week 4 (p = 1.0). In the not-plugged (right) ear, there was a significant main effect of test session (F3, 30 = 4.30, p = 0.013) whereas none of the pairwise comparisons across test sessions were significant.
Table 1:
Statistical analysis (RMANOVA) results of acoustic reflex data
| FACTOR | df | F | p |
|---|---|---|---|
|
| |||
| EAR | 1,10 | 3.68 | 0.084 |
| SESSION | 3,30 | 6.59 | 0.001 |
| EAR*SESSION | 3,30 | 28.79 | < 0.001 |
| Plugged Ear (Left) | |||
| SESSION | 3,30 | 27.27 | < 0.001 |
| Not-Plugged Ear (Right) | |||
| SESSION | 3,30 | 4.30 | 0.013 |
The changes in ART over time are different and opposite for the plugged and not-plugged ears. The analyses by ear reported above indicated that the change in the not-plugged ear over time was not significant; however, the overall effect of earplugging may be better quantified by considering the combined changes of the two ears (e.g., Munro et al., 2014). This combined effect, or asymmetry, is captured by subtracting the ART of the plugged ear from the ART of the not-plugged ear, as shown in Figure 5. A one-factor repeated-measures ANOVA (time [4; Day 0, Week 1, Week 2, Week4]) yielded significant changes in asymmetry between the ears over time. There was a significant main effect of time (F3, 30 = 28.06, p < 0.001) indicating that the difference between ears changed across test session. Pairwise comparisons with Bonferroni correction yielded significant differences between Day 0 and Week 1 (p < 0.001), Day 0 and Week 2 (p = 0.001), Week 1 and Week 4 (p = 0.001), and between Week 2 and Week 4 (p = 0.001). Notably, the combined effect of unilateral earplugging across the two ears revealed a relative change in ART asymmetry of about 12 dB during treatment, such that the average asymmetry at Day 0 was −3.5 dB but then shifted to a maximum of about 8.5 dB at both Weeks 1 and 2, or a 12 dB shift over time. These data reflect a strong treatment-induced asymmetrical change in central gain at the level of the brainstem.
Figure 5:

Asymmetry in ARTs, calculated by subtracting the ART of the plugged ear (left) from the ART of the not-plugged ear (right). Error bars indicate ±1 standard error of the mean. Brackets and asterisks indicate significance of post hoc tests between Day 0 and Week 1 (p < 0.001***), and between Day 0 and Week 2, Week 1 and Week 4, and Week 2 and Week 4 (p = 0.001**).
3.3. Loudness Perception
Changes in loudness perception relative to baseline (Day 0), as measured with the Contour test following unilateral earplug use, are shown in Figure 6 with measures from the plugged ear shown in panel A and measures from the not-plugged ear shown in panel B. Following one week of earplug use, listeners required a less intense signal to obtain the pre-treatment loudness categories in the plugged ear, consistent with an increase in loudness perception and an increase in central gain. The magnitude of the change seen at Week 1 was generally small, ranging from 0 dB for Category 1, about 1 dB for Category 2, and on average between 3 to 5 dB for Categories 3 through 7. At Week 2, however, loudness returned close to baseline values for some categories (e.g., category 3, 4, 7), or showed a slight increase in level (i.e., decrease in loudness) relative to Day 0 (e.g., category 2, 5, 6). Similarly at Week 4, judgements were made on average at higher levels relative to Day 0, indicating decreased loudness perception. In general, judgments for the not-plugged ear showed an increase in the category level at Weeks 1, 2 and 4, such that participants required a more-intense signal to match pre-treatment loudness categories (see Figure 6).
Figure 6:

Change in Contour test ratings over time for the plugged (panel A) and the not-plugged ear (panel B). The changes in loudness ratings relative to Day 0 at Week 1, Week 2, Week 4 are indicated by closed circles, open circles, and triangles, respectively. Error bars indicate ±1 standard error of the mean. Bracket and asterisks indicate significance of post hoc tests between Week 1 and Week 4 (p = 0.005**),
Data from the Contour Test were analyzed for main effects using a three-factor, repeated-measures ANOVA (ear plug [2; right/left], test session [4; Day 0, Week 1, Week 2, Week 4], and loudness category [7; Very Soft, Soft, Comfortable, but slightly soft, Comfortable, Comfortable but slightly loud, Loud but OK, Uncomfortably loud]) with Greenhouse-Geisser correction applied as needed. The results of this analysis, reported in Table 2, showed significant main effects for ear, test session, and loudness category, as well as a significant ear by category interaction. These findings indicate that changes in loudness perception across categories were differentially affected by earplugging between the two ears and may have been driven by the changes seen at Week 1 in the plugged ear. No other significant interactions were identified.
Table 2:
Statistical analysis (RMANOVA) results for the Contour test
| FACTOR | df | F | p |
|---|---|---|---|
|
| |||
| EAR | 1,10 | 12.80 | 0.005 |
| SESSION | 3,30 | 3.74 | 0.021 |
| CATEGORY | 6,60 | 337.41 | <0.001 |
| EAR*SESSION A | 1.87,15.79 | 3.03 | 0.075 |
| EAR*CATEGORY | 6,60 | 4.97 | <0.001 |
| TIME*CATEGORY | 18,180 | 0.97 | 0.503 |
| EAR*TIME*CATEGORY | 18, 180 | 0.65 | 0.860 |
MAUCHLY’S TEST SIGNIFICANT; DEGREES OF FREEDOM ADJUSTED USING GREENHOUSE-GEISSER CORRECTION
To evaluate changes in loudness perception over time for each ear individually, a two-factor, repeated-measures ANOVA (test session [4; Day 0, Week 1, Week 2, Week 4] and loudness category [7; Very Soft, Soft, Comfortable, but slightly soft, Comfortable, Comfortable but slightly loud, Loud but OK, Uncomfortably loud]) was completed. As shown in Table 3, there were main effects for test session and loudness category for each ear but no significant interactions. For the plugged ear only, post-hoc pairwise comparisons with Bonferroni correction for multiple comparisons yielded a significant difference (p = 0.005) between Week 1 (during earplug use) and Week 4 (post earplug) test sessions. Pairwise comparisons with Bonferroni correction for the not-plugged ear were not significantly different between any test sessions. In summary, the Contour test revealed a modest increase in loudness sensitivity (i.e., increased central gain) in the plugged ear after one week, but after two weeks of earplug use, loudness judgments either returned to baseline or showed a slight decrease in loudness sensitivity for some categories when compared to pre-treatment loudness perception measures (see Figure 6). These results are consistent with an increase in central gain following one week of earplug use, but this increase was not sustained at subsequent test sessions.
Table 3:
Statistical analysis (RMANOVA) results by ear for Contour test
| FACTOR | df | F | p |
|---|---|---|---|
|
| |||
| Plugged Ear (left) | |||
| SESSION | 3,30 | 3.61 | 0.025 |
| CATEGORY | 6,60 | 339.88 | <0.001 |
| SESSION*CATEGORY | 18,180 | 0.96 | 0.509 |
| Not-Plugged Ear (right) | |||
| SESSION | 3,30 | 3.49 | 0.028 |
| CATEGORY | 6,60 | 312.21 | <0.001 |
| SESSION*CATEGORY | 18,180 | 0.651 | 0.855 |
3.4. Auditory Steady State Response (ASSR)
Analysis of the ASSR based on sensor-level data was completed by first clustering the data into left and right hemisphere electrode clusters, as illustrated in Figure 7 (panel A).
Figure 7:

Illustration of left hemisphere and right hemisphere electrode cluster groupings (panel A). Average sensor-based ASSR magnitudes from the left (blue) and right (red) hemisphere clusters when the stimulus was presented to the plugged ear (panel B) and not-plugged ear (panel C). Error bars indicate ±1 standard error of the mean.
To determine if there were differences between left and right cluster activity, a two-factor, repeated-measures ANOVA (test session [4; Day 0, Week 1, Week 2, Week 4], and cluster hemisphere [2; right/left]) was completed separately for stimulus presentation to each ear (plugged [left] and not-plugged [right]). Both analyses showed a modest but significant main effect of cluster hemisphere such that the magnitudes for the left hemisphere cluster were greater than right hemisphere for both the plugged (left) ear (F1,10 = 4.979, p = 0.05) and not-plugged (right) ear (F1,10 = 4.919, p = 0.05). Neither analysis, however, showed a significant effect of test session nor significant interactions (see Figure 7, panels B and C). Hence, the sensor ASSR data revealed essentially the same pattern over time with the largest magnitudes observed from left hemisphere electrode clusters regardless of stimulus presentation ear or test session.
Analysis of the source-localized ASSR data was completed based on magnitudes averaged across four auditory ROIs in each hemisphere (described in Section 2.2.3) for each participant and each test session. Grand average (across participants) ASSR source magnitudes for each hemisphere, separated by stimulus presentation ear (plugged, not-plugged), are shown in Figure 8.
Figure 8:

Average ASSR source-localized magnitudes in left (blue) and right (red) hemisphere sources (average of 4 auditory ROIs per hemisphere) obtained using source-localized EEG data with sound presented to the plugged ear (panel A) and not-plugged ear (panel B). Error bars indicate ±1 standard error of the mean. Brackets and asterisks indicate significant differences based on paired t-tests with Bonferroni correction (p < 0.05* and p < 0.01**).
Similar to the sensor analysis, a two-factor, repeated-measures ANOVA (test session [4; Day 0, Week 1, Week 2, Week 4], and hemisphere [2; right/left], collapsed across ROI) was conducted separately for each ear (plugged or not-plugged) with results reported in Table 4. There was a significant main effect of test session when stimulating either the left ear (F1.98,84.97 = 3.40, p = 0.039) or right ear (F1.98,84.97 = 3.40, p = 0.039), but there was no main effect of hemisphere when collapsed across test session and no significant interaction between hemisphere and test session when stimulating either ear. To further evaluate the effects of test session, paired t-tests with Bonferroni correction were computed for each ear separately to assess within and between hemisphere changes over time. Significant differences between test sessions and hemispheres are indicated by brackets and asterisks in Figure 8. Only the left hemisphere yielded significant changes in ASSR magnitude across test session (see Figure 8). That is, when stimulating the plugged (left) ear, relative to Day 0, there was a significant decrease in left hemisphere magnitudes at Week 1 (t[47] = 2.887; p = 0.003), Week 2 (t[47] = 2.887, p = 0.004), and Week 4 (t[47] =2.199, p = 0.016). In addition, significant differences between hemispheres were observed at Week 2 (t[47] = −2.488, p = 0.008). When stimulating the not-plugged (right) ear, significant differences also were observed in the left hemisphere between Day 0 and Week 1 (t[47] = 2.531, p = 0.008) and Week 4 (t[47] = 2.310, p = 0.013) but Week 2 (t[47] = 2.085, p = 0.021) failed to reach significance when applying Bonferroni correction. There also was a significant difference between hemispheres at Week 1 (t[47] = −2.509, p = 0.008). No significant changes were observed in right hemisphere activity over time when stimulating either ear.
Table 4:
Statistical analysis (RMANOVA) results of ASSR source magnitudes
| FACTOR | df | F | p |
|---|---|---|---|
|
| |||
| Plugged Ear (left) | |||
| SESSION A | 1.98, 84.97 | 3.40 | 0.039 |
| HEMISPHERE A | 1, 43 | 1.58 | 0.216 |
| HEMISPHERE*SESSION A | 1.94, 83.42 | 2.44 | 0.095 |
| Not-Plugged Ear (right) | |||
| SESSION A | 1.51, 64.7 | 7.52 | 0.003 |
| HEMISPHERE A | 1, 43 | 0.06 | 0.808 |
| HEMISPHERE*SESSION A | 1.30, 55.98 | 2.27 | 0.131 |
MAUCHLY’S TEST SIGNIFICANT; DEGREES OF FREEDOM ADJUSTED USING GREENHOUSE-GEISSER CORRECTION
To highlight the hemispheric changes over time, grand average source magnitudes obtained when stimulating the plugged ear (top panel) and the not-plugged ear (bottom panel) are shown in Figure 9 projected onto Brainstorm’s default MRI anatomy (MNI/Colin27 brain; Collins et al., 1998). All images are centered on the same plane and same magnitude scale for each test session. It is important to note that the activation patterns in Figure 9 are shown in a single two-dimensional plane centered on the main regions of activation and do not include the full activation volume that may exist at deeper or shallower depths. Notably, the main regions of activation are observed in the superior temporal lobe in both hemispheres, corresponding to primary auditory and association cortices, with variation in the strength of activation (indicated by color variation) occurring between hemispheres across test sessions. Nonetheless, the figure reveals a unique pattern from a qualitative perspective; when presenting the sound to the plugged (left) ear at Week 1, there was a relative reduction in left hemisphere activity, and a relative increase in right hemisphere activity. This trend continued at Week 2, but at Week 4, the activity was reduced in both hemispheres. The bottom panel shows responses for the not-plugged (right) ear stimulation that are also consistent with a relative reduction in left hemisphere activity and minimal change in right hemisphere activity.
Figure 9:

Day 0 (“D0”), Week 1–4 (“W1-W4”); Average source-localized ASSR EEG data in the 38–40 Hz frequency band for participants (n = 12, except W1 where n = 11) projected onto Brainstorm’s default MRI anatomical model (MNI/Colin27 brain; Collins et al., 1998) separated by stimulation ear. From left to right: Day 0, Week 1, Week 2, and Week 4 when stimulating the plugged (left) ear (upper panel) and the not-plugged (right) ear (lower panel).
To better quantify changes in the hemispheric distribution of ASSR activity, a laterality index (LI) also was computed from source localized data to assess overall hemispheric dominance using the following equation:
where, RH was the averaged ASSR magnitude for four ROI sources in the right hemisphere and LH was the averaged ASSR magnitude for the same four ROI sources in the left hemisphere. If LI = 0, then the magnitude of hemispheric activity was essentially equivalent across hemispheres, whereas if LI > 0, then dominant activity would be lateralized to the right hemisphere, and if LI < 0, then dominant activity would be lateralized to the left hemisphere.
LI measures were computed for each participant and each test session with respect to the ear of stimulation, either plugged (left) or not-plugged (right) ears. The mean LI by ear of stimulation across test session is shown in Figure 10. At Day 0, the LI shows that when presenting sound to either ear, there was primarily contralateral activation. Following earplug use, there was a progressive shift in laterality toward right hemisphere dominance most notably when presenting sound to the plugged ear.
Figure 10:

Mean ASSR laterality index (LI) measures computed from 4 auditory ROIs per hemisphere using source-localized EEG data with sound presented to the plugged ear (left) or not-plugged ear (right). Brackets and asterisks indicate a significant difference (p < 0.05* and p < 0.01**) between plugged and not-plugged ears (Day 0, Week 2), and within the plugged ear between test sessions (Week 2 vs. Day 0, Week 1, Week 4). Error bars indicate ±1 standard error of the mean.
Using a one sample t-test, LI values for each participant were first evaluated to determine whether laterality was significantly different from zero for each ear of stimulation at each test session. For plugged (left) ear stimulation, right hemisphere laterality was significant at Week 2 (t[47] = 6.93, p <0.001) and Week 4 (t[47] = 2.37, p = 0.02). For not-plugged (right) ear stimulation, right hemisphere laterality was significant only at Week 1 (t[47] = 2.14, p = 0.04). Both of these observed changes were the result of reduced left hemisphere activity. Next, a two-factor, repeated-measures ANOVA was completed to determine whether laterality differed between stimulation ear (right/left) and test session (Day 0, Week 1, Week 2, Week 4). The results revealed a significant main effect of ear (F1,43 = 4.75, p = 0.03) and a significant interaction between ear and test session (F3,129 = 6.09, p = 0.001), but no main effect of test session. To explore the interaction between stimulation ear and test session, a series of paired t-tests with Bonferroni correction were completed between stimulation ears for each test session and within stimulation ears across test sessions. Significant results are indicated by brackets and asterisks in Figure 10. The results showed a significant difference in laterality based on ear of stimulation on Day 0 (t[47] = 2.11, p = 0.04), where plugged (left) ear stimulation lateralized to the right hemisphere and not-plugged (right) ear stimulation lateralized to the left hemisphere, and also at Week 2 (t[47] = 3.56, p = 0.001), where plugged (left) ear stimulation showed more robust right hemisphere laterality than not-plugged (right) ear stimulation. Only plugged (left) ear stimulation showed significant differences in laterality between test session, such that dominant right hemisphere laterality was significantly greater at Week 2 than at Day 0 (t[47] = 4.15, p < 0.001), Week 1 (t[47] = 3.69, p = 0.001), or Week 4 (t[47] = 2.76, p = 0.008). Taken together, the source-localized analyses suggest that short-term monaural attenuation leads to a reduction in hemispheric activity ipsilateral to the plugged ear, in this case the left hemisphere (see Figures 8 & 9). This reduction then leads to a concomitant shift in cortical activity toward the contralateral hemisphere, in this case the right hemisphere, and was statistically significant when stimulating the left (plugged) ear (see Figure 10). It is important to note that similar hemispheric laterality shifts were not observed in the EEG sensor-level analyses, likely reflecting the influence of volume conduction within the cortex.
3.5. Audiometric Monitoring
As described earlier, at the end of each test session, pure-tone air conduction thresholds were obtained for each participant as a means of monitoring for potential changes in hearing sensitivity during treatment. A three-factor, repeated-measures ANOVA was completed to determine whether thresholds differed between ears (right/left) and frequencies (500, 1000, 2000, 4000, 6000 Hz) across test session (Day 0, Week 1, Week 2, Week 4). The results showed no significant main effects of ear (F1,11 = 0.255, p = 0.624), frequency (F4,44 = 0.962, p = 0.438), or test session (F3,33 = 1.460, p = 0.243) and no significant interactions among the three factors. These results are important in supporting the earplug methodology as a reliable means of inducing temporary changes in central auditory function while not altering perceptual sensitivity.
4. Discussion
We hypothesized that unilateral earplugging would reduce the ART in the plugged ear following unilateral auditory attenuation. Short-term sound attenuation from unilateral earplug use resulted in an average decrease of 8 to 10 dB in the ART for the plugged ear during the two-week period of earplug use relative to baseline (see Figure 4). There was a slight but non-significant increase in ARTs in the not-plugged ear, resulting in an average asymmetry between ears of about 8.5 dB at Weeks 1 and 2 (see Figure 5). These changes are consistent with the size and direction of change that have been reported in the literature following the use of unilateral earplugs (Brotherton et al., 2016; Maslin et al., 2013; Munro and Blount, 2009; Munro et al., 2014), even though the researcher measuring the reflex thresholds in the present study was not blinded to the plugged ear as was the case for other studies (e.g., Munro et al. 2014). These results are also consistent with homeostatic central gain modulation in the auditory pathway occurring as early as the brainstem nuclei involved in the acoustic reflex.
We also hypothesized that unilateral earplugging modulates central gain in the cortex as reflected in altered loudness judgements. The present study shows an increase in loudness perceptual ratings following 1 week of earplug attenuation, however, followed by a decrease in these ratings at subsequent testing sessions (see Figure 6). The Contour test results indicated changes that are somewhat modest in comparison to previous reports following both unilateral (Munro et al., 2014; Brotherton et al., 2017) and bilateral earplug use (e.g., Formby et al., 2007, 2003). Unlike Munro et al. (2014), who demonstrated changes in loudness perception of low (500 Hz) and high frequency (2000 Hz) tones across both plugged and not-plugged ears after 1 week of unilateral earplug use, our data showed significant changes only in the plugged ear. Brotherton et al., (2017) observed no significant change in loudness perception after 4 days of unilateral earplug use. Differences across studies may be due to unilateral versus bilateral earplug use or poorer test-retest reliability among the participants in the present study. It has been shown that young, normal hearing adults may shift their criterion over repeated test sessions by about 3 dB (Formby et al., 2017b), and therefore it may be difficult to capture true effects of the earplugging at other category values if the listener’s changed their criterion over repeated testing relative to baseline. Additionally, it is possible that intersubject variability may have been a factor in our results. There has been disagreement in the literature regarding which categories typically show the largest variability across participants. Recently, Formby et al. (2019) reported that intersubject variability for young, normal-hearing (untreated) listeners, using measures of standard deviation, was relatively constant across loudness categories. As reported in Table 5, our data (from baseline, Day 0 measures) show less intersubject variability for lower categories and larger variability for higher categories. The present results are consistent with the variability reported by Cox et al. (1997) and less consistent with the variability estimates (averaged across ears) from Formby et al. (2019). Subtle differences in variability across studies might also be attributed to unknown nuanced testing procedures or participant instruction. This variability may suggest that further research is needed to determine the reliability of non-passive subjective estimates of central gain.
Table 5:
Documented Intersubject Variability Standard Deviations for Contour test Loudness Categories.
| LOUDNESS CATEGORY | PRESENT STUDY | FORMBY ET AL. (2019) | COX ET AL. (1997) |
|---|---|---|---|
|
| |||
| VERY SOFT | 6.70 | 10.48 | 5.75 |
| SOFT | 9.72 | 10.69 | 8.50 |
| COMFORTABLE BUT SLIGHTLY SOFT | 10.62 | 9.80 | 10.05 |
| COMFORTABLE | 9.85 | 10.55 | 10.45 |
| COMFORTABLE, BUT SLIGHTLY LOUD | 12.23 | 9.84 | 11.70 |
| LOUD, BUT OK | 12.21 | 9.31 | 12.20 |
| UNCOMFORTABLY LOUD | 12.60 | 8.99 | 13.50 |
We hypothesized that there would be an increase in central gain following unilateral earplugging that would be reflected in the magnitude of both the sensor-cluster and source-localized ASSR activity; however, the observed changes were more complex. Although we did not measure ASSR amplitude growth functions with increasing stimulus level, as reported in previous studies evaluating ASSR and loudness perception (e.g., Van Eeckhoutte et al., 2016), our ASSR sensor-cluster measures showed robust and reliable responses for fixed-level stimuli with larger magnitudes observed for left hemisphere clusters, regardless of stimulation ear, and no change with earplug attenuation over time (see Figure 7). As noted previously, sensor-based measures typically reflect neural volume conduction as opposed to well-localized cortical activity, thus, it is not surprising that these measures showed no measurable changes over time, albeit modest differences across hemispheric clusters. Source-localized activity, on the other hand, showed greater magnitude responses in the left versus right hemisphere at baseline (Day 0) regardless of ear of stimulation (see Figure 8). These data differ somewhat from previous reports (Luke et al., 2017; Ross et al., 2005) that have shown a preponderance for right hemisphere laterality; however, individual differences in laterality also have been observed (Ross et al., 2005) and may explain subtle differences in the present data. Likewise, differences in source-localization methods and specific anatomical regions of interest selected for the analyses may also contribute to slight differences across studies.
Remarkably, source-localized ASSR activity showed distinct sensitivity to the effects of unilateral earplug attenuation over time. Specifically, there was a significant reduction in left hemisphere ASSR source magnitudes, ipsilateral to the plugged ear, through two weeks of unilateral earplug use in response to stimuli presented to either ear. Although the response magnitudes in right hemisphere sources show subtle quantitative (see Figure 8) and qualitative (see Figure 9) changes over time, these changes were not statistically significant. The balance of activity across hemispheres, as reflected in the LI analyses (see Figure 10), however, showed a shift toward contralateral right hemisphere dominance over time (when stimulating the plugged ear) that may be attributed to a decrease in left hemisphere activity. Differences in hemispheric asymmetry have been reported in the literature for individuals with permanent, long-standing unilateral hearing loss compared to those with normal hearing (Han et al., 2021; Xie et al., 2019), but the cortical distribution patterns for those individuals are even more complex and involve numerous cortical regions outside of auditory cortex than those evaluated in the present study. Likewise, although the methods and pathological conditions evaluated in some animal models are quite different than those used here, reduced peripheral input from earplugging led to reduced ASSR magnitudes in left auditory cortex, which aligns with altered cortical activity in animals having both temporary (Clarkson et al., 2016) and permanent conductive hearing loss (Xu et al., 2007), but do not align as well with increased cortical activity in animals having permanent cochlear damage (Chambers et al., 2016; Resnik & Polley, 2021; Salvi et al., 2000).
We hypothesized that the magnitude of the ASSR source response would be the primary index for documenting changes in central gain in the auditory cortex; however, the change in laterality, rather than magnitude alone, presents a clearer picture of asymmetric changes in activity across the cortex (see Figure 10) particularly when stimulating the plugged ear. These complex changes are consistent with a homeostatic gain process, but the manner in which the cortical activity was altered across hemispheres was unexpected. It is unclear to what degree such physiological asymmetrical changes exist at lower levels of the auditory system. The slight increase in ARTs of the not-plugged ear may indicate that some contralateral alterations may be initiated at earlier stages in the auditory system, though not nearly as robust as that observed in the cortical ASSR measures. Future studies may benefit from additional measures of brainstem function, such as the 80-Hz ASSR, to further explore potential asymmetrical changes in brainstem activity.
It is also notable in the present study that brainstem ART, but not cortical ASSR measures, returned to baseline within two weeks after terminating earplug use. If changes in the source magnitude of the ASSR over time were merely a reflection of changes occurring at lower levels of the system (i.e., brainstem), then we would have expected the ASSR measures also to return to baseline. These findings are consistent with Clarkson et al. (2016) in which early (II/I) but not later (IV/I) ABR peak amplitude ratios in animals with temporary unilateral earplugging showed recovery back to baseline. The present results (e.g. changes in ART and ASSR measures) indicate that short-term unilateral attenuation modulates homeostatic plasticity at different levels of the auditory pathway in a multi-stage process, consistent with the literature (Munro et al., 2014; Niemeyer, 1971). The results of the loudness judgements were ambiguous, revealing a modest incremental change after 1 week of unilateral earplug use but not after 2 weeks. It is possible that these results may reflect asymmetrical modulation of cortical activity across hemispheres as opposed to an overall sustained increase in gain. The unilateral compensation and subsequent asymmetrical changes in cortical and sub-cortical activity shown in the present study mimics what has been shown in the audio-vestibular system following unilateral cochlear or vestibular insult in both humans (Becker-Bense et al., 2013; Dieterich and Brandt, 1993, 1992) and animals (Cameron and Dutia, 1999; Precht et al., 1966; Straka et al., 2005; Suh et al., 2016; Zwergal et al., 2016). Dutia (2010) and Paterson et al., (2004) provided thorough reviews of the proposed mechanisms attributed to central vestibular compensation. Much of the literature describes a homeostatic process that is responsible for regulating the excitability of vestibular neurons and stabilizing the bilateral firing rates required for successful vestibular compensation and restoration of vestibular and vestibulo-ocular functions (Cameron and Dutia, 1999; Dutia, 2010; Paterson et al., 2004; Precht et al., 1966; Vibert et al., 2000; Yamanaka et al., 2000). It is reasonable to hypothesize that the plasticity demonstrated in the loudness measures and cortically-evoked ASSR are evidence of similar mechanistic principles which underpin the efficacy of central compensation rehabilitation strategies in the treatment of unilateral vestibular weaknesses.
The results of the present study revealed that unilateral short-term earplug use leads to compensatory changes in the auditory system, presumably to restore homeostasis. The homeostatic processes were quantified by changes in the ART, reflecting brainstem plasticity, and in the 40-Hz ASSR, reflecting cortical plasticity. Future research should include both unilateral and bilateral attenuation treatment in order to further understand the driving factors leading to overall gain changes compared to asymmetrical changes in auditory representation, as was seen in the ASSR. It is certainly possible that central gain manifests differently when there is an imbalance of peripheral input to one ear versus a global level change for both ears. Additionally, future studies should investigate whether aging impacts the ability to modulate central gain, as the degree of plasticity that can be expected for older adults is not well documented. Finally, while the results of the present experiments provide evidence that central gain occurs following the use of unilateral earplugs at both subcortical and cortical levels based on passive objective measures, it is important to understand how these homeostatic mechanisms may be represented functionally during active perceptual tasks. This study supports the use of the 40-Hz ASSR as a viable measure for investigating changes in central gain. It also may be useful in evaluating effects of sound enhancement on cortical plasticity for new hearing-aid users and for individuals with tinnitus and hyperacusis treated with sound generators.
Highlights.
Unilateral earplugging modulates central auditory gain in brainstem and cortex
Loudness perception increased within one week of earplugging
Decreased acoustic reflex thresholds reflect increased central gain in the brainstem
Cortical auditory steady state responses reveal redistribution of activity across hemispheres
Acknowledgements
The authors would like to thank the many members of the Auditory & Speech Sciences Laboratory at USF who helped with this study including a special thank you to Dr. Fernanda Magliaro Aburaya for valuable assistance in data collection and analysis. This work was supported in part by the National Institutes of Health [NIH/NIA P01-AG09524].
Footnotes
CRediT Author Statement
Peter Hutchison: Conceptualization, Methodology, Software, Formal Analysis, Investigation, Data Curation, Writing – Original draft, Visualization. Hannah Maeda: Conceptualization, Methodology, Data Curation, Writing - Review & Editing. Craig Formby: Conceptualization, Methodology, Writing - Review & Editing. Brent J. Small: Formal Analysis, Writing - Review & Editing. David A. Eddins: Conceptualization, Methodology, Software, Validation, Formal Analysis, Writing - Review & Editing, Supervision, Project Administration, Funding Acquisition. Ann Clock Eddins: Conceptualization, Methodology, Software, Formal Analysis, Visualization, Writing - Review & Editing, Supervision, Project Administration, Funding Acquisition.
Publisher's Disclaimer: This is a PDF file of an unedited manuscript that has been accepted for publication. As a service to our customers we are providing this early version of the manuscript. The manuscript will undergo copyediting, typesetting, and review of the resulting proof before it is published in its final form. Please note that during the production process errors may be discovered which could affect the content, and all legal disclaimers that apply to the journal pertain.
References
- Becker-Bense S, Buchholz HG, Best C, Schreckenberger M, Bartenstein P, Dieterich M, 2013. Vestibular compensation in acute unilateral medullary infarction: FDG-PET study. Neurology 80, 1103–1109. 10.1212/WNL.0b013e31828868a6 [DOI] [PubMed] [Google Scholar]
- Borg E, 1973. On the neuronal organization of the acoustic middle ear reflex. A physiological and anatomical study. Brain Res. 49, 101–123. 10.1016/0006-8993(73)90404-6 [DOI] [PubMed] [Google Scholar]
- Bradley A, Yao J, Dewald J, Richter CP, 2016. Evaluation of electroencephalography source localization algorithms with multiple cortical sources. PLOS ONE 11 (1): e0147266. 10.1371/journal.pone.0147266 [DOI] [PMC free article] [PubMed] [Google Scholar]
- Brotherton H, Plack CJ, Maslin M, Schaette R, Munro KJ, 2015. Pump up the volume: could excessive neural gain explain tinnitus and hyperacusis? Audiol. Neurotol. 20, 273–282. [DOI] [PubMed] [Google Scholar]
- Brotherton H, Plack CJ, Schaette R, Munro KJ, 2017. Using acoustic reflex threshold, auditory brainstem response and loudness judgments to investigate changes in neural gain following acute unilateral deprivation in normal hearing adults. Hear. Res. 345, 88–95. [DOI] [PubMed] [Google Scholar]
- Brotherton H, Plack CJ, Schaette R, Munro KJ, 2016. Time course and frequency specificity of sub-cortical plasticity in adults following acute unilateral deprivation. Hear. Res. 341, 210–219. [DOI] [PubMed] [Google Scholar]
- Brotherton H, Turtle C, Plack CJ, Munro KJ, Schaette R, 2019. Earplug-induced changes in acoustic reflex thresholds suggest that increased subcortical neural gain may be necessary but not sufficient for the occurrence of tinnitus. Neuroscience 407, 192–199. [DOI] [PubMed] [Google Scholar]
- Cameron SA, Dutia MB, 1999. Lesion-induced plasticity in rat vestibular nucleus neurones dependent on glucocorticoid receptor activation. J. Physiol. 518, 151–158. 10.1111/j.1469-7793.1999.0151r.x [DOI] [PMC free article] [PubMed] [Google Scholar]
- Collins DL, Zijdenbos AP, Kollokian V, Sled JG, Kabani NJ, Holmes CJ, Evans AC, 1998. Design and Construction of a Realistic Digital Brain Phantom. IEEE Trans. Med. Imaging 17, 463–468. [DOI] [PubMed] [Google Scholar]
- Cox RM, Alexander GC, Taylor IM, Gray GA, 1997. The contour test of loudness perception. Ear Hear. 18, 388–400. [DOI] [PubMed] [Google Scholar]
- Dale AM, Liu AK, Fischl BR, Buckner RL, Belliveau JW, Lewine JD, Halgren E, 2000. Dynamic statistical parametric mapping: Combining fMRI and MEG for high-resolution imaging of cortical activity. Neuron 26, 55–67. 10.1016/S0896-6273(00)81138-1 [DOI] [PubMed] [Google Scholar]
- Dallos PJ, 1964. Dynamics of the Acoustic Reflex: Phenomenological Aspects. J. Acoust. Soc. Am. 36, 2175–2183. 10.1121/1.1919340 [DOI] [Google Scholar]
- Destrieux C, Fischl B, Dale A, Halgren E, 2010. Automatic parcellation of human cortical gyri and sulci using standard anatomical nomenclature. Neuroimage 53, 1–15. 10.1016/j.neuroimage.2010.06.010 [DOI] [PMC free article] [PubMed] [Google Scholar]
- Dieterich M, Brandt T, 1993. Ocular torsion and tilt of subjective visual vertical are sensitive brainstem signs. Ann. Neurol. 33, 292–299. 10.1002/ana.410330311 [DOI] [PubMed] [Google Scholar]
- Dieterich M, Brandt T, 1992. Wallenberg’s syndrome: Lateropulsion, cyclorotation, and subjective visual vertical in thirty-six patients. Ann. Neurol. 31, 399–408. 10.1002/ana.410310409 [DOI] [PubMed] [Google Scholar]
- Dutia MB, 2010. Mechanisms of vestibular compensation: Recent advances. Curr. Opin. Otolaryngol. Head Neck Surg. 18, 420–424. 10.1097/MOO.0b013e32833de71f [DOI] [PubMed] [Google Scholar]
- Edgar JC, Chen YH, Lanza M, Howell B, Chow VY, Heiken K, Liu S, Wootton C, Hunter MA, Huang M, Miller GA, Cañive JM, 2014. Cortical thickness as a contributor to abnormal oscillations in schizophrenia? NeuroImage Clin. 4, 122–129. 10.1016/j.nicl.2013.11.004 [DOI] [PMC free article] [PubMed] [Google Scholar]
- Farahani ED, Goossens T, Wouters J, van Wieringen A, 2017. Spatiotemporal reconstruction of auditory steady-state responses to acoustic amplitude modulations: Potential sources beyond the auditory pathway. Neuroimage 148, 240–253. 10.1016/j.neuroimage.2017.01.032 [DOI] [PubMed] [Google Scholar]
- Farahani ED, Wouters J, van Wieringen A, 2019. Contributions of non-primary cortical sources to auditory temporal processing. Neuroimage 191, 303–314. 10.1016/j.neuroimage.2019.02.037 [DOI] [PubMed] [Google Scholar]
- Formby C, Korczak P, Sherlock LP, Hawley ML, Gold S, 2017a. Auditory Brainstem and Middle Latency Responses Measured Pre- and Posttreatment for Hyperacusic Hearing-Impaired Persons Successfully Treated to Improve Sound Tolerance and to Expand the Dynamic Range for Loudness: Case Evidence. Semin. Hear. 38, 71–93. 10.1055/s-0037-1598066 [DOI] [PMC free article] [PubMed] [Google Scholar]
- Formby C, La Guinn PS, Gold SL, Hawley ML, 2007. Adaptive recalibration of chronic auditory gain, in: Seminars in Hearing. © Thieme Medical Publishers, pp. 295–302. [Google Scholar]
- Formby C, Payne J, Yang X, Wu D, Parton JM, 2017b. Repeated Measurement of Absolute and Relative Judgments of Loudness: Clinical Relevance for Prescriptive Fitting of Aided Target Gains for soft, Comfortable, and Loud, but Ok Sound Levels. Semin. Hear. 38, 26–52. 10.1055/s-0037-1598064 [DOI] [PMC free article] [PubMed] [Google Scholar]
- Formby C, Sherlock LP, Gold SL, 2003. Adaptive plasticity of loudness induced by chronic attenuation and enhancement of the acoustic background (L). J. Acoust. Soc. Am. 114, 55–58. [DOI] [PubMed] [Google Scholar]
- Formby C, Sherlock LP, Hawley ML, Gold SL, 2017c. A Sound Therapy-Based Intervention to Expand the Auditory Dynamic Range for Loudness among Persons with Sensorineural Hearing Losses: Case Evidence Showcasing Treatment Efficacy. Semin. Hear. 38, 130–150. 10.1055/s-0037-1598069 [DOI] [PMC free article] [PubMed] [Google Scholar]
- Formby C, Yang X, Payne J, Parton J, 2019. Group means and intersubject and intrasubject variability estimates for absolute and relative (Categorical) loudness judgments of typical young adult listeners. J. Speech, Lang. Hear. Res. 62, 768–778. 10.1044/2018_JSLHR-H-17-0456 [DOI] [PubMed] [Google Scholar]
- Gelfand SA, Piper N, 1984. Acoustic Reflex Thresholds. Ear Hear. 5, 228. [DOI] [PubMed] [Google Scholar]
- Gramfort A, Papadopoulo T, Olivi E, Clerc M, 2010. OpenMEEG: opensource software for quasistatic bioelectromagnetics. Biomed. Eng. Online 8, 1. 10.1186/1475-925X-8-1 [DOI] [PMC free article] [PubMed] [Google Scholar]
- Gu JW, Halpin CF, Nam EC, Levine RA, Melcher JR, 2010. Tinnitus, diminished sound-level tolerance, and elevated auditory activity in humans with clinically normal hearing sensitivity. J. Neurophysiol. 104, 3361–3370. 10.1152/jn.00226.2010 [DOI] [PMC free article] [PubMed] [Google Scholar]
- Gutschalk A, Mase R, Roth R, Ille N, Rupp A, Hähnel S, Picton TW, Scherg M, 1999. Deconvolution of 40 Hz steady-state fields reveals two overlapping source activities of the human auditory cortex. Clin. Neurophysiol. 110, 856–868. 10.1016/S1388-2457(99)00019-X [DOI] [PubMed] [Google Scholar]
- Hébert S, Fournier P, Noreña A, 2013. Auditory sensitivity is increased in tinnitus ears. J. Neurosci. 33, 2356–2364. 10.1523/JNEUROSCI.3461-12.2013 [DOI] [PMC free article] [PubMed] [Google Scholar]
- Herdman AT, Lins O, Van Roon P, Stapells DR, Scherg M, Picton TW, 2002. Intracerebral sources of human auditory steady-state responses. Brain Topogr. 15, 69–86. 10.1023/A:1021470822922 [DOI] [PubMed] [Google Scholar]
- Knudson IM, Shera CA, Melcher JR, 2014. Increased contralateral suppression of otoacoustic emissions indicates a hyperresponsive medial olivocochlear system in humans with tinnitus and hyperacusis. J. Neurophysiol. 112, 3197–3208. 10.1152/jn.00576.2014 [DOI] [PMC free article] [PubMed] [Google Scholar]
- Kubota T, Ito T, Abe Y, Chiba H, Suzuki Y, Kakehata S, Aoyagi M, 2019. Detecting the recruitment phenomenon in adults using 80-Hz auditory steady-state response. Auris Nasus Larynx 46, 696–702. 10.1016/j.anl.2019.01.004 [DOI] [PubMed] [Google Scholar]
- Kybic J, Clerc M, Abboud T, Faugeras O, Keriven R, Papadopoulo T, 2005. A common formalism for the integral formulations of the forward EEG problem. IEEE Trans. Med. Imaging 24, 12–28. 10.1109/TMI.2004.837363 [DOI] [PubMed] [Google Scholar]
- Lai J, Sommer AL, Bartlett EL, 2017. Age-related changes in envelope-following responses at equalized peripheral or central activation. Neurobiol. Aging 58, 191–200. 10.1016/j.neurobiolaging.2017.06.013 [DOI] [PMC free article] [PubMed] [Google Scholar]
- Luke R, De Vos A, Wouters J, 2017. Source analysis of auditory steady-state responses in acoustic and electric hearing. Neuroimage 147, 568–576. 10.1016/j.neuroimage.2016.11.023 [DOI] [PubMed] [Google Scholar]
- Maslin MRD, Munro KJ, Lim VK, Purdy SC, Hall DA, 2013. Investigation of cortical and subcortical plasticity following short-term unilateral auditory deprivation in normal hearing adults. Neuroreport 24, 287–291. [DOI] [PubMed] [Google Scholar]
- McKinney CJ, Hazell JWP, Graham RL, 1999. Changes in loudness discomfort level and sensitivity to environmental sound with habituation based therapy, in: Proceedings of the Sixth International Tinnitus Seminar. pp. 499–501. [Google Scholar]
- Ménard M, Gallégo S, Berger-Vachon C, Collet L, Thai-Van H, 2008. Relationship between loudness growth function and auditory steady-state response in normal-hearing subjects. Hear. Res. 235, 105–113. [DOI] [PubMed] [Google Scholar]
- Munro KJ, 2008. Reorganization of the adult auditory system: Perceptual and physiological evidence from monaural fitting of hearing aids. Trends Amplif. 12, 254–271. [DOI] [PMC free article] [PubMed] [Google Scholar]
- Munro KJ, Blount J, 2009. Adaptive plasticity in brainstem of adult listeners following earplug-induced deprivation. J. Acoust. Soc. Am. 126, 568–571. [DOI] [PubMed] [Google Scholar]
- Munro KJ, Merrett JF, 2013. Brainstem plasticity and modified loudness following short-term use of hearing aids. J. Acoust. Soc. Am. 133, 343–349. [DOI] [PubMed] [Google Scholar]
- Munro KJ, Trotter JH, 2006. Preliminary evidence of asymmetry in uncomfortable loudness levels after unilateral hearing aid experience: Evidence of functional plasticity in the adult auditory system. Int. J. Audiol. 45, 684–688. [DOI] [PubMed] [Google Scholar]
- Munro KJ, Turtle C, Schaette R, 2014. Plasticity and modified loudness following short-term unilateral deprivation: Evidence of multiple gain mechanisms within the auditory system. J. Acoust. Soc. Am. 135, 315–322. 10.1121/1.4835715 [DOI] [PubMed] [Google Scholar]
- Munro KJ, Walker AJ, Purdy SC, 2007. Evidence for adaptive plasticity in elderly monaural hearing aid users. Neuroreport 18, 1237–1240. [DOI] [PubMed] [Google Scholar]
- Nasreddine ZS, Phillips NA, Bédirian V, Charbonneau S, Whitehead V, Collin I, Cummings JL, Chertkow H, 2005. The Montreal Cognitive Assessment, MoCA: a brief screening tool for mild cognitive impairment. J. Am. Geriatr. Soc. 53, 695–699. [DOI] [PubMed] [Google Scholar]
- Niemeyer W, 1971. Relations between the Discomfort Level and the Reflex Threshold of the Middle Ear Muscles. Audiology 10, 172–176. 10.3109/00206097109072555 [DOI] [PubMed] [Google Scholar]
- Noreña AJ, 2011. An integrative model of tinnitus based on a central gain controlling neural sensitivity. Neurosci. Biobehav. Rev. 35, 1089–1109. 10.1016/j.neubiorev.2010.11.003 [DOI] [PubMed] [Google Scholar]
- Noreña AJ, Farley BJ, 2013. Tinnitus-related neural activity: theories of generation, propagation, and centralization. Hear. Res. 295, 161–171. [DOI] [PubMed] [Google Scholar]
- Olsen SO, Rasmussen AN, Nielsen LH, Borgkvist BV, 1999. Loudness perception is influenced by long-term hearing aid use. Audiology 38, 202–205. [DOI] [PubMed] [Google Scholar]
- Pantev C, Roberts LE, Elbert T, Roß B, Wienbruch C, 1996. Tonotopic organization of the sources of human auditory steady-state responses. Hear. Res. 101, 62–74. 10.1016/S0378-5955(96)00133-5 [DOI] [PubMed] [Google Scholar]
- Pascal J, Bourgeade A, Lagier M, Legros C, 1998. Linear and nonlinear model of the human middle ear. J. Acoust. Soc. Am. 104, 1509–1516. 10.1121/1.424363 [DOI] [PubMed] [Google Scholar]
- Paterson JM, Menzies JRW, Bergquist F, Dutia MB, 2004. Cellular mechanisms of vestibular compensation. Neuroembryology Aging 3, 183–193. 10.1159/000096796 [DOI] [Google Scholar]
- Philibert B, Collet L, Vesson J-F, Veuillet E, 2002. Intensity-related performances are modified by long-term hearing aid use: a functional plasticity? Hear. Res. 165, 142–151. [DOI] [PubMed] [Google Scholar]
- Picton TW, Dimitrijevic A, Perez-Abalo MC, Van Roon P, 2005. Estimating audiometric thresholds using auditory steady-state responses. J. Am. Acad. Audiol. 16, 140–156. 10.3766/jaaa.16.3.3 [DOI] [PubMed] [Google Scholar]
- Picton TW, John MS, Dimitrijevic A, Purcell D, 2002. Human auditory steady-state responses. Int. J. Audiol. 42, 177–219. 10.3109/14992020309101316 [DOI] [PubMed] [Google Scholar]
- Precht W, Shimazu H, Markham CH, 1966. A mechanism of central compensation of vestibular function following hemilabyrinthectomy. J. Neurophysiol. 29, 996–1010. [DOI] [PubMed] [Google Scholar]
- Reyes SA, Salvi RJ, Burkard RF, Coad M. Lou, Wack DS, Galantowicz PJ, Lockwood AH, 2004. PET imaging of the 40 Hz auditory steady state response. Hear. Res. 194, 73–80. 10.1016/j.heares.2004.04.001 [DOI] [PubMed] [Google Scholar]
- Robinson K, Gatehouse S, 1995. Changes in intensity discrimination following monaural long-term use of a hearing aid. J. Acoust. Soc. Am. 97, 1183–1190. [DOI] [PubMed] [Google Scholar]
- Roß B, Borgmann C, Draganova R, Roberts LE, Pantev C, 2000. A high-precision magnetoencephalographic study of human auditory steady-state responses to amplitude-modulated tones. J. Acoust. Soc. Am. 108, 679–691. 10.1121/1.429600 [DOI] [PubMed] [Google Scholar]
- Roß B, Herdman AT, Pantev C, 2005. Right hemispheric laterality of human 40 Hz auditory steady-state responses. Cereb. Cortex 15, 2029–2039. 10.1093/cercor/bhi078 [DOI] [PubMed] [Google Scholar]
- Schaette R, Kempter R, 2009. Predicting tinnitus pitch from patients’ audiograms with a computational model for the development of neuronal hyperactivity. J. Neurophysiol. 101, 3042–3052. [DOI] [PubMed] [Google Scholar]
- Schaette R, Kempter R, 2008. Development of hyperactivity after hearing loss in a computational model of the dorsal cochlear nucleus depends on neuron response type. Hear. Res. 240, 57–72. 10.1016/j.heares.2008.02.006 [DOI] [PubMed] [Google Scholar]
- Schaette R, Kempter R, 2006. Development of tinnitus-related neuronal hyperactivity through homeostatic plasticity after hearing loss: a computational model. Eur. J. Neurosci. 23, 3124–3138. [DOI] [PubMed] [Google Scholar]
- Schaette R, McAlpine D, 2011. Tinnitus with a normal audiogram: physiological evidence for hidden hearing loss and computational model. J. Neurosci. 31, 13452–13457. [DOI] [PMC free article] [PubMed] [Google Scholar]
- Straka H, Vibert N, Vidal PP, Moore LE, Dutia MB, 2005. Intrinsic membrane properties of vertebrate vestibular neurons: Function, development and plasticity. Prog. Neurobiol. 76, 349–392. 10.1016/j.pneurobio.2005.10.002 [DOI] [PubMed] [Google Scholar]
- Stropahl M, Bauer AKR, Debener S, Bleichner MG, 2018. Source-Modeling auditory processes of EEG data using EEGLAB and brainstorm. Front. Neurosci. 12, 1–11. 10.3389/fnins.2018.00309 [DOI] [PMC free article] [PubMed] [Google Scholar]
- Suh MW, Hyun J, Lyu AR, Kim DW, Park SJ, Choi JW, Hur GM, Park YH, 2016. Compensation of Vestibular Function and Plasticity of Vestibular Nucleus after Unilateral Cochleostomy. Neural Plast. 2016. 10.1155/2016/7287180 [DOI] [PMC free article] [PubMed] [Google Scholar]
- Tadel F, Baillet S, Mosher JC, Pantazis D, Leahy RM, 2011. Brainstorm: A user-friendly application for MEG/EEG analysis. Comput. Intell. Neurosci. 2011. 10.1155/2011/879716 [DOI] [PMC free article] [PubMed] [Google Scholar]
- Turrigiano GG, 1999. Homeostatic plasticity in neuronal networks: the more things change, the more they stay the same. Trends Neurosci. 22, 221–227. [DOI] [PubMed] [Google Scholar]
- Uusitalo M, Ilmoniemi R, 1997. Signal-space projection method for separating MEG or EEG into Components. Med. Biol. Eng. Comput. 35, 135–140. [DOI] [PubMed] [Google Scholar]
- Van Eeckhoutte M, Spirrov D, Wouters J, Francart T, 2018a. Objective Binaural Loudness Balancing Based on 40-Hz Auditory Steady-State Responses. Part II: Asymmetric and Bimodal Hearing. Trends Hear. 22, 1–14. 10.1177/2331216518805363 [DOI] [PMC free article] [PubMed] [Google Scholar]
- Van Eeckhoutte M, Wouters J, Francart T, 2018b. Electrically-evoked auditory steady-state responses as neural correlates of loudness growth in cochlear implant users. Hear. Res. 358, 22–29. 10.1016/j.heares.2017.12.002 [DOI] [PubMed] [Google Scholar]
- Van Eeckhoutte M, Wouters J, Francart T, 2016. Auditory steady-state responses as neural correlates of loudness growth. Hear. Res. 342, 58–68. [DOI] [PubMed] [Google Scholar]
- Vibert N, Beraneck M, Bantikyan A, Vidal PP, 2000. Vestibular compensation modifies the sensitivity of vestibular neurones to inhibitory amino acids. Neuroreport 11, 1921–1927. 10.1097/00001756-200006260-00023 [DOI] [PubMed] [Google Scholar]
- Yamanaka T, Him A, Cameron SA, Dutia MB, 2000. Rapid compensatory changes in GABA receptor efficacy in rat vestibular neurones after unilateral labyrinthectomy. J. Physiol. 523, 413–424. 10.1111/j.1469-7793.2000.t01-1-00413.x [DOI] [PMC free article] [PubMed] [Google Scholar]
- Zwergal A, Schlichtiger J, Xiong G, Beck R, Günther L, Schniepp R, Schöberl F, Jahn K, Brandt T, Strupp M, Bartenstein P, Dieterich M, Dutia MB, la Fougère C, 2016. Sequential [18F]FDG μPET whole-brain imaging of central vestibular compensation: a model of deafferentation-induced brain plasticity. Brain Struct. Funct. 221, 159–170. 10.1007/s00429-014-0899-1 [DOI] [PubMed] [Google Scholar]