Abstract
Alternative polyadenylation (APA) yields transcripts differing in their 3′-end, and its regulation is altered in cancer, including prostate cancer. Here we have uncovered a mechanism of APA regulation impinging on the interaction between the exonuclease XRN2 and the RNA-binding protein Sam68, whose increased expression in prostate cancer is promoted by the transcription factor MYC. Genome-wide transcriptome profiling revealed a widespread impact of the Sam68/XRN2 complex on APA. XRN2 promotes recruitment of Sam68 to its target transcripts, where it competes with the cleavage and polyadenylation specificity factor for binding to strong polyadenylation signals at distal ends of genes, thus promoting usage of suboptimal proximal polyadenylation signals. This mechanism leads to 3′ untranslated region shortening and translation of transcripts encoding proteins involved in G1/S progression and proliferation. Thus, our findings indicate that the APA program driven by Sam68/XRN2 promotes cell cycle progression and may represent an actionable target for therapeutic intervention.
The maturation of precursor messenger RNAs (pre-mRNAs) requires their cleavage at the 3′-end and addition of a non-templated poly(A) tail1,2. The cleavage and polyadenylation site (pA) is defined by an upstream polyadenylation signal (PAS), which promotes 3′-end processing and reduces the processivity of the RNA polymerase II (RNAPII), thus facilitating transcription termination1. The cleavage and polyadenylation (C/P) process requires the binding of trans-acting factors to cis-acting sequences, termed upstream (USE) and downstream (DSE) sequence elements2. USEs include the PAS, located 10–30 nucleotides (nt) upstream of the pA3, UGUA and U-rich motifs, whereas DSEs comprise U- and GU-rich motifs downstream of the pA2,3. The cis-acting sequences aid the recruitment of the C/P machinery, which comprises four multiprotein sub-complexes. The cleavage and polyadenylation specificity factor (CPSF) complex binds the PAS and, together with binding of the cleavage stimulation factor (CSTF) complex to the GU/U-rich DSE, is required for pA definition2,4. In addition, binding of cleavage factor I (CFIm) to USE and binding of CFIIm to DSE contribute to pA definition and cleavage, respectively4,5. After cleavage, the RNA downstream of the pA is degraded by the XRN2 exonuclease, contributing to transcription termination and RNAPII release from the DNA template1.
Most human genes harbor more than one PAS6, the differential recognition of which generates multiple transcript variants through alternative cleavage and polyadenylation (APA)2. If alternative PASs are in introns or alternative last exons within the coding unit, their recognition determines usage of upstream intronic (IPA) or exonic (EPA) pAs and changes the mRNA coding sequence (CDS-APA). On the other hand, selection of competing PASs in the 3′ untranslated region (UTR) of the terminal exon (3′UTR-APA) generates transcripts that differ in the length of the non-coding regulatory region2,4. The cooperative assembly of CPSF with the other C/P sub-complexes influences the selection of alternative PASs. Indeed, binding of CFIm and CSTF can direct the catalytic activity of CPSF to suboptimal PASs, thereby enhancing their usage7,8. Furthermore, APA modulation is also regulated by trans-acting factors involved in other steps of RNA metabolism, in particular RNA-binding proteins (RBPs)9,10,11,12,13. For example, the U1 small nuclear ribonucleoprotein (snRNP), a core component of the spliceosome required for recognition of the 5′ splice site, suppresses usage of cryptic pAs present in introns12, and this function can be aided by physical interaction with RBPs, such as Sam6811. Auxiliary cis-acting sequence elements can also recruit several RBPs to affect pA selection by competing with the C/P sub-complexes10,13,14,15,16.
APA regulation is involved in most biological processes and is often altered in human cancers17, which display unique profiles of 3′UTRs18 that can be employed to characterize clinically distinct subtypes19. Cancer cells generally express APA variants that are shorter with respect to normal tissue cells20,21,22. This global shortening of transcripts was hypothesized to support cancer-cell proliferation, by either removing regulation by microRNAs from the 3′UTR of oncogenic transcripts19,23 or by inactivating tumor suppressors22. Altered expression of C/P components can dysregulate APA in cancer cells, with broad consequences for the transcriptome23,24. For example, the CPSF component CPSF1 is frequently amplified in prostate cancer (PC) and promotes the expression of truncated, androgen-insensitive variants of the androgen receptor (AR-Vs), which are strongly associated with disease progression, resistance to therapies and poor prognosis25. More generally, the global APA changes observed in human cancers are likely to result from the altered activity and expression of C/P regulators, including RBPs known to participate in this process2,17.
PC is the fifth leading cause of cancer-related death in men26. PC is initially dependent on androgens, and androgen-deprivation therapy blocks tumor growth. However, the disease invariably progresses to a castration-resistant (CRPC) stage, for which no cure is available26. Mounting evidence indicates that PC evolution is characterized by widespread dysregulation of RNA processing27,28. Interestingly, APA patterns can be used to identify patients with PC displaying relapse to anti-androgenic therapies29, suggesting a possible role for APA dysregulation in tumor evolution. Indeed, APA can generate PC-relevant oncogenic isoforms, such as the IPA variant of cyclin D130 (cyclin D1b) and the aforementioned AR-V variants25, which both promote PC progression. Notably, RNA-processing dysregulation in PC has been linked to amplification of MYC27, a transcription factor that drives the upregulation of oncogenic RBPs in cancer cells31,32. Among them, Sam68 plays a role in the APA of both cyclin D1 and AR in PC cells33,34. More recently, Sam68 was reported to globally control 3′-end processing in brain and testis11,35,36. Nevertheless, whether Sam68 upregulation in various cancers, including PC37, modifies their APA patterns is currently unknown.
In this Article we identify XRN2 as a Sam68-interacting protein, which is also induced in PC cells by MYC, supporting a functional link between these proteins. Transcriptome analyses highlight the widespread impact of Sam68 and XRN2 on APA in PC cells. XRN2 promotes recruitment of Sam68 to the PAS region of regulated transcripts, where it competes with CPSF recruitment. Thus, our studies unveil an oncogenic APA program operated by the Sam68/XRN2 complex that is involved in cancer-cell proliferation.
Results
The 5′–3′ exonuclease XRN2 interacts with Sam68
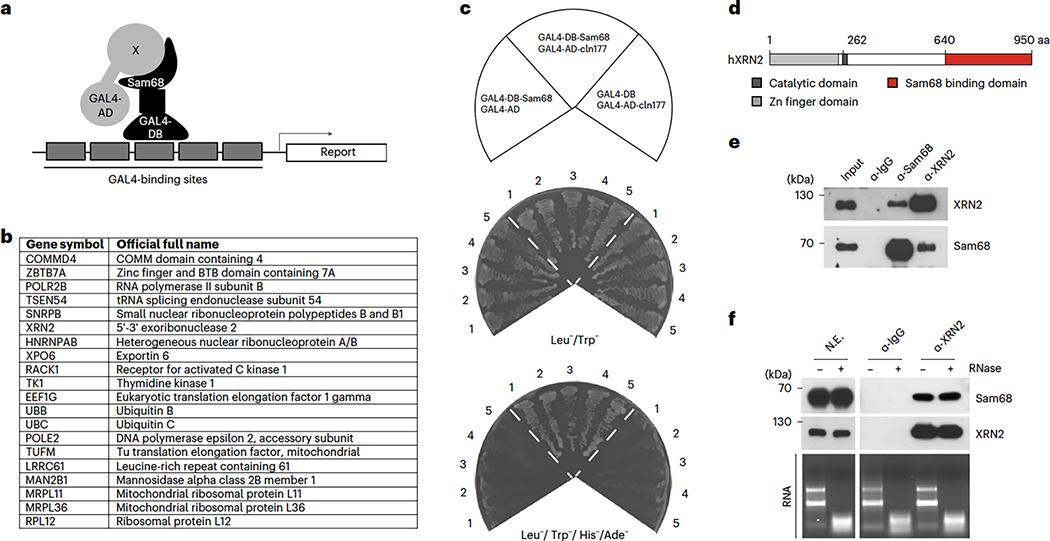
To identify proteins that functionally cooperate with Sam68 in PC cells, we performed a yeast two-hybrid screen using an LNCaP-derived library38. Among the retrieved Sam68-interacting proteins (Fig. 1a,b), we focused on XRN2 (Clone#177, residues 625-947; Extended Data Fig. 1a,b). The interaction between Sam68 and the carboxyl-terminal region of XRN2 was verified by growth in low- and high-stringency medium of yeast co-transformed with pGBKT7-Sam68 or pGBKT7, used as negative control (Fig. 1c,d). Furthermore, pulldown assays using LNCaP cell extracts showed that the endogenous XRN2 protein specifically interacts with the carboxyl-terminal region (residues 434–443) of purified GST-Sam68 (Extended Data Fig. 2a,b). More importantly, endogenous XRN2 and Sam68 could be reciprocally co-immunoprecipitated from LNCaP nuclear extracts (Fig. 1e) in an RNA-independent manner (Fig. 1f). These results identify XRN2 as a Sam68-interacting protein in PC cells.
Fig. 1|. XRN2 physically interacts with Sam68.
a, Schematic representation of the yeast two-hybrid screen performed using Gal4-DBD-Sam68 as bait and a Gal4-AD fusion cDNA library from LNCaP cells, b, Table reporting the Sam68-interacting factors identified by the screen, c, Five clones of the AH109 yeast strain transformed with the plasmid expressing Gal4-AD-XRN2 (1,929–2,842 nt) (clone 177) and Gal4-DBD-Sam68 fusion proteins, or both plasmids co-transformed with empty vectors as controls. Clones were plated in non-stringency (SD without Leu and Trp) and high-stringency (SD without Leu, Trp, His and Ade) medium and grown at 28 °C for four days, d, Scheme of the XRN2 structure with the position of the Sam68-interacting region (red box), e. Representative western-blot analysis of the reciprocal co-immunoprecipitation (co-IP) between endogenous Sam68 and XRN2 from LNCaP nuclear extracts using Sam68 (α-Sam68) or XRN2 (α-XRN2) antibodies (n = 3). Input = 0.25%. f, Representative western-blot analysis of the co-IP of endogenous Sam68 with XRN2, performed using LNCaP nuclear extracts (NE) in the presence (+) or absence (−) of RNaseA (n = 3). A representative agarose gel of RNA degradation is also shown (RNA). In e and f, non-immune rabbit immunoglobulins G (α-IgG) were used as a negative control.
Sam68 and XRN2 expression are correlated in PC
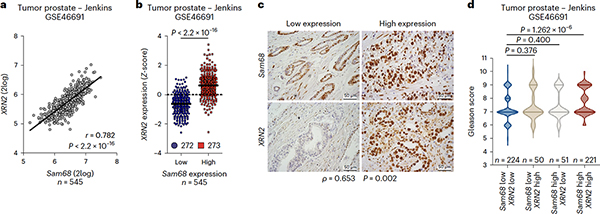
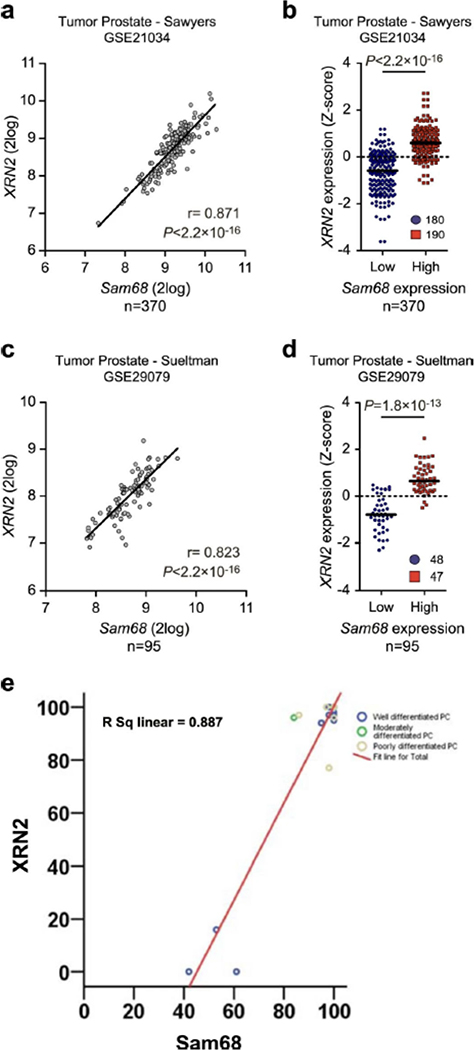
Although the pro-oncogenic role of Sam68 in PC is known39,40, no information is available regarding XRN2 expression and function in this tumor. Analysis of three independent datasets (GSE46691, GSE29079 and GSE21034; R2 genomics, http://r2.amc.nl)41,42,43 revealed a significant correlation between Sam68 and XRN2 expression in PC patients (Fig. 2a and Extended Data Fig. 3a,c). Furthermore, Z-score classification of patients for Sam68 expression confirmed that XRN2 mRNA levels are significantly higher in the Sam68highgroup (Fig. 2b and Extended Data Fig. 3b,d). Immunohistochemistry analysis of specimens from a cohort of 20 patients confirmed the positive association between Sam68 and XRN2 at the protein level (Fig. 2c and Extended Data Fig. 3e). Moreover, concomitant high expression of Sam68 and XRN2 in PC patients was significantly associated with a high Gleason score (Fig. 2d), which is an index of disease progression in PC44.
Fig. 2|. XRN2 and Sam68 expression are positively correlated in PC.
a, Pearson’s correlation analyses of XRN2 and MYC expression in the PC Jenkins dataset (GSE46691). Pearson’s correlation coefficient (r; two-sided) and P value are reported (95% confidence interval), b, Dot plot showing the distribution of XRN2 expression in patients with PC (Jenkins dataset, GSE46691), classified into Sam68low (blue circles) and Sam68high (red squares) expression groups according to Z-score normalization. The median is shown as a solid horizontal line, c, Representative images of immunohistochemistry analyses of patients with PC (n = 20) with low and high expression of XRN2 and Sam68. Spearman’s correlation is reported (ρ = 0.653; P = 0.002). d, Violin plot showing the correlation between Sam68 and XRN2 expression with Gleason score, in patients with PC (Jenkins dataset, GSE46691). In b and d, statistical significance was calculated by the Mann-Whitney test (two-sided), and P values are reported (95% confidence interval).
MYC promotes XRN2 and Sam68 expression in prostate cancer
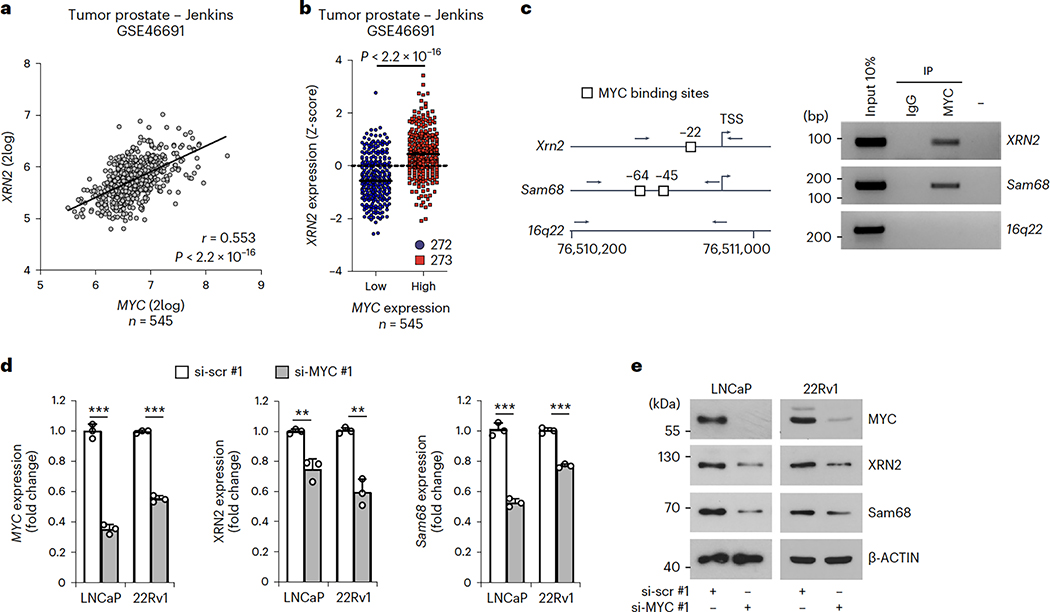
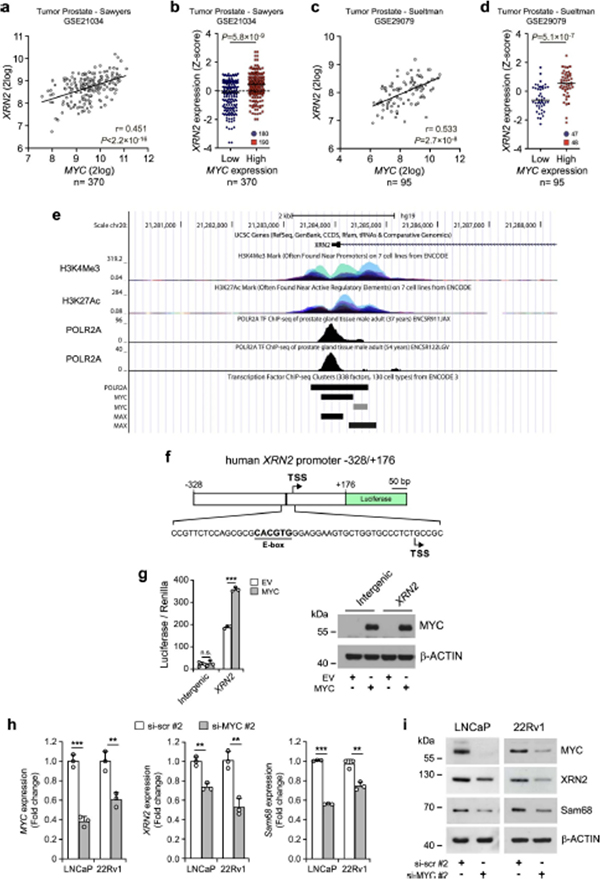
Expression of Sam68 is under the control of MYC in PC32. XRN2 expression was also correlated with that of MYC in patients with PC, with increased XRN2 expression in the MYChigh population (Fig. 3a,b and Extended Data Fig. 4a–d). To investigate whether XRN2transcription is induced by MYC, we set out to identify the promoter region of the XRN2gene. Querying of the UCSC Genome Browser database (http://genome.ucsc.edu; GRCh37/hg19) indicated that RNAPII occupancy is distributed in a region between −328 and +176 base pairs (bp) from the transcription start site (TSS), which also features histone marks of active promoters (H3K4me3 and H3K27Ac) (Extended Data Fig. 4e). Cloning of the XRN2−328/+176 bp region upstream of the luciferase reporter gene (Extended Data Fig. 4f) induced luciferase expression at significantly higher levels than a control intergenic DNA region (Extended Data Fig. 4g), indicating its promoter activity. Furthermore, co-transfection of MYC enhanced the activity (approximately twofold) of the XRN2 promoter, whereas it exerted no effect on the control vector (Extended Data Fig. 4g, MYC samples). These results suggest that MYC induces transcription of XRN2.
Fig. 3|. MYC positively controlsXRN2expression in PC.
a, Pearson’s correlation analysis of XRN2 and MYC expression in the jenkins dataset (GSE46691). Pearson’s correlation coefficient (r; two-sided) and P values are reported (95% confidence interval), b, Distribution of XRN2 expression in patients with PC classified as MYCflow (blue circles) and MYChigh (red squares) groups according to Z-score normalization of expression data retrieved from the jenkins dataset (GSE46691). Statistical significance was calculated by Mann-Whitney test (two-sided), and the P value is reported, c, Representative semiquantitative (sq) PCR analysis of ChIP experiments (n = 3) performed in LNCaP cells using MYC antibody and IgG, or no antibody (−), as negative controls. MYC binding was evaluated on the XRN2 promoter. Binding to the sam68 promoter and 16q22 intergenic region were used as positive and negative control, respectively. A schematic representation of the indicated promoters and 16q22 intergenic region is also shown. MYC binding sites (boxes), and positions of primers used for PCR analyses (arrows) are reported. d,e, qPCR (d) and western-blot (e) analyses of MYC, XRN2 and Sam68 expression in LNCaP and 22Rv1 cells lines transfected with control (si-scr#l) and MYC (si-MYC#1) siRNAs (n = 3). Expression was reported as fold change (ΔΔCq) with respect to control. Data represent mean + s.d. of three biological replicates, and statistical significance was calculated by unpaired Student’s t-test (two-sided) (MYC/LNCaP P = 3.8 × 10⁻⁵, MYC/22Rv1 P = 5.1 × 10⁻⁶; XRN2/LNCaP P = 3.7 × 10⁻³, XRN2/22Rv1 P = 1.4 × 10⁻³; Sam68/LNCaP P = 8.4 × 10⁻⁵, Sam68/22Rv1P = 7.7 × 10⁻⁵). In d, statistical value is reported as **P < 0.01, ***P < 0.001. In e, β-actin was used as loading control.
An E-box binding site for MYC (CACGTG) is located 23 bp upstream of the XRN2 TSS (Extended Data Fig. 4f). Chromatin immunoprecipitation sequencing (ChIP-seq) experiments (Encode Project, https://www.encodeproject.org) confirmed the binding of MYC to this promoter region (Extended Data Fig. 4e), suggesting a direct regulation. Accordingly, ChIP experiments performed in LNCaP cells demonstrated a significant enrichment of MYC in the XRN2 and Sam68 promoter regions, whereas no binding was observed in an intergenic region (Chr16q22) used as control (Fig. 3c). Moreover, MYC knockdown in PC cells reduced the expression of both Sam68 and XRN2 (Fig. 3d,e and Extended Data Fig. 4h,i), supporting a functional link between these proteins.
The XRN2/Sam68 complex coordinates a widespread APA program
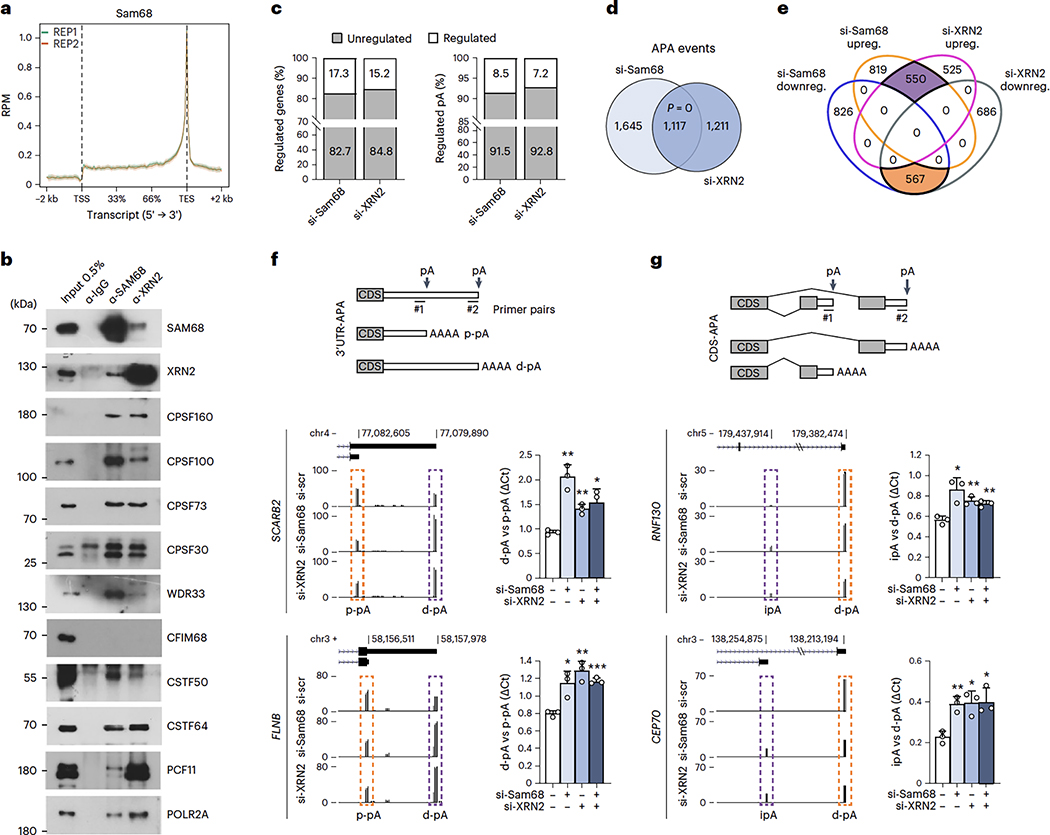
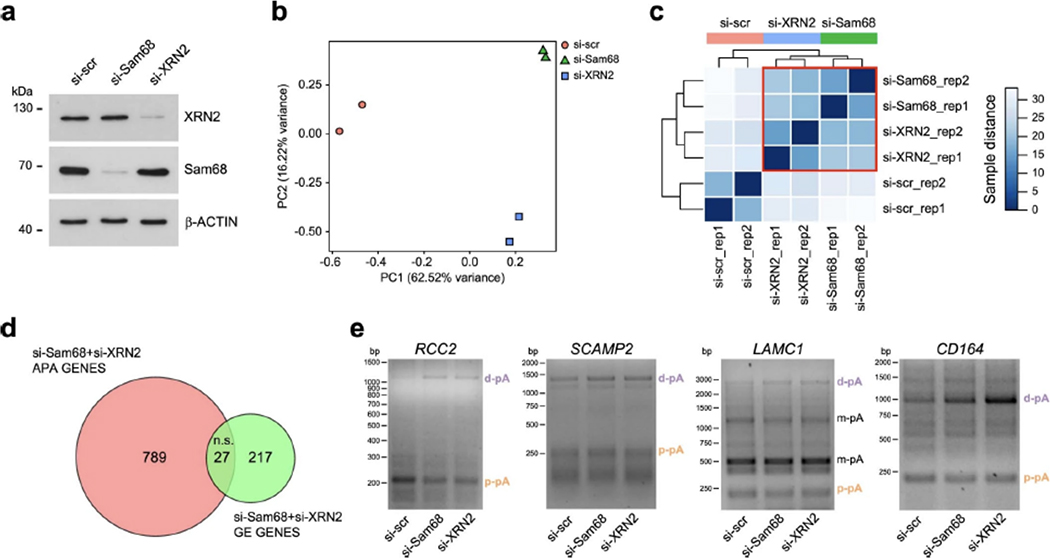
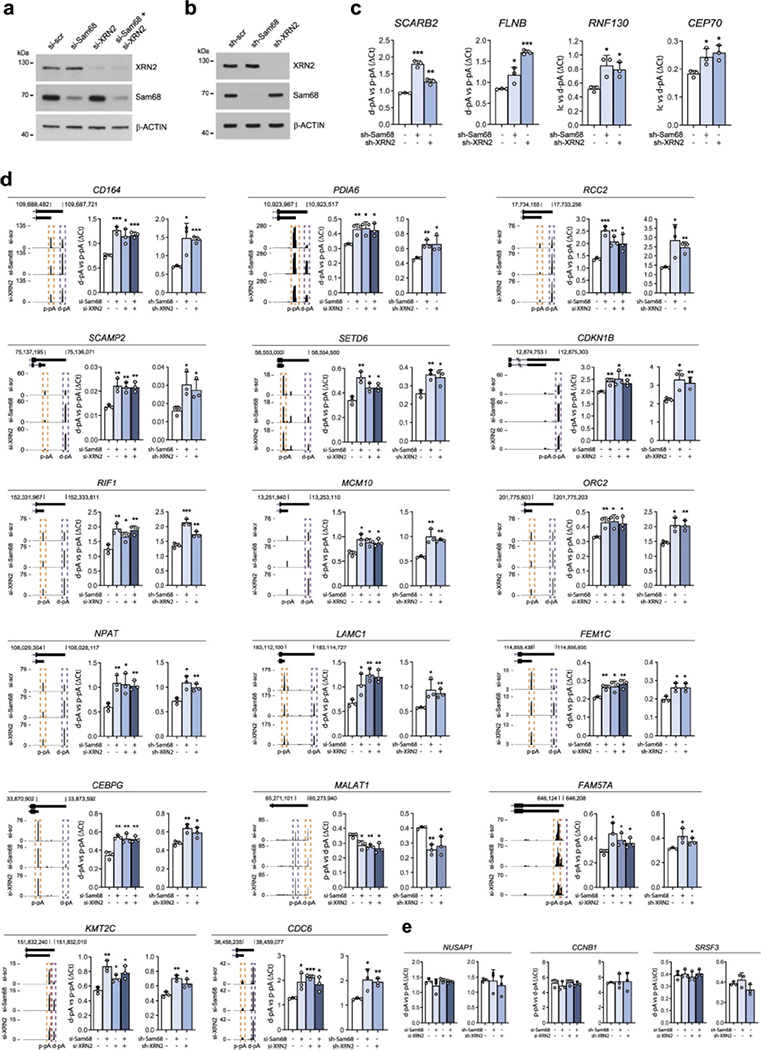
Meta-analysis of the Sam68 binding position to its target RNAs identified by ultraviolet (UV) crosslink immunoprecipitation (CLIP) experiments45 highlighted a sharp peak in the proximity of the transcription end site (TES) (Fig. 4a), suggesting that Sam68 is involved in 3′-end processing of transcripts. Moreover, XRN2 activity has previously been linked to 3′-end processing of pre-mRNAs1,46,47, and both Sam68 and XRN2 co-immunoprecipitated with several components of C/P sub-complexes in LNCaP cells (Fig. 4b), further supporting their involvement in APA regulation. To test this possibility, we performed 3′region extraction and deep sequencing (3′READS) analysis48 of LNCaP cells depleted of Sam68 or XRN2 (Extended Data Fig. 5a). Principal-component and sample-distance analyses indicated highly reproducible results and similar APA profiles in Sam68- and XRN2-depleted cells (Extended Data Fig. 5b,c). Knockdown of Sam68 and XRN2 affected 2,762 and 2,328 APA events, respectively, which accounted for 8.5% and 7.2% of total pAs utilized in LNCaP cells (in 17.3% and 15.2% of the expressed genes; Fig. 4c). Strikingly, 1,117 APA events were shared (P = 0; Fig. 4d) and regulated in the same direction (Fig. 4e) in the two conditions. Depletion of both proteins also caused changes in gene expression, but the overlap with APA-regulated genes was limited (Extended Data Fig. 5d), indicating that APA regulation by these proteins is not linked to changes in overall transcript levels. Qualitative 3′ Rapid Amplification of cDNA Ends (3′RACE; Extended Data Fig. 5e) and quantitative polymerase chain reaction (qPCR) (Fig. 4f,g and Extended Data Fig. 6a–e) analyses of arbitrarily selected APA events in LNCaP cells transiently or stably silenced for Sam68 and XRN2 confirmed the 3′READS results (validation rate of >87%). Interestingly, combined depletion of Sam68 and XRN2 did not further enhance APA regulation of target transcripts (Fig. 4f,g and Extended Data Fig. 6a,d), suggesting that these proteins act as a functional complex to shape the PC cell transcriptome through APA.
Fig. 4|. Genome-wide regulation of APA by XRN2 and Sam68 in PC cells.
a, Meta-transcriptome profiles of Sam68 binding across mRNA transcripts retrieved from two replicates of CLIP-seq experiments (GSE85164). TSS, transcription start site; TES, transcription end site; RPM, reads per million, b, Representative western-blot analysesofthe co-IP ofSam68 and XRN2 with componentsoftheC/P complex from LNCaP nuclear extracts using Sam68 (α-Sam68) and XRN2 (α-XRN2) antibodies, or rabbit immunoglobulins G (α-IgG) as negative control (n = 2). c, Bar graphs representing the percentage of genes (left) and polyadenylation sites (pAs; right graph) undergoing APA regulation in Sam68 (si-Sam68)- and XRN2 (si-XRN2)-depleted LNCaP cells, d, Venn diagram showing the overlap between regulated APA events identified in Sam68- or XRN2-depleted cells. Statistical significance was calculated by hypergeometric test and the P value is shown. e, Venn diagram showing the number of unique and common up- (purple) and downregulated (orange) APA events identified in Sam68- and XRN2-depleted cells. f,g, Bar graphs showing qPCR analysis of pA usage evaluated in two representative genes undergoing 3’UTR-APA (f) and CDS-APA (g) regulation in cells knocked down for Sam68 (si-Sam68), XRN2 (si-XRN2) or both proteins. Fold change of distal (d-pA) (f) or intronic (g) pA relative to the proximal pA (p-pA) in the 3’UTR was calculated by the ΔCq method. Data represent mean + s.d. of three biological replicates. Statistical significance was calculated by unpaired Student’s t-test (two-sided). In f, SCARB2: si-Sam68/si-scr P = 1.5 × 10⁻³, si-XRN2/si-scr P = 2.0 × 10⁻³, si-Sam68si-XRN2/si-scr P = 0.017; FLNB: si-Sam68/si-scr P = 0.015, si-XRN2/si-scr P = 2.1 × 10⁻³, si-Sam68si-XRN2/si-scr P = 3 × 10⁻⁴. In g, RNF130: si-Sam68/si-scr P = 0.013, si-XRN2/si-scr P = 5.5 × 10⁻³, si-Sam68si-XRN2/si-scr P = 5.4 × 10⁻³; CEP70: si-Sam68/si-scr P = 4.3 × 10⁻³, si-XRN2/si-scr P = 0.0112, si-Sam68si-XRN2/si-scr P = 0.0147. In f and g, statistical values are reported as *P < 0.05; **P < 0.01; ***P < 0.001. UCSC genome browser tracks showing APA regulation of the events analyzed are also shown on the left side of each graph. Purple and orange boxes in the schemes indicate up- and downregulated events, respectively. Schematic representations of these CDS- and 3’UTR-APA events are shown in the upper panels.
XRN2 recruits Sam68 to the PAS of regulated transcripts
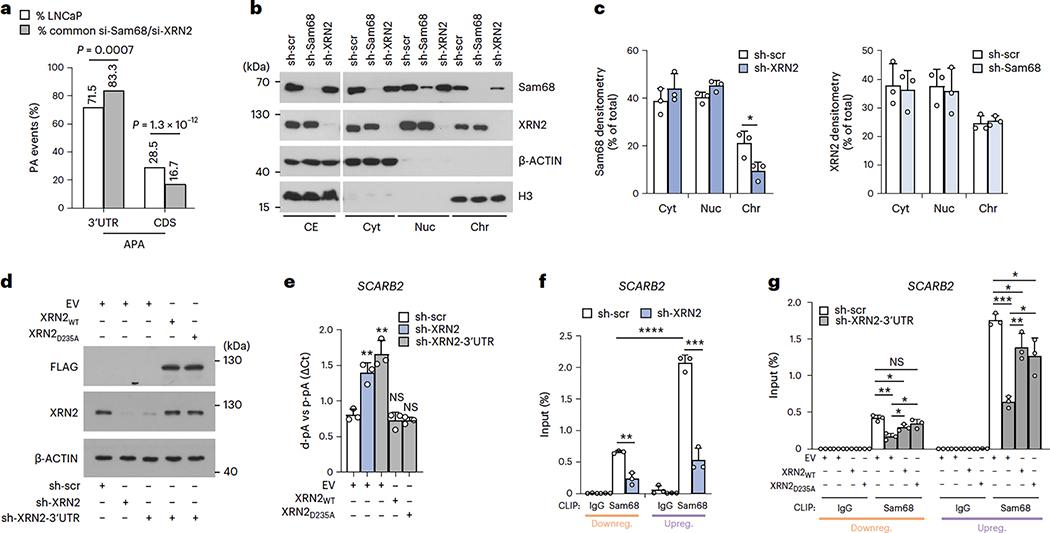
The percentage of 3′UTR-APA events regulated by both Sam68 and XRN2 is significantly enriched with respect to their representation in the LNCaP reference dataset, whereas CDS-APA events were under-represented (Fig. 5a). Because Sam68 also prevalently binds near the TES (Fig. 4a), we decided to focus on 3′UTR-APA regulation.
Fig. 5|. Sam68 and XRN2 globally modulate pA selection in the 3’UTR of target transcripts.
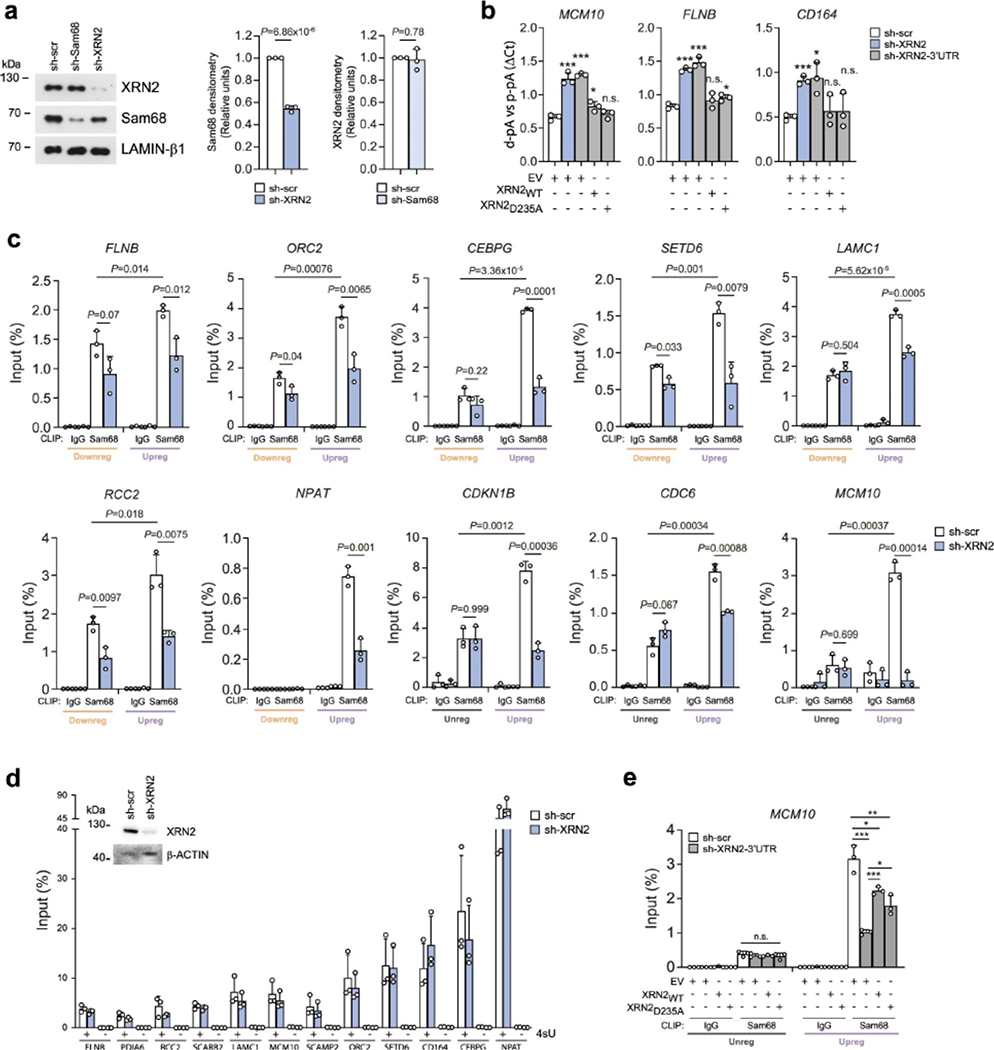
a, Bar graph showing the percentage of 3’UTR- and CDS-APA events annotated in the genes expressed in LNCaP cells (white columns) and the percentage of those that are differentially regulated in Sam68- and XRN2-depleted cells (gray columns). Statistical significance wascalculated by modified Fisher’s exact test (two-sided, 95% confidence interval), and the exact P values are reported. b,c, Representative western-blot (b) and densitometric analyses (c) of subcellular fractionation experiments (n = 3) performed in control (sh-scr), Sam68 (sh-Sam68) and XRN2 (sh-XRN2) stably depleted LNCaP cells. CE, total cell extract; Cyt, cytoplasmic fraction; Nuc, nucleoplasmic fraction; Chr, chromatin fraction. d,e, Western blot (d) and bar graphs showing qPCR analysis (e) of pA usage of the SCARB2 gene evaluated in cells knocked down for XRN2 targeting 3’UTR (sh-XRN2-3’UIR) and transfected with empty vector (EV), wild-type (WT) and catalytically inactive (D235A) XRN2 (n = 3). LNCaP cells stably depleted with a shRNA targeting CDS (sh-XRN2) were used as control. Fold change of distal (d-pA) relative to the proximal pA (p-pA) in the 3’UTR was calculated by the ACq method. The representative western blot (d) shows the expression of endogenous (XRN2) and recombinant (FLAG) proteins; β-actin was used as loading control. f,g, CLIP assays performed in LNCaP cells stably depleted for XRN2 (sh-XRN2) (n = 3) (f) or transfected as in d (n = 3) (g) using the Sam68 antibody or control IgCs. The RNA associated with Sam68 was quantified by qPCR using primers located upstream of regulated and non-regulated pAs and is represented as percentage (%) of input. Inc and e-g, statistical significance was calculated by unpaired Student’s t-test (two-sided). In c, sh-XRN2/Cyt P = 0.324, sh-XRN2/Nuc P = 0.058, sh-XRN2/Chr P = 0.035, sh-Sam68/Cyt P = 0.8119, sh-Sam68/Nuc P = 0.7612, sh-Sam68/Chr p = 0.6481. In e, sh-XRN2/EV p = 3.4 ×10⁻³, sh-XRN2-UTR/EVP = 2.1 × 10⁻³, sh-XRN2-UTR/XRN2WT P = 0.4198, sh-XRN2-UTR/XRN2D235A P = 0.2456. In f, Sam68(sh-scr-downreg/sh-scr-upreg) p = 4.34 ×10⁻⁵, Sam68downreg(sh-scr/sh-XRN2) P = 1.7 × 10⁻³, Sam68upreg(sh-scr/sh-XRN2) P = 3 × 10⁻⁴. In g, downregulated: Sam68(sh-scr+EV/sh-XRN2-3’UTR + EV) P = 2 × 10⁻³, Sam68(sh-scr + EV/sh-XRN2-3’UTR + XRN2WT) P = 0.0215, Sam68(sh-scr + EV/sh-XRN2-3’UTR + XRN2D235A) P = 0.1502, Sam68(sh-XRN2-3’UTR + XRN2WT/sh-XRN2-3’UTR + EV) P = 0.0252, Sam68(sh-XRN2-3’UTR + XRN2D235A/sh-XRN2-3’UTR + EV) P = 0.0157; upregulated: Sam68(sh-scr + EV/sh-XRN2-3’UTR + EV) P = 7.3 × 10⁻⁵, Sam68(sh-scr + EV/sh-XRN2-3’UTR + XRN2WT) P = 0.036, Sam68(sh-scr + EV/sh-XRN2-3’UTR + XRN2D235A) P = 0.031, Sam68(sh-XRN2-3’UTR + XRN2WT/sh-XRN2-3’UTR + E V) p = 3.3 × 10⁻³, Sam68(sh-XRN2-3’UTR + XRN2D235A/sh-XRN2-3’UTR + EV) P = 0.0141. In c and e-g, the bars represent mean + s.d. of three biological replicates; statistical value is reported as *P < 0.05, **P < 0.01, ***P < 0.001; NS, not significant.
RNA-processing events, including cleavage/polyadenylation, mostly occur while the nascent transcripts are still bound to the chromatin1,49. Fractionation experiments50showed that Sam68 and XRN2 were readily detectable in LNCaP nucleoplasm and chromatin fractions, consistent with their association with nascent RNAs. Interestingly, chromatin-bound Sam68 was reduced in LNCaP cells depleted of XRN2, whereas knockdown of Sam68 did not affect XRN2 subcellular localization (Fig. 5b,c). Recent evidence suggests that the majority of the ‘chromatin-bound’ nascent transcripts are associated with the nuclear matrix51, which may delay their release and favor selection of suboptimal pAs51. We found that both Sam68 and XRN2 are also associated with the nuclear matrix. Moreover, depletion of XRN2 significantly reduced the association of Sam68 with this compartment (Extended Data Fig. 7a). To test the possibility that XRN2 plays a scaffold-like function in APA, we generated a catalytically inactive XRN2 mutant (D235A)52. LNCaP cells were stably silenced for endogenous XRN2 expression by a shRNA targeting the 3′UTR and then transfected with constructs encoding either wild-type (WT) or mutated (D235A) XRN2 isoforms (Fig. 5d). XRN2D235A fully rescued the APA defects of XRN2-depleted LNCaP cells (Fig. 5e and Extended Data Fig. 7b), indicating the importance of the scaffolding rather than enzymatic function of XRN2 in APA regulation.
Next, we tested whether XRN2 was also required for Sam68 binding to its target transcripts by CLIP experiments. Notably, recruitment of Sam68 near the up- and downregulated pAs was significantly reduced in XRN2-depleted cells (Fig. 5f and Extended Data Fig. 7c), whereas no significant change was observed in non-regulated pAs (that is, CDKN1B, CDC6 and MCM10; Extended Data Fig. 7c). Moreover, analysis of nascent transcripts by 4sU pulse-labeling showed that depletion of XRN2 did not affect the overall expression of the regulated transcripts (Extended Data Fig. 7d). The XRN2D235A mutant was capable of rescuing the binding of Sam68 to its target transcripts (Fig. 5g and Extended Data Fig. 7e), further indicating that the XRN2 exonuclease activity is not required for its function in APA. These data support a ‘structural’ role of XRN2 in APA, which is exerted by bridging Sam68 to the nuclear matrix and promoting its binding to target transcripts.
Sam68 favors selection of weak PASs by competing with CPSF
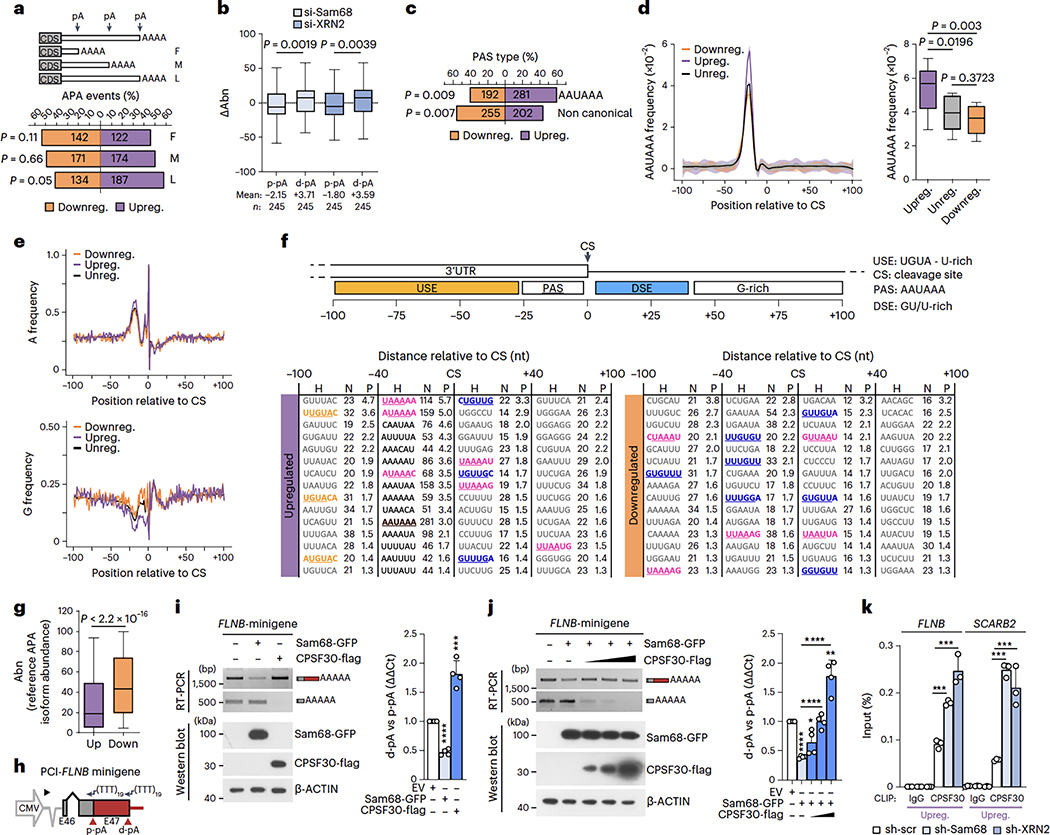
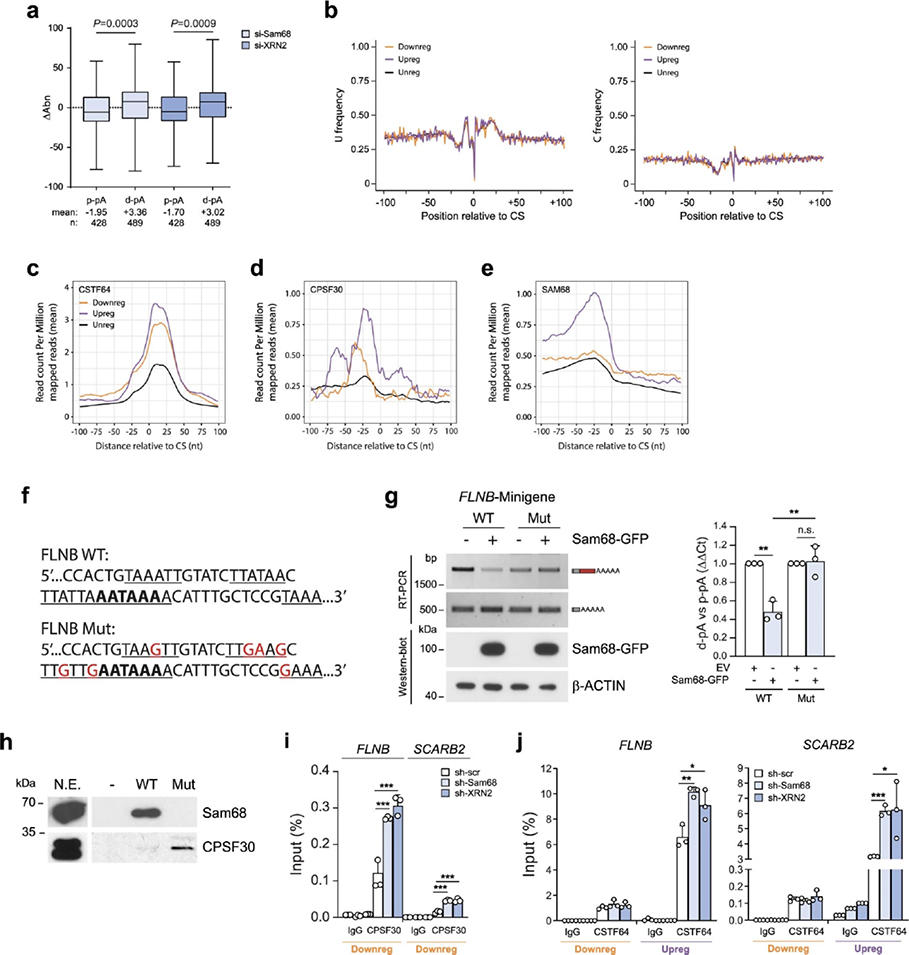
pA position in the 3′UTR can be classified as first (F, proximal-most), middle (M, intermediate) and last (L, distal-most) relative to the stop codon (Fig. 6a). Position analysis indicated a significant upregulation of distal-most pAs and preferential downregulation of proximal-most pAs (Fig. 6a). To test whether depletion of Sam68 and XRN2 promotes transcript lengthening, individual pA usage was evaluated at the transcript level. For each gene, the regulated pA was defined as proximal (p-pA) or distal (d-pA) based on whether it was, respectively, upstream or downstream of the other regulated pA. Next, changes in pA isoform abundance (ΔAbn) were plotted for transcripts undergoing APA regulation at both proximal and distal sites. Consistent with the hypothesis, depletion of either Sam68 or XRN2 caused a significant repression of p-pAs and upregulation of d-pAs (Fig. 6b). Similar results were also obtained by plotting the ΔAbn of genes presenting at least one regulated pA, whose position was established with respect to the other most used pA in each gene (Extended Data Fig. 8a). These findings suggest that Sam68 and XRN2 promote transcript shortening by regulating 3′UTR-APA.
Fig. 6|. Sam68 and XRN2 repress strong, canonical target pAs.
a, Percentage and number of up- (purple) and downregulated (orange) 3’UTR-APA events regulated by Sam68 and XRN2 (pA position is shown as F, proximal-most; M, intermediate; L, distal-most), b, Changes of 3’UTR pA isoform abundance (ΔAbn) at both p-pA and d-pA sites in si-Sam68 and si-XRN2 cells. Mean values and number of pA events (n) are reported, c, Percentage of up- and downregulated canonical and non-canonical PAS sequences in 3’UTR-APA events regulated by Sam68 and XRN2. d, AAUAAA frequency profile in up- (purple), down- (orange) and unregulated (black) 3’UTR pAs evaluated between −100 and +100 nt from the CS (shading represents 95% confidence interval). Statistical significance (unpaired Student’s t-test, two-sided) was calculated between −15 and −25 nt (boxplot). e, A- and G-base frequency distribution in up- (purple), down-grange) and unregulated (black) pAs between −100 and +100 nt from the CS (0). f, Scheme of cis-elements and CS position. Hexamers enriched between −100 and +100 nt from the CS in up- and downregulated pAs with respect to unregulated pAs. Motif (H), number (N) and significance score (P) of hexamers are indicated. Significance score was calculated by –log10(P)xS, where P is based on the Fisher’s exact test and the S value was 1 or −1 for enrichment and depletion, respectively, g, APA isoform abundance (Abn) of si-Sam68/si-XRN2 up- (mean = 28.6) and downregulated (mean = 47.2) isoforms. Values refer to expression in control cells, h, Scheme of the FLNB minigene comprising the genomic region from the second-last exon to 200 nt downstream of the d-pA (source data). i,j, Semiquantitative (micrographs) and quantitative (bar graphs) analyses of pA usage in LNCaP transfected with the FLNB minigene and indicated plasmids (n = 3). Protein expression was evaluated by western blot, k, CLIP assays performed in sh-Sam68 and sh-XRN2 cells using CPSF30 antibody or IgGs (n = 3). Statistical significance was calculated by unpaired Student’s t-test, two-sided (b, g, i-k) and with Fisher’s exact test, two-sided (a, c). (l-k) Bar graphs represent mean + s.d. When not indicated, P values are reported as *P < 0.05, ***P < 0.001, ****P < 0.0001 (exact P values are reported in the source data). In the boxplots (b, d, g), the center line and box indicate the median and the 25th and 75th percentiles, respectively. Whiskers indicate ±1.5x interquartile range.
The canonical PAS motif (AAUAAA) is preferentially located in the distal-most pA of the 3′UTR53. In line with the upregulation of L sites, the AAUAAA sequence was significantly enriched in pAs selected upon depletion of Sam68 and XRN2, whereas pAs bearing non-canonical PAS sequences were preferentially downregulated (Fig. 6c). Accordingly, the AAUAAA frequency was specifically augmented in upregulated events (Fig. 6d). Moreover, analysis of the composition profiles in a region encompassing ±100 nt from the cleavage site (CS) highlighted a higher frequency of As within 25 nt upstream of the CS of upregulated pAs. By contrast, Gs are depleted in upregulated pAs and enriched in downregulated pAs in the same region (Fig. 6e), while Us and Cs showed no differential distribution (Extended Data Fig. 8b). Next, we asked whether the pAs regulated by Sam68/XRN2 are characterized by specific cis-acting elements. The region ±100 nt from the CS was further portioned into four clusters corresponding to the expected position of the PAS (−40 nt), the CSTF-binding motif (+40 nt) and additional upstream (−100/−41 nt) and downstream (+41/+100 nt) regulatory elements (Fig. 6f)48. Search for 6-mer motifs indicated that upregulated events are characterized by features of canonical pAs, with enrichment of the AAUAAA signal in the −40-nt cluster, as well as the presence of the motifs recognized by CFIm25 (UGUA) in the −100/−41-nt cluster and by CSTF64 (GU-rich) in the +40-nt cluster (Fig. 6f). By contrast, none of these motifs was observed in the downregulated events, which only featured an enrichment in CSTF64 binding sites that were scattered along all clusters and not specifically situated in a proximal position downstream of the CS (Fig. 6f). These observations suggested that upregulated pAs should be preferentially recognized by the C/P machinery. Indeed, metagene analyses of the CSTF64 and CPSF30 binding sites54indicated that their global occupancy is higher in upregulated pAs than in down- and non-regulated ones (Extended Data Fig. 8c,d). Nevertheless, quantitative analysis revealed that pAs that are upregulated upon depletion of Sam68 and XRN2 are less utilized than downregulated ones in LNCaP cells (Fig. 6g), raising the possibility that the Sam68/XRN2 complex exerts a repression on stronger pAs and promotes usage of weaker sites. In line with this hypothesis, we detected a significant enrichment of Sam68 binding motifs in the −40-nt cluster of the upregulated pAs (Fig. 6f).
Sam68 binds RNA as a homodimer and recognizes bipartite U(A/U)AA sequences55,56. Thus, the presence of the AAUAAA sequence and additional U(A/U)AA motifs in the −40-nt cluster of upregulated events suggests that Sam68 binding may interfere with PAS recognition by the C/P machinery. Metagene analysis of CLIP-seq data45 also highlighted an increased occupancy of Sam68 upstream of the upregulated pAs compared to down- and non-regulated events (Extended Data Fig. 8e). Moreover, the binding profiles of Sam68 and CPSF30 in upregulated pAs were similar, with a main peak around −25 nt from the CS (Extended Data Fig. 8d,e), suggesting that Sam68 and CPSF30 may compete for binding to these pAs. To test this hypothesis, we generated a minigene model of the FLNB gene, which comprises the genomic region from the second last exon to 200 nt downstream of the d-pA (Fig. 6h). Upregulation of Sam68 promoted the usage of the p-pA from the minigene (Fig. 6i), thus recapitulating the regulation of the endogenous transcript. Importantly, upregulation of CPSF30 caused the opposite effect, with selection of the d-pA and repression of the p-pA (Fig. 6i). Moreover, binding of Sam68 in proximity of the FLNB d-pA was required for its repression, as mutation of the consensus motifs flanking the d-pA abolished its effect on APA (Extended Data Fig. 8f,g). Pulldown assays using an RNA probe encompassing the FLNB d-pA confirmed that Sam68 efficiently binds to this sequence, whereas CPSF30 binding was barely detectable. Conversely, mutation of the Sam68 consensus motifs substantially increased binding of CPSF30, while suppressing Sam68 binding (Extended Data Fig. 8h). In further support of their competition, transfection of increasing doses of CPSF30 was sufficient to relieve the repression exerted by Sam68 on the d-pA, while completely suppressing usage of the weaker p-pA (Fig. 6j). Moreover, CLIP assays documented that depletion of Sam68, or XRN2, increases in vivo binding of CPSF30 at both up- and downregulated PASs (Fig. 6k and Extended Data Fig. 8i), to an extent that correlates with the relative binding level of Sam68 to these regions (Fig. 5f and Extended Data Fig. 7c). Consistent with the higher frequency of its sequence motifs, increased binding of CSTF64 upon depletion of Sam68/XRN2 was specifically observed only in upregulated pAs (Extended Data Fig. 8j). Together with the stronger binding of Sam68 near the upregulated pAs (Fig. 5f and Extended Data Fig. 7f), these results support the notion that Sam68 directly weakens strong d-pAs, thus favoring the selection of weaker p-pAs.
Sam68 and XRN2 promote cell cycle progression through APA
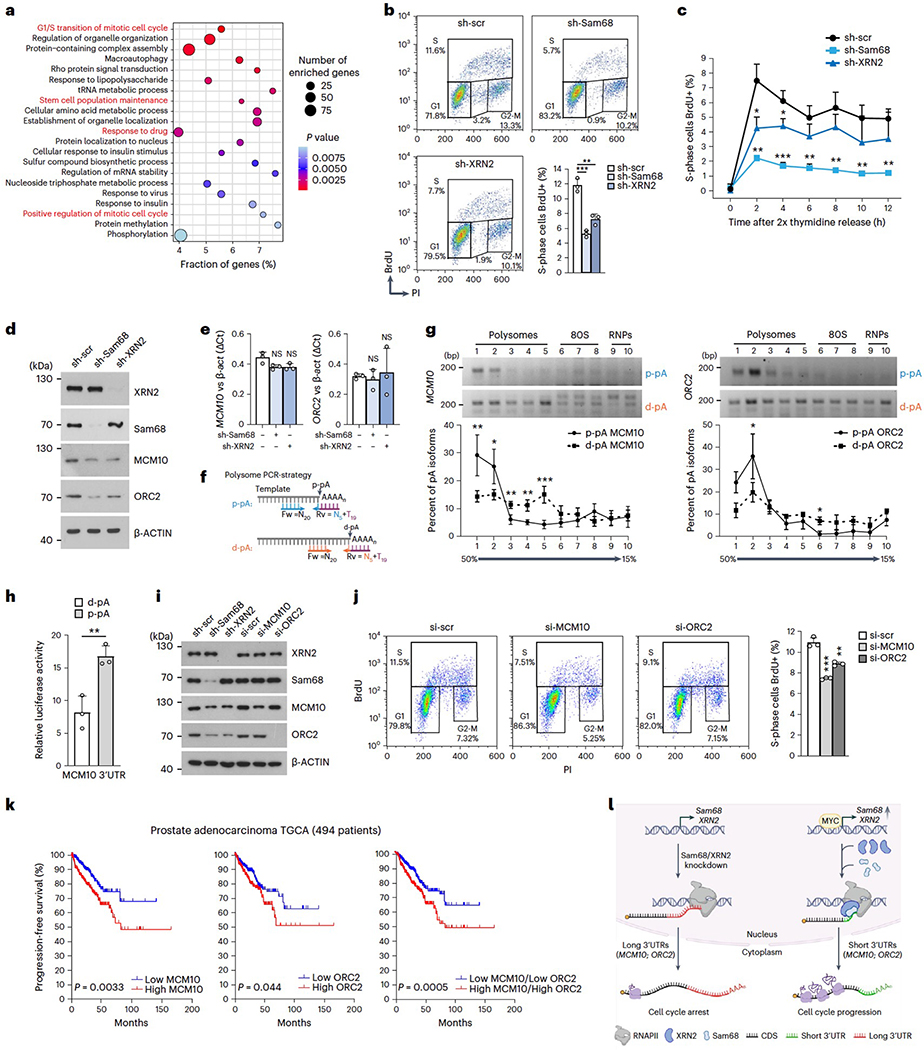
APA-regulated genes are enriched in genes involved in functional categories related to tumorigenesis, including G1/S transition, stem cell population maintenance, drug response and cell migration. Because G1/S transition was the top-ranking category and its deregulation is a hallmark of cancer cells, we focused on cell cycle regulation. Flow cytometry analysis of BrdU incorporation in cells stably silenced for XRN2 or Sam68 showed a significant increase in the G1 population and a concomitant reduction of the S phase population (Fig. 7b and Extended Data Fig. 9a), with no effect on cell death (Extended Data Fig. 9b). Moreover, depletion of Sam68, and to a lesser extent of XRN2, severely impaired S phase entry of cells after release from double thymidine block (Fig. 7c). Thus, Sam68 and XRN2 promote proper progression to the DNA duplication phase of the cell cycle.
Fig. 7|. XRN2 and Sam68 promotes cell cycle progression through APA modulation.
a, Enrichment of Gene Ontology (GO) terms (dot plot) in genes regulated by 3’UTR-APA upon depletion of Sam68 or XRN2. Dot size and color indicate the number of genes and statistical significance (Fisher’s exact test, two-sided), respectively, b, Cytometric analyses showing DNA content versus BrdU incorporation upon stable depletion of Sam68 (sh-Sam68) and XRN2 (sh-XRN2) in LNCaP cells. The bar graph shows the percentage of BrdU-positive (S phase) cells, c. Percentage (mean + s.d.) of BrdU-positive LNCaP cells described in b at the indicated time points after release from G1/S synchronization. d,e, Western blot (d) and qPCR (e) analyses of MCM10 and ORC2 expression level in sh-Sam68 and sh-XRN2 LNCaP cells (n = 3). f, PCR strategy used to evaluate 3’UTR-APA isoforms distribution on a 15–50% sucrose gradient, g, sqPCR analysis of the indicated p-pA and d-pA isoform abundance within the polysomal and non-polysomal fractions obtained from sucrose gradient. The graphs show the densitometric analysis of the band signal in each fraction, expressed as a percentage of that detected in all fractions, h, Relative luciferase activity (Renilla/Firefly ratio) of long and short MCM10 3’UTR in LNCaP cells. i, Representative western-blot analysis (n = 3) of the indicated proteins performed in LNCaP cells depleted for the indicated genes, j, Cytometric analyses showing DNA content versus BrdU incorporation in control (si-scr), si-MCMlO and si-ORC2 LNCaP cells. The bar graph shows the percentage of S-phase BrdU-positive cells, k, Kaplan-Meier curves comparing progression-free survival of494 patients with PC (Prostate Adenocarcinoma, TCGA, PanCancer Atlas; https://www.cbioportal.org) stratified according to MCM10 (right), ORC2 (middle) and MCM10/ORC2 (left) expression level. I, Schematic model showing the impact of the functional interaction between Sam68 and XRN2 on cell cycle regulation. The Sam68/XRN2 complex promotes 3’UTR shortening of cell cycle-related genes, increasing their mRNA translation efficiency and cell proliferation. Conversely, Sam68/XRN2 knockdown induces 3’UTR lengthening, reduces translation efficiency of transcripts and causes cell cycle arrest. In b, e, h and j, the bar graphs represent the mean + s.d. In b, c, e, g, h and j, statistical significance was calculated by unpaired Student’sf-test, two-sided (n = 3; *P < 0.05, **P < 0.01,***P < 0.001; NS, not significant; exactPvalues are reported in the source data). In d and I, β-actin was used as loading control.
To evaluate whether APA regulation is directly involved in the effects elicited by Sam68 and XRN2 depletion, we investigated the expression of MCM10 and ORC2 as representative genes involved in the G1/S transition57,58. MCM10 and ORC2 protein levels were reduced upon depletion of Sam68 or XRN2 (Fig. 7d), but this effect was not associated with changes in overall transcript levels (Fig. 7e). We thus asked whether the APA switch could affect translational efficiency. Fractionation of LNCaP cell extracts59 followed by semiquantitative PCR (sqPCR) using isoform-specific primers (Fig. 7f) showed that transcripts terminating at the p-pAs are significantly enriched on polysomes compared to the isoforms with a long 3′UTR (d-pA; Fig. 7g). Accordingly, luciferase reporter assays indicated that the p-pA 3′UTR isoform of MCM10 yields higher protein expression levels than the d-pA isoform (Fig. 7h). These findings show that selection of the d-pA in the absence of Sam68/XRN2 impairs translational efficiency of MCM10 and ORC2 transcripts. Furthermore, reduction of the MCM10 and ORC2 proteins to levels comparable to those observed in Sam68/XRN2-depleted LNCaP cells (Fig. 7i) was sufficient to reduce BrdU-positive cells and to arrest cells in the G1 phase (Fig. 7j and Extended Data Fig. 9c). These results support the notion that disruption of the Sam68/XRN2-driven APA program impairs cell cycle progression.
Next, we asked whether these APA-regulated genes are relevant for PC. Clinical data in The Cancer Genome Atlas (TCGA) indicated that high expression of MCM10 (P = 0.0033) and ORC2 (P = 0.044) is significantly associated with shorter progression-free survival. Worse prognosis was even more significantly associated (P = 0.0005) with patients with PC displaying concomitant upregulation of both MCM10 and ORC2 (Fig. 7k). Collectively, these results show that the XRN2/Sam68 complex promotes a 3′UTR-shortening program impinging on the mRNA translation efficiency of cell cycle-related genes (Fig. 7l), which supports cell proliferation and may contribute to PC outcome.
Discussion
In this Article we describe the key role played by Sam68 and XRN2 in genome-wide modulation of APA in PC cells. Sam68 and XRN2 expression is upregulated by MYC, an oncogenic transcription factor that is amplified or upregulated in PC27,60. The Sam68/XRN2 complex preferentially represses strong pAs at the distal end of the 3′UTR through physical binding of Sam68 to U/A-rich sequences, thus favoring usage of suboptimal p-pAs. This regulation has an impact on the expression of cell cycle-related genes, by promoting APA isoforms with higher translational efficiency and increasing the expression of proteins involved in G1/S progression, such as MCM10 and ORC2. Thus, our study uncovers a molecular mechanism involved in APA regulation that is directly linked to 3′UTR shortening and translational activation of transcripts encoding for cell cycle proteins (Fig. 7l).
The canonical PAS sequence is recognized by the CPSF complex, which cooperates with the CSTF complex to catalyze the cleavage and polyadenylation process2,4. Additional pAs lacking the canonical PAS sequence also exist in most human transcripts. These suboptimal sites are functional, albeit less efficient than canonical ones2. Competition between multiple PASs generates mRNA isoforms characterized by different 3′-ends, and such APA programs regulate fundamental biological processes, such as reprogramming of cell fate and male germ cell differentiation61,62. In most cases, d-pAs are enriched for the canonical PAS sequence with respect to p-pAs53, and their strength also relies on enrichment of additional auxiliary motifs, like the CFIm and CSTF64 binding motifs5,63. Interestingly, our study revealed that pAs repressed by the Sam68/XRN2 complex exhibit all features of strong pAs, such as the enrichment of canonical PAS, USEs and DSEs2,3,4,54. However, these pAs are not preferentially utilized in LNCaP cells unless the repression exerted by the Sam68/XRN2 complex is relieved. Such regulation is probably direct, as Sam68 binds the PAS region of its target transcripts in an XRN2-dependent fashion. Sam68 binding largely overlaps with that of the CPSF near the repressed pAs, and recruitment of CPSF30 is strongly induced upon knockdown of Sam68 or XRN2, as well as by mutation of the Sam68 consensus motifs. Collectively, our results indicate that the Sam68/XRN2 complex fine-tunes APA regulation by increasing the competition between ‘weak’ and ‘strong’ PASs and allowing usage of suboptimal pAs. Because XRN2 promotes the interaction of Sam68 with the nuclear matrix and its target transcripts in an exonuclease-independent manner, we propose that it plays a structural role in the complex.
Sam68 was shown to modulate APA by suppressing internal IPAs in male germ cells and neurons11,35,36. However, the regulation described herein in cancer cells differs from the mechanism in action in normal cells undergoing differentiation. Suppression of IPAs in germ cells, and presumably in neurons, mainly operates through the interaction of Sam68 with the U1 snRNP11. Although we did not directly test the involvement of U1 snRNP in APA regulation mediated by Sam68/XRN2, it is unlikely that this factor is involved, as inhibition of U1 snRNP induces widespread 3′UTR shortening in cancer cells64. By contrast, our data indicate preferential usage of pAs at the distal end of genes in the absence of Sam68/XRN2. Furthermore, 3′UTR shortening mediated by U1 snRNP inhibition increased the expression of oncogenes, thus favoring a tumorigenic phenotype64, whereas depletion of Sam68 or XRN2 inhibited cell proliferation. It is thus likely that regulation of 3′UTR-APA by the Sam68/XRN2 complex is a feature acquired by PC cells upon upregulation of these proteins. Because transcriptional activation of both Sam68 and XRN2 is driven by MYC, it is also conceivable that the mechanism described herein is present in other MYC-amplified cancers.
Proliferating cancer cells are characterized by global mRNA shortening of 3′UTR4,17,18, which particularly influences genes related to cell cycle progression and is associated with disease progression65. 3′UTR shortening was proposed to relieve the repression exerted by microRNAs, thus increasing the expression of such APA-regulated transcripts19. Our results are in line with this notion and suggest that the Sam68/XRN2 complex contributes to this mechanism. Sam68 and XRN2 favor shortening of the ORC2 and MCM10 transcripts, which encode proteins involved in the initiation of DNA duplication at the onset of S phase. The transcripts terminating at the proximal pA were more efficiently loaded on polysomes, suggesting increased translational efficiency. Accordingly, depletion of Sam68 or XRN2 caused 3′UTR lengthening and reduced ORC2 and MCM10 protein expression. Moreover, MCM10 or ORC2 knockdown caused the same cell cycle defect observed in the absence of Sam68 or XRN2, with strong reduction of cells in S phase and their accumulation in G1. Thus, the correlation between the APA switch and cell cycle progression suggests that the Sam68/XRN2 complex controls an adaptive oncogenic program that promotes proliferation. We also report that expression of XRN2, Sam68 and MYC is positively correlated in patients with PC. MYC is overexpressed at early stages of PC, where it acts as a key driver of tumorigenesis and disease progression, and in up to 37% of patients with metastatic PC, where it predicts poor prognosis60. The dependency of Sam68 and XRN2 expression on MYC supports a functional axis between these proteins. Notably, MYC was also shown to dysregulate RNA processing in PC, possibly through regulation of the expression of RBPs27,32. Because aberrant cell cycle regulation is one of the main mechanisms operated by MYC to promote tumorigenesis66, MYC-dependent upregulation of Sam68 and XRN2 reveals the existence of another layer of complexity governing this process in cancer, which is operated through APA regulation.
In conclusion, our study reveals an unexpected cooperation between Sam68 and XRN2 that orchestrates an APA program involved in the control of cell proliferation. Because RNA-based therapies have now entered the clinic for other human diseases67, our work also highlights a pathway of APA regulation that may represent an actionable vulnerability in cancer.
Methods
Yeast two-hybrid screen
The yeast two-hybrid screen was performed according to the manufacturer’s instructions (Clontech)38. Briefly, the AH109 yeast strain was co-transformed with both Gal4-DBD-Sam68 vector and the LNCaP cDNA library and plated on synthetic selective media (SD without leucine and tryptophan) for the low-stringency screen. The 1,500 yeast positive colonies obtained were subsequently tested in the high-stringency condition by plating in SD lacking leucine, tryptophan, histidine and adenine. Plasmids from positive clones were recovered and sequenced to identify the Sam68-interacting protein(s).
Co-immunoprecipitation assays
Co-immunoprecipitation (co-IP) experiments were performed using LNCaP nuclear extracts38. Briefly, cells were resuspended in RSB10 buffer (10 mM Tris/HCl pH 7.4, 2.5 mM MgCl2, 10 mM NaCl) supplemented with 20 mM β-glycerophosphate, 0.5 mM Na3VO4, 1 mM dithiothreitol (DTT) and protease inhibitor cocktail (Merck, Sigma-Aldrich), incubated for 15 min in ice and then centrifuged at 700g for 8 min at 4 °C. The cytosolic supernatant fraction was discarded, and isolated nuclei were resuspended in RSB100 buffer and homogenized using a 27-G needle. After standing in ice for 10 min, the nuclear extract was layered onto a 30% (wt/vol) sucrose cushion and centrifuged at 7,000g for 15 min at 4 °C to remove insoluble material. For the co-IP experiment, 1 mg ml−1 of nuclear extract was incubated with 3 μg of the indicated antibodies, or IgGs (as negative control), in the presence of 10 μl of protein G Dynabeads (Thermo Fisher Scientific, Invitrogen), with or without 1 μg ml−1 of RNase A. After 2 h of incubation at 4 °C, the beads were washed three times with RSB100 buffer and boiled in Laemmli sample buffer.
Cell culture maintenance, transient small interfering RNAs, stable short hairpin RNAs and plasmid transfection
LNCaP (LNCaP-clone FGC, CRL-1740, ATCC) and 22Rv1 (CRL-2505, ATCC) cells were grown in RPMI 1640 medium (Euroclone) supplemented with 10% FBS (GIBCO), 1% non-essential amino acids (Euroclone), 10 mM HEPES (Euroclone), 1 mM sodium pyruvate (Aurogene), penicillin (50 U ml−1)/streptomycin (50 μg ml−1) (Corning) and 50 μg ml−1 gentamicin sulfate (Aurogene). Human embryonic kidney cells (293T, CRL-3216, ATCC) were grown in DMEM medium (Euroclone) supplemented with 10% FBS (GIBCO), 1% non-essential amino acids (Euroclone), penicillin (50 U ml−1)/streptomycin (50 μg ml−1) (Corning) and 50 μg ml−1gentamicin sulfate (Aurogene). Cells were maintained in culture at 37 °C under 5% CO2 in a humidified incubator, for no longer than three months. All cell lines were routinely tested for mycoplasma contamination.
For MYC, Sam68, XRN2, MCM10 and ORC2 RNAi experiments, LNCaP cells were silenced twice with 50 nM small interfering RNAs (siRNAs) using Lipofectamine RNAiMax (Thermo Fisher Scientific, Invitrogen) according to the manufacturers’ instructions. Transfection was carried out for 72 h. siRNAs were purchased from Dharmacon (ON-TARGET plus human c-MYC L-003282-02; ON-TARGET plus human Sam68 L-020019-00; ON-TARGET plus human XRN2 L-017622-01; ON-TARGET plus human MCM10 J-019193-05; ON-TARGET plus human ORC2 J-003284-09 and ON-TARGET plus non-targeting pool D-001810-10) and Qiagen (Flexi Tube siRNA MYC SI03101847 and Negative control SI03650325).
Mission pLKO.1 plasmids containing short hairpin (shRNA) sequences targeting Sam68 (TRCN0000000048), XRN2 (TRCN0000293639) and Non-Target control shRNA were obtained from Merck/Sigma-Aldrich. For lentiviral particles production, constructs were transfected in the presence of pCMV-dR8.2-dvpr and pCMV-VSV-G helper plasmids into 293T cells using Lipofectamine2000 (Thermo Fisher Scientific, Invitrogen). After 48 h, the supernatant containing lentiviral particles was collected and centrifuged at 3,000 r.p.m. for 5 min. LNCaP cells were transduced with the supernatant of lentiviral particles in the presence of Polybrene (8 μg ml−1) for 24 h before replacement with fresh growth medium supplemented with puromycin (1 μg ml−1). Cells were analyzed 96 h post transduction. For rescue experiments, plasmid transfection was performed using Lipofectamine2000 (Thermo Fisher Scientific, Invitrogen) and cells were collected after 24 h.
For the analysis of APA using the FLNB minigene, LNCaP cells were transfected with 0.1 μg of Sam68-GFP or 1 μg of CPSF30-Flag plasmids. For competition analyses, cells were transfected with 0.1 μg of Sam68-GFP and increasing doses (0.15, 0.3 and 1 μg) of CPSF30-Flag plasmids. After 24 h, cells were collected for RNA extraction.
Immunostaining for Sam68 and XRN2
Five-micrometer sections from formalin-fixed and paraffin-embedded human PC samples (n = 20) were deparaffinized, rehydrated and stained with rabbit polyclonal antibodies raised against human Sam68 (1:2,000 dilution, overnight incubation; cat. no. A302-110A, Bethyl Laboratories) and human XRN2 (1:400 dilution, overnight incubation; cat. no. A301-103A, Bethyl Laboratories). For both immunostainings, antigen retrieval was performed by microwave treatment at 750 W (10 min) in 10 mmol l−1 sodium citrate buffer (pH 6.0). The dextran polymer complex (EnVision kit, Agilent) was used for signal amplification. DAB (3,3-diaminobenzidine) was used as chromogen. In control sections, the specific primary antibodies were replaced with non-immune serum from rabbit.
ChIP assay
For ChIP experiments32, LNCaP cells were crosslinked by the addition of 1% (vol/vol) formaldehyde to the culture medium for 10 min at room temperature (r.t.) and quenched with 125 mM glycine for 5 min at r.t. After washing with phosphate-buffered saline (PBS), cells were lysed in Nuclei Extraction Buffer (5 mM PIPES pH 8, 85 mM KCl, 0.5% NP-40) for 2 h at 4 °C under rotation. The nuclei pellet was centrifuged 5 min at 1,200g (4 °C) and resuspended in sonication buffer (10 mM EDTA pH 8, 50 mM Tris-HCl pH 8, SDS 1%). Sonication was performed using a Bioruptor sonication waterbath (Diagenode). Crosslinked DNA (100 μg) was diluted 1:10 in dilution buffer (0.01% SDS, 1.1% Triton X-100, 1.2 mM EDTA, 16.7 mM Tris-HCl pH 8.0, 167 mM NaCl) and incubated with 5 μg of specific MYC antibody (sc-764X, Santa Cruz Biotechnologies) or IgGs (Sigma-Aldrich), as negative control, under rotation at 4 °C overnight. The mixture was incubated with protein G Dynabeads (Thermo Fisher Scientific, Invitrogen) for 2 h under rotation at 4 °C, washed and reverse-crosslinked overnight at 65 °C. Finally, proteins were degraded by the addition of 150 μg of Proteinase K (Thermo Fisher Scientific, Invitrogen) for 2 h at 55 °C, and immunoprecipitated DNA was recovered according to standard procedures and analyzed by sqPCR. The oligonucleotides used are listed in Supplementary Table 1.
RNA extraction, gene expression and APA PCR analyses
Total RNA was extracted using the TRIzol reagent (Thermo Fisher Scientific), according to the manufacturer’s instructions, and treated with RNase-free DNaseI (New England Biolabs). A total of 1 μg of RNA was retrotranscribed using M–MLV reverse transcriptase (Promega) in the presence of random (Roche) or oligo(dT) (Roche) primers. APA patterns and gene expression levels were evaluated by qPCR analysis using 10 ng of cDNA template. qPCR analysis was carried out using PowerUp SYBR Green Master Mix (Thermo Fisher Scientific) and a StepOnePlus Real-Time PCR system (Thermo Fisher Scientific) according to the manufacturer’s instructions. Data were analyzed by ΔCt and ΔΔCt methods. The primers used are listed in Supplementary Table 3.
Cell extract preparation, cellular and polysomes-RNPs fractionation
For whole cell extract preparation32, cells were collected by trypsinization and resuspended in lysis buffer (50 mM HEPES, pH 7.4, 150 mM NaCl, 15 mM MgCl2, 10% glycerol, 0.5% Triton X-100, 1 mM DTT, 20 mM β-glycerophosphate, 0.5 mM Na3VO4 and protease inhibitor cocktail). After 10 min of ice incubation, the cell suspension was centrifuged for 10 min at 12,000g at 4 °C and supernatant fraction was collected (total extract).
For cellular fractionation50, LNCaP cells transduced with shRNA were collected and lysed for 5 min in ice-cold NP-40 lysis buffer (10 mM Tris-HCl pH 7.5, 0.15% NP-40, 150 mM NaCl, 1 mM DTT, 20 mM β-glycerophosphate, 0.5 mM Na3VO4 and protease inhibitor cocktail). The lysate was layered onto a 24% (wt/vol) sucrose cushion and centrifuged for 10 min at 16,000g (4 °C). The supernatant (cytoplasmic fraction) was collected and boiled in Laemmli sample buffer. The nuclei pellet was gently rinsed with ice-cold PBS/1 mM EDTA and resuspended in a prechilled glycerol buffer (20 mM Tris-HCl pH 7.9, 75 mM NaCl, 0.5 mM EDTA, 0.85 mM DTT, 0.125 mM PMSF, 50% glycerol, 20 mM β-glycerophosphate, 0.5 mM Na3VO4 and protease inhibitor cocktail). An equal volume of cold nuclei lysis buffer (10 mM HEPES pH 7.6, 7.5 mM MgCl2, 0.2 mM EDTA, 0.3 M NaCl, 1 M urea, 1% NP-40, 1 mM DTT, 20 mM β-glycerophosphate, 0.5 mM Na3VO4 and protease inhibitor cocktail) was added, and the sample was gently vortexed twice for 2 s. After standing in ice for 2 min, the sample was centrifuged for 2 min at 16,000g (4 °C). The supernatant (nucleoplasmic fraction) was collected and boiled in Laemmli sample buffer. The chromatin pellet was gently rinsed with cold PBS/1 mM EDTA, dissolved in cold nuclei lysis buffer and, after a brief sonication, centrifuged at 16,000g for 2 min (4 °C). The supernatant (chromatin fraction) was collected and boiled in Laemmli sample buffer.
For polysomal fractionation59, LNCaP cells were homogenized in lysis buffer (100 mM NaCl, 10 mM MgCl2, 30 mM Tris-HCl pH 7.5, 1 mM DTT, 30 U ml−1 RNasin, 1% Triton X-100 and protease inhibitor cocktail). After 10 min of incubation on ice, the lysate was centrifuged for 10 min at 12,000g (4 °C). Protein extract (1 mg) was sedimented on continuous sucrose gradients (15–50%) for 2 h at 200,000g (4 °C). The gradient was collected in ten fractions (1 ml), and RNA was extracted by the phenol/chloroform method. Alternative polyadenylation isoforms were analyzed by sqPCR using the primers listed in Supplementary Table 3.
UV-crosslinked and RNA immunoprecipitation (CLIP) experiments
For CLIP experiments32, LNCaP cells transduced with the indicated shRNA were UV-irradiated on ice (400 mJ cm−2) in PBS and collected by scraping in CLIP lysis buffer (50 mM Tris pH 8, 100 mM NaCl, 1 mM MgCl2, 0.1 mM CaCl2, 1% NP-40, 0.1% SDS, 0.5 mM Na3VO4, 1 mM DTT, protease inhibitor cocktail and 30 U ml−1 RNasin (Promega)). After brief sonication, the samples were incubated with RNase-free DNaseI (New England Biolabs) for 3 min at 37 °C, centrifuged at 15,000g for 3 min at 4 °C, and the supernatant was quantified with the Bio-Rad protein assay dye (Bio-Rad). Next, 10% of cell extract (0.1 mg) was collected (input), and 1 mg ml−1 of extract was immunoprecipitated using 3 μg of the indicated antibodies, or IgGs as negative control, in the presence of protein G Dynabeads (Thermo Fisher Scientific and Invitrogen) and 10 μl of RNaseI (Ambion) diluted 1:1,000. After 2 h of incubation, the samples were washed and treated for 1 h with Proteinase K (50 μg) at 55 °C. RNA was isolated according to standard procedures, and retrotranscribed with random primers. RNA was quantified by qPCR and represented as a percentage (%) of input. The primers used are listed in Supplementary Table 3.
Antibodies
The following antibodies were used: Sam68 (Bethyl Laboratories, cat. no. A302-110A), XRN2 (Bethyl Laboratories, cat. no. A301-103A), MYC (Cell Signaling, cat. no. 9402), β-actin (Merck, Sigma-Aldrich, cat. no. A2066), CPSF160 (Bethyl Laboratories, cat. no. A301-580A), CPSF100 (Novus, cat. no. NB100-79823), CPSF73 (Bethyl Laboratories, cat. no. A301-091A), CPSF30 (Novus, cat. no. NB100-79826), WDR33 (Bethyl Laboratories, cat. no. A301-152A), CFIM68 (Bethyl Laboratories, cat. no. A301-358A), CSTF50 (Bethyl Laboratories, cat. no. A301-250A), CSTF64 (Bethyl Laboratories, cat. no. A301-092A), PCF11 (Bethyl Laboratories, cat. no. A303-706A), POLR2A (Cell Signaling, cat. no. 14958), H3 (Abcam, cat. no. ab1791), MCM10 (Bethyl Laboratories, cat. no. A300-131A), ORC2 (Bethyl Laboratories, cat. no. A302-734A), Lamin B1 (Santa Cruz, cat. no. sc-30264), GFP (Santa Cruz, cat. no. sc-9996), Flag (Merck, Sigma-Aldrich, cat. no. F3165), BrdU (BD Biosciences, cat. no. 347580) and Alexa-488 (Thermo Fisher Scientific, cat. no. A-11001).
Bioinformatic analysis
Tumor Prostate Cancer dataset analysis was carried out utilizing Jenkins (GSE46691), Sawyers (GSE21034) and Sueltman (GSE29079) published datasets41,42,43, as described in ref. 32. Gene expression data for correlation analyses were downloaded from the R2 genomics analysis and visualization platform (http://r2.amc.nl). Pearson’s correlation was used to evaluate the association between Sam68 and XRN2, or XRN2 and MYC, expression. For gene expression analyses, patients with PC were divided into two groups according to the median of Sam68, or MYC, gene expression. Then, the Z-scores value of XRN2 was calculated for each sample and the Mann–Whitney test was used to establish the significance of XRN2 expression level between the two groups.
3′READS analysis of LNCaP silenced for Sam68 and XRN2 was performed as described in ref. 48. Reads were mapped to the human (hg19) genome.
For the gene metaprofile, Sam68 CLIP-seq beds files were downloaded from GSE85164 and converted to bam files using the bedtools bedToBam function (https://bedtools.readthedocs.io/en/latest/content/tools/bedtobam.html). The generated bam files were used to calculate the normalized read density (RPM/bp), fitting a smoothing spline across the gene body (from TSS to TES), 2-kb upstream and downstream flanking regions of human (hg19) genes using ngs.plot (https://github.com/shenlab-sinai/ngsplot).
Analysis for AAUAAA frequency was computed by defining the ±100-nt genomic region surrounding each pA as the pA region, using custom R script. Nucleotide frequency was calculated within the ±100-nt genomic region surrounding each pA using the Biostrings R package. K-mer (6 nt) enrichment analyses were carried out in four subregions (−100 to −41, −40 to −1, +1 to +40 and +41 to +100 nt) using R custom script. P values for the comparison of upregulated versus unregulated or downregulated versus unregulated genes were based on the Fisher’s exact test. Gene ontology enrichment was performed using the TopGO package and plotted using the ggplot2 package in R. Ontologies were considered as enriched for adjusted P values of ≤0.05 (Fisher’s exact test).
Prostate Adenocarcinoma (TGCA, PanCancer Atlas, 494 samples) gene expression data (mRNA) and clinical data (Progression-Free Survival) were downloaded from cBioPortal (https://www.cbioportal.org/) and used for Kaplan–Meier analysis. Patient groups were compared using the median cutoff modus and P values calculated with the Gehan–Breslow–Wilcoxon test in GraphPad Prism 8 software.
Quantification and statistical analysis
Densitometric analyses of both western-blot films and agarose gels were performed using ImageJ 1.51g software. Statistical significance was calculated by an unpaired Student’s t-test (two-sided) on at least three independent experiments, unless otherwise specified. When exact P values are not indicated, they are represented as follows: *P ≤ 0.05, **P < 0.01, ***P < 0.001; NS, not significant.
Reporting summary
Further information on research design is available in the Nature Research Reporting Summary linked to this Article.
Extended Data
Extended Data Fig. 1: XRN2 physically interacts with Sam68 (Related to Fig. 1).
From: The transcriptional terminator XRN2 and the RNA-binding protein Sam68 link alternative polyadenylation to cell cycle progression in prostate cancer
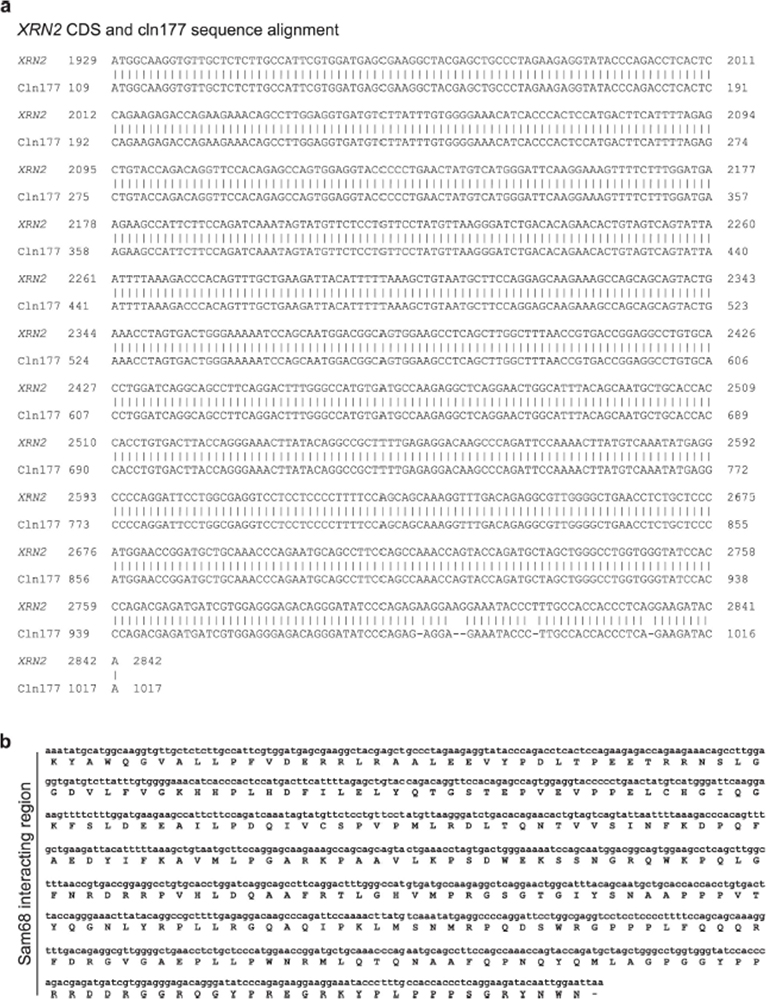
a, Nucleotide sequence alignment between XRN2 (CCDS 13144.1, GRCh38.p13) and Clone 177 (Cln177) retrieved from the two-hybrid screen. b, Nucleotide and aminoacid sequence of the region of interaction of XRN2 with Sam68 identified by the two-hybrid screen.
Extended Data Fig. 2: XRN2 physically interacts with Sam68 (Related to Fig. 1).
From: The transcriptional terminator XRN2 and the RNA-binding protein Sam68 link alternative polyadenylation to cell cycle progression in prostate cancer
a,b, Western blot (WB) analysis and Coomassie blue staining of the GST pull-down assay (n = 2) performed using LNCaP nuclear extracts (N.E.) in presence of GST-Sam68 full-length (a) and deletion mutants (b). GST was used as negative control (a,b). A scheme of GST-Sam68 fusion proteins is also shown (b).
Extended Data Fig. 3: XRN2 and Sam68 expression are positively correlated in PC (Related to Fig. 2).
From: The transcriptional terminator XRN2 and the RNA-binding protein Sam68 link alternative polyadenylation to cell cycle progression in prostate cancer
a-d, Pearson’s correlation between XRN2 and sam68 expression (a,c) and XRN2 expression in sam68low (blue circles) and Sam68high (red squares) patient groups (b,d) retrieved from Sawyers (GSE2104) (a,b) and Sueltman (GSE29079) (c,d) datasets. Pearson’s correlation coefficient (r) (two-sided) and the p-values(P) are reported (95% confidence interval) (a,c). In b and d statistical significance was calculated by Mann-Whitney test (two-sided) and the p-values are reported (95% confidence interval). e, Scatter-plot analysis showing the positive correlation (R2 = 0.887) between the expressicn of XRN2 and Sam68 proteins in PC specimens.
Extended Data Fig. 4: XRN2 and MYC expression are correlated in PC (Related to Fig. 3).
From: The transcriptional terminator XRN2 and the RNA-binding protein Sam68 link alternative polyadenylation to cell cycle progression in prostate cancer
a-d, Pearson’s correlation between XRN2 and MYC expression (a,c) and distribution of XRN2 expression in MYClow (blue circles) and, MYChigh (redsquares) groups (b,d) retrieved from Sawyers (GSE21034) (a,b) and Sueltman (GSE29079) (c,d) datasets. Pearson’s correlation coefficient (r) (two-sided) and the p-values (P) of the correlation (95% confidence interval) were reported in a and c panels. In b and d statistical significance was calculated by Mann-Whitney test (two-sided) and the p-values are reported (95% confidence interval). e, UCSC Genome Browser snapshot of RNAPII. H3K27AC and H3K4Me3 ChIP-seq profiles surrounding the TSS of the XKN2 gene. RNAPII (POLR2A). MYC and MAX binding regions are indicated (dark box), f, Schematic representation of the putative XRN2 promoter doned upstream of the luciferase-bosed report pGL3-basic plasmid. The putative MYC binding site (E-box) is indicated in bold. g, Bar graph (left panel) represents ludferase activity of AT?, V2 promoter compared to an intergen ic region (intergen ic). used as negative control. The hiaferase assay was performed in 293 T cells transfected, or not (empty vector. EV), with MYC-pCDNA3 vector (MYC). h,i, qPCR (h) and Western blot (I) analyses of MYC, XRN2 and Sam68 expression in LNCaP and 22Rv1 PC cells lines transfected with Control (si-scr#2) and MYC (si-MYC42) siRNAs. The expression was reported as fold enrichment (AACq) of Histone 3. g-i, Data represent mean i SD of three biological replicates. Statistical significance was calculated by unpaired Student’s t-test (two-sided). In g, the p-values are: intergenic P = 0.686, XRN2 P = 9.6 × 10⁻⁶. In h: MYC/LNCaP P = 2 × 10⁻⁴, MYC/22Rv1 P = 5.1 × 10⁻³, XRN2/LNCaP P = 1.5 × 10⁻³, XRN2/22Rv1 P = 2.7 × 10⁻³. Sam68/LNCaP P = 8.4 × 10⁻⁸, Sam68/22Rv1 P =3.1 × 10⁻³). In the representation of panels, statistical value is reported as ** P < 0.01; *** P < 0.001; n.s. not significant.
Extended Data Fig. 5:
Genome-wide regulation of APA by XRN2 and Sam68 in PC cells (Related to Fig. 4).
From: The transcriptional terminator XRN2 and the RNA-binding protein Sam68 link alternative polyadenylation to cell cycle progression in prostate cancer
a, Representative Western-blot analysis of LNCaP cells transfected twice with control (si-Scr), Sam68 (si-Sam68) and XRN2 (si-XRN2) siRNAs. β-actin was used as loading control (n = 3). b, Principal Component Analysis showing variance of 3’READS data from two biological replicates. The red circles, green triangles and blue squares represent pA selection data in control, Sam68 and XRN2 silenced cells, respectively. The proportion of variance (%) for both the first and second principal components is reported, c, 3’READS sample distance analysis. The heatmap show the Euclidean distances between samples. Dendrogram of clustering results are also shown, d, Venn diagram showing the overlap between common regulated genes undergoing to expression (GE) or APA changes in absence of Sam68 (si-Sam68) and XRN2 (si-XRN2) (ns: not significant, modified Fisher’s test), e, Representative 3’RACE PCR analysis (n = 2) of four genes (RCC2, SCAMP2, LAMC1, CD164) undergoing UTR lengthening in absence of Sam68 and XRN2. Downregulated and up-regulated pAsare indicated in orange and purple, respectively.
Extended Data Fig. 6: Genome-wide regulation of APA by XRN2 and Sam68 in PC cells (Related to Fig. 4).
From: The transcriptional terminator XRN2 and the RNA-binding protein Sam68 link alternative polyadenylation to cell cycle progression in prostate cancer
a,b, Representative Western blot analysis of LNCaP cells transiently (a) or stably (b) depleted for Sam68 and XRN2 (n = 3). β-actin was used as loading control, c-e, Bar graphs showing qRT-PCR analyses of pA usage evaluated in 24 representative genes undergoing APA regulation in LNCaP cells treated as in a and b. Fold change of d-pA relative to p-pA was calculated by the ΔCq method. In e, unvalidated genes are shown. Data represent mean ± SD of three biological replicates (c-e). In c-e, statistical significance was calculated by unpaired Student’s t-test, two-sided (exact p-values reported in source data). In the representation of panels, statistical value is reported as * P < 0.05; ** P < 0.01; *** P < 0.001. UCSC genome browser tracks showing APA regulation for each event analyzed is also shown on the right side of each graph. Purple and orange boxes indicate up- and down-regulated events, respectively.
Extended Data Fig. 7: Sam68 and XRN2 globally modulate pA selection in the 3’UTR of target transcripts (Related to Fig. 5).
From: The transcriptional terminator XRN2 and the RNA-binding protein Sam68 link alternative polyadenylation to cell cycle progression in prostate cancer
a. Representative Western blot and densitometric (bar graphs) analyses of nuclear matrix subcellular fraction isolated in control (sh-scr), Sam68 (sh-Sam68) and XRN2 (sh-XRN2) stably depleted LNCaP cells. Lamin β−1 was used as loading control, b, Bar graphs showing qPCR analysis of pA usage evaluated in three genes undergoing 3’UTR-APA regulation in cells knocked down for XRN2 targeting 3’UTR (sh-XRN2-3’UTR) and transfected with empty vector (EV), XRN2 wild-type (WT) and catalytically-death mutant (D235A). LNCaP cells stably depleted with sh targeting CDS (sh-XRN2) were used as control. Fold change of distal (d-pA) relative to the proximal pA (p-pA) in the 3’UTR was calculated by the ΔCq method. c, CLIP assays performed in LNCaP cells stably depleted for XRN2 (sh-XRN2) using Sam68 antibody or IgGs, as negative control. RNA associated with Sam68 was quantified by qPC R using primers located upstream of regulated and non-regulated pAs and represented as percentage (%) of input, d, Bar graph showing the qPCR analysis of 4sU-IabeIed RNA isolated from LNCaP cells stably transduced with control (sh-scr) and XRN2 (sh-XRN2) shRNAs. Labeled RNA is represented as percentage (%) of total RNA used for the assay (input). e, CLIP assays performed in LNCaP cells transfected as in b using Sam68 antibody or IgGs, as negative control. RNA associated with Sam68 was reported as in c. a-e. Data represent mean ± SD of three biological replicates. Statistical significance was calculated by unpaired Student’s t-test (two-sided). In panels a,c and b,e the exact p-value is reported in figure and source data, respectively. When not indicated (b,e), p-values are reported as *P < 0.05; ** P < 0.01; ***P < 0.001; n.s.: not significant.
Extended Data Fig. 8: Sam68 and XRN2 represses strong, distal PAS (Related to Fig. 6).
From: The transcriptional terminator XRN2 and the RNA-binding protein Sam68 link alternative polvadenylation to cell cycle progression in prostate cancer
a, Changes of APA isoform abundance (ΔAbn) of genes presenting at least one regulated pA in LNCaP cells depleted for Sam68 (si-Sam68) or XRN2 (si-XRN2). Mean values (Mean) and number of events (n) are reported. Statistical significance was calculated by unpaired Student’s t-test (two-sided). The p-value is reported. In boxplot, band and box indicate the median and the 25–75th percentile, respectively. Whiskers indicate ±1.5x interquartile range, b, Frequency distribution of the U (upper panel) and C (lower panel) nucleotide in up- (purple line), down- (orange line) and un-regulated (black line) region between −100/+100nt from CS (0). c-e, Metagene analyses of CSTF64 (c), CPSF30 (d), and Sam68 (e) CLIP-binding profile with respect to CS (0) in upregulated (purple), downregulated (orange) and non-regulated (black) PASs. f, Scheme of wild-type (FLNB WT) and mutant (FLNB mut) nucleotide sequence surrounding FLNB distal PAS (highlighted in bold). The putative Sam68 binding sites (underline) and mutated bases (red) are indicated, g, RT-PCR (agarose gel) and qPCR (bar graph) analyses of pA usage of wild-type (WT) and mutant (Mut) FLNB minigene evaluated in LNCaP cells transfected, or not, with Sam68-GFP plasmid. Representative Western blot of protein expression is also shown, h, Western blot analysis of RNA-pulldown assay performed using biotin-labeled FLNB WT or Mut RNA. Streptavidin beads were used as control (−) (n = 1). i,j, CLIP assays performed in sh-Sam68 and sh-XRN2 LNCaP cells using CPSF30 antibody. IgG was used as negative control. FLNB and SCARB2 RNA associated with CPSF30 (i) or CSTF64 (j) factors was quantified by qPCR and represented as percentage (%) of input. In g,i j, statistical significance was calculated by unpaired Student’s t-test, two-sided (n = 3). In g, WT(Sam68-GFP/EV) P= 1.4 × 10⁻³, Mut(Sam68-GFP/EV) P = 0.777, WT Sam68-GFP/Mut Sam68-GFP P = 9.0 × 10⁻³; in i, FLNB: CPSF30(sh-Sam68/sh-scr) P = 5.0 × 10⁻⁴, CPSF30(sh-XRN2/sh-scr) P = 9.0 × 10⁻⁴, SCARB2: CPSF30(sh-Sam68/sh-scr) P = 1.0 × 10⁻⁴, CPSF30(sh-XRN2/sh-scr) P = 9.0 × 10⁻⁴; in j, FLNB downreg: CSTF64(sh-Sam68/sh-scr) P = 0.1999, CSTF64(sh-XRN2/sh-scr) P = 0.2830; FLNB upreg: CSTF64(sh-Sam68/sh-scr) P = 3.1 ×10⁻³, CSTF64(sh-XRN2/sh-scr) P = 0.043; SCARB2 downreg: CSTF64(sh-Sam68/sh-scr) P = 0.4242, CSTF64(sh-XRN2/sh-scr) P = 0.4723; SCARB2 upreg: CSTF64(sh-Sam68/sh-scr) P = 1.0 × 10⁻⁴, CSTF64(sh-XRN2/sh-scr) P = 0.0468). In the representation of panels, statistical value is reported as *P < 0.05; **P < 0.01; ***p < 0.001; n.s. not significant.
Extended Data Fig. 9: XRN2 and SAM68 promotes cell cycle progression through APA modulation (Related to Fig. 7).
From: The transcriptional terminator XRN2 and the RNA-binding protein Sam68 link alternative polvadenvlation to cell cycle progression in prostate cancer
a,b, Cell cycle (a) and sub-Gl (b) distribution assessed by PI staining in asynchronous LNCaP cells stably depleted for Sam68 and XRN2. c, Cell cycle distribution assessed by PI staining in asynchronous LNCaP cells stably depleted for MCM10 and ORC2. a-c, Data represent mean ± SD of three biological replicates. Statistical significance was calculated by unpaired Student’s t-test, two-sided. In a, the p-values are: Gl: sh-Sam68/sh-scr P = 2.2 × 10⁻³, sh-XRN2/sh-scr P = 8.6 × 10⁻³; S: sh-Sam68/sh-scr P = 2.0 × 10⁻⁴, sh-XRN2/sh-scr P = 1.2 × 10⁻³; G2-M: sh-Sam68/sh-scr P = 0.037, sh-XRN2/sh-scr P = 0.036; in b, sh-Sam68,/sh-scr P = 0.2264, sh-XRN2/sh-scr P = 0.6388; in C, Gl: si-MCM10/si-scr P = 2.6 × 10⁻⁶, si-ORC2/si-scr P = 3.6 × 10⁻³; S: si-MCMIO/si-scr P = 3.0 × 10⁻⁴, si-ORC2/si-scr P = 0.1679; G2-M: si-MCMlO/si-scr P = 2 × 10⁻⁴, si-ORC2/si-scr P = 0.0917). In the representation of panels, statistical value is reported as *P < 0.05; **P < 0.01; ***P < 0.001.
Supplementary Material
Acknowledgements
We thank all members of Sette’s laboratory for fruitful discussions throughout this study. The research reported in this paper was supported by Ministero della Salute ‘Ricerca Finalizzata 2011’ (GR-2011-02348423 to P.B.) and ‘Ricerca Finalizzata 2016’ (RF-2016-02363460 to C.S.), by the Associazione Italiana Ricerca sul Cancro (AIRC IG23416 to C.S.), Ministero della Salute – Ricerca Corrente 2021 and 2022 to IRCCS Fondazione Policlinico Gemelli, and by the National Institutes of Health (GM084089 and GM129069 to B.T.). We acknowledge financial support from the Università Cattolica del Sacro Cuore (UCSC) for the execution and publication of this study.
Footnotes
Ethics declarations
Competing interests
The authors declare no competing interests.
Code availability
Code used to analyze the 3′READS-seq is available at https://github.com/DinghaiZ/3-prime-READS-plus.
Data availability
The sequencing data generated in this study are deposited in the Gene Expression Omnibus at GSE198872. Public sequencing data used in this study are deposited under GSE37401(https://doi.org/10.1016/j.celrep.2012.05.003)54, GSE85164(https://doi.org/10.1038/nature21715)45, GSE46691(https://doi.org/10.1371/journal.pone.0066855) 41, GSE29079(https://doi.org/10.1186/1471-2407-11-507)43 and GSE21034(https://doi.org/10.1016/j.ccr.2010.05.026)42. Prostate adenocarcinoma (TGCA, PanCancer Atlas, 494 samples) gene expression data (mRNA) and clinical data (Progression-Free Survival) were downloaded from cBioPortal (https://www.cbioportal.org/study/summary?id=prad_tcga_pan_can_atlas_2018). Source data are provided with this paper.
References
- 1.Proudfoot NJ Transcriptional termination in mammals: stopping the RNA polymerase II juggernaut. Science 352, aad9926 (2016). [DOI] [PMC free article] [PubMed] [Google Scholar]
- 2.Tian B & Manley JL Alternative polyadenylation of mRNA precursors. Nat. Rev. Mol. Cell Biol. 18, 18–30 (2017). [DOI] [PMC free article] [PubMed] [Google Scholar]
- 3.Tian B & Graber JH Signals for pre-mRNA cleavage and polyadenylation. Wiley Interdiscip. Rev. RNA 3, 385–396 (2012). [DOI] [PMC free article] [PubMed] [Google Scholar]
- 4.Elkon R, Ugalde AP & Agami R Alternative cleavage and polyadenylation: extent, regulation and function. Nat. Rev. Genet. 14, 496–506 (2013). [DOI] [PubMed] [Google Scholar]
- 5.Zhu Y et al. Molecular mechanisms for CFIm-mediated regulation of mRNA alternative polyadenylation. Mol. Cell 69, 62–74 (2018). [DOI] [PMC free article] [PubMed] [Google Scholar]
- 6.Derti A et al. A quantitative atlas of polyadenylation in five mammals. Genome Res. 22, 1173–1183 (2012). [DOI] [PMC free article] [PubMed] [Google Scholar]
- 7.Hwang HW et al. PAPERCLIP identifies microRNA targets and a role of CstF64/64tau in promoting non-canonical poly(A) site usage. Cell Rep. 15, 423–435 (2016). [DOI] [PMC free article] [PubMed] [Google Scholar]
- 8.Venkataraman K, Brown KM & Gilmartin GM Analysis of a noncanonical poly(A) site reveals a tripartite mechanism for vertebrate poly(A) site recognition. Genes Dev. 19, 1315–1327 (2005). [DOI] [PMC free article] [PubMed] [Google Scholar]
- 9.Schwich OD et al. SRSF3 and SRSF7 modulate 3′UTR length through suppression or activation of proximal polyadenylation sites and regulation of CFIm levels. Genome Biol.22, 82 (2021). [DOI] [PMC free article] [PubMed] [Google Scholar]
- 10.Chatrikhi R et al. RNA binding protein CELF2 regulates signal-induced alternative polyadenylation by competing with enhancers of the polyadenylation machinery. Cell Rep. 28, 2795–2806 (2019). [DOI] [PMC free article] [PubMed] [Google Scholar]
- 11.Naro C et al. Functional interaction between U1snRNP and Sam68 insures proper 3′ end pre-mRNA processing during germ cell differentiation. Cell Rep. 26, 2929–2941 (2019). [DOI] [PubMed] [Google Scholar]
- 12.Kaida D et al. U1 snRNP protects pre-mRNAs from premature cleavage and polyadenylation. Nature 468, 664–668 (2010). [DOI] [PMC free article] [PubMed] [Google Scholar]
- 13.Jenal M et al. The poly(A)-binding protein nuclear 1 suppresses alternative cleavage and polyadenylation sites. Cell 149, 538–553 (2012). [DOI] [PubMed] [Google Scholar]
- 14.Nazim M et al. Competitive regulation of alternative splicing and alternative polyadenylation by hnRNP H and CstF64 determines acetylcholinesterase isoforms. Nucleic Acids Res. 45, 1455–1468 (2017). [DOI] [PMC free article] [PubMed] [Google Scholar]
- 15.Kyburz A, Friedlein A, Langen H & Keller W Direct interactions between subunits of CPSF and the U2 snRNP contribute to the coupling of pre-mRNA 3′ end processing and splicing. Mol. Cell 23, 195–205 (2006). [DOI] [PubMed] [Google Scholar]
- 16.Millevoi S et al. An interaction between U2AF 65 and CF I(m) links the splicing and 3′ end processing machineries. EMBO J. 25, 4854–4864 (2006). [DOI] [PMC free article] [PubMed] [Google Scholar]
- 17.Gruber AJ & Zavolan M Alternative cleavage and polyadenylation in health and disease. Nat. Rev. Genet. 20, 599–614 (2019). [DOI] [PubMed] [Google Scholar]
- 18.Sandberg R, Neilson JR, Sarma A, Sharp PA & Burge CB Proliferating cells express mRNAs with shortened 3′ untranslated regions and fewer microRNA target sites. Science 320, 1643–1647 (2008). [DOI] [PMC free article] [PubMed] [Google Scholar]
- 19.Singh P et al. Global changes in processing of mRNA 3′ untranslated regions characterize clinically distinct cancer subtypes. Cancer Res. 69, 9422–9430 (2009). [DOI] [PMC free article] [PubMed] [Google Scholar]
- 20.Xia Z et al. Dynamic analyses of alternative polyadenylation from RNA-seq reveal a 3′-UTR landscape across seven tumour types. Nat. Commun. 5, 5274 (2014). [DOI] [PMC free article] [PubMed] [Google Scholar]
- 21.Gruber AJ et al. Discovery of physiological and cancer-related regulators of 3′ UTR processing with KAPAC. Genome Biol. 19, 44 (2018). [DOI] [PMC free article] [PubMed] [Google Scholar]
- 22.Lee SH et al. Widespread intronic polyadenylation inactivates tumour suppressor genes in leukaemia. Nature 561, 127–131 (2018). [DOI] [PMC free article] [PubMed] [Google Scholar]
- 23.Masamha CP et al. CFIm25 links alternative polyadenylation to glioblastoma tumour suppression. Nature 510, 412–416 (2014). [DOI] [PMC free article] [PubMed] [Google Scholar]
- 24.Elkon R et al. E2F mediates enhanced alternative polyadenylation in proliferation. Genome Biol. 13, R59 (2012). [DOI] [PMC free article] [PubMed] [Google Scholar]
- 25.Van Etten JL et al. Targeting a single alternative polyadenylation site coordinately blocks expression of androgen receptor mRNA splice variants in prostate cancer. Cancer Res. 77, 5228–5235 (2017). [DOI] [PMC free article] [PubMed] [Google Scholar]
- 26.Attard G et al. Prostate cancer. Lancet 387, 70–82 (2016). [DOI] [PubMed] [Google Scholar]
- 27.Phillips JW et al. Pathway-guided analysis identifies Myc-dependent alternative pre-mRNA splicing in aggressive prostate cancers. Proc. Natl Acad. Sci. USA 117, 5269–5279 (2020). [DOI] [PMC free article] [PubMed] [Google Scholar]
- 28.Zhang D et al. Intron retention is a hallmark and spliceosome represents a therapeutic vulnerability in aggressive prostate cancer. Nat. Commun. 11, 2089 (2020). [DOI] [PMC free article] [PubMed] [Google Scholar]
- 29.Li L et al. 3′UTR shortening identifies high-risk cancers with targeted dysregulation of the ceRNA network. Sci. Rep. 4, 5406 (2014). [DOI] [PMC free article] [PubMed] [Google Scholar]
- 30.Burd CJ et al. Cyclin D1b variant influences prostate cancer growth through aberrant androgen receptor regulation. Proc. Natl Acad. Sci. USA 103, 2190–2195 (2006). [DOI] [PMC free article] [PubMed] [Google Scholar]
- 31.David CJ, Chen M, Assanah M, Canoll P & Manley JL HnRNP proteins controlled by c-Myc deregulate pyruvate kinase mRNA splicing in cancer. Nature 463, 364–368 (2010). [DOI] [PMC free article] [PubMed] [Google Scholar]
- 32.Caggiano C, Pieraccioli M, Panzeri V, Sette C & Bielli P c-MYC empowers transcription and productive splicing of the oncogenic splicing factor Sam68 in cancer. Nucleic Acids Res. 47, 6160–6171 (2019). [DOI] [PMC free article] [PubMed] [Google Scholar]
- 33.Paronetto MP et al. Alternative splicing of the cyclin D1 proto-oncogene is regulated by the RNA-binding protein Sam68. Cancer Res. 70, 229–239 (2010). [DOI] [PMC free article] [PubMed] [Google Scholar]
- 34.Stockley J et al. The RNA-binding protein Sam68 regulates expression and transcription function of the androgen receptor splice variant AR-V7. Sci. Rep. 5, 13426 (2015). [DOI] [PMC free article] [PubMed] [Google Scholar]
- 35.La Rosa P et al. Sam68 promotes self-renewal and glycolytic metabolism in mouse neural progenitor cells by modulating Aldh1a3 pre-mRNA 3′-end processing. eLife 5, e20750 (2016). [DOI] [PMC free article] [PubMed] [Google Scholar]
- 36.Iijima Y et al. SAM68-specific splicing is required for proper selection of alternative 3′ UTR isoforms in the nervous system. iScience 22, 318–335 (2019). [DOI] [PMC free article] [PubMed] [Google Scholar]
- 37.Bielli P, Busa R, Paronetto MP & Sette C The RNA-binding protein Sam68 is a multifunctional player in human cancer. Endocr. Relat. Cancer 18, R91–R102 (2011). [DOI] [PubMed] [Google Scholar]
- 38.Bielli P et al. The transcription factor FBI-1 inhibits SAM68-mediated BCL-X alternative splicing and apoptosis. EMBO Rep. 15, 419–427 (2014). [DOI] [PMC free article] [PubMed] [Google Scholar]
- 39.Busa R et al. The RNA-binding protein Sam68 contributes to proliferation and survival of human prostate cancer cells. Oncogene 26, 4372–4382 (2007). [DOI] [PubMed] [Google Scholar]
- 40.Rajan P et al. The RNA-binding and adaptor protein Sam68 modulates signal-dependent splicing and transcriptional activity of the androgen receptor. J. Pathol. 215, 67–77 (2008). [DOI] [PubMed] [Google Scholar]
- 41.Jenkins RB, Qian J, Lieber MM & Bostwick DG Detection of c-myc oncogene amplification and chromosomal anomalies in metastatic prostatic carcinoma by fluorescence in situ hybridization. Cancer Res. 57, 524–531 (1997). [PubMed] [Google Scholar]
- 42.Taylor BS et al. Integrative genomic profiling of human prostate cancer. Cancer Cell 18, 11–22 (2010). [DOI] [PMC free article] [PubMed] [Google Scholar]
- 43.Brase JC et al. TMPRSS2-ERG-specific transcriptional modulation is associated with prostate cancer biomarkers and TGF-β signaling. BMC Cancer 11, 507 (2011). [DOI] [PMC free article] [PubMed] [Google Scholar]
- 44.Sathianathen NJ, Konety BR, Crook J, Saad F & Lawrentschuk N Landmarks in prostate cancer. Nat. Rev. Urol. 15, 627–642 (2018). [DOI] [PubMed] [Google Scholar]
- 45.Aktas T et al. DHX9 suppresses RNA processing defects originating from the Alu invasion of the human genome. Nature 544, 115–119 (2017). [DOI] [PubMed] [Google Scholar]
- 46.Eaton JD et al. Xrn2 accelerates termination by RNA polymerase II, which is underpinned by CPSF73 activity. Genes Dev. 32, 127–139 (2018). [DOI] [PMC free article] [PubMed] [Google Scholar]
- 47.Nimura K et al. Regulation of alternative polyadenylation by Nkx2-5 and Xrn2 during mouse heart development. eLife 5, e16030 (2016). [DOI] [PMC free article] [PubMed] [Google Scholar]
- 48.Hoque M et al. Analysis of alternative cleavage and polyadenylation by 3′ region extraction and deep sequencing. Nat. Methods 10, 133–139 (2013). [DOI] [PMC free article] [PubMed] [Google Scholar]
- 49.Herzel L, Ottoz DSM, Alpert T & Neugebauer KM Splicing and transcription touch base: co-transcriptional spliceosome assembly and function. Nat. Rev. Mol. Cell Biol. 18, 637–650 (2017). [DOI] [PMC free article] [PubMed] [Google Scholar]
- 50.Pandya-Jones A & Black DL Co-transcriptional splicing of constitutive and alternative exons. RNA 15, 1896–1908 (2009). [DOI] [PMC free article] [PubMed] [Google Scholar]
- 51.Tang P et al. Alternative polyadenylation by sequential activation of distal and proximal PolyA sites. Nat. Struct. Mol. Biol. 29, 21–31 (2022). [DOI] [PubMed] [Google Scholar]
- 52.Fong N et al. Effects of transcription elongation rate and Xrn2 exonuclease activity on RNA polymerase II termination suggest widespread kinetic competition. Mol. Cell 60, 256–267 (2015). [DOI] [PMC free article] [PubMed] [Google Scholar]
- 53.Shi Y Alternative polyadenylation: new insights from global analyses. RNA 18, 2105–2117 (2012). [DOI] [PMC free article] [PubMed] [Google Scholar]
- 54.Martin G, Gruber AR, Keller W & Zavolan M Genome-wide analysis of pre-mRNA 3′ end processing reveals a decisive role of human cleavage factor I in the regulation of 3′ UTR length. Cell Rep. 1, 753–763 (2012). [DOI] [PubMed] [Google Scholar]
- 55.Galarneau A & Richard S The STAR RNA binding proteins GLD-1, QKI, SAM68 and SLM-2 bind bipartite RNA motifs. BMC Mol. Biol. 10, 47 (2009). [DOI] [PMC free article] [PubMed] [Google Scholar]
- 56.Feracci M et al. Structural basis of RNA recognition and dimerization by the STAR proteins T-STAR and Sam68. Nat. Commun. 7, 10355 (2016). [DOI] [PMC free article] [PubMed] [Google Scholar]
- 57.Baxley RM & Bielinsky AK Mcm10: a dynamic scaffold at eukaryotic replication forks. Genes (Basel) 8, 73 (2017). [DOI] [PMC free article] [PubMed] [Google Scholar]
- 58.Da-Silva LF & Duncker BP ORC function in late G1: maintaining the license for DNA replication. Cell Cycle 6, 128–130 (2007). [DOI] [PubMed] [Google Scholar]
- 59.Paronetto MP et al. Sam68 regulates translation of target mRNAs in male germ cells, necessary for mouse spermatogenesis. J. Cell Biol. 185, 235–249 (2009). [DOI] [PMC free article] [PubMed] [Google Scholar]
- 60.Labbe DP & Brown M Transcriptional regulation in prostate cancer. Cold Spring Harb. Perspect. Med. 8, a030437 (2018). [DOI] [PMC free article] [PubMed] [Google Scholar]
- 61.Brumbaugh J et al. Nudt21 controls cell fate by connecting alternative polyadenylation to chromatin signaling. Cell 172, 106–120 (2018). [DOI] [PMC free article] [PubMed] [Google Scholar]
- 62.Li W et al. Alternative cleavage and polyadenylation in spermatogenesis connects chromatin regulation with post-transcriptional control. BMC Biol. 14, 6 (2016). [DOI] [PMC free article] [PubMed] [Google Scholar]
- 63.Yao C et al. Transcriptome-wide analyses of CstF64-RNA interactions in global regulation of mRNA alternative polyadenylation. Proc. Natl Acad. Sci. USA 109, 18773–18778 (2012). [DOI] [PMC free article] [PubMed] [Google Scholar]
- 64.Oh JM et al. U1 snRNP regulates cancer cell migration and invasion in vitro. Nat. Commun. 11, 1 (2020). [DOI] [PMC free article] [PubMed] [Google Scholar]
- 65.Morris AR et al. Alternative cleavage and polyadenylation during colorectal cancer development. Clin. Cancer Res. 18, 5256–5266 (2012). [DOI] [PubMed] [Google Scholar]
- 66.Garcia-Gutierrez L, Delgado MD & Leon J MYC oncogene contributions to release of cell cycle brakes. Genes (Basel) 10, 244 (2019). [DOI] [PMC free article] [PubMed] [Google Scholar]
- 67.Bennett CF, Krainer AR & Cleveland DW Antisense oligonucleotide therapies for neurodegenerative diseases. Annu. Rev. Neurosci. 42, 385–406 (2019). [DOI] [PMC free article] [PubMed] [Google Scholar]
Associated Data
This section collects any data citations, data availability statements, or supplementary materials included in this article.
Supplementary Materials
Data Availability Statement
The sequencing data generated in this study are deposited in the Gene Expression Omnibus at GSE198872. Public sequencing data used in this study are deposited under GSE37401(https://doi.org/10.1016/j.celrep.2012.05.003)54, GSE85164(https://doi.org/10.1038/nature21715)45, GSE46691(https://doi.org/10.1371/journal.pone.0066855) 41, GSE29079(https://doi.org/10.1186/1471-2407-11-507)43 and GSE21034(https://doi.org/10.1016/j.ccr.2010.05.026)42. Prostate adenocarcinoma (TGCA, PanCancer Atlas, 494 samples) gene expression data (mRNA) and clinical data (Progression-Free Survival) were downloaded from cBioPortal (https://www.cbioportal.org/study/summary?id=prad_tcga_pan_can_atlas_2018). Source data are provided with this paper.


