

Abstract
Purpose:
Challenges in proton therapy include identifying patients most likely to benefit; ensuring consistent, high-quality plans as its adoption becomes more widespread; and recognizing biological uncertainties that may be related to increased relative biologic effectiveness driven by linear energy transfer (LET). Knowledge-based planning is a domain that may help to address all three.
Methods:
Artificial neural networks were trained using 117 unique treatment plans and associated dose and dose-weighted LET (LETD) distributions. The data set was split into training (n=82), validation (n=17), and test (n=18) sets. Model performance was evaluated on the test set using dose- and LETD-volume metrics in the clinical target volume (CTV) and nearby organs at risk and Dice similarity coefficients comparing predicted and planned isodose lines at 50%, 75%, and 95% of the prescription dose.
Results:
Dose-volume metrics significantly differed (α = 0.05) between predicted and planned dose distributions in only one dose-volume metric, D2% to the CTV. The maximum observed root mean square (RMS) difference between corresponding metrics was 4.3 GyRBE (8% of prescription) for D1cc to optic chiasm. Dice similarity coefficients were 0.90, 0.93, and 0.88 for the 50%, 75%, and 95% isodose lines, respectively. LETD-volume metrics significantly differed in all but one metric, L0.1cc of the brainstem. The maximum observed difference in RMS differences for LETD metrics was 1.0 keV/μm for L0.1cc to brainstem.
Conclusions:
We have devised the first three-dimensional dose and LETD prediction model for cranial proton radiation therapy. Dose accuracy compared favorably with that of previously published models in other treatment sites. The agreement in LETD supports future investigations with biological doses in mind to enable the full potential of knowledge-based planning in proton therapy.
Keywords: proton therapy, knowledge-based planning, neural networks, Al
1. INTRODUCTION
Proton radiation therapy is a promising treatment modality in the clinical management of malignancies. Compared to traditional x-ray radiation therapy, proton therapy can dramatically reduce the integral radiation dose to the patient. One challenge in the early adoption of proton therapy has been identifying the patients who will benefit most from this sparse resource. Although children are leading candidates, not all diseases are equally amenable to the benefits of proton dose distributions. Differences in diagnosis, body site, and even tumor shape affect whether the full dosimetric advantages of proton therapy can be captured. The extent to which those possibilities are realized is also highly dependent on the treatment planner’s skill level.
It is common to prospectively compare dosimetric plan quality of proton therapy to that of traditional x-ray therapy for patient referral or insurance pre-authorization. Although the prospective plan comparison provides case-specific evidence for the treatment delivery chosen, it comes at the cost of personnel resources required to plan with multiple modalities and potential delays in treatment that may compromise quality of care. In current practice, accomplishing the optimal balance among choosing the best treatment strategy for patients, providing sufficient evidence for financial differences in treatment options, and getting patients access to treatments in a timely manner is challenging.
Knowledge-based planning (KBP) provides strategies to prospectively predict clinically delivered dose distributions or dose-volume combinations in treatment planning contours1–4. The initial intent of KBP was to inform treatment planners of achievable doses to improve consistency in plan quality across patients. As KBP has expanded to multiple treatment modalities5,6, the potential for using the predictions to direct care has arisen7,8. Because KBP models can generate plan predictions from a set of features within seconds, it’s possible to get an initial estimate of differences between modalities without waiting the days required to prepare full treatment plans for comparison. KBP would also enable the clinical team to focus efforts on the chosen modality rather than committing the time to developing multiple treatment plans before choosing a modality. The benefits of improved clinical quality and consistency with the ease of portability and sharing of knowledge can bring an added benefit to the relatively young field of proton therapy. Proton therapy remains uncommon enough that it does not feature prominently in the clinical training curriculum of most physicists9, but yet the field is growing fast enough10 that there is a steady need for new physicists requiring knowledge transfer from those with prior experience.
Although clinical implementations have focused on DVH prediction, three-dimensional (3D) dose prediction utilizing artificial intelligence (AI) has been achieved for photon therapy4,11,12 and, to a lesser extent, for proton therapy13. Evaluating prospective plan quality from 3D dose predictions rather than DVH interpretations incorporates all the benefits of evaluating final plan quality from a 3D distribution instead of a DVH. Namely, the 3D distribution enables assessment of the spatial distribution of the dose that is otherwise collapsed into the simplified 2D DVH plot. The uniqueness of proton therapy delivery prohibits the generalization of published photon dose-prediction models to proton therapy applications.
Further complicating proton therapy plan evaluation is the possibility that physical dose may not adequately capture the unique properties underlying the clinical differences between proton therapy and photon therapy14–16. The increased ionization density, expressed as dose-weighted linear energy transfer (LETD), in proton therapy compared to photon therapy leads to more effective cell killing. Current clinical standard of practice is to scale the dose by a constant relative biological effectiveness (RBE) value of 1.1, but the LETD is not constant and increases sharply at the distal portion of the Bragg Peak. In vitro, this increase results in a further increase in RBE; the clinical effect is an area of active investigation10. As a clinical, quality-control step, some institutions have begun considering the LETD distribution or the estimated biologically effective dose distribution calculated form the LETD in evaluating treatment plan quality17–24. To our knowledge, none of the KBP approaches, 3D or 2D, have been applied to LETD.
To address the knowledge gap in proton therapy, we have developed an artificial neural network (ANN) to predict 3D dose and LETD distributions. The dose-prediction component enables improved plan-quality consistency and prospective evaluation of achievable proton therapy doses in assessing the potential benefit to patients. The LETD prediction enables consideration of LETD distributions. Areas of concentrated, high LETD overlapping with radiosensitive critical structures can inform planning strategies to mitigate potential end-of-range uncertainties in the RBE value. Here, we detail the network architecture used, model-training parameters, and performance on children treated with proton therapy in the suprasellar region of the brain. The work is a first-of-its-kind study that demonstrates the potential benefit of more-generalized models in both proton therapy and pediatric malignancies.
2. MATERIALS AND METHODS
2.1. Patient Cohort
Data from patients treated on an institutional review board–approved protocol for management of craniopharyngioma were used for the study (NCTN02792582). Craniopharyngioma is a highly localized disease that arises near the brain’s pituitary gland in the suprasellar region. It is centrally located, and variations in size, shape, and location are minimal. Data from 68 patients were included. Among the patients, the median age was 8.9 years (σ=4.7 years), and 46% were male.
2.2. Treatment Planning and Data Collection
All patients received a total dose of 54 GyRBE in 30 fractions. All treatment plans consisted of two, opposed lateral beams or two opposed, obliqued lateral beams. Including plan adaptations resulting from target-anatomy changes, 117 unique treatment plans were available for the study. All treatment plans were optimized in the Eclipse treatment planning system v13.7 (Varian Medical Systems, Palo Alto, CA). As standard practice, our group robustly optimizes to a CTV using uncertainty scenarios of ±3% and ±3mm. Multi-field optimization and single-field optimization strategies were used.
Because some patients had adapted plans, all dose distributions were normalized to the total treatment prescription of 54 GyRBE. The dose normalization ensured that all treatment-plan doses were based around the same effective prescription in model training. Monte Carlo LETD was calculated for all patients using a previously published beam model25 and automated pipeline17, which uses the TOol for PArticle therapy Simulations (TOPAS)26. All doses and anatomical contours associated with the data set represent clinically approved treatment planning data.
2.3. Beam-Path Prediction and Feature Extraction
Previously published models in photon therapy have used a voxel’s longitudinal coordinate as a feature and surrogate for whether voxels were in field or out of field27. For coplanar, volumetric-modulated arc therapy (VMAT), this is a reasonable approximation that can aide in low and intermediate dose prediction. In proton therapy, however, static, and fewer beams— in our practice, traditionally two— are used. Additionally, because protons stop, merely being in-line with a target form a beam’s eye view does not constitute being in field. As a result, the low-dose distribution becomes highly dependent on beam orientation, and predictive models will require a different in-field designation.
Our prediction model was designed to accept a prospectively generated beam-path contour. The assumption was that prior to any dose and LETD prediction, the treatment planner will have chosen a beam setup. This method to prospectively generate a beam path was also applied to the training data set rather than using the isodose-defined beam path, which would be unavailable on a de-novo patient without a precalculated dose distribution (i.e., the planned use-case of the model).
Using a series of MATLAB (MathWorks, Natick, MA) scripts, we extracted gantry angle and couch angle from the DICOM RN file for each treatment plan. The clinical target volume (CTV) was then isotopically expanded by 1.5 cm. The margin used in expansion was chosen to conservatively estimate the 10% isodose cloud based on the review of several clinical plans. Ray tracing along the beam directions calculated from the gantry and couch angles for each point in the expanded CTV defined the prospectively generated beam path.
In addition to a mask corresponding to the prospectively generated beam path, additional features (Table 1) were extracted from the DICOM RN, RS, and CT files for training. Briefly, each of these features were chosen to represent every voxel’s proximity to the CTV, location within a critical structure (masks for brainstem, optic chiasm, and optic nerves), spherical coordinates centered on the CTV, HU value from the computed tomography (CT) scan, and other geometric descriptors matching previously reported models27.
Table 1:
A summary of the model features used to train the neural networks.
| Feature | Description |
|---|---|
| Structure Mask | Boolean mask for each structure used in training: CTV, brainstem, optic chiasm, left optic nerve, and right optic nerve |
| Rstr | An array representation of the shortest distance between a given voxel and the surface of each structure used in training; negative values correspond to voxels inside the structure |
| R, θ, φ | Spherical coordinates of each voxel centered on the CTV center of mass; R - radius, θ - elevation angle, φ - azimuthal angle |
| HU | CT Hounsfield Unit value within the voxel |
2.4. Artificial Neural Networks
Feed-forward neural networks were trained using the ANN Toolbox in MATLAB v2021a. The number of hidden layers was varied from one to four using neurons with a hyperbolic-tangent sigmoid transfer function. In the final output layer, a set of linearly activated neurons were used to predict the treatment planning system–calculated dose and Monte Carlo–calculated LETD. A total of 1 to 4 layers and 5 to 100 neurons per layer were used to train a series of models. The total number of features used during training ranged from 14 to 18. The training function updated weight bias values according to the Broyden-Fletcher-Goldfarb-Shanno (commonly referred to as BFGS) quasi-Newton method28–31. The data set was divided for training, validation, and testing, using a 70%/15%/15% split, respectively. The division of data resulted in 82 unique treatment plans in the training set, 17 unique treatment plans in the validation set, and 18 unique treatment plans held out for testing.
The neural network models were trained on CNVRG.io, an MLOps container orchestration platform with a web-based interface (Cnvrg.io, Accessible Labs Ltd, Intel). The container orchestration system used Kubernetes to control the scheduling of infrastructure resources. The Docker container provided a bundled, virtualized operating system-level software package that was configured to handle the MATLAB-executed network training. The NVIDIA (Nvidia Corporation, Santa Clara, CA)-optimized NGC MathWorks MATLAB Deep Learning base container was used on a Linux operating system using AMD64 architecture.
The training infrastructure, coordinated by the MLOps tools, consisted of 8 GPUs, 16 CPUs, 256 GB of memory, 1 GB of volume storage, and 6 GB of dataset storage. The physical infrastructure comprised an object store and a 2-node pool of the NVIDIA DGX A100. Each of the eight A100 GPUs provided 40 GB of VRAM and Ampere architecture consisting of 3456 tensor cores and 6912 CUDA cores. The DGX platform afforded linear scalability for the 8-instance multi-GPU training.
2.5. Measuring Model Performance
Performance of the model, as assessed using the 18 patients’ data held back for testing, was evaluated using a combination of dose-volume metrics and Dice similarity coefficients for isodose lines corresponding to 50%, 75%, and 95% of the prescribed dose. Our clinical practice is to ensure coverage with the 95% isodose line, so its inclusion in the list of isodose lines is to approximate target coverage with spatial location and shape in mind. The 50% and 75% isodose lines represent the expected dose falloff surrounding the target.
The dose-volume metrics chosen for comparison correspond to clinical dose-volume constraints from the protocol under which the patients were treated and for which the given organ at risk was expected to be in some part of the treatment field. Those constraints were for the brainstem (D50% ≤ 52.4 GyRBE and D0.1cc ≤ 54 GyRBE), optic chiasm (D0.1cc ≤ 54 GyRBE), and optic nerves (D0.1cc ≤ 54 GyRBE). The optic globes and cochlea were excluded from analysis because they were not in the treatment field. Out of concern that the models would lack the sensitivity to accurately predict dose-volume metrics approximating hotspots, we also evaluated D0.3cc and D1cc for the brainstem and optic chiasm. The optic nerves were excluded at the larger volumes due the contours inconsistently exceeding volumes of 0.3 cc and 1 cc. For the clinical target volume (CTV), additional dose-volume metrics of D98%, D2%, and Dmean were evaluated. Corresponding metrics were used to assess the LETD model accuracy (e.g., LETD,98%, LETD,2%, LETD,mean for the CTV). All dose- and LETD-volume metrics were tested for significance by using a two-sided, paired Student’s t test with an alpha of 0.05. That is, a p-Value less than 0.05 rejects the null hypothesis that there is no difference between metrics calculated from corresponding ANN-predicted and clinical treatment plans.
The neural network models were trained to predict dose and LETD only within a predicted beam path. To avoid bias in the comparison to treatment-planning-system dose and Monte Carlo–calculated LETD, we restricted the comparison of dose- and LETD-volume metrics to the region within the predicted beam path. That is, we only compared values within the volume where the neural networks were trained.
3. RESULTS
3.1. Hyperparameter tuning
When training the ANN model, training time increased linearly with the number of neurons in a single layer, and training time increased exponentially with the number of layers. The final combination of hyperparameters used for the full 3D dose comparison was 3 hidden layers with 25 neurons each. The final training time for that combination was 2 wall-clock hours. Loss curves for the models predicting dose (top) and LETD are shown in Figure 1.
Figure 1:

Loss curves for neural network models trained to predict radiation dose (top) and dose-weighted linear energy transfer (LETD) (bottom) are shown.
3.2. ANN-predicted 3D dose and LETD distributions
Dice similarity coefficients for the 95%, 75%, and 50% isodose lines were 0.88, 0.93, and 0.90, respectively. The dose- and LETD-volume metrics associated with the CTV are reported in Table 2. Two of the metrics in this table did not significantly differ when comparing the clinical treatment plan to the ANN-predicted values in the test set (CTV-D98% and CTV-Dmean). The other dose-volume metric, CTV-D2%, had a root mean square (RMS) difference of 1.0. A comparison of the clinical dose and predicted dose overlaid on patient anatomy is shown in Figure 2 for a representative patient in the test set. The Monte Carlo–calculated LETD and ANN-predicted LETD are shown in Figure 3 for same patient.
Table 2:
Dose- and LETD-volume metrics: neural network–calculated vs. clinical plan. The root mean square (RMS) difference are reported along with p-values from a two-sided, paired Student’s t test with an alpha of 0.05.
| Structure/Dose-Volume Metric | Root Mean Square Difference | p-value |
|---|---|---|
| CTV – D98% | 0.4 GyRBE | 0.41 |
| CTV – D2% | 1.0 GyRBE | <0.01 |
| CTV – Mean Dose | 0.4 GyRBE | 0.20 |
| CTV – L98% | 0.4 keV/μm | <0.01 |
| CTV – L2% | 0.6 keV/μm | <0.01 |
| CTV – Mean LETD | 0.4 keV/μm | <0.01 |
Figure 2.
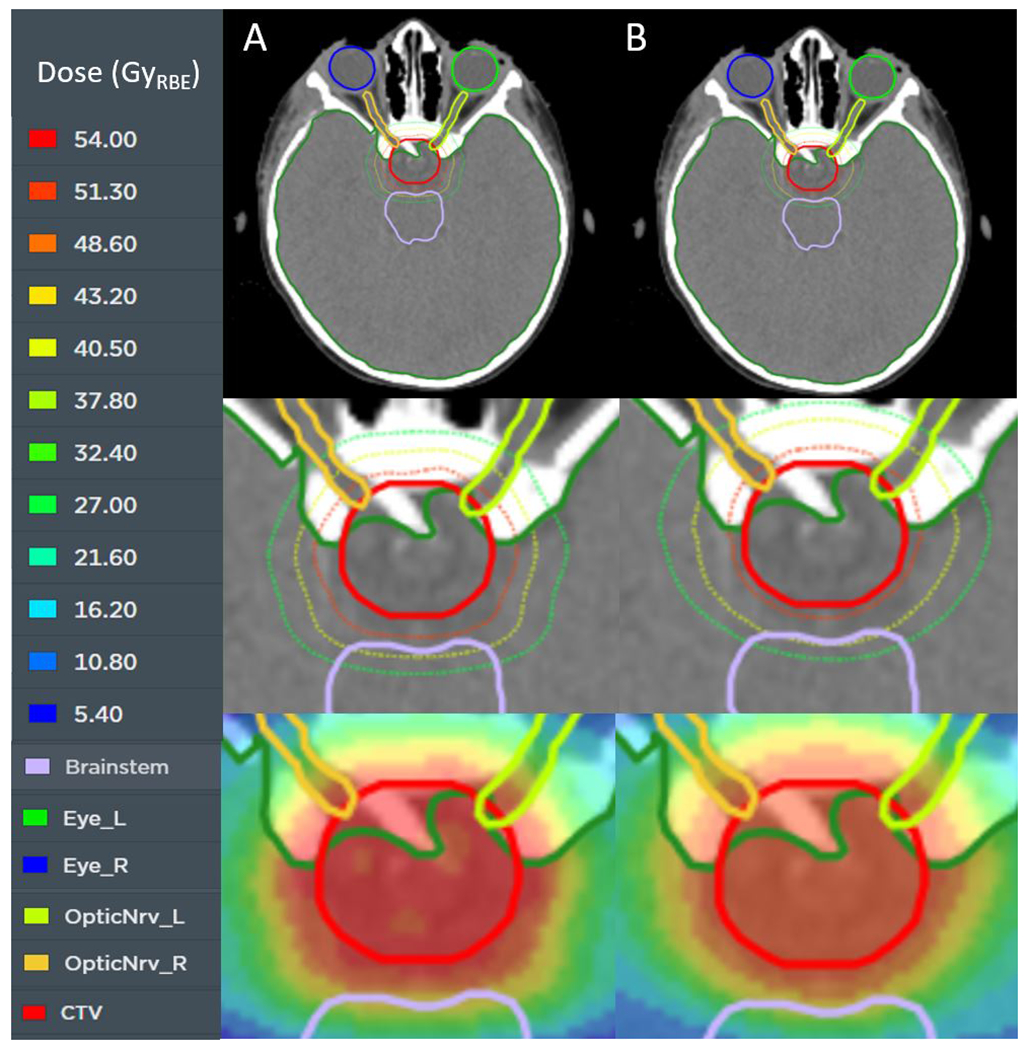
An axial slice of a representative test patient is shown with the treatment planning dose (column A) and the neural network–predicted dose (column B). The top row shows the relation of the target (red) to other nearby organs at risk. The center row is zoomed in to show the 50% (green), 75% (yellow), and 95% (red) isodose lines. The bottom row displays the dose in color wash. The prescription dose is 54 GyRBE.
Figure 3.

An axial slice of a representative test patient is shown with the Monte Carlo–calculated dose-weighted linear energy transfer (LETD) (column A) and the neural network–predicted LETD (column B). The top row shows the relation of the target (red) to other nearby organs at risk (OARs). The center row is zoomed in to show the LETD distribution around the target and adjacent OARs. The bottom row displays the LETD as iso-LETD contours at the 7, 6, 5, 4, and 3 keV/μm levels.
The agreement between dose-volume metrics calculated from the clinical treatment plan and those predicted by the ANN in nearby organs at risk is shown in Figure 4. In all nine dose-volume metrics tested in the organs at risk, the p-value from a two-sided paired Student’s t test was greater than 0.05, indicating that there was no significant difference between corresponding metrics from ANN-predicted and clinical treatment plans. The range in RMS differences between corresponding metrics was as small as 0.7 GyRBE for D0.1cc in the optic chiasm and as large as 4.3 GyRBE for D1cc in the optic chiasm and D0.1cc in the brainstem. Contrary to our initial fears of sensitivity to small-volume metrics, the range in differences within the test set increased as the volume for the metric increased for the optic chiasm. The trend can be observed as a stretching along the vertical axis of the violins in Figure 4. Only one LETD-volume metric in the organs at risk lacked a statistical difference between Monte Carlo–calculated values and ANN–predicted values, brainstem L0.1cc. The results for dose and LETD for all organs at risk are presented in Table 3.
Figure 4.

Violin plots showing the difference in artificial neural network–predicted dose and treatment planning dose for several dose-volume metrics of nearby organs at risk (top – a). The violins represent the distribution of metric differences, with the center circles corresponding to the median difference. Values greater than zero correspond to an overprediction by the neural network. The data are taken from the 18-patient test set. Violin plots showing the difference in artificial neural network-predicted LETD and Monte Carlo calculated LETD are shown at the bottom (b).
Table 3:
Dose- and LETD-volume metrics calculated by the neural networks are compared to those from the clinical plans for the organs at risk using the root mean square (RMS) and were tested for significance by using a two-sided, paired Student’s t test with an alpha of 0.05
| Structure/Evaluation Metric | RMS Difference Dose (GyRBE) | p-Value | RMS Difference LETD (keV/μm) | p-Value |
|---|---|---|---|---|
| Brainstem – D50%/L50% | 3.1 | 0.87 | 0.6 | <0.01 |
| Brainstem – D1cc /L1cc | 2.9 | 0.23 | 0.8 | <0.01 |
| Brainstem – D0.3cc /L0.3cc | 3.7 | 0.31 | 0.9 | 0.02 |
| Brainstem – D0.1cc /L0.1cc | 4.3 | 0.27 | 1.0 | 0.16 |
| Optic Chiasm – D1cc /L1cc | 4.3 | 0.06 | 0.5 | <0.01 |
| Optic Chiasm – D0.3cc /L0.3cc | 1.7 | 0.68 | 0.6 | <0.01 |
| Optic Chiasm – D0.1cc /L0.1cc | 0.7 | 0.30 | 0.7 | <0.01 |
| Left Optic Nerve – D0.1cc /L0.1cc | 6.7 | 0.55 | 1.0 | 0.01 |
| Right Optic Nerve – D0.1cc /L0.1cc | 6.0 | 0.38 | 0.8 | 0.05 |
4. DISCUSSION
Our work investigated the use of neural networks to predict three-dimensional dose and LETD distributions in pencil-beam scanning proton therapy. We trained a three-layer network to predict the dose and LETD given a set of features that included descriptors of the clinical target volume, nearby organs at risk, voxelated structure maps, and computed tomographic imaging data. Predictions were generated after the user chose an isocenter and beam orientation, as would be done for initial plan setup. We evaluated our model using a set of dose-volume metrics traditionally used to judge plan quality. The LETD corollaries to the dose-volume metrics were then used in the comparison of the predicted LETD to Monte Carlo–calculated values. To take advantage of the full 3D prediction, rather than just discrete metric values, we used Dice similarity coefficients comparing isodose and iso-LETD volumes to test the accuracy of our models.
Our work is notable as it is, to our knowledge, the first instance of using artificial intelligence to predict three-dimensional doses in cranial, proton radiation therapy. With approximately 26% of childhood cancers being occurring in the central nervous system32, this is a key and underserved demographic in three-dimensional KBP. In addition, we are the first to demonstrate the application of these techniques for the prediction of LETD. While our models could be used as an aid in the comparison of expected photon and proton therapy doses, our primary goal was to establish an accurate dose prediction model and demonstrate the feasibility of applying KBP to LETD prediction.
The results of our models demonstrated good agreement when examining dose-volume metrics associated with organs at risk, mean target dose, and target coverage approximated by D98%. The dose-volume metric D2%, an indication of a tail in the target DVH, was statistically significant in its difference from the treatment planning system dose. The neural network models consistently predicted a lower D2%, indicating an overestimate in the dose homogeneity within the CTV.
The two organs at risk most likely to present a challenge in the treatment planning process, the brainstem and optic chiasm, demonstrated consistent performance in predicting the goal metric of D0.1cc. A single notable exception in the brainstem of one patient was observed. The two predicted brainstem metrics for the patient were below the first quartile cutoff by more than three times the inner quartile range. If the data points were censored from analysis, the RMS differences for D0.1cc and D0.3cc would be 0.6 GyRBE and 1.0 GyRBE, respectively. When we reviewed the predicted dose distribution, we observed a reduction in the prescription dose cloud in the postero-inferior aspect of the CTV. The result was the appearance of better brainstem sparing and a potentially overly optimistic assessment of the benefit to proton therapy. Although coverage as defined by D98% of the CTV was not sacrificed, the dose distribution would have been less robust to uncertainties. An additional benefit to three-dimensional dose prediction is the ability to review the full distribution during use of the model. In the example of the outlier mentioned here, the clinician would be able to see that the dose distribution is less robust under review. The corresponding reduction to brainstem dose would then be provided context that otherwise would not be interpretable from a discrete dose-volume metric prediction. If the outlier were to be censored from our analysis, the RMS difference for our two planning constraint metrics would have been less than 1.0 GyRBE for both structures (see Table 3 for uncensored data). We could identify no obvious reasons for the poorly predicted dose distribution, and this will be a topic of future exploration in more generalizable models.
Although we are the first to publish results on cranial, proton radiation therapy, we can compare the performance to other published proton models in different anatomic sites. Notably, Guerreiro et al.13 detailed a deep learning model capable of predicting dose in pediatric abdominal tumors in which average model performance was within 0.4% for D98% of the internal target volume (ITV) and < 0.1% for D50%. Our agreement for D98% of the CTV was < 0.1% and Dmean, the closest correlate to D50% that we used for the CTV, in agreement within 0.1%.
The Guerreiro study also included Dice similarity coefficients (DSC) to compare predicted isodose lines to those from a clinical treatment plan. At the levels of 50%, 70%, and 90%, DSC values were 0.94, 0.94, and 0.89, respectively. At similar levels of 50%, 75%, and 95%, our data demonstrated agreement of 0.90, 0.93, and 0.88. Our results demonstrate similar levels of spatial agreement when evaluating the full 3D distribution. The inclusion of this comparison is especially important for proton therapy in which robust evaluation involves assessing plan quality on coverage of a CTV under uncertain scenarios rather than strictly evaluating a planning target volume (PTV) from a nominal dose distribution. As a result, a dose-volume metric indicating good CTV coverage may not be the same as a plan judged to be sufficiently robust. Evaluating the 3D distribution with DSC ensures that this concept is not overlooked in training dose prediction models.
The performance of our models was more modest in predicting LETD. All but one LETD-volume metric demonstrated statistically significant differences between predicted values and those calculated from the clinical treatment plans. The notable exception was L0.1cc of the brainstem, a particularly relevant metric given the attention to brainstem toxicities and possibility that they are driven by increased RBE resulting from LETD33. Despite not differing significantly, the RMS difference remained high at 1.0 keV/μm. Although many of the differences were statistically significant, we were encouraged that the magnitude of the difference between mean metrics among the test sample was less than 1.0 keV/μm for all comparisons in the organs at risk and CTV. Without a better understanding of the clinical effects of LETD10,14,16, it is difficult to determine whether the agreement is acceptable for model implementation. KBP algorithms benefit from consistency in plan quality within the training data sets. Without directly optimizing for LETD it is to be expected that patient-to-patient variations will be greater than what is observed for physical dose where clear clinical guidelines exist. Given the inherently higher variation in LETD among patient plans, we were encouraged by the qualitative agreement observed when examining the distributions and feel that with model refinement, notably including features that correspond to probable spot location and weight or the use of convolutional neural networks, a better-performing model will be possible.
The Guerreiro study13 and similar photon models4,11,12 utilized convolutional neural networks (CNN) as opposed to our artificial neural network (ANN). CNNs are well suited for prediction of 2D and 3D arrays like medical images and dose distributions. It’s possible that had we chosen this approach our LETD models would have demonstrated better accuracy. We decided to attempt an ANN first as it allowed us to choose a set of features we thought would be most predictive of proton therapy dose and LETD. With limited literature on the use of 3D dose prediction in proton therapy, and none relating to LETD, we felt that an ANN trained on pre-selected features would be a surer way to assess the feasibility and challenges in adapting these models to proton therapy. Future work in implementing more generalized models from larger data sets and utilizing a CNN is planned.
Knowledge-based planning strategies in proton therapy provide the potential to realize all of the benefits associated with the practice in photon treatment planning: superior plan quality and consistency34–39, improved treatment planning workflows36, and the sharing of local expertise with the larger radiation oncology community37–39. The benefits in proton therapy extend further by allowing for plan comparison with traditional photon-based radiation therapy when selecting patients most likely to benefit from proton therapy7,8,13. Our inclusion of an LETD prediction in the model also means that planning approaches can be prospectively evaluated for potential concerns related to end-of-range effects and the increased uncertainty in RBE. In our practice, we frequently try multiple beam orientations during treatment planning, calculate the LETD in the plans, and compare the perceived risk for unanticipated complications. An up-front prediction of the LETD would streamline the process and allow our treatment planning team to focus on the one or two treatment strategies likely to result in a more favorable LETD distribution. An analysis of the literature40 shows promising signs for the widespread implementation of LET-based evaluation and optimization of proton therapy treatment plans. As the techniques gain adoption, the benefits of knowledge-based planning will extend to LET similarly to how they do with radiation dose. The benefits outlined here, and the performance of our models, have encouraged us to further explore models in different treatment sites and/or more-generalized models capable of accurate predictions in a broader domain of clinical diagnoses.
5. CONCLUSIONS
The rapid growth in the use of proton therapy in radiation oncology means it is well positioned to benefit from computational technologies originally developed for photon therapy, including knowledge-based planning. The benefits of improved plan quality and sharing of treatment planning experience extend to better identification of patients likely to benefit from the increasing access to proton therapy. We have reported on the use of artificial neural network to predict three-dimensional dose and LETD distributions for proton therapy treatment planning in the management of craniopharyngioma. Excellent agreement in the dose predictions and promising early results in the prediction of LETD indicate that this exciting methodology is ready for the jump to proton radiation therapy.
ACKNOWLEDGEMENTS
This work was supported by American Lebanese Syrian Associated Charities.
Footnotes
CONFLICT OF INTEREST
The authors have no relevant conflicts of interest to disclose.
REFERENCES
- 1.Appenzoller LM, Michalski JM, Thorstad WL, Mutic S, Moore KL. Predicting dose-volume histograms for organs-at-risk in IMRT planning. Medical physics. 2012;39(12):7446–7461. [DOI] [PubMed] [Google Scholar]
- 2.Moore KL, Appenzoller LM, Tan J, Michalski JM, Thorstad WL, Mutic S. Clinical implementation of dose-volume histogram predictions for organs-at-risk in IMRT planning. Journal of Physics: Conference Series. 2014;489:012055. [Google Scholar]
- 3.Yuan L, Ge Y, Lee WR, Yin FF, Kirkpatrick JP, Wu QJ. Quantitative analysis of the factors which affect the interpatient organ-at-risk dose sparing variation in IMRT plans. Medical physics. 2012;39(11):6868–6878. [DOI] [PubMed] [Google Scholar]
- 4.Nguyen D, Long T, Jia X, et al. A feasibility study for predicting optimal radiation therapy dose distributions of prostate cancer patients from patient anatomy using deep learning. Scientific reports. 2019;9(1):1–10. [DOI] [PMC free article] [PubMed] [Google Scholar]
- 5.Xu Y, Brovold N, Cyriac J, et al. Assessment of Knowledge-Based Planning for Prostate Intensity Modulated Proton Therapy. International journal of particle therapy. 2021;8(2):62–72. [DOI] [PMC free article] [PubMed] [Google Scholar]
- 6.Delaney AR, Dong L, Mascia A, et al. Automated knowledge-based intensity-modulated proton planning: an international multicenter benchmarking study. Cancers. 2018;10(11):420. [DOI] [PMC free article] [PubMed] [Google Scholar]
- 7.Delaney AR, Dahele M, Tol JP, Kuijper IT, Slotman BJ, Verbakel WFAR. Using a knowledge-based planning solution to select patients for proton therapy. Radiotherapy and Oncology. 2017;124(2):263–270. [DOI] [PubMed] [Google Scholar]
- 8.Hytonen R, Vergeer MR, Vanderstraeten R, Koponen TK, Smith C, Verbakel WFAR. Fast, automated knowledge-based treatment planning for selecting patients for proton therapy based on normal tissue complication probabilities. Advances in Radiation Oncology. 2022:100903. [DOI] [PMC free article] [PubMed] [Google Scholar]
- 9.Prisciandarao JI, Willis CE, Burmeister JW, et al. Essentials and Guidelines for Clinical medical Physics Residency Training Programs. American Association of Physicists in Medicine;2013. [Google Scholar]
- 10.Paganetti H, Beltran C, Both S, et al. Roadmap: proton therapy physics and biology. Physics in Medicine & Biology. 2021;66(5):05RM01. [DOI] [PMC free article] [PubMed] [Google Scholar]
- 11.Kandalan RN, Nguyen D, Rezaeian NH, et al. Dose prediction with deep learning for prostate cancer radiation therapy: model adaptation to different treatment planning practices. Radiotherapy and Oncology. 2020;153:228–235. [DOI] [PMC free article] [PubMed] [Google Scholar]
- 12.Nguyen D, Jia X, Sher D, et al. 3D radiotherapy dose prediction on head and neck cancer patients with a hierarchically densely connected U-net deep learning architecture. Physics in medicine & Biology. 2019;64(6):065020. [DOI] [PubMed] [Google Scholar]
- 13.Guerreiro F, Seravalli E, Janssens GO, et al. Deep learning prediction of proton and photon dose distributions for paediatric abdominal tumours. Radiotherapy and Oncology. 2021;156:36–42. [DOI] [PubMed] [Google Scholar]
- 14.Paganetti H, Blakely E, Carabe-Fernandez A, et al. Report of the AAPM TG-256 on the relative biological effectiveness of proton beams in radiation therapy. Medical physics. 2019;46(3):e53–e78. [DOI] [PMC free article] [PubMed] [Google Scholar]
- 15.Paganetti H. Significance and implementation of RBE variations in proton beam therapy. Technology in cancer research & treatment. 2003;2(5):413–426. [DOI] [PubMed] [Google Scholar]
- 16.Paganetti H. Relative biological effectiveness (RBE) values for proton beam therapy. Variations as a function of biological endpoint, dose, and linear energy transfer. Physics in medicine and biology. 2014;59(22):R419. [DOI] [PubMed] [Google Scholar]
- 17.Kaluarachchi M, Moskvin V, Pirlepesov F, Wilson LJ, Xie F, Faught AM. Automation of Monte Carlo-based treatment plan verification for proton therapy. Journal of Applied Clinical Medical Physics. 2020;21(8):131–138. [DOI] [PMC free article] [PubMed] [Google Scholar]
- 18.Tseung HSWC, Ma J, Kreofsky CR, Ma DJ, Beltran C. Clinically-applicable Monte Carlo-based biological dose optimization for the treatment of head and neck cancers with spot-scanning proton therapy. International Journal of Radiation Oncology* Biology* Physics. 2016. [DOI] [PubMed] [Google Scholar]
- 19.An Y, Shan J, Patel SH, et al. Robust intensity-modulated proton therapy to reduce high linear energy transfer in organs at risk. Medical physics. 2017;44(12):6138–6147. [DOI] [PMC free article] [PubMed] [Google Scholar]
- 20.Cao W, Khabazian A, Yepes PP, et al. Linear energy transfer incorporated intensity modulated proton therapy optimization. Physics in Medicine & Biology. 2017;63(1):015013. [DOI] [PMC free article] [PubMed] [Google Scholar]
- 21.Unkelbach J, Botas P, Giantsoudi D, Gorissen BL, Paganetti H. Reoptimization of intensity modulated proton therapy plans based on linear energy transfer. International Journal of Radiation Oncology* Biology* Physics. 2016;96(5):1097–1106. [DOI] [PMC free article] [PubMed] [Google Scholar]
- 22.Kopp B, Fuglsang Jensen M, Mein S, et al. FRoG: An independent dose and LETd prediction tool for proton therapy at ProBeam® facilities. Medical Physics. 2020;47(10):5274–5286. [DOI] [PubMed] [Google Scholar]
- 23.Beltran C, Tseung HWC, Augustine KE, et al. Clinical Implementation of a Proton Dose Verification System Utilizing a GPU Accelerated Monte Carlo Engine. International Journal of Particle Therapy. 2016;3(2):312–319. [DOI] [PMC free article] [PubMed] [Google Scholar]
- 24.Deng W, Younkin JE, Souris K, et al. Integrating an open source Monte Carlo code “MCsquare” for clinical use in intensity-modulated proton therapy. Medical physics. 2020;47(6):2558–2574. [DOI] [PubMed] [Google Scholar]
- 25.Moskvin V, Faught AM, Pirlepesov F, Zhao L, Hua C, Merchant TE. Monte Carlo framework for commissioning a synchrotron-based discrete spot scanning proton beam system and treatment plan verification. Biomedical Physics & Engineering Express. 2021. [DOI] [PubMed] [Google Scholar]
- 26.Perl J, Shin J, Schümann J, Faddegon B, Paganetti H. TOPAS: An innovative proton Monte Carlo platform for research and clinical applications. Medical physics. 2012;39(11):6818–6837. [DOI] [PMC free article] [PubMed] [Google Scholar]
- 27.Campbell WG, Miften M, Olsen L, et al. Neural network dose models for knowledge-based planning in pancreatic SBRT. Medical physics. 2017;44(12):6148–6158. [DOI] [PMC free article] [PubMed] [Google Scholar]
- 28.Broyden CG. The convergence of a class of double-rank minimization algorithms: 2. The new algorithm. IMA journal of applied mathematics. 1970;6(3):222–231. [Google Scholar]
- 29.Fletcher R A new approach to variable metric algorithms. The computer journal. 1970;13(3):317–322. [Google Scholar]
- 30.Goldfarb D A family of variable-metric methods derived by variational means. Mathematics of computation. 1970;24(109):23–26. [Google Scholar]
- 31.Shanno DF. Conditioning of quasi-Newton methods for function minimization. Mathematics of computation. 1970;24(111):647–656. [Google Scholar]
- 32.Key Statistics for Childhood Cancer. American Cancer Society. Published 2020. Accessed2022. [Google Scholar]
- 33.MacDonald SM, Laack NN, Terezakis S. Humbling advances in technology: protons, brainstem necrosis, and the self-driving car. International Journal of Radiation Oncology• Biology• Physics. 2017;97(2):216–219. [DOI] [PubMed] [Google Scholar]
- 34.Yusufaly TI, Meyers SM, Mell LK, Moore KL. Knowledge-based planning for intact cervical cancer. Seminars in Radiation Oncology. 2020;30(4):328–339. [DOI] [PubMed] [Google Scholar]
- 35.Wang J, Hu W, Yang Z, et al. Is it possible for knowledge-based planning to improve intensity modulated radiation therapy plan quality for planners with different planning experiences in left-sided breast cancer patients? Radiation Oncology. 2017;12(1):1–8. [DOI] [PMC free article] [PubMed] [Google Scholar]
- 36.Foy JJ, Marsh R, Ten Haken RK, et al. An analysis of knowledge-based planning for stereotactic body radiation therapy of the spine. Practical radiation oncology. 2017;7(5):e355–e360. [DOI] [PubMed] [Google Scholar]
- 37.Li N, Carmona R, Sirak I, et al. Highly Efficient Training, Refinement, and Validation of a Knowledge-based Planning Quality-Control System for Radiation Therapy Clinical Trials. International Journal of Radiation Oncology* Biology* Physics. 2017;97(1):164–172. [DOI] [PMC free article] [PubMed] [Google Scholar]
- 38.Good D, Lo J, Lee WR, Wu QJ, Yin F-F, Das SK. A knowledge-based approach to improving and homogenizing intensity modulated radiation therapy planning quality among treatment centers: an example application to prostate cancer planning. International Journal of Radiation Oncology* Biology* Physics. 2013;87(1):176–181. [DOI] [PubMed] [Google Scholar]
- 39.Faught AM, Olsen L, Schubert L, et al. Functional-Guided Radiotherapy Using Knowledge-Based Planning. Radiotherapy and oncology: journal of the European Society for Therapeutic Radiology and Oncology. 2018;129(3):494. [DOI] [PMC free article] [PubMed] [Google Scholar]
- 40.Deng W, Yang Y, Liu C, et al. A critical review of LET-based intensity-modulated proton therapy plan evaluation and optimization for head and neck cancer management. International Journal of Particle Therapy. 2021;8(1):36–49. [DOI] [PMC free article] [PubMed] [Google Scholar]