Abstract
This erratum corrects an error in Fig. 1 of our paper [Biomed. Opt. Express 13, 3854 (2022) 10.1364/BOE.459935].
Erratum
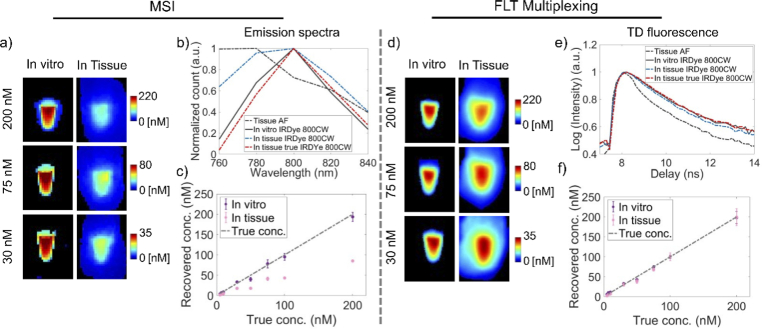
In this erratum, we correct an error in Fig. 1 of our recently published paper [1]. Figures 1(c) and 1(f) were accidentally switched in the published version. The following Fig. 1 replaces the existing Fig. 1. We note that the results presented in the paper remain valid and this error does not affect our conclusions.
Fig. 1.
Comparison of quantification accuracy of MSI and FLT multiplexing for a single fluorophore in tissue. a) Representative images of recovered IRDye 800CW concentrations (from 200 nM, 75 nM and 30 nM) using MSI in vitro and in tissue are shown. b) Fluorescence spectra of tissue AF (black dashed), in vitro IRDye 800CW (black solid), IRDye 800CW in tissue (blue dashed) and true IRDye 800CW spectra in tissue (red dashed) are shown. The true IRDye 800CW spectra in tissue shows a clear redshift compared to the IRDye 800CW spectra in vitro. (c) Recovered concentrations of IRDye 800CW in vitro and in tissue based on MSI using the tissue AF and in vitro IRDye 800CW spectra as basis functions. d) Representative images of recovered IRDye 800CW concentrations (from 200 nM, 75 nM and 30 nM) using FLT multiplexing in vitro and in tissue are shown. e) TD fluorescence decay curves of tissue AF (black dashed), in vitro IRDye 800CW (black solid), IRDye 800CW in tissue (blue dashed) and true IRDye 800CW decay curve in tissue (red dashed) are shown. The true IRDye 800CW decay curve was nearly identical to the in vitro measured IRDye 800CW decay curve. f) Recovered concentrations of IRDye 800CW in vitro and in tissue based on FLT multiplexing using in vitro TD decay curves of tissue AF and IRDye 800CW. ‘Pink’ and ‘purple’ in (c) and (f) represent data collected in vitro and in tissue, respectively. Gray dotted lines in (c) and (f) represent the true IRDye 800CW concentrations.
Funding
National Cancer Institute10.13039/100000054 (R01-CA211084, R01-CA260857).
Disclosures
The authors declare no conflict of interest.
References
- 1.Pal R, Kumar AT, “Comparison of fluorescence lifetime and multispectral imaging for quantitative multiplexing in biological tissue,” Biomed. Opt. Express 13(7), 3854–3868 (2022). 10.1364/BOE.459935 [DOI] [PMC free article] [PubMed] [Google Scholar]


