

Abstract
Type II diabetes mellitus (T2DM) is a multifactorial disease process that is characterized by insulin resistance and impairment of insulin-producing pancreatic islets. There is evidence that environmental exposure to cadmium contributes to the development of T2DM. The presence of cadmium in human islets from the general population and the uptake of cadmium in β-cells have been reported. To identify cadmium-mediated changes in gene expression and molecular regulatory networks in pancreatic islets, we performed next-generation RNA-Sequencing (RNA-Seq) in islets following either in vivo (1mM CdCl2 in drinking water) or ex-vivo (0.5μM CdCl2) exposure. Both exposure regiments resulted in islet cadmium concentrations that are comparable to those found in human islets from the general population. 6-week in vivo cadmium exposure upregulates the expression of five genes: Synj2, Gjb1, Rbpjl, Try5 and 5430419D17Rik. Rbpjl is a known regulator of ctrb, a gene associated with diabetes susceptibility. With 18-week in vivo cadmium exposure, we found more comprehensive changes in gene expression profile. Pathway enrichment analysis showed that these secondary changes were clustered to molecular mechanisms related to intracellular protein trafficking to the plasma membrane. In islet culture, cadmium ex vivo significantly induces the expression of Mt1, Sphk1, Nrcam, L3mbtl2, Rnf216 and Itpr1. Mt1 and Itpr1 are known to be involved in glucose homeostasis. Collectively, findings reported here revealed a complex cadmium-mediated effect on pancreatic islet gene expression at environmentally relevant cadmium exposure conditions, providing the basis for further studies into the pathophysiological processes arising from cadmium accumulation in pancreatic islets.
Keywords: Pancreatic Islets, Cadmium, mRNA-Sequencing, Islet transcriptome, Type II diabetes mellitus, insulin-producing β-cells
1. Introduction
Type II diabetes mellitus (T2DM) is characterized by hyperglycemia, insulin resistance and impairment in β-cell function (Petersmann, Muller-Wieland et al. 2019). Currently, there are over 34 million people with T2DM in the USA and this represents about 10% of the US population (U.S. Department of Health and Human Services and Center for Disease Control and Prevention 2020). In addition to genetic factors, lifestyle-related factors such as diet, physical inactivity, high body mass index (BMI) and smoking are well established risk factors for the development of T2DM (Kolb and Martin 2017). Environmental exposure to various toxicants such as arsenic (Kuo, Moon et al. 2017, Kirkley, Carmean et al. 2018) and cadmium (Schwartz, II’yasova et al. 2003) has been shown to contribute to the development of T2DM.
Cadmium (Cd) is an environmental, transition metal with several toxic properties that is found at low levels in fruits, vegetables grown on Cd-containing soil (Jolly, Islam et al. 2013), drinking water (Dalmieda and Kruse 2019), and cigarette smoke (Scherer and Barkemeyer 1983). Several epidemiological (Schwartz, II’yasova et al. 2003, Lei, Chen et al. 2007, Afridi, Kazi et al. 2008, Wallia, Allen et al. 2014) and animal studies (Ghafghazi and Mennear 1973, Bell, Early et al. 1990, Fitzgerald, Olsen et al. 2020) have reported the association between Cd exposure and impairment in glucose homeostasis, while others found no such association (Barregard, Bergstrom et al. 2013). In a large, cross-sectional study in humans, urinary Cd (a biomarker of Cd exposure) was associated with impaired fasting glucose and diabetes in a dose-dependent manner after correcting for ethnicity, age, BMI, gender and smoking (Schwartz, II’yasova et al. 2003, Wallia, Allen et al. 2014). In animal studies, bioaccumulation of Cd in pancreatic islets as a result of acute and sub-acute Cd exposure was shown to cause hyperglycemia (Ghafghazi and Mennear 1973, Bell, Early et al. 1990), elevated fasting glucose and decreased glucose-stimulated insulin-secretion (GSIS) (Fitzgerald, Olsen et al. 2020). We previously demonstrated that bioaccumulation of intracellular Cd in mouse islet culture also resulted in blunted GSIS (El-Muayed, Raja et al. 2012). Taken together, these human, animal and pancreatic islet culture studies suggest a possible role of Cd as a risk factor in the development of T2DM.
We previously showed that murine β-cells accumulate Cd in a dose and time-dependent manner (El-Muayed, Raja et al. 2012). Our laboratory has also reported the presence of measurable quantities of Cd in samples from human pancreatic islets of Langerhans derived from the general US population that result in impaired GSIS (Wong, Allen et al. 2017). In the present study, we extended this effort and sought to identify Cd-mediated changes in gene expression and molecular regulatory networks in pancreatic islets using high throughput, next-generation RNA-Sequencing (RNA-Seq). Here, we describe the islet transcriptome profile of Cd-exposed mice to determine changes in the systemic regulatory networks. We also describe the transcriptome profile of mouse islets exposed to Cd in culture to determine gene changes as a direct consequence of Cd exposure.
2. Materials and Methods
2.1. Cadmium exposure in mice
5–6 weeks old, C57BL/6N male mice were exposed to either vehicle or 1mM CdCl2 (112.4ppm, Rigaku, Cat #: 1008154) in deionized drinking water (18.2μΩ, Millipore) acidified with HCl (30μM) for 6 or 18 weeks. Drinking water was changed once a week to ensure freshness. Regular rodent chow (Envigo, Cat #: 7912) was given ad libitum for the duration of study. At the conclusion of the exposure period (either 6 or 18 weeks), mice were euthanized and tissues were harvested for analysis. All mice were alive and appeared healthy at the end of the 6 or 18 weeks exposure period. All animal experiments were reviewed and approved by the Institutional Animal Care and Use Committee of Northwestern University. The C57BL/6N strain was used to avoid confounding our data with the effect of the NNT mutation on glucose homeostasis.
2.2. Pancreatic islet isolation
Islet isolation was performed as previously described (El-Muayed, Raja et al. 2012). In brief, C57BL/6N male mice were anaesthetized with intraperitoneal injection of ketamine (10mg/ml)/xylazine (1mg/ml) and the abdominal cavity opened to expose the common bile duct. Pancreas was perfused with 3ml collagenase (0.5mg/ml, Sigma, Cat #: C7657) dissolved in HBSS buffer with phenol red through the common bile duct. Inflated pancreases were excised, washed in phenol red-free HBSS buffer and digested at 37°C for 15 minutes. Islets were purified from digested pancreas tissue by centrifugation in Biocoll density gradient (Millipore Sigma, Cat #: L6155) at 4°C, 2500rpm for 20 minutes. Purified islets were hand-picked under a microscope (Leica Microsystems) and transferred into clean microcentrifuge tubes. Islets were washed twice in ice-cold PBS (4°C, 500×g, 2 min) and stored at −80°C in 500μl Trizol (Invitrogen) until total RNA extraction.
2.3. Measurement of islet cadmium
Measurements of islet Cd was performed as previously reported (Wong, Allen et al. 2017). In brief, 50 islets were collected in metal-free, HCl-washed, 1.7ml polypropylene tubes (Denville, Cat #: C-2170). Dried islet samples were dissolved in 30μL 68% HNO3 and heated to 80°C for 15 minutes followed by dilution with 195μL trace metal grade water (EMD, Cat #: WX0003-6) and submitted for Inductively Coupled Plasma Mass Spectrometry (ICP-MS) analysis. Islet Cd concentrations were normalized to total islet protein. Total islet protein was measured using a BCA assay kit (Thermo Scientific, Cat #: 23235) following pH neutralization with NaOH. Accuracy of BCA assay protein measurements in pH-neutralized, HNO3 islet lysates was previously validated using BSA standards. Negative ICP-MS output values were imputed to zero. Certified metal-free pipette tips (VWR, Cat #: 53508-918) and tubes (VWR, Cat #: 89049-170) were used throughout the collection and analysis process.
2.4. Measurement of blood cadmium
30μl of blood was collected through a tail nick using ceramic scissors from mice. Blood samples were dried at 80°C for 30 minutes in HCl-washed polypropylene tubes. Dried blood pellets were hydrolyzed in 50μl of 68% HNO3 (80°C, 15 minutes) followed by dilution with trace metal grade water (EMD, Cat #: WX0003-6) to a final volume of 2ml. Hydrolyzed samples were submitted for ICP-MS that was performed as previously reported (Wong, Allen et al. 2017). All sample preparation for ICP-MS were carried out in a trace metal grade laminar flow hood (Baker)
2.5. Pancreatic islet culture ex vivo
Following islet isolation from male mice, pancreatic islets were left to recover overnight (37°C, 5% CO2) in RPMI-1640 (Corning, Cat #: 10-040-CV) supplemented with 10% heat-inactivated FBS (Mediatech, Cat #: 35-016-CV), 100U/ml penicillin-streptomycin (Gibco, Cat #: 15140-122) and 2mM L-glutamine (Gibco, Cat #: 25030-081). The next day, overnight media was removed and replaced with fresh media. Islet media was treated with either vehicle or 0.5μM CdCl2 for 96 hours. At the end of the exposure period, islets were collected and washed twice in ice-cold PBS (4°C, 500×g, 2 min). Total RNA was isolated according to protocol described below.
2.6. Total RNA isolation
RNA isolation was performed as described by White et al (2009) (White and Kaestner 2009). In brief, islets were dissolved in 1ml Trizol (5 min, RT, Invitrogen) followed by phase separation with the addition of 200μl chloroform (5 min, 12000g, 4°C). Aqueous phase was removed to a fresh microcentrifuge tube, mixed with 600μl 70% ethanol and purified using a RNeasy Mini Columns (Qiagen) that were used according to manufacturer’s instructions. Total RNA was eluted by adding 45μl RNase-free, molecular grade water to spin columns followed by centrifugation (2min, 8000g, 4°C). Total RNA was quantified using Nanodrop 2000 spectrophotometer (Thermo Scientific). RNA samples (60–200ng/μl) were submitted to the Genomics Core Facility at the Knapp Center for Biomedical Discovery, University of Chicago, Chicago for RNA QC, library preparation and sequencing.
2.7. RNA library preparation, quality assessment and RNA-Seq analysis
RNA libraries of 100bp paired-end read lengths were generated from mouse pancreatic islets (n=4–6/group) for sequencing on the Illumina HiSeq-4000 Platform. RNA sequences were sent to the Center for Genetic Medicine, Northwestern University for RNA-Seq analysis. In brief, quality of raw sequencing reads in FASTQ format were evaluated using FastQC. Raw reads were trimmed to remove Illumina adapters from the 3’ ends using Cutadapt (Martin 2011). Trimmed reads were aligned to the Mus musculus reference genome (mm10, UCSC) using STAR (Dobin, Davis et al. 2013). Read counts for each gene were calculated using HTSeq-count (Anders, Pyl et al. 2015) in conjunction with a gene annotation file for mm10 obtained from Ensembl genome browser (http://useast.ensembl.org/index.html). Normalization and differential expression were calculated using DESeq2 that employs the Wald test (Love, Huber et al. 2014). The cutoff for determining differentially expressed genes was a False Discovery Rate (FDR)-adjusted p-value less than 0.05 using the Benjamini-Hochberg method. Clustering and pathway enrichment analysis of differentially expressed genes based on their functional annotations were performed using Metascape (Zhou, Zhou et al. 2019).
2.8. cDNA synthesis and Quantitative Polymerase Chain Reaction (qPCR)
10μg of total RNA from each sample was treated with DNase 1 to remove contaminating gDNA (NEB, Cat. #: M0303). Following DNase 1 treatment, samples were purified using RNeasy Mini columns (Qiagen) that were used according to manufacturer’s instructions. Following sample purification, total RNA was quantified using Nanodrop 2000 spectrophotometer (Thermo Scientific). Samples were reverse-transcribed from 0.1μg of total RNA using a qScript cDNA synthesis kit (Quanta Biosciences, Cat #: 95047). Approximately 20ng of total cDNA were used to determine gene expression levels using SYBR green Supermix (BioRad). Samples were assayed in duplicates on a real-time PCR platform (Roche, LightCycler 480 II). Specific gene expression was inferred from gene-specific standard curves following normalization to β-actin. List of primers used for qPCR reactions can be found in Supplemental Table 1. Unpaired t-test were performed on confirmatory qPCR data and p<0.05 were taken as statistically significant.
3. Results
3.1. Blood and islet Cd concentration following 4 weeks of Cd exposure in vivo
To determine the concentration of Cd in blood and islets following oral Cd exposure, mice were exposed to either vehicle control (n=4–5) or 1mM CdCl2 (n=4–5) in their drinking water for 4 weeks. At the end of the 4-week exposure period, blood and pancreatic islets were collected and analyzed by ICP-MS. Following 4 weeks of Cd exposure in vivo, we found significant circulating levels of Cd in blood from Cd-exposed mice (0.9434 ± 0.0663μM) compared to vehicle controls (0.0033 ± 0.0004μM) (Fig 1a, p<0.001). We also found significant bioaccumulation of Cd in pancreatic islet from Cd-exposed mice (79.4 ± 3.4nmol/g protein) compared to vehicle controls (0.3 ± 0.05 nmol/g protein) (Fig 1b, p<0.001). To determine islet Cd content ex vivo, we exposed islets in culture to either vehicle (n=6) or 0.5μM CdCl2 (n=6) for 72 hours. We found significant intracellular Cd bioaccumulation in Cd-exposed islets (165.8 ± 17.2nmol/g protein) compared to vehicle-exposed islets ex vivo (−19.0 ± 2.7nmol/g protein, Fig 1b, p<0.001). The bioaccumulation of islet Cd in murine islets from both in vivo and ex vivo exposures are at levels comparable to human islet Cd levels found in the general US population (human islet Cd median = 26.1nmol/g protein, range = 4.4 −94.7nmol/g protein, Fig. 1b) (Wong, Allen et al. 2017).
Fig. 1. Blood and islet Cd content in mice in vivo and ex vivo.


(a) Blood Cd concentration in mice exposed to either Veh or 1mM CdCl2 for 4 weeks (n=5/group). (b) Islet Cd content (normalized to total islet protein) in mice exposed to either Veh or 1mM CdCl2 for 4 weeks (n=4/group) and in islet culture exposed to either Veh or 0.5μM CdCl2 for 72 hours (n=6/group). #Interquartile range of islet Cd and ∞highest islet Cd value found in humans (data from Wong et al. (2017)). Data are expressed as mean ± SEM. ***p<0.001.
3.2. Islet gene expression profile following 6 weeks of Cd exposure in vivo
To investigate the shorter term effects of Cd on gene regulation, mice were exposed to either vehicle control (n=5) or 1mM CdCl2 (n=4) in their drinking water for 6 weeks. This Cd dose and exposure duration was chosen because it elicited an accumulation of Cd in mice islets that were environmentally relevant and comparable to the average islet Cd levels in humans (Fig. 1a). Pancreatic islets from vehicle and Cd-exposed mice underwent mRNA-Sequencing analysis to compare gene expression patterns at the level of the transcriptome between the two groups. Volcano plot illustrating changes in islet transcriptome between control and Cd-exposed mice following 6 weeks of Cd exposure is shown in Fig. 2a. A total of nine genes were identified as differentially expressed with a FDR-adjusted p<0.05 (Table 1). Of these nine differentially expressed genes, eight genes were up-regulated (Gjb1, Tnfaip3, 5430419D17Rik, Synj2, Rbpjl, Try5, Rel, 1810009J06Rik) and one gene was down-regulated (Slc40a1) following Cd exposure (Table 1). Due to the limited number of differentially expressed genes, pathway analysis was performed on non-adjusted, statistically significant genes (defined by p<0.05). This analysis showed enrichment in genes involved in pancreatic secretory pathways following 6 weeks of Cd exposure (Suppl. Fig.1a).
Fig. 2. Islet transcription profile of Veh and Cd-exposed mice following 6 weeks of exposure.
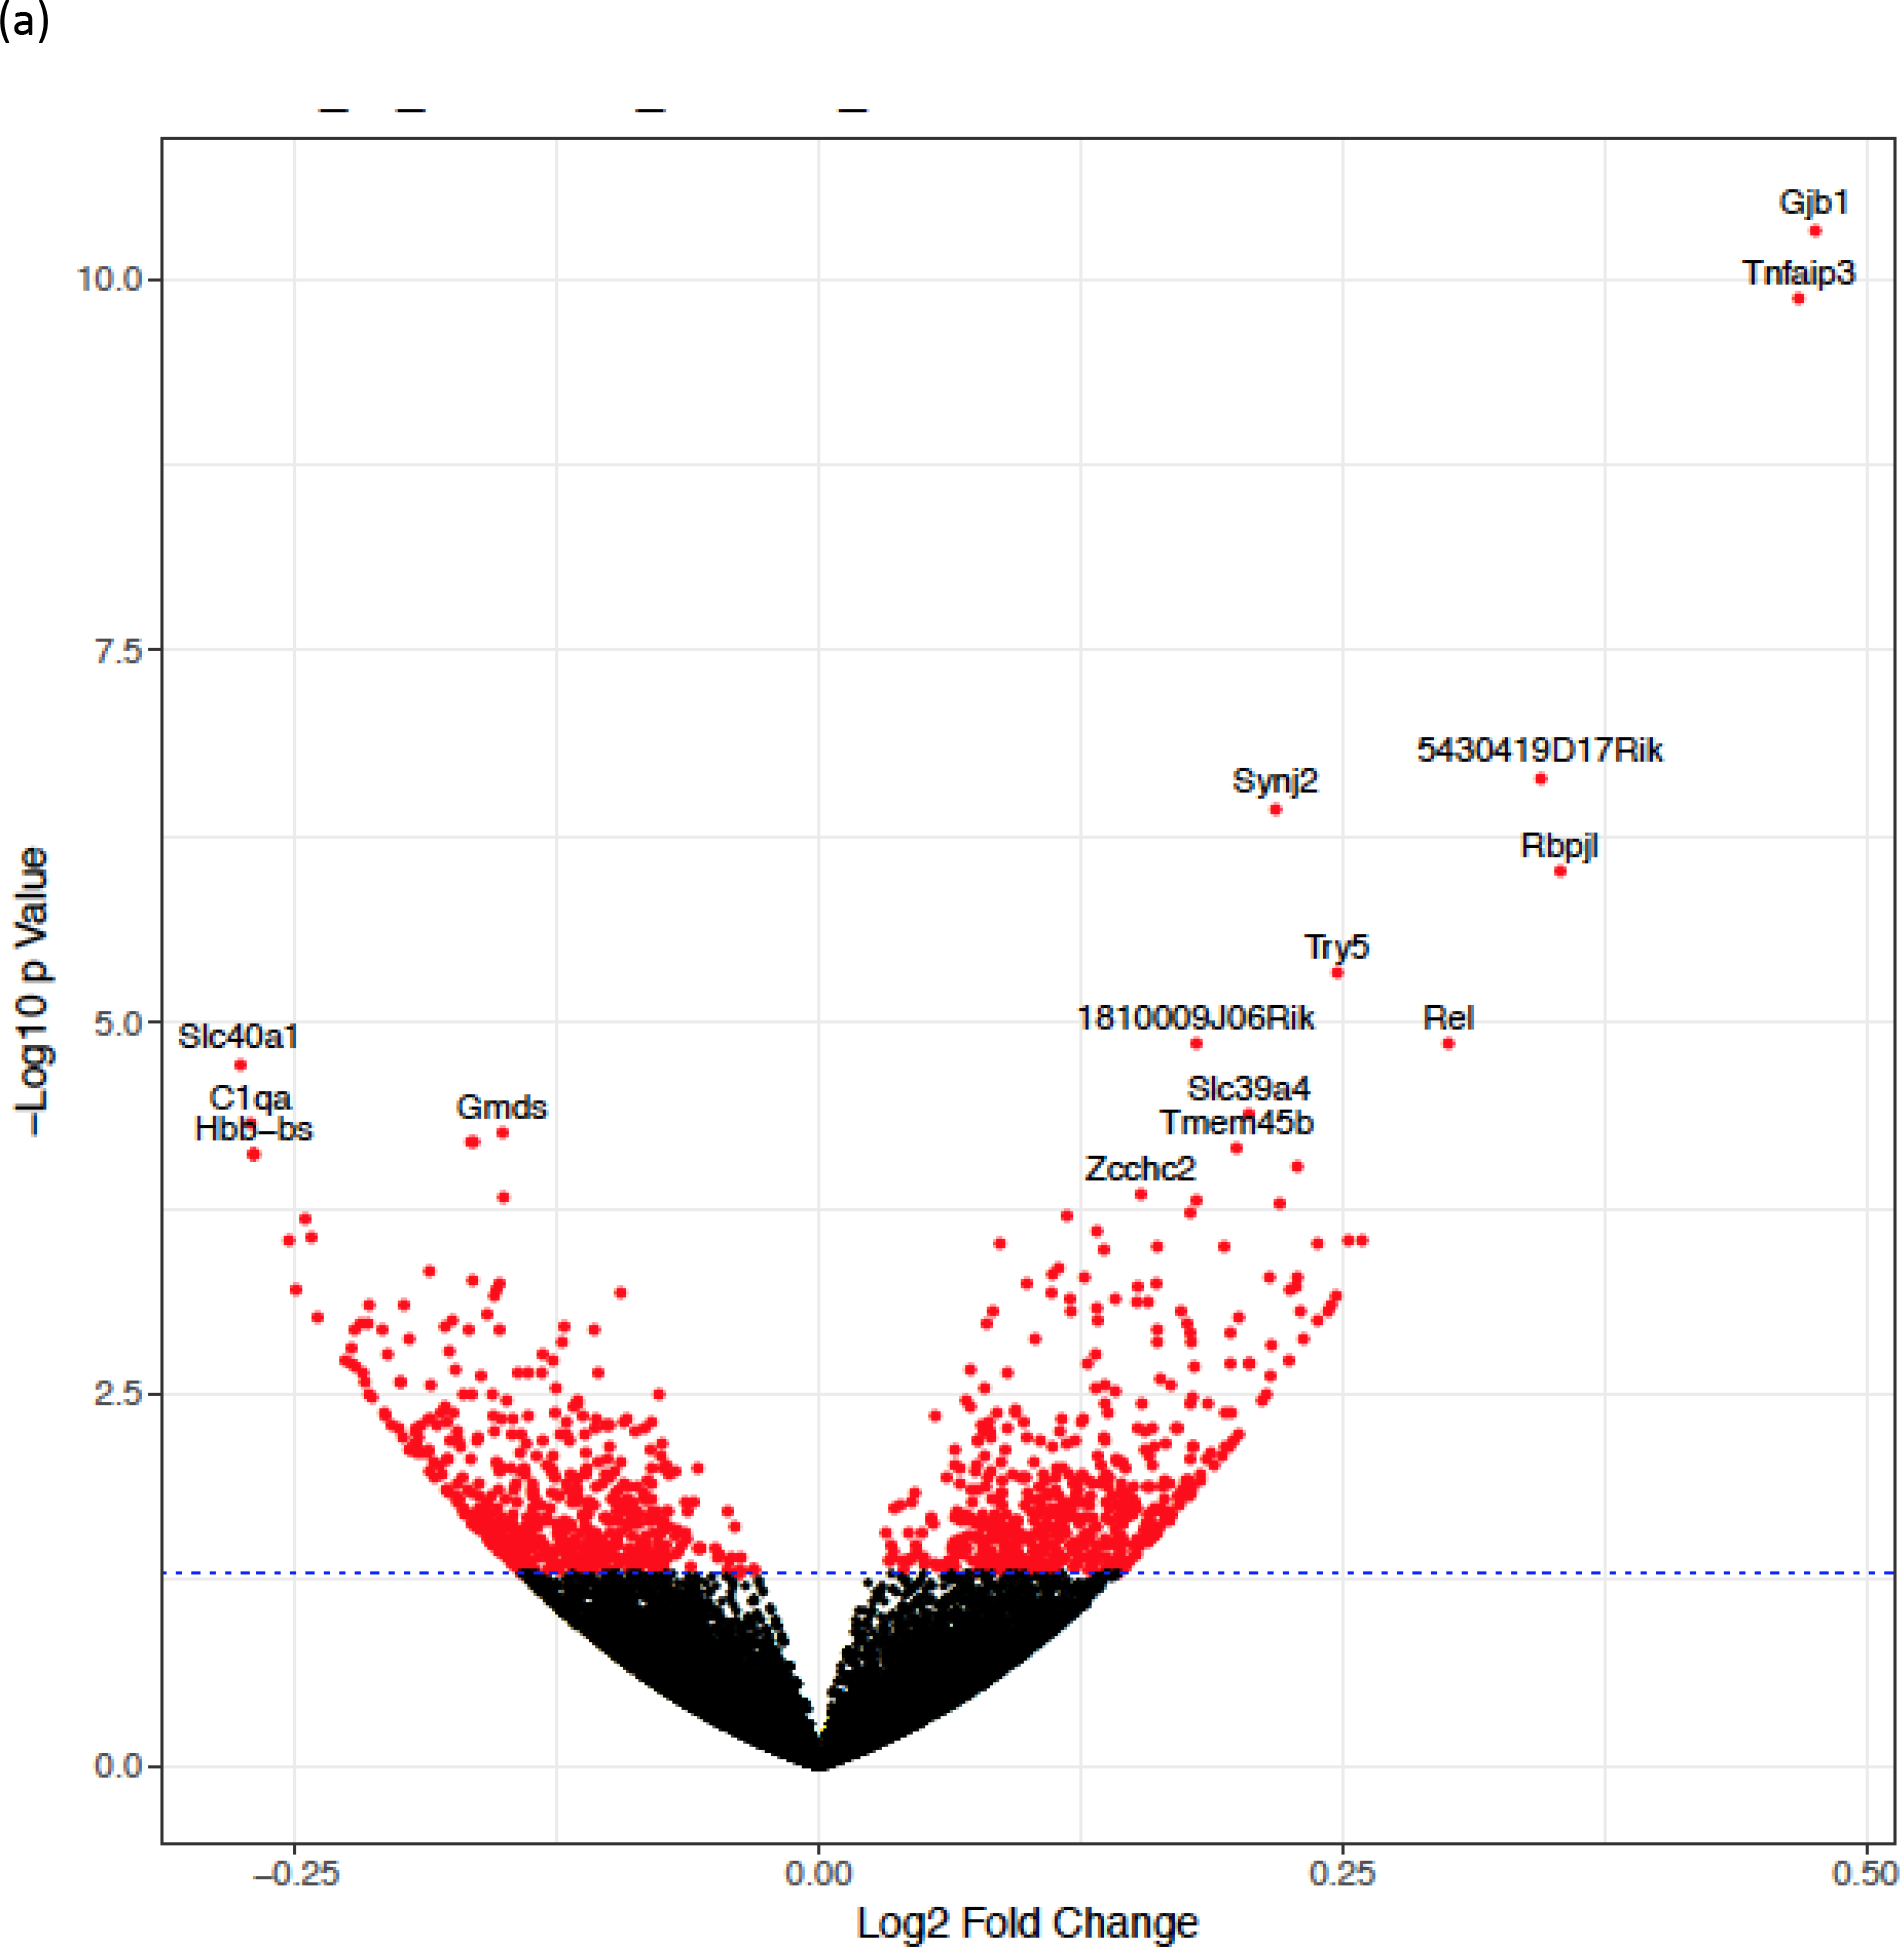
(a) Volcano plot of islet transcriptome in mice exposed to either Veh (n=5) or Cd (n=4) for 6 weeks. Data are expressed as mean ± SEM.
Table 1.
List of differentially expressed genes (determined by FDR-adjusted p<0.05) following 6 weeks of Cd exposure in mice.
| Genes | Cd/Veh Fold Change | FDR p-value | Mouse gene information |
|---|---|---|---|
| Gjb1 | 1.391 | 8.43 × 10⁻⁷ | http://www.informatics.jax.org/marker/MGI:95719 |
| Tnfaip3 | 1.383 | 1.23 × 10⁻⁶ | http://www.informatics.jax.org/marker/MGI:1196377 |
| 5430419D17Rik | 1.270 | 0.0014 | http://www.informatics.jax.org/marker/MGI:1918645 |
| Synj2 | 1.163 | 0.0016 | http://www.informatics.jax.org/marker/MGI:1201671 |
| Rbpjl | 1.278 | 0.0035 | http://www.informatics.jax.org/marker/MGI:1196616 |
| Try5 | 1.187 | 0.0140 | http://www.informatics.jax.org/marker/MGI:102756 |
| Rel | 1.232 | 0.0315 | http://www.informatics.jax.org/marker/MGI:97897 |
| 1810009J06Rik | 1.133 | 0.0315 | http://www.informatics.jax.org/marker/MGI:1920876 |
| Slc40a1 | 0.826 | 0.0383 | http://www.informatics.jax.org/marker/MGI:1315204 |
Fold changes are expressed as ratio of cadmium/vehicle (Cd/Veh). n=4–5/group.
3.3. Islet gene expression profile following 18 weeks of Cd exposure in vivo
To investigate the longer term effects of Cd on gene regulation, mice were exposed to either vehicle (n=6) or 1mM CdCl2 (n=5) in their drinking water for 18 weeks. Under these conditions, a total of 1008 genes were differentially expressed with a FDR-adjusted p-value <0.05. Data for these 1008 genes were plotted as a volcano plot (Fig. 3a). Of these 1008 differentially expressed genes, 759 genes were up-regulated and 249 genes were down-regulated. Pathway enrichment analysis was performed on the 1008 differentially expressed genes to identify genes associated with molecular pathways that are over-represented within the differential genes list. Pathway enrichment analysis showed significant clustering in the molecular processes relating to the Signal recognition particle (SRP)-dependent co-translational protein targeting to membrane (Fig. 3b). Molecular pathways associated with extracellular matrix organization, actin filament-based processes and cell adhesion regulation were also enriched in islets from mice exposed to Cd for 18 weeks (Fig. 3b). Collectively, these findings provide evidence that molecular mechanisms related to intracellular protein trafficking and organization were significantly altered as a result of long-term Cd exposure.
Fig. 3. Islet transcriptome profile of Veh and Cd-exposed mice following 18 weeks of exposure.


(a) Volcano plot of islet transcriptome and (b) Bar graph of pathway enrichment analysis of differentially expressed genes (as defined by FDR-adjusted p<0.05) in Veh (n=6) and Cd-exposed (n=5) mice following 18 weeks of Cd exposure.
3.4. Comparison of islet gene expression between 6 and 18 weeks of Cd exposure
When we compare differentially expressed genes between both the 6-week and 18-week in vivo exposure studies, we found five genes that are differently expressed in both time points. Synj2, Gjb1, Rbpjl, Try5 and 5430419D17Rik were up-regulated following 6 weeks of Cd exposure and continued to be up-regulated after 18 weeks of Cd exposure (Table 2). When we compare differentially expressed genes that are not in common between both time points, we found that there were 4 and 1003 genes from the 6-week and 18-week time points respectively (Figs. 2a and 3a). Changes in gene expression profile after 6 and 18 weeks of Cd exposure in vivo are likely a combination of primary, direct effects of Cd on islet physiology (e.g. intracellular metallothionein upregulation) as well as secondary effects resulting from systemic effects of Cd (e.g. altered renal function).
Table 2.
List of common up-regulated genes following 6 and 18 weeks of Cd exposure in vivo.
| Genes | 6-week Cd exposure | 18-week Cd exposure | Mouse gene information | ||
|---|---|---|---|---|---|
| Cd/Veh Fold change | FDR p-value | Cd/Veh Fold change | FDR p-value | ||
| Gjb1 | 1.391 | 8.43 × 10⁻⁷ | 1.665 | 0.0021 | http://www.informatics.jax.org/marker/MGI:95719 |
| 5430419D17Rik | 1.270 | 0.0014 | 1.523 | 0.0066 | http://www.informatics.jax.org/marker/MGI:1918645 |
| Synj2 | 1.163 | 0.0016 | 1.253 | 0.0007 | http://www.informatics.jax.org/marker/MGI:1201671 |
| Rbpjl | 1.278 | 0.0035 | 1.461 | 0.0167 | http://www.informatics.jax.org/marker/MGI:1196616 |
| Try5 | 1.187 | 0.0140 | 1.965 | 1.5 × 10⁻⁵ | http://www.informatics.jax.org/marker/MGI:102756 |
Fold changes are expressed as a ratio of cadmium/vehicle (Cd/Veh). n=4–6/group.
3.5. Validation of differently expressed genes at 6 and 18 weeks of Cd exposure by qPCR
As mentioned above, we found five differentially expressed genes that are commonly expressed in both time points following 6 and 18 weeks of Cd exposure in vivo: Synj2, Gjb1, Rbpjl, Try5 and 5430419D17Rik (Table 2). To validate expression of these differentially expressed genes, we performed qPCR on samples from our 6 weeks of Cd exposure studies. Of the five differentially expressed genes, we confirmed the up regulation of two genes (Synj2 and Try5) but could not confirm the expression of the remaining three genes by qPCR (one gene displayed expression levels below the detectable limit of the qPCR (Gjb1), one gene was not statistically significant by qPCR (Rbpj1) and the remaining gene was not tested (5430419D17Rik), Table 3).
Table 3.
List of differentially expressed genes (determined by FDR-adjusted p<0.05) following mRNA-Seq analysis in mice treated with Cd for 6 weeks and corresponding qPCR analysis of the five genes commonly expressed at both the 6 and 18 weeks of Cd exposure time points.
| Genes | mRNA-Seq | qPCR | ||
|---|---|---|---|---|
| Cd/Veh Fold Change | FDR p-value | Cd/Veh Fold Change | p-value | |
| Gjb1 | 1.391 | 8.43 × 10⁻⁷ | UD | UD |
| 5430419D17Rik | 1.270 | 0.0014 | n/a | n/a |
| Synj2 | 1.163 | 0.0016 | 1.460 | 0.0460* |
| Rbpjl | 1.278 | 0.0035 | 1.810 | 0.1040 |
| Try5 | 1.187 | 0.0140 | 3.821 | 0.0403* |
Fold changes are expressed as ratio of cadmium/vehicle (Cd/Veh). n=4–5/group. UD = undetectable, n/a = did not perform qPCR test
p<0.05.
3.6. Gene expression changes following ex vivo Cd exposure are distinct from those following in vivo exposure
To investigate the short-term effects of Cd on gene expression, pancreatic islets were isolated from unexposed, male, C57BL/6N mice and exposed to either vehicle (n=5) or 0.5μM CdCl2 (n=5) for 96 hours in culture. Comparison between control and Cd-exposed groups revealed only six differentially expressed genes as determined by FDR-adjusted p-value <0.05 (Table 4) despite higher levels of islet Cd accumulation (Fig. 1b). Of these differentially expressed genes, three genes were up-regulated (Mt1, Sphk1, Nrcam) and three genes were down-regulated (L3mbtl2, Rnf216, Itpr1) (Fig. 4, Table 4). It is interesting to note that these genes do not overlap with any of the differentially expressed genes following in vivo exposure for either 6 weeks or 18 weeks (Figs. 1b and 2a, Table 1). This suggests that the mechanisms of Cd-induced pancreatic islet gene changes in vivo are separate and distinct to that of the ex vivo mechanisms. Due to the limited number of differentially expressed genes (determined by FDR-adjusted p<0.05), pathway analysis was performed on statistically significant genes (defined by p<0.05 without FDR adjustment). Enrichment in genes involved in the cellular responses to growth factor stimulus, blood vessel development and extracellular matrix organization were observed following 96-hours of Cd exposure ex vivo (Suppl. Fig. 1b).
Table 4.
List of differentially expressed genes (determined by FDR-adjusted p<0.05) following 96 hours of 0.5μM CdCl2 exposure in pancreatic islet culture.
| Genes | Cd/Veh Fold change | FDR p-value | Mouse gene information |
|---|---|---|---|
| Mt1 | 1.2641 | 5.8 × 10⁻⁸ | http://www.informatics.jax.org/marker/MGI:97171 |
| Sphk1 | 1.1307 | 0.0182 | http://www.informatics.jax.org/marker/MGI:1316649 |
| L3mbtl2 | 0.8845 | 0.0355 | http://www.informatics.jax.org/marker/MGI:2443584 |
| Nrcam | 1.1115 | 0.0355 | http://www.informatics.jax.org/marker/MGI:104750 |
| Rnf216 | 0.9089 | 0.0355 | http://www.informatics.jax.org/marker/MGI:1344349 |
| Itpr1 | 0.9244 | 0.0355 | http://www.informatics.jax.org/marker/MGI:96623 |
Data are expressed as a ratio of cadmium/vehicle (Cd/Veh). n=5/group.
Fig. 4. Transcriptome profile of Veh and Cd-exposed islets ex vivo.

Volcano plot of islet transcriptome following 96 hours exposure of either Veh or 0.5μM CdCl2 in mouse pancreatic islet culture (n=5/group).
4. Discussion
Here, we report how Cd exposure both in a chronic, oral exposure mouse model and in pancreatic islet culture modifies islet gene expression using mRNA sequencing analysis. We showed the differential expression of 9 (Table 1) and 1008 (Fig. 3a) islet genes following 6 and 18 weeks of Cd exposure in mice respectively. Of these differentially expressed genes, five genes were observed to be commonly up-regulated at both time points: Synj2, Gjb1, Rbpjl, Try5 and 5430419D17Rik (Table2). With sustained ongoing Cd exposure, we found additional Cd-mediated gene changes in islets (Figs. 2a and 3a). Pathway enrichment analysis confirmed that these gene changes were clustered to molecular mechanisms related to intracellular protein trafficking to the plasma membrane (Fig. 3b). Alterations in gene expression profile at both time points likely includes primary Cd-mediated effects as well as secondary changes that occur downstream to the systemic Cd effects. These gene changes following in vivo Cd exposure were different from those following ex vivo Cd exposure. Studies in pancreatic islets following 96 hours of Cd exposure in culture demonstrated the Cd-mediated direct, primary effects on islet gene expression of Mt1, Sphk1, Nrcam, L3mbtl2, Rnf216 and Itpr1 (Fig. 4, Table 3).
One possible explanation for the differences in Cd-mediated gene expression in vivo and ex vivo could be attributed to the uptake, organification and toxicokinetic properties of Cd. In vivo, Cd is bound mainly to albumin or metallothionein (Jin, Nordberg et al. 1986, Nordberg 2004) whereas ex vivo, the primary form of Cd is inorganic, divalent Cd2+. It is likely that the higher degree of Cd accumulation under our ex-vivo exposure conditions resulted in activation of the MTF-1 pathway (a sensing mechanism for elevated divalent metals), thus resulting in some of the observed findings including the upregulation of Mt1 (Gunther, Lindert et al. 2012). However, the lack of overlap and lower number of differentially expressed genes is interesting and points to a qualitative difference between in vivo and ex vivo models that needs to be considered when interpreting results from Cd exposure models.
Of the five commonly up-regulated genes (Gjb1, Try5, Synj2, Rbpjl and 5430419D17Rik) following 6 and 18 weeks of in vivo Cd exposure, Gjb1 and Rbpjl have been reported to play a role in the pathophysiology of diabetes. Gjb1 (Gap junction protein beta 1) encodes a 32kDa, transmembrane, gap junction protein called connexin 32 (Corcos, Lafreniere et al. 1991). Connexin 32 is highly expressed in the liver, a major organ involved in glucose homeostasis, and has been implicated in the regulation of β-cell mass. Pancreas-specific over-expression of connexin 32 was shown to increase islet size and insulin content (Klee, Lamprianou et al. 2011). Interestingly, in contrast to our current in vivo study, Cd has also been shown to decrease expression of connexin 32 and gap junction intracellular communication in mouse primary liver culture (Jeong, Habeebu et al. 2000), which could in turn affect normal hepatic function. Thus, Cd-mediated Gjb1 dysregulation may contribute to abnormal glucose homeostasis. Clinically, mutations in GJB1 causes X-linked Charcot-Marie-Tooth (CMT1X) disease, a neuromuscular disorder that results in the loss of gap junction connexin 32 function expressed in myelinated Schwann cells which manifests as motor and sensory neuropathies (Kleopa, Abrams et al. 2012). Rbpjl is expressed almost exclusively in the pancreas and is a regulator of ctrb, a known gene that affects diabetes susceptibility through the incretin pathway (Hart, Fritsche et al. 2013). Missense mutation in Rbpjl is associated with T2DM in American Pima Indians (Nair, Sutherland et al. 2018). Further research is required to ascertain the role of Cd-mediated Rbpjl expression in the pathogenesis of diabetes. In contrast, the roles of Try5, Synj2 and 5430419D17Rik in the regulation of glucose metabolism is unclear. Try5 encodes for the digestive enzyme trypsin 5 that catalyses the cleavage of carboxyl groups from arginine and lysine. Synj2 encodes for the polyphosphoinositide phosphatase, synaptojanin 2 that is involved in clathrin-coated pits formation and clathrin-mediated endocytosis (Rusk, Le et al. 2003).
We also demonstrated the differential expression of Mt1, Sphk1, Nrcam, L3mbtl2, Rnf216 and Itpr1 in pancreatic islet culture following Cd exposure ex vivo (0.5μM for 96 hours). Sphk1 encodes for enzyme sphingosine kinase 1 (SK1) that phosphorylates sphingosine into sphingosine-1-phosphate (S1P) (Bonica, Mao et al. 2020). Nrcam encodes for neuronal cell adhesion molecule, a member of the immunoglobulin super family that has a role in neural development, synapse formation and axonal growth (Sakurai 2012). L3mbtl2 encodes the lethal (3) malignant brain tumour-like 2 protein (L3MBTL2) that is involved in ubiquitin signalling following DNA damage (Nowsheen, Aziz et al. 2018). Rnf216 encodes the ring finger protein 216 (RNF216) which plays an important role in spermatogenesis and is involved in protein degradation through the ubiquitin-proteosome pathway (Melnick, Gao et al. 2019). While the role of Sphk1, Nrcam, L3mbtl2 and Rnf216 in the pathogenesis of diabetes is not known, there are evidence to suggest that Mt1 and Itpr1 could be involved in glucose homeostasis. Mt1 is a low molecular weight, cysteine-rich, metal-binding protein that is known to be upregulated with Cd exposure (El-Muayed, Raja et al. 2012, Kimura, Hosaka et al. 2019). Islets isolated from mice overexpressing Mt1 displayed impairment in glucose-stimulated insulin secretion (Bensellam, Shi et al. 2019). Bensellam et al (2019) also observed increased Mt1 expression in human islets from diabetic donors and in diabetic db/db mice. Taken together, these observations support a possible role of Cd-induced Mt1 expression in the regulation of β-cell function. However, it is unclear whether transient upregulation of Mt1 could occur under certain in vivo Cd exposure conditions. It is possible that the upregulation of Mt1 could either have deleterious consequences or act as a protective mechanism, possibly as part of the MTF-1 pathway in pancreatic islets. Itpr1 is highly expressed in pancreatic β-cells and encode a ligand-gated Ca2+ channel that is responsible for intracellular Ca2+ release called inositol 1,4,5-triphosphate receptor, type 1 (IP3R1). In mice, genomic deletion of two exon in Itpr1 results in glucose intolerance, blunted second-phase glucose-stimulated insulin secretion (GSIS), decreased β-cell mass and reduced insulin content (Ye, Ni et al. 2011). This could suggest a possible role of Cd-induced Itpr1 regulation in the development of diabetes.
Changes in gene expression profile in response to Cd exposure have been demonstrated in various cell types and several Cd-mediated genetic mechanisms have been proposed (Fischer, Neumann et al. 2016). Changes in MTF-1 responsive genes such as Mt-1, where MTF-1 acts as a metal sensor are well characterized (Heuchel, Radtke et al. 1994). Other possible mechanisms for the altered transcription of several classes of genes in response to Cd exposure have also been proposed (Andrew, Warren et al. 2003, Cui, McBride et al. 2007, Hsiao and Stapleton 2009, Kawata, Shimazaki et al. 2009, Tvermoes, Bird et al. 2011, Liang, Wu et al. 2018). Epigenetic changes through metal-induced microRNA expression have also been suggested as possible mechanisms for arsenic and cadmium-mediated gene expression changes (Fay, Alt et al. 2018, Beck, Chandi et al. 2019, Yuan, Liu et al. 2020).
The oral 1mM CdCl2 dose administered for 6 and 18 weeks in mice resulted in intracellular islet Cd bioaccumulation that fall within the normal range observed in native human islets (4.35 – 94.71nmol/g protein) from the general population (Wong, Allen et al. 2017), thus making this in vivo Cd dose relevant in the context of human environmental Cd exposure. The higher nominal oral Cd exposure dose was necessary to compensate for the limitations of low Cd oral bioavailability and life-long tissue accumulation as reported in humans (Jarup, Rogenfelt et al. 1983, Schilderman, Moonen et al. 1997). The continued oral Cd exposure through drinking water closely resembles the exposure route in the general population, especially in pancreatic islets which are supplied by the portal circulation.
We have previously reported that insulin-producing β-cells and pancreatic islets accumulate Cd in culture and in vivo that is associated with impaired insulin secretion (El-Muayed, Raja et al. 2012, Fitzgerald, Olsen et al. 2020). We also previously showed that human islet samples from the general US population contain measurable levels of Cd (Wong, Allen et al. 2017). Many epidemiological studies have reported conflicting findings between the association of Cd exposure and dysglycemia. Some have reported a statistically significant, positive association between Cd exposure and dysglycemia (Schwartz, II’yasova et al. 2003, Wallia, Allen et al. 2014, Nie, Wang et al. 2016) while others have reported the lack of a statistically significant association (Barregard, Bergstrom et al. 2013, Moon 2013). These conflicting reports are likely a result of differences in study design, study power and population exposure levels (Wong, Wallia et al. 2016). They highlight the need for further investigation examining the relationship between Cd exposure and dysglycemia and its potential underlying mechanisms.
Several mRNA-Seq transcriptome studies in tissues from Cd-exposed mice have been reported in the literature. Hu et al (2014) reported alterations in key transcriptional genes in mouse testes that were involved in reproduction, hormone regulation and gamete formation following Cd exposure in vivo (Hu, Lu et al. 2014). Hudson et al (2019) reported differential expression of genes in newborn mouse cardiac tissue that were involved in cardiovascular disease, hypertension and cardiac size following in utero Cd exposure (Hudson, Belcher et al. 2019). To our knowledge, this is the first study describing transcriptome changes following Cd exposure in vivo and ex vivo in pancreatic islets that showed a pattern of gene expression changes that is distinct from other tissues.
In summary, findings described here reveal several novel Cd-mediated differentially expressed islet genes that may have possible roles in the development of T2DM. We also showed fundamental differences in islet gene expression changes following chronic, systemic Cd exposure compared to shorter, ex vivo exposure that need to be considered when interpreting various islet Cd exposure models. We hope that findings reported here will further our understanding and knowledge of the molecular mechanisms and genetic pathways in pancreatic islets that are mediated by Cd.
Supplementary Material
Highlights.
Islet cadmium accumulation in vivo are comparable to islet cadmium levels in humans
Cadmium-mediated islet transcriptome profile in vivo and ex vivo using mRNA-Seq
Cadmium-induced gene changes in vivo are distinct from ex vivo gene changes
Cadmium-mediated differentially expressed genes have potential role in diabetes
Acknowledgements
The authors thank Pieter Faber, PhD (Genomics Facility, Knapp Center for Biomedical Discovery, University of Chicago) for technical expertise.
Funding
This work was supported by the National Institutes of Health/National Institute of Environmental Health Sciences awarded to MEM (5R01ES027011).
Abbreviations
- BCA
bicinchoninic acid
- BSA
bovine serum albumin
- Cd
cadmium
- CdCl2
cadmium chloride
- FDR
false discovery rate
- GSIS
glucose-stimulated insulin secretion
- HBSS
Hank’s balanced salt solution
- HCl
hydrochloric acid
- HNO3
nitric acid
- ICP-MS
Inductively Coupled Plasma Mass Spectrometry
- NaOH
sodium hydroxide
- PBS
phosphate-buffered saline
- T2DM
type II diabetes mellitus
Footnotes
Declaration of competing interest
The authors declare that they have no known competing financial interests or personal relationships that could have appeared to influence the work reported in this paper.
Publisher's Disclaimer: This is a PDF file of an unedited manuscript that has been accepted for publication. As a service to our customers we are providing this early version of the manuscript. The manuscript will undergo copyediting, typesetting, and review of the resulting proof before it is published in its final form. Please note that during the production process errors may be discovered which could affect the content, and all legal disclaimers that apply to the journal pertain.
References
- Afridi HI, Kazi TG, Kazi N, Jamali MK, Arain MB, Jalbani N, Baig JA and Sarfraz RA (2008). “Evaluation of Status of Toxic Metals in Biological Samples of Diabetes Mellitus Patients.” Diabetes Research and Clinical Practice 80(2): 280–288. [DOI] [PubMed] [Google Scholar]
- Anders S, Pyl PT and Huber W (2015). “HTSeq-A Python Framework to Work with High-Throughput Sequencing Data.” Bioinformatics 31(2): 166–169. [DOI] [PMC free article] [PubMed] [Google Scholar]
- Andrew AS, Warren AJ, Barchowsky A, Temple KA, Klei L, Soucy NV, O’Hara KA and Hamilton JW (2003). “Genomic and proteomic profiling of responses to toxic metals in human lung cells.” Environ Health Perspect 111(6): 825–835. [DOI] [PMC free article] [PubMed] [Google Scholar]
- Barregard L, Bergstrom G and Fagerberg B (2013). “Cadmium exposure in relation to insulin production, insulin sensitivity and type 2 diabetes: a cross-sectional and prospective study in women.” Environ Res 121: 104–109. [DOI] [PubMed] [Google Scholar]
- Beck R, Chandi M, Kanke M, Styblo M and Sethupathy P (2019). “Arsenic is more potent than cadmium or manganese in disrupting the INS-1 beta cell microRNA landscape.” Arch Toxicol 93(11): 3099–3109. [DOI] [PMC free article] [PubMed] [Google Scholar]
- Bell RR, Early JL, Nonavinakere VK and Mallory Z (1990). “Effect of Cadmium on Blood Glucose Level in the Rat.” Toxicology Letters 54(2–3): 199–205. [DOI] [PubMed] [Google Scholar]
- Bensellam M, Shi Y-C, Chan JY, Laybutt DR, Chae H, Abou-Samra M, Pappas EG, Thomas HE, Gilon P and Jonas J-C (2019). “Metallothionein 1 Negatively Regulates Glucose-Stimulated Insulin Secretion and is Differentially Expressed in Conditions of beta Cell Compensation and Failure in Mice and Humans.” Diabetologia 62(12): 2273–2286. [DOI] [PubMed] [Google Scholar]
- Bonica J, Mao C, Obeid LM and Hannun YA (2020). “Transcriptional Regulation of Sphingosine Kinase 1.” Cells 9(11). [DOI] [PMC free article] [PubMed] [Google Scholar]
- Corcos IA, Lafreniere RG, Begy CR, Loch-Caruso R, Willard HF and Glover TW (1991). “Refined Localization of Human Connexin32 Gene Locus GJB1 to Xq13.1.” Genomics 13(2): 479–480. [DOI] [PubMed] [Google Scholar]
- Cui Y, McBride SJ, Boyd WA, Alper S and Freedman JH (2007). “Toxicogenomic analysis of Caenorhabditis elegans reveals novel genes and pathways involved in the resistance to cadmium toxicity.” Genome Biol 8(6): R122. [DOI] [PMC free article] [PubMed] [Google Scholar]
- Dalmieda J and Kruse P (2019). “Metal Cation Detection in Drinking Water.” Sensors 19(23): 5134–5178. [DOI] [PMC free article] [PubMed] [Google Scholar]
- Dobin A, Davis CA, Schlesinger F, Drenkow J, Zaleski C, Jha S, Batut P, Chaisson M and Gingeras TR (2013). “STAR: Ultrafast Universal RNA-Seq Aligner.” Bioinformatics 29(1): 15–21. [DOI] [PMC free article] [PubMed] [Google Scholar]
- El-Muayed M, Raja MR, Zhang X, MacRenaris KW, Bhatt S, Chen X, Urbanek M, O’Halloran TV and Lowe WL Jr (2012). “Accumulation of Cadmium in Insulin-producing beta-cells.” Islets 4(6): 405–416. [DOI] [PMC free article] [PubMed] [Google Scholar]
- Fay MJ, Alt LAC, Ryba D, Salamah R, Peach R, Papaeliou A, Zawadzka S, Weiss A, Patel N, Rahman A, Stubbs-Russell Z, Lamar PC, Edwards JR and Prozialeck WC (2018). “Cadmium Nephrotoxicity Is Associated with Altered MicroRNA Expression in the Rat Renal Cortex.” Toxics 6(1). [DOI] [PMC free article] [PubMed] [Google Scholar]
- Fischer BM, Neumann D, Piberger AL, Risnes SF, Koberle B and Hartwig A (2016). “Use of high-throughput RT-qPCR to assess modulations of gene expression profiles related to genomic stability and interactions by cadmium.” Arch Toxicol 90(11): 2745–2761. [DOI] [PMC free article] [PubMed] [Google Scholar]
- Fitzgerald R, Olsen A, Nguyen J, Wong WP, El-Muayed M and Edwards J (2020). “Pancreatic Islets Accumulate Cadmium in a Rodent Model of Cadmium-Induced Hyperglycemia.” International Journal of Molecular Sciences 22(1): 360. [DOI] [PMC free article] [PubMed] [Google Scholar]
- Ghafghazi T and Mennear JH (1973). “Effects of Acute and Subacute Cadmium Administration on Carbohydrate Metabolism in Mice.” Toxicology and Applied Pharmacology 26(2): 231–240. [DOI] [PubMed] [Google Scholar]
- Gunther V, Lindert U and Schaffner W (2012). “The taste of heavy metals: gene regulation by MTF-1.” Biochim Biophys Acta 1823(9): 1416–1425. [DOI] [PubMed] [Google Scholar]
- Hart LM, Fritsche A, Nijpels G, van Leeuwen N, Donnelly LA, Dekker JM, Alssema M, Fadista J, Carlotti F, Gjesing AP, Palmer CN, van Haeften TW, Herzberg-Schafer SA, Simonis-Bik AM, Houwing-Duistermaat JJ, Helmer Q, Deelen J, Guigas B, Hansen T, Machicao F, Willemsen G, Heine RJ, Kramer MH, Holst JJ, de Koning EJ, Haring HU, Pedersen O, Groop L, de Geus EJ, Slagboom PE, Boomsma DI, Eekhoff EM, Pearson ER and Diamant M (2013). “The CTRB1/2 locus affects diabetes susceptibility and treatment via the incretin pathway.” Diabetes 62(9): 3275–3281. [DOI] [PMC free article] [PubMed] [Google Scholar]
- Heuchel R, Radtke F, Georgiev O, Stark G, Aguet M and Schaffner W (1994). “The transcription factor MTF-1 is essential for basal and heavy metal-induced metallothionein gene expression.” EMBO J 13(12): 2870–2875. [DOI] [PMC free article] [PubMed] [Google Scholar]
- Hsiao CJ and Stapleton SR (2009). “Early sensing and gene expression profiling under a low dose of cadmium exposure.” Biochimie 91(3): 329–343. [DOI] [PubMed] [Google Scholar]
- Hu H, Lu X, Cen X, Chen X, Li F and Zhong S (2014). “RNA-Seq identifies key reproductive gene expression alterations in response to cadmium exposure.” Biomed Res Int 2014: 529271. [DOI] [PMC free article] [PubMed] [Google Scholar]
- Hudson KM, Belcher SM and Cowley M (2019). “Maternal cadmium exposure in the mouse leads to increased heart weight at birth and programs susceptibility to hypertension in adulthood.” Sci Rep 9(1): 13553. [DOI] [PMC free article] [PubMed] [Google Scholar]
- Jarup L, Rogenfelt A, Elinder CG, Nogawa K and Kjellstrom T (1983). “Biological half-time of cadmium in the blood of workers after cessation of exposure.” Scand J Work Environ Health 9(4): 327–331. [DOI] [PubMed] [Google Scholar]
- Jeong SH, Habeebu SS and Klaassen CD (2000). “Cadmium decreases gap junctional intercellular communication in mouse liver.” Toxicol Sci 57(1): 156–166. [DOI] [PubMed] [Google Scholar]
- Jin T, Nordberg GF and Nordberg M (1986). “Uptake of cadmium in isolated kidney cells--influence of binding form and in vivo pretreatment.” J Appl Toxicol 6(6): 397–400. [DOI] [PubMed] [Google Scholar]
- Jolly YN, Islam A and Akbar S (2013). “Transfer of Metals from Soil to Vegetables and Possible Health Risk Assessment.” SpringerPlus 15(1): 385–393. [DOI] [PMC free article] [PubMed] [Google Scholar]
- Kawata K, Shimazaki R and Okabe S (2009). “Comparison of gene expression profiles in HepG2 cells exposed to arsenic, cadmium, nickel, and three model carcinogens for investigating the mechanisms of metal carcinogenesis.” Environ Mol Mutagen 50(1): 46–59. [DOI] [PubMed] [Google Scholar]
- Kimura T, Hosaka T, Nakanishi T and Aozasa O (2019). “Long-term cadmium exposure enhances metallothionein-1 induction after subsequent exposure to high concentrations of cadmium in P1798 mouse lymphosarcoma cells.” J Toxicol Sci 44(4): 309–316. [DOI] [PubMed] [Google Scholar]
- Kirkley AG, Carmean CM, Ruiz D, Ye H, Regnier SM, Poudel A, Hara M, Kamau W, Johnson DN, Roberts AA, Parsons PJ, Seino S and Sargis RM (2018). “Arsenic exposure induces glucose intolerance and alters global energy metabolism.” Am J Physiol Regul Integr Comp Physiol 314(2): R294–R303. [DOI] [PMC free article] [PubMed] [Google Scholar]
- Klee P, Lamprianou S, Charollais A, Caille D, Sarro R, Cederroth M, Haefliger J-A and Meda P (2011). “Connexin Implication in the Control of the Murine Beta-Cell Mass.” Pediatric Research 70: 142–147. [DOI] [PubMed] [Google Scholar]
- Kleopa KA, Abrams CK and Scherer SS (2012). “How do mutations in GJB1 cause X-linked Charcot-Marie-Tooth disease?” Brain Res 1487: 198–205. [DOI] [PMC free article] [PubMed] [Google Scholar]
- Kolb H and Martin S (2017). “Environmental/Lifestyle Factors in the Pathogenesis and Prevention of Type 2 Diabetes.” BMC Medicine 15(1): 131–142. [DOI] [PMC free article] [PubMed] [Google Scholar]
- Kuo CC, Moon KA, Wang SL, Silbergeld E and Navas-Acien A (2017). “The Association of Arsenic Metabolism with Cancer, Cardiovascular Disease, and Diabetes: A Systematic Review of the Epidemiological Evidence.” Environ Health Perspect 125(8): 087001. [DOI] [PMC free article] [PubMed] [Google Scholar]
- Lei L-J, Chen L, Jin T-Y, Nordberg M and Chang X-L (2007). “Estimation of Benchmark Dose for Pancreatic Damage in Cadmium-Exposed Smelters.” Toxicological Sciences 97(1): 189–195. [DOI] [PubMed] [Google Scholar]
- Liang ZL, Wu DD, Yao Y, Yu FY, Yang L, Tan HW, Hylkema MN, Rots MG, Xu YM and Lau ATY (2018). “Epiproteome profiling of cadmium-transformed human bronchial epithelial cells by quantitative histone post-translational modification-enzyme-linked immunosorbent assay.” J Appl Toxicol 38(6): 888–895. [DOI] [PubMed] [Google Scholar]
- Love MI, Huber W and Anders S (2014). “Moderated Estimation of Fold Change and Dispersion for RNA-Seq Data with DESeq2.” Genome Biology 15(12): 550. [DOI] [PMC free article] [PubMed] [Google Scholar]
- Martin M (2011). “Cutadapt Removes Adapter Sequences From High-Throughput Sequencing Reads.” EMBnet.journal 17(1): 10–12. [Google Scholar]
- Melnick AF, Gao Y, Liu J, Ding D, Predom A, Kelly C, Hess RA and Chen C (2019). “RNF216 is essential for spermatogenesis and male fertilitydagger.” Biol Reprod 100(5): 1132–1134. [DOI] [PMC free article] [PubMed] [Google Scholar]
- Moon SS (2013). “Association of lead, mercury and cadmium with diabetes in the Korean population: the Korea National Health and Nutrition Examination Survey (KNHANES) 2009–2010.” Diabet Med 30(4): e143–148. [DOI] [PubMed] [Google Scholar]
- Nair AK, Sutherland JR, Traurig M, Piaggi P, Chen P, Kobes S, Hanson RL, Bogardus C and Baier LJ (2018). “Functional and association analysis of an Amerindian-derived population-specific p.(Thr280Met) variant in RBPJL, a component of the PTF1 complex.” Eur J Hum Genet 26(2): 238–246. [DOI] [PMC free article] [PubMed] [Google Scholar]
- Nie X, Wang N, Chen Y, Chen C, Han B, Zhu C, Chen Y, Xia F, Cang Z, Lu M, Meng Y, Jiang B, M DJ and Lu Y (2016). “Blood cadmium in Chinese adults and its relationships with diabetes and obesity.” Environ Sci Pollut Res Int 23(18): 18714–18723. [DOI] [PubMed] [Google Scholar]
- Nordberg GF (2004). “Cadmium and health in the 21st century--historical remarks and trends for the future.” Biometals 17(5): 485–489. [DOI] [PubMed] [Google Scholar]
- Nowsheen S, Aziz K, Aziz A, Deng M, Qin B, Luo K, Jeganathan KB, Zhang H, Liu T, Yu J, Deng Y, Yuan J, Ding W, van Deursen JM and Lou Z (2018). “L3MBTL2 orchestrates ubiquitin signalling by dictating the sequential recruitment of RNF8 and RNF168 after DNA damage.” Nat Cell Biol 20(4): 455–464. [DOI] [PMC free article] [PubMed] [Google Scholar]
- Petersmann A, Muller-Wieland D, Muller UA, Landgraf R, Nauck M, Freckmann G, Heinemann L and Schleicher E (2019). “Definition, Classification and Diagnosis of Diabetes Mellitus.” Experimental and Clinical Endocrinology & Diabetes 127(S 01): S1–S7. [DOI] [PubMed] [Google Scholar]
- Rusk N, Le PU, Mariggio S, Guay G, Lurisci C, Nabi IR, Corda D and Symons M (2003). “Synaptojanin 2 functions at an early step of clathrin-mediated endocytosis.” Curr Biol 13(8): 659–663. [DOI] [PubMed] [Google Scholar]
- Sakurai T (2012). “The role of NrCAM in neural development and disorders--beyond a simple glue in the brain.” Mol Cell Neurosci 49(3): 351–363. [DOI] [PubMed] [Google Scholar]
- Scherer G and Barkemeyer H (1983). “Cadmium Concentrations in Tobacco and Tobacco Smoke.” Ecotoxicology and Environmental Safety 7(1): 71–78. [DOI] [PubMed] [Google Scholar]
- Schilderman PA, Moonen EJ, Kempkers P and Kleinjans JC (1997). “Bioavailability of soil-adsorbed cadmium in orally exposed male rats.” Environ Health Perspect 105(2): 234–238. [DOI] [PMC free article] [PubMed] [Google Scholar]
- Schwartz GG, II’yasova D and Ivanova A (2003). “Urinary Cadmium, Impaired Fasting Glucose and Diabetes in the NHANES III.” Diabetes Care 26(2): 468–470. [DOI] [PubMed] [Google Scholar]
- Tvermoes BE, Bird GS and Freedman JH (2011). “Cadmium induces transcription independently of intracellular calcium mobilization.” PLoS One 6(6): e20542. [DOI] [PMC free article] [PubMed] [Google Scholar]
- U.S. Department of Health and Human Services and Center for Disease Control and Prevention (2020). National Diabetes Statistics Report 2020.
- Wallia A, Allen NB, Badon S and El Muayed M (2014). “Association between urinary cadmium levels and prediabetes in the NHANES 2005–2010 population.” Int J Hyg Environ Health 217(8): 854–860. [DOI] [PMC free article] [PubMed] [Google Scholar]
- White P and Kaestner KH (2009). “Gene expression analysis in diabetes research.” Methods Mol Biol 560: 239–261. [DOI] [PubMed] [Google Scholar]
- Wong WP, Allen NB, Meyers MS, Link EO, Zhang X, MacRenaris KW and El Muayed M (2017). “Exploring the Association Between Demographics, SLC30A8 Genotype, and Human Islet Content of Zinc, Cadmium, Copper, Iron, Manganese and Nickel.” Sci Rep 7(1): 473. [DOI] [PMC free article] [PubMed] [Google Scholar]
- Wong WP, Wallia A, Edwards JR and El Muayed M (2016). “Comment on Menke et al. Metals in Urine and Diabetes in U.S. Adults. Diabetes 2016;65:164–171.” Diabetes 65(9): e31. [DOI] [PMC free article] [PubMed] [Google Scholar]
- Ye R, Ni M, Wang M, Luo S, Zhu G, Chow RH and Lee AS (2011). “Inositol 1,4,5-trisphosphate receptor 1 mutation perturbs glucose homeostasis and enhances susceptibility to diet-induced diabetes.” J Endocrinol 210(2): 209–217. [DOI] [PMC free article] [PubMed] [Google Scholar]
- Yuan W, Liu L, Liang L, Huang K, Deng Y, Dong M, Chen J, Wang G and Zou F (2020). “Mi-R122-5p and miR-326–3p: Potential novel biomarkers for early detection of cadmium exposure.” Gene 724: 144156. [DOI] [PubMed] [Google Scholar]
- Zhou Y, Zhou B, Pache L, Chang M, Khodabakhshi AH, Tanaseichuk O, Benner C and Chanda SK (2019). “Metascape Provides a Biologist-Oriented Resource for the Analysis of Systems-Level Datasets.” Nature Communications 10(1): 1523–1533. [DOI] [PMC free article] [PubMed] [Google Scholar]
Associated Data
This section collects any data citations, data availability statements, or supplementary materials included in this article.