Abstract
The Asia-Pacific Blood and Marrow Transplantation Group (APBMT) has been conducting annual surveys on the activity of hematopoietic stem cell transplants since 2007. The APBMT Data Center collected the following data in 2017. A total of 21,504 transplants were registered from 733 transplant centers of 20 countries/regions in the Asia-Pacific (AP) region. Five countries/regions comprised 89.4% of all transplants - China (6,979), Japan (5,794), South Korea (2,626), India (2,034), and Australia (1,789). The number of centers in these five countries/regions also comprised 88.9% of all centers: Japan (373), China (123), India (66), Australia (45), and South Korea (44). The overall ratio between autologous and allogeneic transplants was 37.0% and 63.0%, respectively, but the ratios varied significantly among countries/regions. Autologous transplants have surpassed allogeneic transplants in Thailand, Australia, Vietnam, New Zealand, Singapore, and Iran. In contrast, the proportion of allogeneic transplants comprised over 70% of all transplants in Pakistan, China, and Hong Kong. These ratios were compared by the Data Center among countries/regions that performed more than 50 transplants. The proportion of related and unrelated transplants also differed among countries/regions. The number of unrelated transplants was more than related ones in Japan (2,551 vs. 1,202) and Australia (329 vs. 291), whereas more than 80% of all transplants were related transplants in Malaysia (90.9%), India (89.5%), Iran (87.2%), Vietnam (85.7%), China (80.9%), and Thailand (80.6%). All transplant activities were related transplants in Pakistan, the Philippines, Myanmar, and Nepal, and no allogeneic transplants were performed in Bangladesh and Mongolia. Regarding the indications for transplants, acute myeloid leukemia (AML) was the most common disease for allogeneic transplant (4,759, 35.1% of allogeneic transplants), while plasma cell disorder (PCD) was the most common disease for autologous transplant (3,701, 27.3% of all autologous transplants). Furthermore, the number of transplants for hemoglobinopathy has steeply increased in this region compared with the rest of disease indications (677, 3.1% of all transplants). APBMT covers a broad area globally, including countries/regions with diverse disease distribution, development of HSCT programs, population, and economic power. Consistent and continuous activity surveys considering those elements in each country/region revealed the HSCT field's diverse characteristics and background factors in this region.
Keywords: Asia-Pacific region, hematopoietic stem cell transplant, disease indication
Introduction
Hematopoietic stem cell transplantation (HSCT) has become an established therapy that is being actively performed worldwide as a potentially curative option for malignant and non-malignant hematological diseases, solid tumors, and other non-malignant non-hematological diseases1-5. Based on the reports from hematopoietic stem cell transplant registries, donor choices, stem cell sources, and transplant indications vary significantly among countries and regions6-11. The Asia-Pacific Blood and Marrow Transplantation Group (APBMT) conducted its first activity survey in 2007 to investigate the number of transplants in the Asia-Pacific (AP) region, and the survey has continued for 15 years12-14. As opposed to a single year cross-sectional survey, a continued survey could reveal changes in the trends of transplants in this region. Moreover, the survey shows the differences in the trends of transplants between this region and the rest of the world. Focusing on the disease indications for HSCT, including acute myeloid leukemia (AML), the most common indication for allogeneic transplants; plasma cell disorder (PCD), the most common indication for autologous transplants; and hemoglobinopathy, which has the highest transplant growth rate in this region, we describe the context of the adequacy of transplant medical services to the population.
Materials and Methods
Data collection and definitions
The APBMT Data Center conducted the activity survey by collecting the number of all HSCTs performed in 2017 from 20 of the 22 participating APBMT countries/regions. Each country/region reported its results (1) through national registries (the Australasian Bone Marrow Transplant Recipient Registry [ABMTRR], Chinese Blood and Marrow Transplantation Registry [CBMTR], Indian Society for Blood and Marrow Transplantation Registry [ISBMT], Korean Society of Blood and Marrow Transplantation [KSBMT], Japan Society for Transplantation and Cellular Therapy [JSTCT]/Japanese Data Center for Hematopoietic Cell Transplantation [JDCHCT], Malaysian Society of Transplantation [MST], and Taiwan Society of Blood and Marrow Transplantation [TBMT]) from eight countries/regions (Australia, New Zealand, China, India, Republic of Korea [referred to as South Korea in this paper], Japan, Malaysia, and Taiwan, respectively), (2) from individuals responsible for data collection in designated transplant centers (Bangladesh, Iran, Myanmar, the Philippines, Sri Lanka, and Thailand), or (3) from each institute (Hong Kong, Mongolia, Nepal, Pakistan, Singapore, and Vietnam). Indonesia and Cambodia did not launch HSCT programs in 2017.
Data were collected according to the transplant type of autologous and allogeneic, donor type, stem cell source, and disease indication using the APBMT format. As previously reported14, the APBMT counted the number of transplants as two for a patient who received transplants twice a year. If a patient received one transplant using more than one source of stem cells, the patient was counted as having one mixed transplant of bone marrow (BM) plus peripheral blood stem cells (PBSC), BM plus cord blood cells (CB), PBSC plus CB, or BM plus PBSC plus CB transplants.
The APBMT also defined the disease indications in detail. AML and acute lymphoid leukemia (ALL) were sub-classified into first complete remission (CR) and non-first CR, whereas chronic myelogenous leukemia (CML) was subclassified into first chronic phase (CP) on and non-first CP. Multiple myeloma (MM) and other plasma cell disorders (PCD) were considered as PCD. Lymphoblastic lymphoma, mature B-cell lymphoma, and mature T-/NK-cell lymphoma were classified as non-Hodgkin's lymphoma (NHL). Malignant lymphoma (ML) referred to Hodgkin's lymphoma (HL), NHL, and other lymphoproliferative disorders. Thalassemia and sickle cell disease (SCD) were classified as hemoglobinopathies.
Transplantation rate
Similar to our previous reports14, the transplantation rate in each country/region was calculated as the number of each type of HSCT per 10 million residents in 2017. The total population of each country was extracted from the United States Census Bureau report15.
Statistical analyses and ethical approval
All statistical analyses in this study were conducted at the APBMT Data Center. Since the data collected were only the number of transplants, the APBMT Data Center and the registries/institutes were not required to obtain informed consent from each patient. The APBMT activity survey was approved by the Aichi Medical University School of Medicine (2020-M025 and 2020-M026) and the APBMT Registry Committee.
Results
Number of centers and transplants in each country/region in 2017 (Table 1A and 1B)
Table 1.
The number of (A) centers, (B) total transplants, and the number and ratio of (C) allogeneic/autologous and (D) related/unrelated in each country/region in 2017
| (A) | (B) | (C) | (D) | |||||||||
|---|---|---|---|---|---|---|---|---|---|---|---|---|
| Country/Region | Centers (N) | Country/Region | Total transplants (N) | Country/Region | Autologous N (%) | Allogeneic N (%) | Country/Region | Related N (%) | Unrelated N (%) | |||
| Japan | 373 | China | 6,979 | Thailand | 142 (67.9) | 67 (32.1) | Malaysia | 113 (91.9) | 10 (8.1) | |||
| China | 123 | Japan | 5,794 | Australia | 1,169 (65.3) | 620 (34.7) | India | 1,036 (89.5) | 122 (10.5) | |||
| India | 66 | South Korea | 2,626 | Vietnam | 63 (64.3) | 35 (35.7) | Iran | 156 (87.2) | 23 (12.8) | |||
| Australia | 45 | India | 2,034 | New Zealand | 176 (62.9) | 104 (37.1) | Vietnam | 30 (85.7) | 5 (14.3) | |||
| South Korea | 44 | Australia | 1,789 | Malaysia | 178 (59.1) | 123 (40.9) | China | 4,387 (80.9) | 1,039 (19.1) | |||
| Malaysia | 16 | Taiwan | 437 | Singapore | 114 (54.8) | 94 (45.2) | Thailand | 54 (80.6) | 13 (19.1) | |||
| Taiwan | 14 | Iran | 382 | Iran | 203 (53.1) | 179 (46.9) | Singapore | 60 (63.8) | 34 (36.2) | |||
| Iran | 12 | Malaysia | 301 | Pakistan | 19 (11.3) | 149 (88.7) | Taiwan | 155 (61.5) | 97 (38.5) | |||
| Thailand | 9 | New Zealand | 280 | China | 1,553 (22.3) | 5,426 (77.1) | South Korea | 890 (60.7) | 576 (39.3) | |||
| New Zealand | 6 | Thailand | 209 | Hong Kong | 43 (29.7) | 102 (70.3) | New Zealand | 62 (59.6) | 42 (40.4) | |||
| Singapore | 5 | Singapore | 208 | South Korea | 1,160 (44.2) | 1,466 (55.8) | Hong Kong | 53 (52.0) | 49 (48.0) | |||
| Philippines | 4 | Pakistan | 168 | India | 876 (43.2) | 1,158 (56.9) | Japan | 1,202 (32.0) | 2,551 (68.0) | |||
| Bangladesh | 3 | Hong Kong | 145 | Taiwan | 185 (42.3) | 252 (57.7) | Australia | 291 (46.9) | 329 (53.1) | |||
| Pakistan | 3 | Vietnam | 98 | Japan | 2,041 (35.2) | 3,753 (64.8) | Sri Lanka | 5 | 3 | |||
| Hong Kong | 2 | Bangladesh | 15 | Bangladesh | 15 | 0 | Pakistan | 149 | 0 | |||
| Myanmar | 2 | Sri Lanka | 11 | Sri Lanka | 3 | 8 | Philippines | 4 | 0 | |||
| Vietnam | 2 | Philippines | 10 | Philippines | 6 | 4 | Myanmar | 2 | 0 | |||
| Sri Lanka | 2 | Myanmar | 8 | Myanmar | 6 | 2 | Nepal | 2 | 0 | |||
| Mongolia | 1 | Nepal | 7 | Nepal | 5 | 2 | Total | 8,651 (63.9) | 4,893 (36.1) | |||
| Nepal | 1 | Mongolia | 3 | Mongolia | 3 | 0 | ||||||
| Total | 733 | Total | 21,504 | Total | 7,960 (37.0) | 13,544 (63.0) | ||||||
A total of 733 centers from 20 countries/regions registered their data in 2017. There were five countries/regions where the number of centers exceeded 40 (Japan [373], China [123], India [66], Australia [45], and South Korea [44]), accounting for 88.9% of the total centers in the AP region. On the other hand, more than half of the countries/regions had less than 10 centers (Thailand, New Zealand, Singapore, Philippines, Bangladesh, Pakistan, Hong Kong, Myanmar, Vietnam, Sri Lanka, Mongolia, and Nepal). The total number of transplants was 21,504, which was 2.2 times higher than that in 2007. China (6,979) performed the highest number of transplants, followed by Japan (5,794), South Korea (2,626), India (2,034), and Australia (1,789). The transplant performed in these five countries accounted for 89.4% of the total transplants performed in the AP region.
Stem cell source and donor type
Out of the 21,504 transplants, 37.0% (7,960) and 63.0% (13,544) were autologous and allogeneic, respectively (Table 2). However, the ratio between autologous and allogeneic transplants varied considerably between countries (Table 1C). Among the countries/regions where the number of transplants performed was more than 50, the number of autologous transplants exceeded that of allogeneic transplants in Thailand (67.9%), Australia (65.3%), Vietnam (64.3%), New Zealand (62.9%), Malaysia (59.1%), Singapore (54.8%), and Iran (53.1%). Meanwhile, there were three countries/regions whose ratio of allogeneic transplants exceeded 70% (Pakistan [88.7%], China [77.1%], and Hong Kong [70.3%]). Except for Bangladesh and Mongolia where no allogeneic transplants were performed in 2017, 8,651 (63.9%) related and 4,893 (36.1%) unrelated transplants were done in 18 countries/regions (Table 2). Except for countries/regions without records of unrelated transplants (Myanmar, Nepal, Pakistan, and the Philippines), the related-to-allogeneic transplant ratio exceeded 80% in Malaysia (91.9%), India (89.5%), Iran (87.2%), Vietnam (85.7%), China (80.9%), and Thailand (80.6%). The ratio of unrelated transplants exceeded related ones only in Japan (68.0%) and Australia (53.1%) (Table 1D).
Table 2.
The number of transplants by disease indications and stem cell sources in 2017
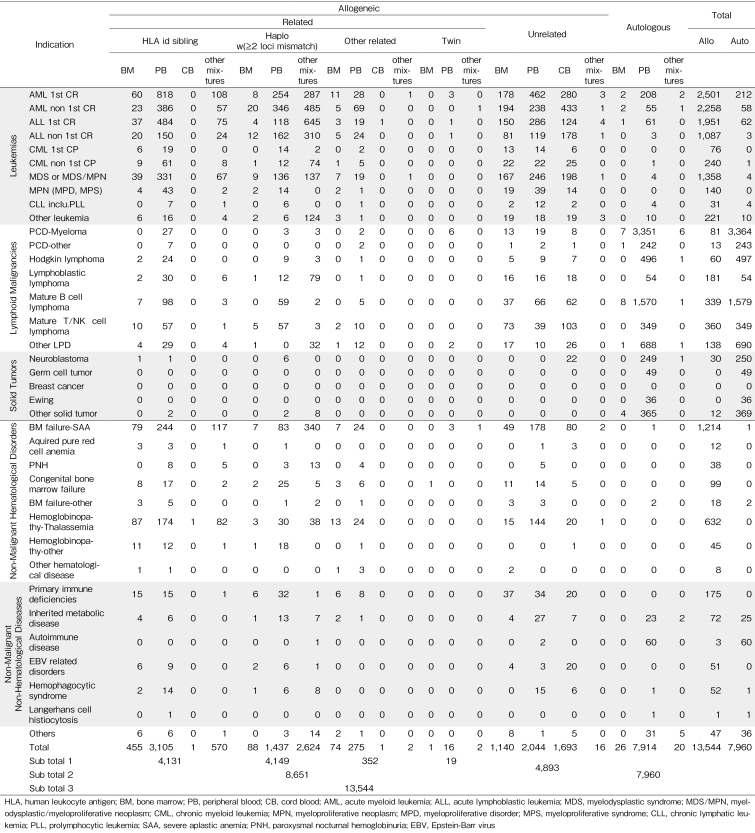
As shown in Table 2, the number of transplants from HLA-identical siblings and haploidentical donors were almost the same (4,131 and 4,149, respectively). Regarding the stem cell sources used for allogeneic transplants, PBSC was predominantly used (75.2%) in transplants from HLA-identical siblings. However, for haploidentical transplants, more than one stem cell source including PBSC was used more commonly than PBSC alone (63.2% vs. 34.6%). Of these mixtures of stem cell sources, 99.9% were BM plus PBSC, with China accounting for 99.2% of these transplants (data not shown). Among a total of 4,893 unrelated transplants, the numbers of BM, PBSC, and CB were 1,140 (23.3%), 2,044 (41.8%), and 1,693 (34.6%), respectively.
Disease indication
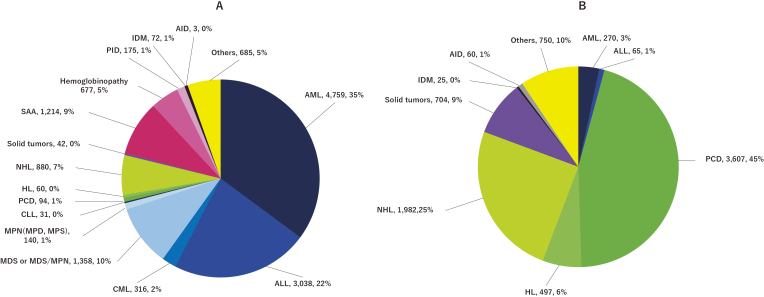
The number of transplants according to disease indication is listed in Table 2. The pie charts (Figure 1A and 1B) show the percentages of each indication for allogeneic and autologous transplantation, respectively. Main indications for allogeneic transplantation were AML (35.1%), ALL (22.4%), myelodysplastic syndrome (MDS), myelodysplastic/myeloproliferative neoplasm (MDS/MPN) (10.0%), severe aplastic anemia (SAA) (9.0%), NHL (6.5%), and hemoglobinopathy (5.0%). On the other hand, the main indications for autologous transplantation were PCD (45.3%), NHL (25.1%), solid tumors (8.8%), and HL (6.2%). More than 90% of transplants for AML (94.6%), SAA (99.9%), and hemoglobinopathy (100%) were allogeneic, whereas autologous transplants were predominantly done for PDCs (97.4%) and solid tumors (94.4%). Overall, the trends in the number of HSCTs for the six main disease indications (AML, ML, PCD, ALL, MDS or MDS/MPN, and SAA) have been consistently increasing since the 1980s (Figure 2A); however, those for solid tumors and CML significantly decreased in number around 2004 (Figure 2B). On the other hand, the number of HSCTs for hemoglobinopathy has steeply increased since 2006 (Figure 2B). Focusing on the increase rate of each disease indication compared between 2007 and 2017, we found that the fold increase in HSCT for hemoglobinopathy was the highest (4.4), followed by SAA (3.3), MDS or MDS/MPN (2.7), PCD (2.5), ALL (2.3), and AML (2.2).
Figure 1. Absolute number and relative proportion of disease indications. (A) Allogeneic transplants, (B) Autologous transplants.
AML, acute myelogenous leukemia; ALL, acute lymphoblastic leukemia; MDS, myelodysplastic syndrome; CML, chronic myeloid leukemia; MDS/MPN, myelodysplastic/myeloproliferative neoplasm; MPN, myeloproliferative neoplasm; MPD, myeloproliferative disorder; MPS, myeloproliferative syndrome; CLL, chronic lymphatic leukemia; PCD, plasma cell disorders; HL, Hodgkin lymphoma; NHL, non-Hodgkin lymphoma; SAA, severe aplastic anemia; PID, primary immune deficiencies; IDM, inherited disorders of metabolism; AID, autoimmune diseases
Figure 2. Trends in the total number of transplants by main disease indication. Total number of transplants in 2017: (A) >1,000, (B) <1,000.
AML, acute myelogenous leukemia; PCD, plasma cell disorders; ML, malignant lymphoma; ALL, acute lymphoblastic leukemia; MDS, myelodysplastic syndrome; MDS/MPN, myelodysplastic/myeloproliferative neoplasm; SAA, severe aplastic anemia; CML, chronic myeloid leukemia
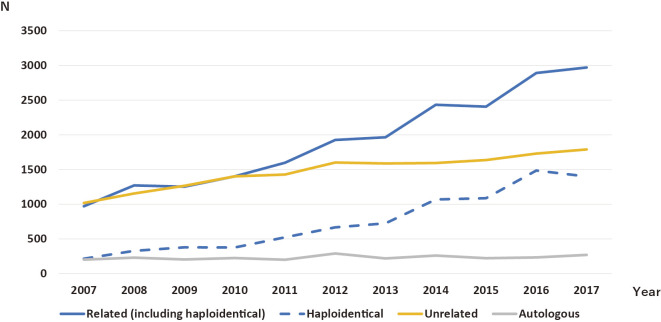
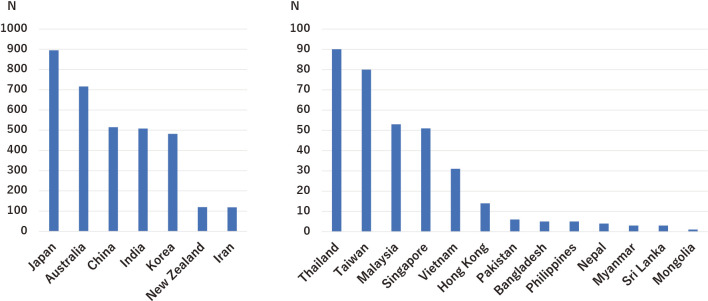
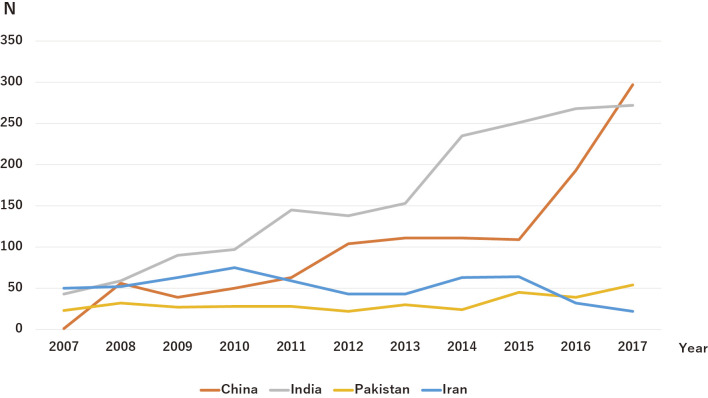
Although the number of transplants for AML has been the highest since 2007, the selection trends of stem cell sources for AML transplants have changed. Until 2010, the number of related and unrelated transplants for AML was almost the same. However, the number of related transplants significantly increased compared with that of unrelated transplants after 2010, and the gap continues to grow annually. Consequently, the number of haploidentical transplants for patients with AML steadily increased each year after 2010 in parallel with related transplants (Figure 3). Meanwhile, the main indication for autologous transplants was PCD in all countries/regions in the AP region. The number of transplants for PCD was highest in Japan (895), followed by Australia (716), China (515), India (508), and South Korea (482) (Figure 4). In addition, the number of transplants for hemoglobinopathy has been steeply increasing over the last 10 years (Figure 2B). In 2017, the transplants for hemoglobinopathy were very active in China (297), India (272), Pakistan (54), and Iran (22), with China and India recently showing rapid growth (Figure 5). These four countries accounted for 95.3% of all transplants for hemoglobinopathy in 2017.
Figure 3. Trends of the stem cell source selections for acute myeloid leukemia cases. Increased frequencies of related transplants reflect the frequencies of haploidentical transplants.
Figure 4. The number of transplants for plasma cell disorders by each country/region. Total number of transplants in 2017: (left) >100, (right) <100.
Figure 5. Trends of the number of transplants for hemoglobinopathy in the four major countries/regions. India has continued to treat cases of hemoglobinopathy using HSCT. Since 2016, China has rapidly increased its number of transplants for hemoglobinopathy.
Transplantation rates of AML and PCD
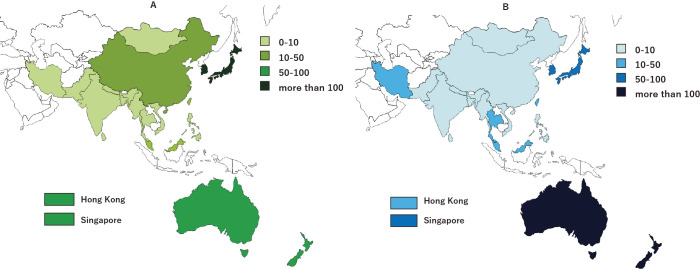
The transplantation rates of AML and PCD differed significantly among countries/regions. The number of transplants for AML per 10 million people ranged from 0 (Bangladesh, Mongolia, and Sri Lanka) to 123.8 (Japan) and 120.4 (South Korea), which were the highest reported numbers. For PCD-myeloma, the transplantation rate ranged from 0.3 (Bangladesh and Pakistan) to 275.0 (Australia) (Figure 6A and 6B).
Figure 6. Hematopoietic stem cell transplantation rates per 10 million population in the Asia-Pacific region in 2017. (A) Acute myeloid leukemia, (B) Plasma cell disorders.
Discussion
Over the past decades, HSCT has become a part of the standard treatment of hematological and non-hematological malignancies, as well as non-malignant hematological diseases worldwide1-5, with many registries reporting their transplant activities in different regions6-11. The APBMT first performed a transplant activity survey in 2007 and reported its results in 201012. Since then, the APBMT has been annually conducting an activity survey and reported that the number of transplants exceeded 10,000 in 200813 and 20,000 in 201614. By the end of 2017, the cumulative number of transplants in the AP region since 1986 was 239,819, indicating a recent rapidly increasing growth rate due to the remarkable yearly growth in the transplant activity of China and India11, 14. In addition to the countries/regions that had >1,500 transplants per year, other countries/regions have also actively performed HSCT in recent years.
Among the many indications for HSCT, AML has been the most common indication for all transplants worldwide2, 4, 5, 9, 10 and is ranked as the top disease indication for allogeneic transplants for the past decade in this region. Recently, a variety of stem cell sources and donors have become available, and the selection of optimal stem cell sources to achieve excellent results for each AML case are actively investigated16-19. Compared to unrelated transplants, we found a remarkable increase in the number of related transplants for patients with AML, which reflected the increasing number of haploidentical transplants. In particular, Chang et al. reported that haploidentical allogeneic transplants for AML were the most attractive alternative donors because almost every patient can find a donor in China20. Our survey results also reflected this continued growth in transplant activity, in which a significant number of patients with AML were treated with haploidentical transplants in China11.
Similar to the rest of the world1-10, 21, the proportion of multiple myeloma in autologous transplants in the AP region has remained the highest for more than a decade13, 14 even in 2017. Recently, transplant outcomes of multiple myeloma have been improving by combining novel agents (NA), second-generation proteasome inhibitors, third-generation immunomodulators, and antibody drugs with induction therapy22. In fact, despite being a common disease in older patients, some reports from Europe and Japan, where aging is progressing, showed that autologous transplants for MM in that population were safe and effective23, 24. Thus, the number of autologous transplants for MM is expected to increase in the future.
On the other hand, there are significant differences between countries/regions in the Asia-Pacific region in the number of transplants for AML and PCD per 10 million population. China, India, Indonesia, Pakistan, Bangladesh, and Japan showed up on the top 10 list of populations by country/region in 2017; however, it cannot be said that sufficient HSCT services are provided according to the population except for Japan. In addition, Bangladesh, Myanmar, Sri Lanka, Mongolia, Nepal, and Indonesia just started their transplant program in 2015, and there are not enough transplant facilities in these countries. These facts are thought to be caused by the imbalance between the population and the resources possessed by that country/region and should be resolved to develop transplantation medicine in these regions in the future.
The prevalence of hemoglobinopathy varies significantly from country to country. Thalassemia is predominantly observed in the Mediterranean, Middle East, Central and Southwest Asia, India, and Southern China. Sickle cell anemia, on the other hand, is more common in Africa, the Mediterranean coast, the Middle East, and northern India25, 26. For this reason, the number of transplants for hemoglobinopathy is reportedly high in Africa, the East Mediterranean, and AP region1-5, 9. Moreover, there is a significant bias in the number of hemoglobinopathy transplants depending on the country/region. Although the number of transplants were prominent in China, India, Pakistan, and Iran in 2017, there have been few reports from East Asia, including Japan and South Korea, despite their many transplant activities.
Allogeneic transplants have been used to treat thalassemia as a curative modality since the 1980s27. However, the number of patients receiving transplants remains insufficient. One reason is that there are not enough facilities in the Mediterranean and Central to Southeast Asian regions to receive transplants. Another reason is the high cost of transplant28. Many allogeneic transplants for SCD have also been reported, showing improved results over the past 20 years29. However, similar to thalassemia, improving human resources and transplant costs for SCDs seem to be an important task, especially in disease-prone areas.
Conclusion
Many HSCTs are performed in the Asia-Pacific region; however, its total numbers are considered to be still below the required levels to provide optimal access to transplants for the large population in the countries/regions in this region. One of the reasons is that many countries/regions that have just begun transplant programs lack financial resources to increase the number of centers and transplants compared to advanced areas. These countries/regions may need financial and human resources, and educational support. To accelerate the HSCT activities in the developing countries/regions, developed countries/regions as a whole must cooperate, and APBMT works to support them as the registry, and the transplant activity survey is vital to clarify their results.
Author Contributions
MI, SO, and YA designed the study and wrote the manuscript. KL, XJH, JHM, WD, AS, YA, AD, BK, AAH, KWH, AU, AH, TF, JS, HVM, MA, PA, MRB, AAG, BP, and KB submitted the data. MI analyzed the data. YA, AS, AD, LW, YK, AAH, AH, and SO revised the manuscript.
Conflicts of Interest
The authors declare no conflict of interest. Disclosure forms provided by the authors are available on the website.
MI, AS, and SO are members of the Editor of Blood Cell Therapy. They were not involved in the editorial evaluation or the decision to accept this article for publication.
Supplements
Acknowledgments
We sincerely appreciate all the members of the APBMT, especially the scientific committee members and their data managers, who gathered data in each registry, country, center, and hospital annually. We are also grateful for the cooperation of all participating teams, countries/regions, organizations, and their staff, especially for ABMTRR, CBMTR, ISBMT, KSBMT, JSHCT/JDCHCT, MST, and TBMT. This study was conducted by the APBMT Registry Committee and Data Center. We also thank Yukari Nakao and Hiroe Namizaki of the APBMT Data Center for their assistance. All centers contributing to the activity survey reported in this study (HSCTs performed in 2017) are listed in the Supplementary.
References
- 1.Gratwohl A, Baldomero H, Aljurf M, Pasquini MC, Bouzas LF, Yoshimi A, et al. Hematopoietic stem cell transplantation: a global perspective. JAMA. 2010; 303: 1617-24. [DOI] [PMC free article] [PubMed] [Google Scholar]
- 2.Gratwohl A, Pasquini MC, Aljurf M, Atsuta Y, Baldomero H, Foeken L, et al. One million haemopoietic stem-cell transplants: a retrospective observational study. Lancet Haematol. 2015; 2: e91-100. [DOI] [PubMed] [Google Scholar]
- 3.Gratwohl A, Baldomero H, Gratwohl M, Aljurf M, Bouzas LF, Horowitz M, et al. Quantitative and qualitative differences in use and trends of hematopoietic stem cell transplantation: a Global Observational Study. Haematologica. 2013; 98: 1282-90. [DOI] [PMC free article] [PubMed] [Google Scholar]
- 4.Niederwieser D, Baldomero H, Bazuaye N, Bupp C, Chaudhri N, Corbacioglu S, et al. One and a half million hematopoietic stem cell transplants: continuous and differential improvement in worldwide access with the use of non-identical family donors. Haematologica. 2021; 107: 1045-1053. [DOI] [PMC free article] [PubMed] [Google Scholar]
- 5.Niederwieser D, Baldomero H, Szer J, Gratwohl M, Aljurf M, Atsuta Y, et al. Hematopoietic stem cell transplantation activity worldwide in 2012 and a SWOT analysis of the Worldwide Network for Blood and Marrow Transplantation Group including the global survey. Bone Marrow Transplant. 2016; 51: 778-85. [DOI] [PMC free article] [PubMed] [Google Scholar]
- 6.CIBMTR. The US Summary Slides - HCT Trends and Survival Data, 2020. https://www.cibmtr.org/ReferenceCenter/SlidesReports/SummarySlides/pages/index.aspx [Accessed: 5 March 2022]
- 7.EBMT Activity Survey on HCT 2019. https://www.ebmt.org/registry/transplant-activity-survey [Accessed: 5 March 2022]
- 8.JDCHCT. Hematopoietic Cell Transplantation in Japan Annual Report of Nationwide Survey 2020 - Summary Slide, 2020. http://www.jdchct.or.jp/en/data/slide/2020/ [Accessed: 5 March 2022]
- 9.Baldomero H, Aljurf M, Zaidi SZA, Hashmi SK, Ghavamzadeh A, Elhaddad A, et al. Narrowing the gap for hematopoietic stem cell transplantation in the East-Mediterranean/African region: comparison with global HSCT indications and trends. Bone Marrow Transplant. 2019; 54: 402-17. [DOI] [PMC free article] [PubMed] [Google Scholar]
- 10.Gale RP, Seber A, Bonfim C, Pasquini M. Haematopoietic cell transplants in Latin America. Bone Marrow Transplant. 2016; 51: 898-905. [DOI] [PMC free article] [PubMed] [Google Scholar]
- 11.Xu LP, Lu PH, Wu DP, Sun ZM, Liu QF, Han MZ, et al. Hematopoietic stem cell transplantation activity in China 2019: a report from the Chinese Blood and Marrow Transplantation Registry Group. Bone Marrow Transplant. 2021; 56: 2940-7. [DOI] [PMC free article] [PubMed] [Google Scholar]
- 12.Yoshimi A, Suzuki R, Atsuta Y, Iida M, Lu DP, Tong W, et al. Hematopoietic SCT activity in Asia: a report from the Asia-Pacific Blood and Marrow Transplantation Group. Bone Marrow Transplant. 2010; 45: 1682-91. [DOI] [PubMed] [Google Scholar]
- 13.Iida M, Kodera Y, Dodds A, Ho AYL, Nivison-Smith I, Akter MR, et al. Advances in hematopoietic stem cell transplantation in the Asia-Pacific region: the second report from APBMT 2005-2015. Bone Marrow Transplant. 2019; 54: 1973-86. [DOI] [PMC free article] [PubMed] [Google Scholar]
- 14.Iida M, Dodds A, Akter M, Srivastava A, Moon JH, Dung PC, et al. The 2016 APBMT Activity Survey Report: Trends in haploidentical and cord blood transplantation in the Asia-Pacific region. Blood Cell Therapy. 2021; 4: 20-8. [DOI] [PMC free article] [PubMed] [Google Scholar]
- 15.Office USC. U.S. and World Population Clock, 2017. https://www.census.gov/popclock/world [Accessed: 5 March 2022]
- 16.Saraceni F, Labopin M, Gorin NC, Blaise D, Tabrizi R, Volin L, et al. Matched and mismatched unrelated donor compared to autologous stem cell transplantation for acute myeloid leukemia in first complete remission: a retrospective, propensity score-weighted analysis from the ALWP of the EBMT. J Hematol Oncol. 2016; 9: 79. [DOI] [PMC free article] [PubMed] [Google Scholar]
- 17.Cornelissen JJ, Blaise D. Hematopoietic stem cell transplantation for patients with AML in first complete remission. Blood. 2016; 127: 62-70. [DOI] [PubMed] [Google Scholar]
- 18.Aoki J, Kanamori H, Tanaka M, Yamasaki S, Fukuda T, Ogawa H, et al. Impact of age on outcomes of allogeneic hematopoietic stem cell transplantation with reduced intensity conditioning in elderly patients with acute myeloid leukemia. Am J Hematol. 2016; 91: 302-7. [DOI] [PubMed] [Google Scholar]
- 19.Takami A. Hematopoietic stem cell transplantation for acute myeloid leukemia. Int J Hematol. 2018; 107: 513-8. [DOI] [PubMed] [Google Scholar]
- 20.Chang YJ, Zhao XY, Huang XJ. Haploidentical Stem Cell Transplantation for Acute Myeloid Leukemia: Current Therapies, Challenges and Future Prospective. Front Oncol. 2021; 11: 758512. [DOI] [PMC free article] [PubMed] [Google Scholar]
- 21.Cowan AJ, Baldomero H, Atsuta Y, Mikhael J, Aljurf M, Seber A, et al. The Global State of Hematopoietic Cell Transplantation for Multiple Myeloma: An Analysis of the Worldwide Network of Blood and Marrow Transplantation Database and the Global Burden of Disease Study. Biol Blood Marrow Transplant. 2020; 26: 2372-7. [DOI] [PMC free article] [PubMed] [Google Scholar]
- 22.Rajkumar SV. Multiple myeloma: Every year a new standard? Hematol Oncol. 2019; 37 (Suppl 1): 62-5. [DOI] [PMC free article] [PubMed] [Google Scholar]
- 23.Mizuno S, Kawamura K, Hanamura I, Sunami K, Mori T, Nakamura F, et al. Efficacy and safety of autologous stem cell transplantation in patients aged ≥ 65 years with multiple myeloma in the era of novel agents. Bone Marrow Transplant. 2019; 54: 1595-604. [DOI] [PubMed] [Google Scholar]
- 24.Auner HW, Szydlo R, Hoek J, Goldschmidt H, Stoppa AM, Morgan GJ, et al. Trends in autologous hematopoietic cell transplantation for multiple myeloma in Europe: increased use and improved outcomes in elderly patients in recent years. Bone Marrow Transplant. 2015; 50: 209-15. [DOI] [PubMed] [Google Scholar]
- 25.Kattamis A, Forni GL, Aydinok Y, Viprakasit V. Changing patterns in the epidemiology of β-thalassemia. Eur J Haematol. 2020; 105: 692-703. [DOI] [PMC free article] [PubMed] [Google Scholar]
- 26.Piel FB, Patil AP, Howes RE, Nyangiri OA, Gething PW, Dewi M, et al. Global epidemiology of sickle haemoglobin in neonates: a contemporary geostatistical model-based map and population estimates. Lancet. 2013; 381: 142-51. [DOI] [PMC free article] [PubMed] [Google Scholar]
- 27.Lucarelli G, Polchi P, Izzi T, Manna M, Delfini C, Galimberti M, et al. Marrow transplantation for thalassemia after treatment with busulfan and cyclophosphamide. Ann N Y Acad Sci. 1985; 445: 428-31. [DOI] [PubMed] [Google Scholar]
- 28.Srivastava A, Shaji RV. Cure for thalassemia major - from allogeneic hematopoietic stem cell transplantation to gene therapy. Haematologica. 2017; 102: 214-23. [DOI] [PMC free article] [PubMed] [Google Scholar]
- 29.Arnold SD, Bhatia M, Horan J, Krishnamurti L. Haematopoietic stem cell transplantation for sickle cell disease - current practice and new approaches. Br J Haematol. 2016; 174: 515-25. [DOI] [PubMed] [Google Scholar]
Associated Data
This section collects any data citations, data availability statements, or supplementary materials included in this article.


