

Abstract
Cerebral small vessel disease (CSVD) is a group of pathological processes affecting small arteries, arterioles, capillaries, and small veins of the brain. It is one of the most common subtypes of cerebrovascular diseases, especially highly prevalent in elderly populations, and is associated with stroke occurrence and recurrence, cognitive impairment, gait disorders, psychological disturbance, and dysuria. Its diagnosis mainly depends on MRI, characterized by recent small subcortical infarcts, lacunes, white matter hyperintensities (WMHs), enlarged perivascular spaces (EPVS), cerebral microbleeds (CMBs), and brain atrophy. While the pathophysiological processes of CSVD are not fully understood at present, inflammation is noticed as playing an important role. Herein, we aimed to review the relationship between plasma inflammatory biomarkers and the MRI features of CSVD, to provide background for further research.
Keywords: cerebral small vessel disease, endothelial dysfunction, imaging features, inflammatory biomarkers
Existing evidence indicates that inflammation may play an important part in the pathogenesis of CSVD. The review focused on the association between inflammatory biomarkers and MRI features of CSVD, to make a reference for further research.

1. INTRODUCTION
Cerebral small vessel disease (CSVD) is a group of pathological processes affecting small arteries, arterioles, capillaries, and small veins of the brain, with a variety of etiologies. 1 It is very common and highly prevalent in the elderly, responsible for lacunar stroke (LS), vascular dementia (VaD), and vascular parkinsonism (VaP). 2 The symptoms of CSVD in some patients are not remarkable, or will present as stroke, 3 , 4 , 5 cognitive impairment, 6 , 7 , 8 , 9 , 10 , 11 , 12 , 13 , 14 , 15 , 16 gait disorders, 11 , 17 psychological disturbance (such as depression, delirium, and apathy), 17 , 18 urinary disorders, and ultimately loss of independence and disability, all of which place a heavy burden on both family and society. 19 , 20 The features of CSVD on magnetic resonance imaging (MRI) mainly include recent small subcortical infarcts, lacunes, white matter hyperintensities (WMHs), enlarged perivascular spaces (EPVS), cerebral microbleeds (CMBs), and brain atrophy. 21
Age and genetic factors are nonmodifiable risk factors for CSVD. The prevalence of CSVD increases with increasing age. 22 , 23 , 24 Currently, several monogenic inherited CSVDs have been identified, including cerebral autosomal dominant arteriopathy with subcortical infarcts and leukoencephalopathy (CADASIL), cerebral autosomal recessive arteriopathy with subcortical infarcts and leukoencephalopathy (CARASIL), cathepsin A‐related arteriopathy with strokes and leukoencephalopathy (CARASAL), hereditary diffuse leukoencephalopathy with spheroids (HDLS), COL4A1/2‐related disorders, and Fabry disease. 25 , 26 In addition, the most important modifiable risk factor is arterial hypertension, and other risk factors include diabetes mellitus, hyperlipidemia, smoking, 27 obstructive sleep apnea, 28 as well as socioeconomic and education status. 29
Currently, the pathogenesis of CSVD is not completely understood; however, endothelial dysfunction and subsequently increased blood–brain barrier (BBB) permeability have been implicated in the development of CSVD, supported by experimental studies, 30 , 31 , 32 neuropathological studies, 33 , 34 , 35 and imaging studies. 36 , 37 , 38 , 39 In addition, systemic inflammation was found to induce the migration of brain‐resident microglia to cerebral vasculature. These microglia were found to initially maintain BBB integrity, but then phagocytose astrocytic end‐feet and lead to BBB dysfunction. 40 Previous studies have shown that markers of systemic inflammation and vascular inflammatory/endothelial dysfunction may be associated with the prevalence, severity, and progression of CSVD. Herein, we aimed to review the research progress of the association between inflammatory biomarkers and MRI features of CSVD, to make a reference for further research.
2. METHODS
We searched PubMed and EMBASE databases by using the following search items: (cerebral small vessel disease) OR (CSVD) OR (leukoaraiosis) OR (white matter lesions) OR (white matter hyperintensities) OR (lacunar stroke) OR (lacunes) OR (perivascular spaces) OR (microbleeds) AND (biomarkers) OR (inflammation) OR (blood–brain barrier) OR (endothelial dysfunction). No language restrictions were applied. In addition, the references of the retrieved articles were reviewed and included if appropriate. The final selection was based on relevance, as judged by the authors.
After a careful reading of the retrieved literatures, we obtained a series of plasma biomarkers related to MRI features of CSVD, including systemic inflammation markers, such as C‐reactive protein (CRP), serum amyloid‐A protein (SAA), fibrinogen and cytokines (interleukin [IL], tumor necrosis factor [TNF], osteoprotegerin [OPG] and vascular endothelial growth factor [VEGF]), and vascular inflammation markers, such as adhesion molecules (E‐selectin, P‐selectin, intercellular adhesion molecule‐1 [ICAM‐1], and vascular cell adhesion molecule‐1 [VCAM‐1]), hemostasis factors (thrombomodulin [TM], tissue factor [TF], tissue factor pathway inhibitor [TFPI], von Willebrand factor [vWF], prothrombin fragment 1 + 2 [F 1 + 2], thrombin‐antithrombin complex [TAT], D‐dimer, tissue‐type plasminogen activator [t‐PA] and plasminogen activator inhibitor‐1 [PAI‐1]), and homocysteine (Hcy).
3. RESULTS
3.1. Imaging features of CSVD
Currently, the clinical diagnosis of CSVD mainly relies on imaging techniques, such as CT and MRI. The features of CSVD on MRI mainly include recent small subcortical infarcts, lacunes, WMHs, EPVS, CMBs, and brain atrophy (Figure 1). 21 A systematic review and meta‐analysis showed that there were statistically significant associations between WMHs and incident ischemic or hemorrhagic stroke, all‐cause dementia, depression as well as all‐cause mortality, with hazard ratios ranged 1.27–2.32. Significant associations were also found between other MRI features (lacunes, CMBs, and brain atrophy) and several aforementioned clinical events. 41 Based on the MRI features, Park and colleagues classified CSVD into three distinct classes: multiple, small, deep WMHs with a low burden of lacunes and CMBs (class I); large periventricular WMHs with a high burden of lacunes and CMBs (class II); and limited juxtaventricular WMHs lacking lacunes and CMBs (class III). The authors found that class II was associated with older age, diabetes, and higher neutrophil‐to‐lymphocyte ratio (NLR); while, class I was related to smoking and higher uric acid levels. 42 However, because of the limitation of cross‐sectional design, the outcomes of each class are unclear.
FIGURE 1.
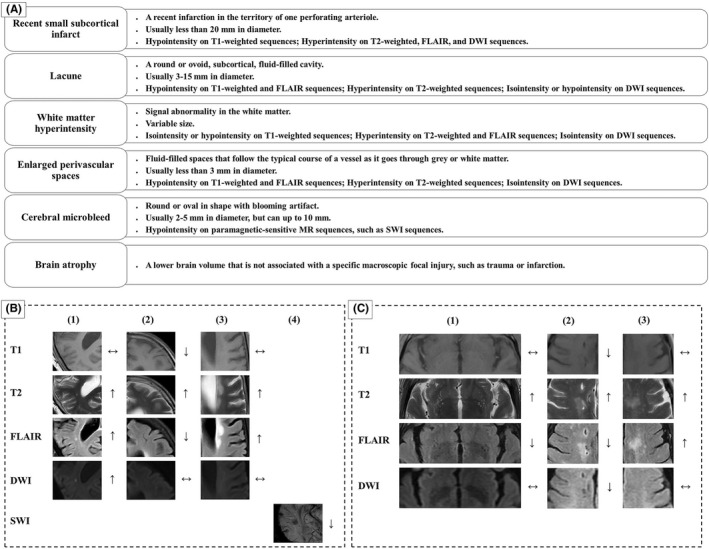
Features of CSVD on MRI. (A) The features of CSVD on MRI mainly included recent small subcortical infarcts, lacunes, white matter hyperintensities, enlarged perivascular spaces, cerebral microbleed, and brain atrophy. (B) Cranial MRI findings in a 56‐year‐old female with vascular dementia: (1) recent small subcortical infarct, (2) lacune, (3) white matter hyperintensities, and (4) cerebral microbleeds. (C) Cranial MRI findings in a 66‐year‐old male with clinical presentation of bradykinesia: (1) enlarged perivascular spaces, (2) lacunes, and (3) white matter hyperintensities. DWI represents diffusion‐weighted imaging; FLAIR, fluid‐attenuated inversion recovery; SWI represents susceptibility‐weighted imaging.
More advanced imaging methods, including diffusion tensor imaging (DTI), vessel wall imaging (VWI) and ultra‐high‐field MRI (such as 7‐T MRI), can detect microstructure damage earlier than conventional MRI sequences, providing the possibility for a reversal in early stage. DTI is a proper quantitative method to assess microstructure integrity of white matter (WM), including WMH and normal‐appearing WM [NAWM]. A nine‐year longitudinal study showed that DTI could detect impaired WM microstructure integrity years before WMH become visible on conventional neuroimaging. DTI‐derived parameters, such as fractional anisotropy (FA) and mean diffusivity (MD), have been shown to be associated with cognitive impairment, gait disorders, risk of mortality, and CSVD severity. 43 However, Brandhofe and colleagues found that the T2 relaxation time of NAWM was associated with cognition in CSVD patients, which the FA and MD of the NAWM failed to achieve. 44 More recently, newer acquisitions and models such as the free‐water (FW) model have shown greater associations with WM injury and cognitive impairment, as compared to the traditional DTI measures. 43 The development of vessel wall imaging (VWI) allows detailed evaluation of the vessel wall and lumen in a single image setting, enabling the visualization of actual pathology of the vessel wall before luminal narrowing becomes apparent, may help to depict the mechanisms underlying CSVD. Furthermore, this MRI technique may benefit from 7‐T MRI. A study using 7‐T vessel wall MRI showed that a higher intracranial atherosclerosis (ICAS) burden was associated with more CSVD MRI features. 45 In addition, 7‐T MRI has been shown to be more sensitive in detecting cerebral microinfarcts (CMIs), a manifestation of both small vessel and large vessel disease that is independently associated with cognitive impairment, as compared to conventional MRI. 46
3.2. Biomarkers of inflammation in CSVD
3.2.1. Systemic inflammation markers
C‐reactive protein
C‐reactive protein (CRP) belongs to the pentraxin family of calcium‐dependent ligand‐binding plasma proteins, which is the first described acute‐phase protein and an exquisitely sensitive but nonspecific systemic marker of inflammation and tissue damage. 47 CRP synthesis is predominantly in hepatocytes and principally regulated by the pro‐inflammatory cytokines, most notably IL‐6 and to a lesser degree IL‐1 and tumor necrosis factor alpha (TNF‐α). 48 Current evidence suggests that plasma CRP level has a direct effect on endothelial cells (ECs) by decreasing endothelial nitric oxide synthase (eNOS) expression and bioactivity, reducing nitric oxide (NO) production and increasing the release of vasoconstrictors and adhesion molecules, such as ICAM‐1, VCAM‐1, and E‐selectin, thus playing an important part in endothelial dysfunction. 49 , 50 Newer high‐sensitivity assays can measure CRP levels in the 0.01–10 mg/L range, that is hs‐CRP, and can therefore quantify low‐grade systemic inflammation in the absence of obvious systemic inflammation or immune disorders. 51 , 52
Serum amyloid‐A protein
Serum amyloid‐A protein (SAA) is also an acute‐phase protein synthesized by hepatocytes in response to cytokine activation, with sensitivity, response speed, and dynamic range comparable to CRP. 47 SAA is a marker of systemic inflammation by stimulating vascular cells to express cytokines, chemokines, adhesion molecules (such as ICAM‐1, VCAM‐1, and E‐selectin), and matrix metalloproteinases (MMPs). 53
Fibrinogen
Fibrinogen is a glycoprotein consisting of three pairs of disulfide‐bonded polypeptide chains, namely Aα, Bβ, and γ. It is synthesized primarily in hepatocytes and has a plasma half‐life of 3–4 days in humans. 54 Fibrinogen is also an acute‐phase protein with no specificity. Its level appears to be genetically determined, with circadian and seasonal variations, and is influenced by a number of circumstances and medications. Inflammation can elicit the release of fibrinogen in peripheral blood. 55 The normal blood level of fibrinogen is about 2 mg/ml, but it can rise to 3.6–4 mg/ml during different cardiovascular diseases. 56 Elevated levels of fibrinogen can lead to increased plasma viscosity and erythrocyte aggregation, enhanced platelet thrombogenesis and vascular reactivity, and disruption of EC layer integrity, resulting in vascular dysfunction. 54 , 56 , 57 , 58 , 59
Cytokines
The cytokine family consists of a variety of proteins that play an important role in inflammation. IL‐6 is an upstream inflammatory cytokine that leads to the production of downstream acute‐phase reactant in the liver and plays a central role in the inflammatory response. 60 TNF‐α is a pleiotropic cytokine synthesized by a number of cell types and plays an important role in inflammatory response through two cell membrane receptors, TNFR1 and TNFR2. 61 , 62 This pro‐inflammatory and tissue‐destructive cytokine is toxic to oligodendrocytes, thus mediating myelin damage and white matter degeneration. 61 Osteoprotegerin (OPG) is a soluble glycoprotein belonging to the tumor necrosis factor receptor superfamily. 62 , 63 It is a key regulator of immune defense system, apoptosis, and vascular calcification in human vascular biology. It binds to the receptor activator of NF kappa B ligand (RANKL) and tumor necrosis factor‐related apoptosis‐inducing ligand (TRAIL), thereby inhibiting activation of their pro‐inflammatory and proapoptotic signal pathway. 63 Vascular endothelial growth factor (VEGF) is the most specific growth factor of ECs and known as the main inducer of angiogenesis. 64 , 65 Animal studies showed that increased VEGF expression was associated with increased BBB permeability, resulting in vasogenic edema and leakage of blood‐derived substances into the brain parenchyma. 65 , 66
3.2.2. Vascular inflammation and endothelial dysfunction markers
Adhesion molecules
Vascular endothelial activation plays a key role in inflammation‐related pathological states. Aberrant or persistent activation of local vascular endothelium triggered by cytokine signaling can lead to overexpression of adhesion molecules, which in turn facilitate the recruitment, adhesion, and infiltration of leukocytes, thereby damaging vasculature and localized tissues. 67 Endothelial activation and dysfunction can be evaluated in vivo by measuring the levels of soluble plasma markers released into the blood when ECs are activated by a variety of stimulus. 68 E‐ and P‐selectins are members of the selectin family of adhesion molecules and facilitate leukocytes rolling along and reversible adhesion to vascular endothelium, whereas ICAM‐1 and VCAM‐1 belong to the immunoglobulin gene superfamily and mediate the adhesion, activation, and transendothelial migration of leukocytes. 62 , 67 , 68 , 69
Hemostasis factors
Similarly, thrombomodulin (TM) is normally expressed on the surface of ECs where it regulates protein C activity in conjunction with thrombin. Elevated plasma TM levels are thought to reflect endothelial injury. 70 Tissue factor (TF) can be expressed on monocytes and ECs in response to the stimulation of factors such as TNF. TF triggers the extrinsic coagulation pathway by binding to factor VII, thus increased levels of soluble TF reflect prothrombotic change. 70 Tissue factor pathway inhibitor (TFPI) is the physiological inhibitor of TF, which binds to factor Xa within the TF‐VIIa‐Xa complex, thereby preventing thrombosis. 70 The von Willebrand factor (vWF) is only synthesized in ECs and megakaryocytes, most of which are stored in platelet α‐granules and endothelial Weibel–Palade bodies (WPBs). Plasma vWF is majorly derived from ECs. 71 The vWF can be released into plasma and basement membrane on endothelial activation, thus to a certain extent reflecting endothelial activation. 72 On the contrary, vWF is a large multimeric glycoprotein in plasma, which plays a key role in hemostasis and thrombosis by mediating the adhesion of platelet to damaged and activated blood vessels. 71 Tissue‐type plasminogen activator (t‐PA) and plasminogen activator inhibitor‐1 (PAI‐1) determine the balance of fibrinolytic activity, both of which are synthesized and secreted from ECs. 73
Homocysteine
Another widely investigated inflammatory marker is homocysteine (Hcy), a thiol‐containing amino acid generated during the metabolization of methionine which is a natural amino acid consumed through normal diet. 74 There are three pathways involved in the Hcy metabolism, the remethylation pathway, the transsulfuration pathway, and direct release into the extracellular fluid. 75 Genetic variations of critical enzymes (e.g., Methyleneterahydrofolate reductase [MTHFR], methionine synthase [MS], methionine synthase reductase [MTRR], and cystathionine‐beta‐synthase [CBS]) in Hcy metabolism, deficiency of B‐vitamins (B2, B6, B9, and B12), unhealthy living habit (smoking and alcoholism), renal failure, and medications can lead to Hcy accumulation and increase of plasma Hcy levels. 76 There is evidence that elevated Hcy levels can damage ECs through a variety of pathological pathways, including vasomotor dysfunction, oxidative stress, vascular inflammation, prothrombotic condition, cellular hypomethylation, and protein N‐homocysteinylation, among which vascular inflammation plays an important role. 75 , 77 , 78 , 79 , 80 , 81 , 82 , 83
3.3. Association between inflammatory biomarkers and CSVD
3.3.1. CRP in CSVD
CRP and CSVD prevalence
There is a number of evidence showed that CRP was associated with CSVD (Table 1). Hoshi et al. showed an association between the hs‐CRP levels and the presence of silent brain infarction (SBI) in one hundred ninety‐four patients without histories of cardiovascular accidents. In unadjusted analysis, each standard deviation (SD) increase in log hs‐CRP was associated with 1.85‐fold higher likelihood for SBI. After adjustments for age, sex, traditional cardiovascular risk factors, medication use, and mean carotid intima–media thickness (IMT), the association persisted. 84 Similarly, in older Japanese with hypertension, the subjects with SBI had significantly higher hs‐CRP levels than those without after adjusting for confounding factors, and the odds ratio (OR) for the presence of SBI was increased with the quartile of hs‐CRP levels. 85 Sefuri study indicated that hs‐CRP was associated with confluent but not punctate deep white matter hyperintensity (DWMHs) in 259 community‐dwelling older adults with a mean age of 68.4 years. Logistic regression analysis showed that the log10 hs‐CRP value was one of the independent predictors of confluent DWMHs (OR = 3.024; 95% confidence interval [CI], 1.305–7.008; p = 0.010). Path analysis based on structural equation modeling (SEM) revealed that the direct path from log10 hs‐CRP to DWMHs was significant (β = 0.119, p = 0.039). 18 In 206 patients with first acute LS, Koh et al. showed that CRP levels were significantly higher in patients with microbleeds than those without (0.93 ± 0.97 vs. 0.52 ± 0.31, p = 0.047). 86 The role of CRP in the development of CSVD may vary among ethnic groups. Fornage et al. investigated the association between plasma CRP level, common variation in the CRP gene, and presence of WMH and brain infarcts (BI) in the elderly of the Cardiovascular Health Study and found a significant association between higher level of plasma CRP and higher risk of WMH in Whites, but not in Blacks. Adjustment for confounding factors did not significantly attenuate this association. 87
TABLE 1.
Associations of systemic inflammation biomarkers with MRI features of CSVD
| Source | Study design | No. | Filed strength | MRI features | CRP | Fib | IL‐6 | TNF‐α | TNFR2 | OPG | VEGF |
|---|---|---|---|---|---|---|---|---|---|---|---|
| Hoshi et al. 84 | Cross‐sectional | 194 | 1.5 T | Lacunes | OR = 1.5 | OR = 1.85 | |||||
| Ishikawa et al. 85 | Cross‐sectional | 514 | 1.5 T | Lacunes | OR = 2.08 | ||||||
| DWMH | No | ||||||||||
| Yao et al. 18 | Cross‐sectional | 259 | 1.5 T | cDWMH | OR = 2.88 | ||||||
| Koh et al. 86 | Cross‐sectional | 206 | 1.5 T | CMBs | Yes | ||||||
| Fornage et al. 87 | Cross‐sectional | 3644 | 1.5 T | WMHs | Yes | Yes | |||||
| BI | Yes | Yes | |||||||||
| Wada et al. 88 | Cross‐sectional | 689 | ‐ | Lacunes | No | ||||||
| WMHs | No | ||||||||||
| Wright et al. 89 | Cross‐sectional | 527 | 1.5 T | WMHs | No | ||||||
| Mitaki et al. 90 | Cross‐sectional | 519 | 1.5 T | Lacunes | OR = 3.57 | ||||||
| WMHs | No | ||||||||||
| CMBs | No | ||||||||||
| Hilal et al. 92 | Cross‐sectional | 2814 | 1.5 T | Lacunes | RR = 1.61 | ||||||
| WMHs | β = 0.06 | ||||||||||
| CMBs | RR = 0.74 | ||||||||||
| EPVS | RR = 1.01 | ||||||||||
| Schmidt et al. 93 | Longitudinal (6‐year) | 505 | 1.5 T | Lacunes | No | ||||||
| WMHs | No | ||||||||||
| van Dijk et al. 94 | Longitudinal (3.3‐year) | 636 | 1.5 T | Lacunes | No | ||||||
| PVH | OR = 3.1 | ||||||||||
| DWMH | OR = 2.5 | ||||||||||
| Umemura et al. 95 | Longitudinal (6‐year) | 190 | 1.5 T | Lacunes | OR = 1.54 (3‐year) | ||||||
| WMHs | No | ||||||||||
| Wada et al. 97 | Cross‐sectional | 667 | ‐ | Lacunes | No | No | |||||
| WMHs | No | OR = 1.99 | |||||||||
| Wei et al. 98 | Cross‐sectional | 186 | 3.0 T | PVH | OR = 12.6 | ||||||
| DWMH | No | ||||||||||
| You et al. 99 | Cross‐sectional | 170 | 3.0 T | PVH | OR = 2.1 | ||||||
| DWMH | OR = 1.8 | ||||||||||
| Guo et al. 100 | Cross‐sectional | 74 | 3.0 T | WMHs | No | OR = 1.1 | |||||
| Shen et al. 101 | Cross‐sectional | 164 | 3.0 T | EPVS | No | ||||||
| Liu et al. 102 | Cross‐sectional | 85 | 3 T | CMBs | OR = 2.16 | ||||||
| Staszewski et al. 103 | Longitudinal (2‐year) | 123 | 1.5 T | Lacunes | OR = 1.02 | ||||||
| WMHs | OR = 1.01 | ||||||||||
| Jefferson et al. 104 | Cross‐sectional | 1926 | 1.0 T | WMHs | No | No | No | No | No | ||
| Satizabal et al. 105 | Longitudinal (4‐year) | 1841 | 1.5 T | Lacunes | No | No | |||||
| WMHs | No | No | |||||||||
| Satizabal et al. 106 | Cross‐sectional | 1820 | 1.5 T | BG‐EPVS | No | OR = 1.38 | |||||
| WM‐EPVS | No | No | |||||||||
| Staszewski et al. 2 | Longitudinal (2‐year) | 123 | 1.5 T | Lacunes | No | No | No | ||||
| WMHs | No | No | No | ||||||||
| Noz et al. 107 | Longitudinal (2‐year) | 51 | 1.5 T | WMHs | No | r = 0.29 | |||||
| Shoamanesh et al. 62 | Cross‐sectional | 1763 | 1.0 T | CMBs | No | No | No | No | OR = 2.2 | No | No |
| SCI/WMHs | No | No | No | No | No | OR = 1.1 | No | ||||
| Zhang et al. 65 | Cross‐sectional | 146 | 3.0 T | CMBs | OR = 2.37 | ||||||
| Rouhl et al. 19 | Cross‐sectional | 346 | 1.5 T | Lacunes | No | ||||||
| WMHs | No | ||||||||||
| CMBs | No | ||||||||||
| BG‐EPVS | No | ||||||||||
| Kawamura et al. 114 | Longitudinal (3‐year) | 120 | 1.5 T | Lacunes | No | ||||||
| Kario et al. 115 | Cross‐sectional | 160 | 1.5 T | Lacunes | Yes | ||||||
| Gottesman et al. 116 | Cross‐sectional | 410 | 1.5 T | Lacunes | No | No | |||||
| Wang et al. 117 | Cross‐sectional | 100 | 1.5 T | BG‐EPVS | No | No | No | No |
Abbreviations: BG‐EPVS, basal ganglia‐EPVS; BI, brain infarct; cDWMH, confluent DWMH; CMB, cerebral microbleed; CRP, C‐reactive protein; DWMH, deep WMH; EPVS, enlarged perivascular spaces; Fib, fibrinogen; IL, interleukin; MCP‐1, monocyte chemoattractant protein‐1; OPG, osteoprotegerin; OR, odds ratio; PVH, periventricular hyperintensity; RR, rate ratio; SCI, silent cerebral infarct; TNFR2, tumor necrosis factor receptor‐2; TNF‐α, tumor necrosis factor‐α; VFGF, vascular endothelial growth factor; WM‐EPVS, white matter‐EPVS; WMH, white matter hyperintensity; β/r, correlation coefficient.
CRP and CSVD severity
In a community‐based group of Japanese elderly (n = 689), there was no statistical significance between hs‐CRP and the number of lacunes or grades of WMHs. 88 Furthermore, Wright et al. showed that participants with hs‐CRP in the upper quartile had larger volume of WMH after adjustment for sociodemographic and vascular risk factors, whereas, further adjusting for all biomarkers simultaneously, hs‐CRP was not associated with the volume of WMH. 89 However, considerable evidence showed that the CRP levels were associated with CSVD severity: Mitaki et al. found that subjects with higher hs‐CRP had more lacunar infarcts (p = 0.02) and CMBs (p = 0.03), and more severe DWMH (p = 0.04) and periventricular hyperintensity (PVH) (p = 0.04). Logistic regression analysis showed that the association between the tertiles of hs‐CRP and the presence of lacunar infarcts was significant after adjustment for traditional cardiovascular risk factors. 90 Walker et al. further investigated the association between 21‐year longitudinal pattern of hs‐CRP and the development of the volume of WMH. After controlling for demographic variables and cardiovascular risk factors, participants in the early ascending group (low CRP [<3 mg/L] at visit 2, and elevated CRP [3 mg/L] at visits 4 and 5) demonstrated greater volume of WMH (0.35 SD; 95% CI: 0.07–0.64; p = 0.015) compared to those in stable low group (low CRP at all 3 visits). 91 Hilal et al. showed that higher CRP levels were associated with larger WMHV and increasing numbers of lacunes, EPVS, and deep/infratentorial microbleeds in 2814 participants with a mean age of 56.9 years from the Rotterdam Study; additionally, higher CRP levels were found to be associated with smaller gray matter volume, but not with white matter and hippocampal volumes. 92
CRP and CSVD progression
Results from the studies of CRP in CSVD progression are conflicting. Using prospective data from a large random sample of middle‐aged and elderly, asymptomatic, community‐dwelling subjects in the Austrian Stroke Prevention Study, Schmidt et al. demonstrated no significant association between the levels of CRP and the severity or progression of WMHs or lacunes. 93 A study based on the prospective, population‐based Rotterdam Scan confirmed that higher levels of CRP were significantly associated with the presence and progression of WMHs, even after adjusted cardiovascular risk factors and carotid atherosclerosis. In addition, participants with higher CRP levels tended to have more prevalent and incident lacunar infarcts than those with lower CRP levels; however, these associations were not significant. 94 In a 6‐year longitudinal study with 190 type 2 diabetic patients with a mean age of 62.7 years, higher baseline levels of hs‐CRP were significantly associated with SBI progression at the year‐3 follow‐up (p = 0.020), but not the year‐6 follow‐up. Whereas no significant association of baseline hs‐CRP levels with year 3 or 6 of WMH progression was observed. 95
3.3.2. SAA and CSVD
The relationship between SAA and MRI features of CSVD is unclear yet. The ongoing LIMITS (Levels of Inflammatory Markers in the Treatment of Stroke) study may provide the identification of inflammatory biomarkers, including hs‐CRP, SAA, IL‐6, CD40 ligand (CD40L), TNFR1, and monocyte chemoattractant protein‐1 (MCP‐1), for using in predicting recurrent stroke and other vascular events among patients with a history of small vessel IS or lacunes. 96
3.3.3. Fibrinogen and CSVD
The relationship between fibrinogen and CSVD has already been investigated (Table 1). A cross‐sectional study showed that in community‐based Japanese elderly, plasma fibrinogen levels were associated with more lacunes and higher grades of WMHs, and there was an independent association between fibrinogen and WMHs. Additionally, subjects with high levels of fibrinogen accompanied by high levels of vWF or TM were more likely to present with moderate WMHs. 97 Wei et al. showed that in patients with IS and atrial fibrillation (AF), plasma fibrinogen levels were independently and positively correlated with the presence of WMHs and PVH (both p < 0.05). Compared with patients with normal level of fibrinogen, those with abnormally high levels of fibrinogen had an increased tendency for the presence of WMHs and PVH, with OR of 14.037 (95% CI 2.588–76.131) and 12.567 (95% CI 2.572–61.395), respectively. However, there was no significant difference in fibrinogen levels between patients with and without DWMH. 98 By contrast, You et al. demonstrated that in nondiabetic patients with noncardiogenic acute IS, fibrinogen was independently and positively associated with WMHs, regardless of PVH and DWMH, with OR of 2.114 (95% CI 1.034–4.322) and 1.788 (95% CI 1.170–2.732), respectively. 99 Furthermore, a cross‐sectional study indicated that fibrinogen was an independent risk factor for the severity of WMHs in CADASIL patients, with the OR of 1.064 (95% CI 1.004–1.127), but not in sporadic CSVD (sCSVD) patients. 100 Likely, study by Shen et al. showed that the fibrinogen level was associated with the degrees of white matter (WM)‐EPVS (p = 0.018), but not with the degrees of basal ganglia (BG)‐EPVS (p = 0.347). Additionally, the association between fibrinogen level and WM‐EPVS disappeared after adjustment. 101 Liu and colleagues revealed that the presence of CMBs in IS patients with AF and/or rheumatic heart disease was independently associated with elevated fibrinogen levels (OR 2.16, 95% CI 1.20–3.90, p = 0.01). 102 Notably, a 2‐year, single‐center, prospective, cohort study indicated that fibrinogen was significantly correlated with an increased risk of new lacunes or WMHs progression, with OR of 1.02 (95% CI 1.006–1.011), regardless of the clinical SVD manifestation (LS, VaD and VaP). 103
3.3.4. IL‐6 and CSVD
IL‐6 and CSVD prevalence
The relationship between IL‐6 and CSVD remains controversial (Table 1). Jefferson et al. found that IL‐6 levels were not significantly related to white matter hyperintensities /total cranial volume (WMH/TCV) in 1926 Framingham Offspring participants free from clinical stroke, transient ischemic attack (TIA), or dementia with a mean age of 60 years. 104 Fornage et al. observed significant and graded associations between plasma IL6 levels and WMH in both Whites and Blacks and between plasma IL6 levels and BI in Whites. Additionally, the study provided evidence of a genetic basis underlying the association between plasma biomarkers of inflammation and CSVD. Common haplotypes of the IL6 gene were found to be significantly associated with WMH and BI in Whites, but not in Blacks. 87 Hoshi et al. showed that in 194 patients without histories of cardiovascular accidents, higher IL‐6 levels were associated with higher likelihood for SBI (OR, 2.00/SD increase), and this association was slightly attenuated after adjustment for traditional cardiovascular risk factors and carotid IMT (OR, 1.85/SD increase). 84
IL‐6 and CSVD severity
Satizabal et al. studied 1841 participants aged 65–80 years from the Three City‐Dijon cohort and showed that higher levels of IL‐6 were cross‐sectionally associated with higher total and periventricular WMH volume (WMHV), independent of age, sex, and vascular risk factors. However, there was no association between IL‐6 levels and deep WMH. Additionally, participants with elevated IL‐6 levels were more likely to have SBI, although nonsignificantly. 105 Similarly, the authors also demonstrated that elevated IL‐6 levels were significantly associated with the burden of BG‐EPVS. 106
IL‐6 and CSVD progression
Satizabal and colleagues observed no associations between baseline plasma IL‐6 levels and the evolution of CSVD MRI findings over 4 years in the Three City‐Dijon cohort study. 105 By contrast, Staszewski et al. showed that after adjustment for age, sex, baseline mean arterial pressure (MAP), and MRI lesions load, IL‐6 was significantly associated with the risk of any radiological progression (OR, 7.4; 95% CI, 1.48–37; p = 0.02), which was defined as an increase in WMHs or the development of new lacunes in one or more periventricular and/or subcortical regions. Besides, IL‐6 was marginally associated with the development of new lacunes (OR, 6.0; 95% CI, 0.95–38; p = 0.05), but not with the progression of WMH. Additional adjustment for clinical SVD manifestations did not alter these associations. 2 Furthermore, Noz et al. showed that circulating high‐sensitivity IL‐6 (hsIL‐6) highly correlated with WMH at baseline in 2006 and 2015 and with WMH progression between 2006 and 2015 in elderly subjects with mild‐to‐severe CSVD (p = 0.005, rs = 0.399; p = 0.01, rs = 0.363; p = 0.04, rs = 0.294, respectively). 107
3.3.5. TNF and CSVD
Jefferson and colleagues found that TNF‐α or TNFR2 was not related to WMH/TCV in 1926 Framingham Offspring participants. 104 Shoamanesh et al. found higher levels of circulating TNFR2 in participants with CMBs (OR 2.2, 95% CI 1.1–4.1) in 1763 stroke‐free Framingham offspring, and a secondary analysis further showed that the association was the most prominent in participants with only deep CMBs. Additionally, the association between TNFR2 and CMBs increased with the increase in CMB burden. As compared with having no CMBs, each unit increase in Ln TNFR2 was associated with a 3.3‐fold increase in the odds of having ≥2 CMBs and 5.7‐fold increase in the odds of having ≥3 CMBs. However, no significant association between TNF‐α levels and prevalent CMB was found. 62
3.3.6. OPG and CSVD
The role of OPG in CSVD has been poorly studied (Table 1). Jefferson et al. showed that OPG levels were negatively correlated with TCBV (the ratio of total brain volume [TCB] to total cranial volume [TCV]), but not with WMH. 104 Guldiken and colleagues found that although plasma OPG levels were independently associated with the presence of IS, there was no significant increase in OPG levels in the SVD subtype of stroke. 63 Shoamanesh et al. observed higher levels of OPG in participants with greater volumes of WMH and/or SCIs in 1763 stroke‐free Framingham offspring. However, since cervical or intracranial large artery disease was not accounted within the study, the results may be secondary to small vessel orifice atheroma or chronic hypoperfusion due to proximal large artery stenosis. 62
3.3.7. VEGF and CSVD
Zhang et al. showed that elevated VEGF levels were significantly and independently associated with the presence of CMBs in patients with Alzheimer's disease (AD). After controlling for confounding factors, the OR (95% CI) of 10 pg/ml increase in VEGF levels for the presence of CMBs was 2.37 (1.53–4.02) (p = 0.004). Multivariate regression analysis further demonstrated a significant correlation between the combination of clinical factors and VEGF levels and the number of CMBs (p < 0.001; adjusted R2 total = 0.312). 65
3.3.8. Adhesion molecules and CSVD
Adhesion molecules and CSVD prevalence
There is considerable evidence that endothelial activation and dysfunction are associated with CSVD (Table 2). Fassbender et al. found that compared with age‐ and sex‐matched controls, sICAM‐1 was significantly elevated in patients with subcortical vascular encephalopathy (SVE). 68 Framingham Heart Study found that ICAM‐1 (OR 1.7, 95% CI 1.1–2.5; p = 0.02) and lipoprotein‐associated phospholipase A2 (Lp‐PLA2) mass (OR 1.5, 95% CI 1.1–2.1; p = 0.01) were positively correlated with extensive WMHs and/or SCIs. 62 Tchalla et al. observed a linear correlation between the volumes of WMH and the levels of sVCAM‐1 (r = 0.47 p = 0.018) in community‐based participants, and the association persists significantly after adjusting for comorbidity index. 108 Similarly, Wu et al. demonstrated that sICAM‐1 levels were associated with the presence of CMBs and increased risk of hemorrhagic transformation (HT) after anticoagulant therapy in 148 patients with acute ischemic stroke (AIS). 109
TABLE 2.
Associations of adhesion molecules with MRI features of CSVD
| Source | Study design | No. | Filed strength | MRI features | VCAM‐1 | ICAM‐1 | E‐selectin | P‐selectin |
|---|---|---|---|---|---|---|---|---|
| Jefferson et al. 104 | Cross‐sectional | 1926 | 1.0 T | WMHs | No | No | ||
| Shoamanesh et al. 62 | Cross‐sectional | 1763 | 1.0 T | CMBs | No | No | ||
| SCI/WMHs | OR = 1.7 | No | ||||||
| Tchalla et al. 108 | Cross‐sectional | 25 | 3.0 T | WMHs | r = 0.47 | |||
| Wu et al. 109 | Cross‐sectional | 148 | 1.5 T | CMBs | Yes | |||
| de Leeuw et al. 69 | Cross‐sectional | 29 | 1.5 T | PVH | Yes | No | No | Yes |
| DWMH | No | No | No | No | ||||
| Han et al. 110 | Cross‐sectional | 175 | 1.5 T | PVH | OR = 5.0 | |||
| DWMH | OR = 4.1 | |||||||
| Rouhl et al. 19 | Cross‐sectional | 346 | 1.5 T | Lacunes | No | No | No | No |
| WMHs | No | No | No | No | ||||
| CMBs | No | No | β = 0.155 | No | ||||
| BG‐EPVS | No | No | No | No | ||||
| Huang et al. 111 | Cross‐sectional | 126 | 3.0 T | CMBs | OR = 1.09 | |||
| Wang et al. 117 | Cross‐sectional | 100 | 1.5 T | BG‐EPVS | No | |||
| Hassan et al. 70 | Cross‐sectional | 110 | ‐ | Lacunes | No | |||
| WMHs | No | |||||||
| Markus et al. 113 | Longitudinal (6‐year) | 267 | 1.5 T | WMHs | OR = 1.0 | |||
| Kawamura et al. 114 | Longitudinal (3‐year) | 120 | 1.5 T | Lacunes | No | OR = 8.6 | No | |
| PVH | ‐ | OR = 2.2 | ‐ | ‐ | ||||
| DWMH | OR = 1.8 (3‐year) | |||||||
| Umemura et al. 95 | Longitudinal (6‐year) | 190 | 1.5 T | Lacunes | OR = 1.67 | |||
| PVH | OR = 2.17 | |||||||
| DWMH | OR = 1.83 (3‐year) | |||||||
| Staszewski et al. 2 | Longitudinal (2‐year) | 123 | 1.5 T | Lacunes | No | No | ||
| WMHs | No | No | ||||||
| Noz et al. 107 | Longitudinal (2‐year) | 51 | 1.5 T | WMHs | No | No |
Abbreviations: BG‐EPVS, basal ganglia‐enlarged perivascular spaces; CMB, cerebral microbleed; DWMH, deep WMH; ICAM‐1, intercellular adhesion molecule 1; OR, odds ratio; PVH, periventricular hyperintensity; SCI, silent cerebral infarct; VCAM‐1, vascular cell adhesion molecule 1; WMH, white matter hyperintensity; β/r, correlation coefficient.
Adhesion molecules and CSVD severity
de Leeuw et al. found that the levels of sP‐selectin and sVCAM‐1 were significantly higher in patients with severe PVH than those with mild. No such association was detected for subcortical DWMH. 69 However, Han and colleagues demonstrated that sICAM‐1 levels were positively associated with the grade of both subcortical DWMH and PVH in 175 elderly individuals without neurological deficits. Furthermore, multivariate analyses showed that higher sICAM‐1 levels were an independent risk factor for the presence and severity of WMH. After adjusting for other vascular risk factors, an over fourfold increased risk in WMH was found in patients with the highest quartile of sICAM‐1 compared to those with the lowest quartile. 110 Rouhl et al. and Huang et al. found a positive and significant correlation between sE‐selectin levels and the number of CMBs, irrespective of their location. 19 , 111 Rouhl et al. found this association in 163 first‐ever LS patients and 183 essential hypertensive patients, and notably, the data from LS patients were collected approximately 3 months after their stroke to prevent confounding by acute‐phase responses. 19 Whereas Huang et al. found this association in 126 patients with first‐ever IS, and sE‐selectin levels were measured about 2 weeks after symptom onset. 111
Adhesion molecules and CSVD progression
In a small‐size prospective study, 35 CSVD participants with a mean age of 70 years underwent monthly MRI for 10 consecutive months to detect CSVD progression, defined as any incident lesion (diffusion‐weighted imaging‐positive [DWI+] lesion, microbleed, or lacune) and the first quartile of WMH progression. Totally, 13 out of 35 participants had CSVD progression with either incident lesions (n = 7) and/or the upper quartile of WMH progression (n = 9). E‐selectin levels were higher in participants with CSVD progression than those without (19.4 [16.8–24.3] vs. 13.9 [10.7–17.5] pg/ml; p < 0.05). 112 The community‐based Austrian Stroke Prevention Study found that ICAM‐1 was associated with age‐ and gender‐adjusted WMH lesion progression at both 3 and 6 years (3‐year OR, 1.007; 95% CI, 1.002–1.012; p = 0.004; and 6‐year OR, 1.004; 95% CI, 1.000–1.009 per ng/ml; p = 0.057). After adjusting for other cardiovascular risk factors and CRP, these associations persisted significantly with 3‐year OR 1.010 (95% CI, 1.004–1.017; p = 0.001) and 6‐year OR 1.008 (1.002–1.014 per ng/ml; p = 0.006). 113 A 3‐year longitudinal observational study revealed that higher levels of sICAM‐1 were an independent risk factor for SCI progression in patients with type 2 diabetes mellitus (T2DM). The relative risk for SCI progression over 3 years was around eight times in the highest quartile of sICAM‐1 levels at baseline as compared with the lowest quartile after adjusting for covariables (OR 8.61, 95% CI 2.04–36.3; p < 0.005). 114 A 6‐year longitudinal study included a total of 190 patients with T2DM (mean age 62.7 years; mean duration of diabetes 13.1 years) who were free of dementia and assessed the association between baseline sICAM‐1 levels and progression of SBIs and periventricular and subcortical WMHs on MRI at 3 and 6 years. Logistic regression analysis showed that the ORs (95% CI) associated with a 1SD increase in baseline sICAM‐1 levels were 1.99 (1.29–2.80) for SBI progression, 2.36 (1.30–4.30) for periventricular WMH progression, 1.83 (1.19–2.81) for subcortical WMH progression at the 3‐year follow‐up, and 1.67 (1.02–3.05) for SBI progression and 2.17 (1.29–3.62) for periventricular WMH progression at the 6‐year follow‐up. These associations remain significant after controlling for age, sex, hypertension, and duration of diabetes, baseline MRI findings, and medication use. 95
3.3.9. Hemostasis factors and CSVD
The associations of hemostasis factors with MRI features of CSVD have been studied, but the results are inconsistent (Table 3). Among 160 asymptomatic, high‐risk Japanese subjects who were at least 60 years of age, 84 (53%) had > or = 1 lacunar infarcts (silent lacunar group) and the remaining 76 had no lacunar infarct (nonlacunar group). The levels of fibrinogen and F 1 + 2 were significantly higher in the former than those in the latter (p < 0.01). When further classifying the silent lacunar group into three subgroups according to the number of lacunes (few lacunes, 1 or 2; moderate number of lacunes, 3 or 4; and numerous lacunes, > or = 5), levels of F 1 + 2, vWF, and TM in the numerous lacunes were significantly higher than those in the few‐lacunes subgroup. 115 Similarly, in a study including 123 asymptomatic elderly hypertensive subjects, multiple lacunar infarcts were significantly independently associated with vWF, PAI‐1 and F1 + 2, and basal ganglia infarcts were associated with PAI‐1 and D‐dimer. 73 In a nested sample from a subset of the Atherosclerosis Risk in Communities (ARIC) cohort, Gottesman found that vWF and D‐dimer were positively associated with silent lacunar infarcts. 116 However, in a study involving 100 patients with lacunar or minor cortical IS, vWF was found to be negatively associated with BG PVS count (p = 0.032). The authors suggested that vWF may promote cerebral endothelial integrity, while lack of vWF may indicate cerebral endothelial dysfunction, increased BBB permeability, and increased BG PVS. 117 Hassan et al. found elevated levels of ICAM‐1, TM, and TFPI in white Caucasian patients with CSVD. The ischemic LA group had a lower TFPI level (p = 0.01) and a higher TF/TFPI ratio (p = 0.01) compared with the isolated lacunar infarction group. Besides, TM level was observed to be positively correlated with both the number of lacunes (p = 0.008) and the extent of LA (p = 0.03), whereas TF level and the TF/TFPI ratio were associated only with the extent of LA (p = 0.02 and 0.01). 70
TABLE 3.
Associations of hemostasis factors with MRI features of CSVD
| Source | Study design | No. | Filed strength | MRI features | D‐Dimer | vWF | TM | F 1 + 2 | TF | TFPI | TAT | t‐PA | PAI‐1 |
|---|---|---|---|---|---|---|---|---|---|---|---|---|---|
| Wada et al. 97 | Cross‐sectional | 667 | ‐ | Lacunes | No | No | |||||||
| WMHs | No | No | |||||||||||
| Liu et al. 102 | Cross‐sectional | 85 | 3.0 T | CMBs | No | ||||||||
| Kario et al. 115 | Cross‐sectional | 160 | 1.5 T | Lacunes | No | No | Yes | ||||||
| Kario et al. 73 | Cross‐sectional | 123 | 1.5 T | Lacunes | No | OR = 5.7 | OR = 5.6 | No | OR = 13.0 | ||||
| Gottesman et al. 116 | Cross‐sectional | 410 | 1.5 T | Lacunes | OR = 1.76 | OR = 2.04 | No | No | No | ||||
| Wang et al. 117 | Cross‐sectional | 100 | 1.5 T | BG‐EPVS | No | r = −0.25 | No | No | No | ||||
| Hassan et al. 70 | Cross‐sectional | 110 | ‐ | Lacunes | Yes | No | No | ||||||
| WMHs | Yes | Yes | No | ||||||||||
| Markus et al. 113 | Longitudinal. (6‐year) | 267 | 1.5 T | WMHs | No | No | No | No | |||||
| Staszewski et al. 103 | Longitudinal. (2‐year) | 123 | 1.5 T | Lacunes | No | No | No | ||||||
| WMHs | No | No | No |
Abbreviations: BG‐EPVS, basal ganglia‐enlarged perivascular spaces; CMB, cerebral microbleed; F1 + 2, prothrombin fragment 1 + 2; OR, odds ratio; PAI‐1, plasminogen activator inhibitor‐1; r, correlation coefficient; TAT, thrombin‐antithrombin complex; TF, tissue factor; TFPI, tissue factor pathway inhibitor; TM, thrombomodulin; t‐PA, type plasminogen activator; vWF, von Willebrand factor; WMH, white matter hyperintensity.
3.3.10. Homocysteine and CSVD
Homocysteine and CSVD prevalence
Results of studies on the relationship between Hcy and MRI features of CSVD are inconsistent (Table 4). In the Cardiovascular Health Study, plasma tHcy levels were not associated with individual MRI findings of white matter grade, or infarcts in 622 elderly subjects without a history of TIA or stroke. However, a linear trend was found between quintiles of tHcy level and an MRI pattern combining infarcts and high white matter grade. The linear trend remained significant after adjustment for other risk factors and atherosclerotic markers but was slightly diminished after further adjustment for creatinine, folate, and vitamins B6 and B12. 118 Matsui and colleagues showed that the elevated tHcy levels were significantly correlated with SBI after individual adjustment for age, sex, hypertension, renal function, and the habits of smoking and alcohol consumption in community‐dwelling elderly people. 119 , 120
TABLE 4.
Association of plasma Hcy levels with MRI features of CSVD
| Source | Study design | No. of Subjects | Field strength (Tesla) | MRI features | Hcy |
|---|---|---|---|---|---|
| Shoamanesh et al. 62 | Cross‐sectional | 1763 | 1.0 T | CMBs | No |
| SCIs/WMHs | No | ||||
| Longstreth et al. 118 | Cross‐sectional | 622 | – | Lacunes | No |
| WMHs | No | ||||
| Matsui et al. 119 | Cross‐sectional | 153 | 1.0 T | SCIs | OR = 4.5 |
| Vermeer et al. 121 | Cross‐sectional | 1077 | 1.5 T | Lacunes | OR = 2.5 |
| WMHs | OR = 2.3 | ||||
| Hassan et al. 17 | Cross‐sectional | 172 | – | Lacunes | OR = 12.9 |
| WMHs | OR = 4.2 | ||||
| Naka et al. 122 | Cross‐sectional | 102 | 1.0 T | WMHs | OR = 1.3 |
| CMBs | No | ||||
| Pavlovic et al. 124 | Cross‐sectional | 95 | 1.0 T | WMHs | OR = 1.2 |
| Feng2013 125 | Cross‐sectional | 324 | 1.5 T | Lacunes | r = 0.339 |
| WMHs | r = 0.379 | ||||
| Gao et al. 126 | Cross‐sectional | 923 | – | WMHs | OR = 1.9 |
| Miwa et al. 127 | Cross‐sectional | 643 | – | Lacunes | OR = 1.8 |
| WMHs | No | ||||
| CMBs | OR = 2.0 | ||||
| Atrophy | No | ||||
| Wright et al. 128 | Cross‐sectional | 259 | 1.5 T | WMHs | OR = 4.2 |
| Wong et al. 74 | Cross‐sectional | 57 | 1.5 T | Lacunes | No |
| WMHs | R2 = 0.06 | ||||
| Atrophy | No | ||||
| Seshadri et al. 129 | Retrospective | 1965 | – | Lacunes | RR = 1.5 |
| WMHs | No | ||||
| Atrophy | Yes | ||||
| Raz et al. 130 | Cross‐sectional | 144 | 4 T | WMHs | No |
| Narayan et al. 131 | Longitudinal (2‐year) | 70 | 1.5 T | WMHs | No |
| Atrophy | β = 0.46 | ||||
| Kloppenborg et al. 132 | Longitudinal (4‐year) | 663 | 1.5 T | Lacunes | No |
| WMHs | OR = 2.4 | ||||
| Staszewski et al. 2 | Longitudinal (2‐year) | 123 | 1.5 T | Lacunes | OR = 1.9 |
| WMHs | No |
Abbreviations: CMB, cerebral microbleed; Hcy, homocysteine; OR, odds ratio; SCI, silent cerebral infarct; WMH, white matter hyperintensity; β/r, correlation coefficient.
Homocysteine and CSVD severity
Several studies have clearly demonstrated the positive association between tHcy levels and the severity of MRI lesions in patients with CSVD. Vermeer et al. showed that tHcy levels are associated with SBIs and WMHs independent of each other and of other cardiovascular risk factors. Subjects were 24% more likely to have SBIs per SD increase in tHcy (95% CI 6%–45%). The severity of periventricular WMHs and the extent of subcortical WMHs also significantly correlated with tHcy levels, even after the exclusion of those with SBI. Further, the overall risk of having either an SBI or severe WMH increased by 35% for each SD increase in tHcy (95% CI 16%–58%). 121 Hassan et al. found that Hcy is an independent risk factor for CSVD, especially for ischemic LA subtype, and that the risk of CSVD increased with increasing quartile of Hcy. After adjusting conventional risk factors and creatinine, the OR for CSVD associated with Hcy was 8.34 (95% CI 3.63 ± 19.14) per 1 μmol increase in log concentration (p < 0.0005). The OR was only slightly reduced (to 7.91, 95% CI 3.93 ± 18.44; p < 0.0005) after additional adjustment for MTHFR genotype. They also confirmed that Hcy levels correlated with ICAM‐1 and TM, and the addition of these markers as covariates reduced the association between Hcy levels and SVD but improved the predictive model for the presence of SVD, suggesting that the effect of Hcy on SVD may be mediated by endothelial dysfunction. 17 Naka and colleagues revealed that increased tHcy levels are significantly and independently associated with advanced LA (early confluent or confluent LA; OR, 1.330; 95% CI, 1.130–1.565) but not with the presence of microbleeds in patients with stroke, indicating that elevated tHcy levels appear to be associated with ischemic SVD rather than with bleeding‐prone SVD. 122 Ma et al. showed that tHcy level was positively associated with the LA severity in SVD (r = 0.308, p = 0.001). After adjustment for age, gender, vascular risk factors, and eGFR, mean tHcy level was significantly higher in patients with moderate (p < 0.001) and severe (p < 0.001) LA compared with patients without it. 123 Pavlovic and colleagues showed that the elevated tHcy level was positively and independently correlated with the severity of WMH in Serbian patients with SVD. 124 Feng and colleagues showed that, in 324 nonstroke patients, Hcy level was positively correlated with scores of LA (r = 0.379, p < 0.001) and numbers of SBI (r = 0.339, p < 0.001). Additionally, the authors demonstrated that Hcy level was an independent risk factor for SVD (OR = 1.315, p < 0.001). 125 Gao et al. showed that in patients with acute ischemic stroke (mean age, 58.9 ± 11.9 years; female, 31.6%), elevated plasma tHcy level was significantly and independently related to WMHs severity. For the highest tHcy quartile, the OR (95% CI) was 1.891 (1.257; 2.843) according to the Fazekas scale and 1.781 (1.185; 2.767) according to the age‐related white matter changes (ARWMC) visual grading scale when compared to the lowest quartile. However, subgroup analysis further showed that only WMHs distributed within the periventricular area and left or right frontal areas were independently associated with tHcy level. 126 Miwa and colleagues observed the cross‐sectional association between the highest tHcy tertile and lacunes, CMBs, as well as strictly deep CMBs within a Japanese cohort of participants with vascular risk factors, after the adjustment for several potential confounders. Although higher tHcy levels were associated with PVH and DWMH when adjusted for age and gender only, the correlation disappeared after further adjustment for age, gender, BMI, MMSE, smoking, hypertension, previous cerebrovascular events, eGFR, and IMT. 127 In a stroke‐free community‐based population of Hispanic, black, and white participants, Wright et al. found that tHcy levels were associated with pixel‐based quantitative measures of WMHV. Log‐tHcy level and the highest tHcy category compared with the lowest both correlated with log‐WMHV and WMHV‐large (WMHV >1 SD). The association remained significant after adjusting for age, sex, race‐ethnicity, hypertension, cardiac disease, and B12 deficiency. 128 In a small‐size (n = 57), prospective, cohort‐based study, HHcy, defined as the highest (4th) quartile of Hcy level, significantly accounted for the WMHV in a multivariate stepwise liner regression model after adjusting for age and folate level. However, no significant association was seen between Hcy levels and SBI, brain atrophy as well as cognitive functions. 74 In a community‐based sample of middle‐aged adults who were free of clinical stroke, dementia, or other neurologic disease affecting brain MRI and had at least 1 measurement of plasma tHcy level between 1991 and 2001 as well as a brain MRI between 1999 and 2002, subjects with a plasma tHcy level in the highest age‐ or sex‐specific quartile had smaller total cerebral brain volumes (TCBV), the ratio of total brain parenchymal volume to total cranial volume, compared to those with lower tHcy levels. More importantly, initial (1991–1995) plasma tHcy levels were associated with a higher prevalence of SBI (RR, 1.5; 95% CI, 1.1–2.1; p = 0.02), and concurrent (1998–2001) plasma tHcy levels were associated with smaller frontal (−0.14%, p = 0.001) and temporal lobar (−0.10%, p = 0.04) volumes. However, there was no significant association between the prevalence of extensive WMH and initial or concurrent plasma tHcy levels. 129 Raz and colleagues suggested that, in healthy adults who are free of neurological and vascular disease, tHcy had no effect on WMHV, but the interaction between tHCy and age was related to WMHV. The strength and shape of this association varied across the cerebral lobes. In the frontal, parietal, and temporal lobes, WMHV was the largest in the elderly with high tHcy levels, while in the occipital lobes, the greatest WMHV was seen in the middle‐aged with high tHcy. 130
Homocysteine and CSVD progression
Narayan et al. have demonstrated that plasma tHcy levels significantly correlated with increased rates of whole‐brain atrophy but not WMH progression by using serial MRI in a community‐dwelling population with hypertension with an average age of 79.1 years. The association between tHcy levels and brain atrophy rates persisted even after adjusting potential confounders such as folate and B12, which are known to alter tHcy levels and others that could influence brain atrophy, such as age, BP, and serum creatinine. However, there was no correlation of total, periventricular or deep WMH load, or their rate of progression with tHcy levels on simple correlation studies as well as on multivariate analysis. In addition, new SBIs were uncommon with only one subject developing a new small cortical infarct during the 2‐year inter‐MRI study interval. However, the results of the study may be not convincing enough because of the small size with only 70 subjects. 131 In a large prospective longitudinal cohort study of 663 independently living patients with symptomatic atherosclerotic disease with a mean follow‐up of 3.9 years, Kloppenborg et al. found that, after controlling for age, sex, and follow‐up time, HHcy (highest quintile of Hcy vs. lower 4 quintiles) was significantly associated with increased risk of WMH progression (OR 2.4, 95% CI 1.4–3.9, p = 0.001) and of new lacunar infarcts (OR 1.9, 95% CI 1.1–3.6, p = 0.031). After accounting for vascular risk factors and IMT, the association between HHcy and WMH progression remained significant (OR 2.4, 95% CI 1.5–4.1), while the association between HHcy and new lacunar infarcts disappeared (OR 1.8, 95% CI 0.9–3.4). 132
3.3.11. Composite factors
Some studies tried to use composite factors to reflect the inflammation process in the development and progression of CSVD and obtained encouraging outcomes. A population‐based study of 268 elderly individuals showed that single pro‐ (IL‐1β, IL‐6, IL‐8, IL‐12, and TNF‐α) and anti‐inflammatory (sIL‐4R anf IL‐10) cytokines were not associated with subcortical WMH, atrophy, or lacunar infarctions, after the Bonferroni correction for multiple comparisons. However, there was a significant association between atrophy and the chemokine‐cytokine factor (a composite measure of sIL‐4R, IL‐6, and IL‐8), even after controlling for confounders. 133 Similarly, a single‐center prospective cohort study indicated that the Z‐score for vascular inflammation (containing sICAM‐1, sP‐selectin, sCD40 L, platelet factor‐4 [PF‐4], and Hcy) was significantly related to WMHs progression or new lacunes; while, Z‐score for systemic inflammation (containing hs‐CRP, IL‐1α, IL‐6, and TNF‐α) was correlated with the development of new lacunes. These associations persist significantly after additional adjustment for clinical CSVD manifestations. 2 Recently, Altendahl et al. identified a cross‐sectional relationship between an IL‐18‐centered systemic inflammatory network and antecedent and overt white matter injury in two distinct populations from the MarkVCID study and ASPIRE study cohorts, respectively. The authors demonstrated that the inflammation composite score (ICS), a composite measure of inflammatory markers (myeloperoxidase [MPO], growth differentiation factor 15 [GDF‐15], receptor for advanced glycation end products [RAGE], ST2, interleukin‐18 [IL‐18], and monocyte chemoattractant protein‐1 [MCP‐1]), was significantly associated with log WMH (β = 0.222, p = 0.013) as well as DTI FW (β = 0.3, p = 0.01). 134 Homoplastically, Kuipers and colleagues assessed the relation between 92 blood‐based biomarkers from the OLINK cardiovascular III panel and CSVD and identified a cluster of biomarkers reflecting coagulation, which is related to the manifestations of CSVD, including WMHs, lacunar infarcts, CMBs, and EPVS. In addition, the authors found a mediation effect of the biomarker cluster on the relation between age and WMH ratio (proportion mediated 17%), and hypertension and WMH volume (proportion mediated 21%). Therefore, the authors suggested the involvement of coagulation abnormalities in the etiology of CSVD. 135 In conclusion, these studies suggest that the composite measures of multiple functional‐interrelated biomarkers may be more relevant to CSVD than individual biomarkers.
4. CONCLUSIONS
In conclusion, although there are conflicting results from different studies, the existing studies of interest suggest that inflammation may play an important role in the development and progression of CSVD. Compared with individual plasma biomarkers, clusters of interrelated biomarkers associated with CSVD may better explain the underlying pathological processes.
4.1. Limitations and future directions
This article has some limitations: First, the detailed mechanisms of inflammation on CSVD are not well described in this article. Second, not all the research on the relationship between inflammatory biomarkers and MRI features of CSVD is included. Last but not least, studies evaluating the inflammatory biomarkers with clinical endpoints of CSVD, such as stroke and cognitive decline, are not included. With the development of advanced MRI technology, the pathological mechanisms underlying CSVD may be further revealed and early diagnosis, and even reversal, of CSVD may be possible in the future. Besides, clusters of interrelated biomarkers may be more relevant to CSVD than individual biomarkers; thus, further studies focusing on biomarker clusters may be helpful.
AUTHOR CONTRIBUTIONS
SW drafted this manuscript. GH and YG searched, read, and organized literature. CD, YD, HS, and RM revised the manuscript and edited English. RM contributed to the conception and design of this study and proposed the amendments.
FUNDING INFORMATION
This work was supported by the National Natural Science Foundation of China (Grant/Award Number: 81371289 and 82101390) and the Natural Science Foundation of Beijing Municipality (Grant/Award Number: 7212047).
CONFLICT OF INTEREST
The authors declare that this work has no conflict of interest.
Wan S, Dandu C, Han G, et al. Plasma inflammatory biomarkers in cerebral small vessel disease: A review. CNS Neurosci Ther. 2023;29:498‐515. doi: 10.1111/cns.14047
DATA AVAILABILITY STATEMENT
Data sharing is not applicable to this article as no new data were created or analyzed in this study.
REFERENCES
- 1. Pantoni L. Cerebral small vessel disease: from pathogenesis and clinical characteristics to therapeutic challenges. Lancet Neurol. 2010;9:689‐701. [DOI] [PubMed] [Google Scholar]
- 2. Staszewski J, Piusińska‐Macoch R, Brodacki B, Skrobowska E, Stępień A. IL‐6, PF‐4, sCD40 L, and homocysteine are associated with the radiological progression of cerebral small‐vessel disease: a 2‐year follow‐up study. Clin Interv Aging. 2018;13:1135‐1141. [DOI] [PMC free article] [PubMed] [Google Scholar]
- 3. Benavente OR, Coffey CS, Conwit R, et al. Blood‐pressure targets in patients with recent lacunar stroke: the SPS3 randomised trial. Lancet. 2013;382:507‐515. [DOI] [PMC free article] [PubMed] [Google Scholar]
- 4. Staszewski J, Skrobowska E, Piusińska‐Macoch R, Brodacki B, Stępień A. IL‐1α and IL‐6 predict vascular events or death in patients with cerebral small vessel disease‐data from the SHEF‐CSVD study. Adv Med Sci. 2019;64:258‐266. [DOI] [PubMed] [Google Scholar]
- 5. Conijn MM, Kloppenborg RP, Algra A, et al. Cerebral small vessel disease and risk of death, ischemic stroke, and cardiac complications in patients with atherosclerotic disease: the second manifestations of ARTerial disease‐magnetic resonance (SMART‐MR) study. Stroke. 2011;42:3105‐3109. [DOI] [PubMed] [Google Scholar]
- 6. de Groot JC, de Leeuw FE, Oudkerk M, et al. Cerebral white matter lesions and cognitive function: the Rotterdam scan study. Ann Neurol. 2000;47:145‐151. [DOI] [PubMed] [Google Scholar]
- 7. Staals J, Booth T, Morris Z, et al. Total MRI load of cerebral small vessel disease and cognitive ability in older people. Neurobiol Aging. 2015;36:2806‐2811. [DOI] [PMC free article] [PubMed] [Google Scholar]
- 8. Huijts M, Duits A, van Oostenbrugge RJ, Kroon AA, de Leeuw PW, Staals J. Accumulation of MRI markers of cerebral small vessel disease is associated with decreased cognitive function. A study in first‐ever lacunar stroke and hypertensive patients. Front Aging Neurosci. 2013;5:72. [DOI] [PMC free article] [PubMed] [Google Scholar]
- 9. Uiterwijk R, van Oostenbrugge RJ, Huijts M, De Leeuw PW, Kroon AA, Staals J. Total cerebral small vessel disease MRI score is associated with cognitive decline in executive function in patients with hypertension. Front Aging Neurosci. 2016;8:301. [DOI] [PMC free article] [PubMed] [Google Scholar]
- 10. Maclullich AM, Wardlaw JM, Ferguson KJ, Starr JM, Seckl JR, Deary IJ. Enlarged perivascular spaces are associated with cognitive function in healthy elderly men. J Neurol Neurosurg Psychiatry. 2004;75:1519‐1523. [DOI] [PMC free article] [PubMed] [Google Scholar]
- 11. Silbert LC, Nelson C, Howieson DB, Moore MM, Kaye JA. Impact of white matter hyperintensity volume progression on rate of cognitive and motor decline. Neurology. 2008;71:108‐113. [DOI] [PMC free article] [PubMed] [Google Scholar]
- 12. Vermeer SE, Prins ND, den Heijer T, Hofman A, Koudstaal PJ, Breteler MM. Silent brain infarcts and the risk of dementia and cognitive decline. N Engl J Med. 2003;348:1215‐1222. [DOI] [PubMed] [Google Scholar]
- 13. Prins ND, van Dijk EJ, den Heijer T, et al. Cerebral small‐vessel disease and decline in information processing speed, executive function and memory. Brain. 2005;128:2034‐2041. [DOI] [PubMed] [Google Scholar]
- 14. De Groot JC, De Leeuw FE, Oudkerk M, et al. Periventricular cerebral white matter lesions predict rate of cognitive decline. Ann Neurol. 2002;52:335‐341. [DOI] [PubMed] [Google Scholar]
- 15. van Dijk EJ, Prins ND, Vrooman HA, Hofman A, Koudstaal PJ, Breteler MM. Progression of cerebral small vessel disease in relation to risk factors and cognitive consequences: Rotterdam scan study. Stroke. 2008;39:2712‐2719. [DOI] [PubMed] [Google Scholar]
- 16. Schmidt R, Petrovic K, Ropele S, Enzinger C, Fazekas F. Progression of leukoaraiosis and cognition. Stroke. 2007;38:2619‐2625. [DOI] [PubMed] [Google Scholar]
- 17. Hassan A, Hunt BJ, O'Sullivan M, et al. Homocysteine is a risk factor for cerebral small vessel disease, acting via endothelial dysfunction. Brain. 2004;127:212‐219. [DOI] [PubMed] [Google Scholar]
- 18. Yao H, Mizoguchi Y, Monji A, et al. Low‐grade inflammation is associated with apathy indirectly via deep White matter lesions in community‐dwelling older adults: the Sefuri study. Int J Mol Sci. 2019;20:1905. [DOI] [PMC free article] [PubMed] [Google Scholar]
- 19. Rouhl RP, Damoiseaux JG, Lodder J, et al. Vascular inflammation in cerebral small vessel disease. Neurobiol Aging. 2012;33:1800‐1806. [DOI] [PubMed] [Google Scholar]
- 20. Jian B, Hu M, Cai W, Zhang B, Lu Z. Update of Immunosenescence in cerebral small vessel disease. Front Immunol. 2020;11:585655. [DOI] [PMC free article] [PubMed] [Google Scholar]
- 21. Wardlaw JM, Smith EE, Biessels GJ, et al. Neuroimaging standards for research into small vessel disease and its contribution to ageing and neurodegeneration. Lancet Neurol. 2013;12:822‐838. [DOI] [PMC free article] [PubMed] [Google Scholar]
- 22. Hilal S, Mok V, Youn YC, Wong A, Ikram MK, Chen CL. Prevalence, risk factors and consequences of cerebral small vessel diseases: data from three Asian countries. J Neurol Neurosurg Psychiatry. 2017;88:669‐674. [DOI] [PubMed] [Google Scholar]
- 23. Poels MM, Vernooij MW, Ikram MA, et al. Prevalence and risk factors of cerebral microbleeds: an update of the Rotterdam scan study. Stroke. 2010;41:S103‐S106. [DOI] [PubMed] [Google Scholar]
- 24. Leeuw F‐E, Groot JC, Achten E, et al. Prevalence of cerebral white matter lesions in elderly people: a population based magnetic resonance imaging study. The Rotterdam scan study. J Neurol Neurosurg Psychiatry. 2001;70:9‐14. [DOI] [PMC free article] [PubMed] [Google Scholar]
- 25. Bugiani M, Kevelam SH, Bakels HS, et al. Cathepsin A‐related arteriopathy with strokes and leukoencephalopathy (CARASAL). Neurology. 2016;87:1777‐1786. [DOI] [PubMed] [Google Scholar]
- 26. Giau VV, Bagyinszky E, Youn YC, An SSA, Kim SY. Genetic factors of cerebral small vessel disease and their potential clinical outcome. Int J Mol Sci. 2019;20:4298 [DOI] [PMC free article] [PubMed] [Google Scholar]
- 27. Wang Z, Chen Q, Chen J, Yang N, Zheng K. Risk factors of cerebral small vessel disease: a systematic review and meta‐analysis. Medicine. 2021;100:e28229. [DOI] [PMC free article] [PubMed] [Google Scholar]
- 28. Kim H, Yun CH, Thomas RJ, et al. Obstructive sleep apnea as a risk factor for cerebral white matter change in a middle‐aged and older general population. Sleep. 2013;36:709‐715. [DOI] [PMC free article] [PubMed] [Google Scholar]
- 29. Backhouse EV, McHutchison CA, Cvoro V, Shenkin SD, Wardlaw JM. Early life risk factors for cerebrovascular disease: a systematic review and meta‐analysis. Neurology. 2017;88:976‐984. [DOI] [PubMed] [Google Scholar]
- 30. Ueno M, Tomimoto H, Akiguchi I, Wakita H, Sakamoto H. Blood‐brain barrier disruption in white matter lesions in a rat model of chronic cerebral hypoperfusion. J Cereb Blood Flow Metab. 2002;22:97‐104. [DOI] [PubMed] [Google Scholar]
- 31. Huang Y, Zhang W, Lin L, et al. Is endothelial dysfunction of cerebral small vessel responsible for white matter lesions after chronic cerebral hypoperfusion in rats? J Neurol Sci. 2010;299:72‐80. [DOI] [PubMed] [Google Scholar]
- 32. Jalal FY, Yang Y, Thompson JF, Roitbak T, Rosenberg GA. Hypoxia‐induced neuroinflammatory white‐matter injury reduced by minocycline in SHR/SP. J Cereb Blood Flow Metab. 2015;35:1145‐1153. [DOI] [PMC free article] [PubMed] [Google Scholar]
- 33. Tomimoto H, Akiguchi I, Suenaga T, et al. Alterations of the blood‐brain barrier and glial cells in white‐matter lesions in cerebrovascular and Alzheimer's disease patients. Stroke. 1996;27:2069‐2074. [DOI] [PubMed] [Google Scholar]
- 34. Young VG, Halliday GM, Kril JJ. Neuropathologic correlates of white matter hyperintensities. Neurology. 2008;71:804‐811. [DOI] [PubMed] [Google Scholar]
- 35. Forsberg KME, Zhang Y, Reiners J, et al. Endothelial damage, vascular bagging and remodeling of the microvascular bed in human microangiopathy with deep white matter lesions. Acta Neuropathol Commun. 2018;6:128. [DOI] [PMC free article] [PubMed] [Google Scholar]
- 36. Wardlaw JM, Doubal F, Armitage P, et al. Lacunar stroke is associated with diffuse blood‐brain barrier dysfunction. Ann Neurol. 2009;65:194‐202. [DOI] [PubMed] [Google Scholar]
- 37. Topakian R, Barrick TR, Howe FA, Markus HS. Blood‐brain barrier permeability is increased in normal‐appearing white matter in patients with lacunar stroke and leucoaraiosis. J Neurol Neurosurg Psychiatry. 2010;81:192‐197. [DOI] [PubMed] [Google Scholar]
- 38. Walsh J, Tozer DJ, Sari H, et al. Microglial activation and blood‐brain barrier permeability in cerebral small vessel disease. Brain. 2021;144:1361‐1371. [DOI] [PMC free article] [PubMed] [Google Scholar]
- 39. Taheri S, Gasparovic C, Huisa BN, et al. Blood‐brain barrier permeability abnormalities in vascular cognitive impairment. Stroke. 2011;42:2158‐2163. [DOI] [PMC free article] [PubMed] [Google Scholar]
- 40. Haruwaka K, Ikegami A, Tachibana Y, et al. Dual microglia effects on blood brain barrier permeability induced by systemic inflammation. Nat Commun. 2019;10:5816. [DOI] [PMC free article] [PubMed] [Google Scholar]
- 41. Rensma SP, van Sloten TT, Launer LJ, Stehouwer CDA. Cerebral small vessel disease and risk of incident stroke, dementia and depression, and all‐cause mortality: a systematic review and meta‐analysis. Neurosci Biobehav Rev. 2018;90:164‐173. [DOI] [PMC free article] [PubMed] [Google Scholar]
- 42. Park KI, Jung KH, Lee EJ, et al. Classification of white matter lesions and characteristics of small vessel disease markers. Eur Radiol. 2022. Online ahead of print. doi: 10.1007/s00330-022-09070-1 [DOI] [PubMed] [Google Scholar]
- 43. da Silva PHR, Paschoal AM, Secchinatto KF, et al. Contrast agent‐free state‐of‐the‐art magnetic resonance imaging on cerebral small vessel disease ‐ part 2: diffusion tensor imaging and functional magnetic resonance imaging. NMR Biomed. 2022;35:e4743. [DOI] [PubMed] [Google Scholar]
- 44. Brandhofe A, Stratmann C, Schure JR, et al. T2 relaxation time of the normal‐appearing white matter is related to the cognitive status in cerebral small vessel disease. J Cereb Blood Flow Metab. 2021;41:1767‐1777. [DOI] [PMC free article] [PubMed] [Google Scholar]
- 45. Zwartbol MH, van der Kolk AG, Kuijf HJ, et al. Intracranial vessel wall lesions on 7T MRI and MRI features of cerebral small vessel disease: the SMART‐MR study. J Cereb Blood Flow Metab. 2021;41:1219‐1228. [DOI] [PMC free article] [PubMed] [Google Scholar]
- 46. Cannistraro RJ, Badi M, Eidelman BH, Dickson DW, Middlebrooks EH, Meschia JF. CNS small vessel disease: a clinical review. Neurology. 2019;92:1146‐1156. [DOI] [PMC free article] [PubMed] [Google Scholar]
- 47. Pepys MB, Hirschfield GM. C‐reactive protein: a critical update. J Clin Invest. 2003;111:1805‐1812. [DOI] [PMC free article] [PubMed] [Google Scholar]
- 48. Sproston NR, Ashworth JJ. Role of C‐reactive protein at sites of inflammation and infection. Front Immunol. 2018;9:754. [DOI] [PMC free article] [PubMed] [Google Scholar]
- 49. Ling C, Cook MD, Grimm H, Aldokhayyil M, Gomez D, Brown M. The effect of race and shear stress on CRP‐induced responses in endothelial cells. Mediators Inflamm. 2021;2021:6687250. [DOI] [PMC free article] [PubMed] [Google Scholar]
- 50. Pasceri V, Willerson JT, Yeh ET. Direct Proinflammatory effect of C‐reactive protein on human endothelial cells. Circulation. 2000;102:2165‐2168. [DOI] [PubMed] [Google Scholar]
- 51. Kamath DY, Xavier D, Sigamani A, Pais P. High sensitivity C‐reactive protein (hsCRP) & cardiovascular disease: an Indian perspective. Indian J Med Res. 2015;142:261‐268. [DOI] [PMC free article] [PubMed] [Google Scholar]
- 52. Labarrere CA, Zaloga GP. C‐reactive protein: from innocent bystander to pivotal mediator of atherosclerosis. Am J Med. 2004;117:499‐507. [DOI] [PubMed] [Google Scholar]
- 53. Nishida E, Aino M, Kobayashi SI, et al. Serum amyloid a promotes E‐selectin expression via toll‐like receptor 2 in human aortic endothelial cells. Mediators Inflamm. 2016;2016:7150509. [DOI] [PMC free article] [PubMed] [Google Scholar]
- 54. Tyagi N, Roberts AM, Dean WL, Tyagi SC, Lominadze D. Fibrinogen induces endothelial cell permeability. Mol Cell Biochem. 2008;307:13‐22. [DOI] [PMC free article] [PubMed] [Google Scholar]
- 55. Eber B, Schumacher M. Fibrinogen: its role in the hemostatic regulation in atherosclerosis. Semin Thromb Hemost. 1993;19:104‐107. [DOI] [PubMed] [Google Scholar]
- 56. Muradashvili N, Tyagi N, Tyagi R, Munjal C, Lominadze D. Fibrinogen alters mouse brain endothelial cell layer integrity affecting vascular endothelial cadherin. Biochem Biophys Res Commun. 2011;413:509‐514. [DOI] [PMC free article] [PubMed] [Google Scholar]
- 57. Lominadze D, Dean WL, Tyagi SC, Roberts AM. Mechanisms of fibrinogen‐induced microvascular dysfunction during cardiovascular disease. Acta Physiol. 2010;198:1‐13. [DOI] [PMC free article] [PubMed] [Google Scholar]
- 58. Lominadze D, Tsakadze N, Sen U, Falcone JC, D'Souza SE. Fibrinogen and fragment D‐induced vascular constriction. Am J Physiol Heart Circ Physiol. 2005;288:H1257‐H1264. [DOI] [PubMed] [Google Scholar]
- 59. Patibandla PK, Tyagi N, Dean WL, Tyagi SC, Roberts AM, Lominadze D. Fibrinogen induces alterations of endothelial cell tight junction proteins. J Cell Physiol. 2009;221:195‐203. [DOI] [PMC free article] [PubMed] [Google Scholar]
- 60. Held C, White HD, Stewart RAH, et al. Inflammatory biomarkers Interleukin‐6 and C‐reactive protein and outcomes in stable coronary heart disease: experiences from the STABILITY (stabilization of atherosclerotic plaque by initiation of Darapladib therapy) trail. J Am Heart Assoc. 2017;6:e005077. [DOI] [PMC free article] [PubMed] [Google Scholar]
- 61. Tarkowski E, Tullberg M, Fredman P, Wikkelsö C. Correlation between intrathecal sulfatide and TNF‐alpha levels in patients with vascular dementia. Dement Geriatr Cogn Disord. 2003;15:207‐211. [DOI] [PubMed] [Google Scholar]
- 62. Shoamanesh A, Preis SR, Beiser AS, et al. Inflammatory biomarkers, cerebral microbleeds, and small vessel disease: framingham heart study. Neurology. 2015;84:825‐832. [DOI] [PMC free article] [PubMed] [Google Scholar]
- 63. Guldiken B, Guldiken S, Turgut B, et al. Serum osteoprotegerin levels in patients with acute atherothrombotic stroke and lacunar infarct. Thromb Res. 2007;120:511‐516. [DOI] [PubMed] [Google Scholar]
- 64. Arba F, Giannini A, Piccardi B, et al. Small vessel disease and biomarkers of endothelial dysfunction after ischaemic stroke. Eur Stroke J. 2019;4:119‐126. [DOI] [PMC free article] [PubMed] [Google Scholar]
- 65. Zhang JB, Li MF, Zhang HX, et al. Association of serum vascular endothelial growth factor levels and cerebral microbleeds in patients with Alzheimer's disease. Eur J Neurol. 2016;23:1337‐1342. [DOI] [PubMed] [Google Scholar]
- 66. Schoch HJ, Fischer S, Marti HH. Hypoxia‐induced vascular endothelial growth factor expression causes vascular leakage in the brain. Brain. 2002;125:2549‐2557. [DOI] [PubMed] [Google Scholar]
- 67. Perkins LA, Anderson CJ, Novelli EM. Targeting P‐selectin adhesion molecule in molecular imaging: P‐selectin expression as a valuable imaging biomarker of inflammation in cardiovascular disease. J Nucl Med. 2019;60:1691‐1697. [DOI] [PMC free article] [PubMed] [Google Scholar]
- 68. Fassbender K, Bertsch T, Mielke O, Mühlhauser F, Hennerici M. Adhesion molecules in cerebrovascular diseases. Evidence for an inflammatory endothelial activation in cerebral large‐ and small‐vessel disease. Stroke. 1999;30:1647‐1650. [DOI] [PubMed] [Google Scholar]
- 69. de Leeuw FE, de Kleine M, Frijns CJ, Fijnheer R, van Gijn J, Kappelle LJ. Endothelial cell activation is associated with cerebral white matter lesions in patients with cerebrovascular disease. Ann N Y Acad Sci. 2002;977:306‐314. [DOI] [PubMed] [Google Scholar]
- 70. Hassan A, Hunt BJ, O'Sullivan M, et al. Markers of endothelial dysfunction in lacunar infarction and ischaemic leukoaraiosis. Brain. 2003;126:424‐432. [DOI] [PubMed] [Google Scholar]
- 71. Chen J, Chung DW. Inflammation, von Willebrand factor, and ADAMTS13. Blood. 2018;132:141‐147. [DOI] [PMC free article] [PubMed] [Google Scholar]
- 72. Suidan GL, Brill A, De Meyer SF, et al. Endothelial Von Willebrand factor promotes blood‐brain barrier flexibility and provides protection from hypoxia and seizures in mice. Arterioscler Thromb Vasc Biol. 2013;33:2112‐2120. [DOI] [PMC free article] [PubMed] [Google Scholar]
- 73. Kario K, Matsuo T, Kobayashi H, Hoshide S, Shimada K. Hyperinsulinemia and hemostatic abnormalities are associated with silent lacunar cerebral infarcts in elderly hypertensive subjects. J Am Coll Cardiol. 2001;37:871‐877. [DOI] [PubMed] [Google Scholar]
- 74. Wong A, Mok V, Fan YH, Lam WW, Liang KS, Wong KS. Hyperhomocysteinemia is associated with volumetric white matter change in patients with small vessel disease. J Neurol. 2006;253:441‐447. [DOI] [PubMed] [Google Scholar]
- 75. Li S, Li G, Luo X, Huang Y, Wen L, Li J. Endothelial dysfunction and Hyperhomocysteinemia‐linked cerebral small vessel disease: underlying mechanisms and treatment timing. Front Neurol. 2021;12:736309. [DOI] [PMC free article] [PubMed] [Google Scholar]
- 76. Castro R, Rivera I, Blom HJ, Jakobs C, Tavares de Almeida I. Homocysteine metabolism, hyperhomocysteinaemia and vascular disease: an overview. J Inherit Metab Dis. 2006;29:3‐20. [DOI] [PubMed] [Google Scholar]
- 77. Lai WK, Kan MY. Homocysteine‐induced endothelial dysfunction. Ann Nutr Metab. 2015;67:1‐12. [DOI] [PubMed] [Google Scholar]
- 78. Esse R, Barroso M, Tavares de Almeida I, Castro R. The contribution of homocysteine metabolism disruption to endothelial dysfunction: state‐of‐the‐art. Int J Mol Sci. 2019;20:867. [DOI] [PMC free article] [PubMed] [Google Scholar]
- 79. Pang X, Liu J, Zhao J, et al. Homocysteine induces the expression of C‐reactive protein via NMDAr‐ROS‐MAPK‐NF‐κB signal pathway in rat vascular smooth muscle cells. Atherosclerosis. 2014;236:73‐81. [DOI] [PubMed] [Google Scholar]
- 80. Barroso M, Kao D, Blom HJ, et al. S‐adenosylhomocysteine induces inflammation through NFkB: a possible role for EZH2 in endothelial cell activation. Biochim Biophys Acta. 2016;1862:82‐92. [DOI] [PMC free article] [PubMed] [Google Scholar]
- 81. Barroso M, Florindo C, Kalwa H, et al. Inhibition of cellular methyltransferases promotes endothelial cell activation by suppressing glutathione peroxidase 1 protein expression. J Biol Chem. 2014;289:15350‐15362. [DOI] [PMC free article] [PubMed] [Google Scholar]
- 82. Barroso M, Rocha MS, Esse R, et al. Cellular hypomethylation is associated with impaired nitric oxide production by cultured human endothelial cells. Amino Acids. 2012;42:1903‐1911. [DOI] [PMC free article] [PubMed] [Google Scholar]
- 83. Jakubowski H. The molecular basis of homocysteine thiolactone‐mediated vascular disease. Clin Chem lab Med. 2007;45:1704‐1716. [DOI] [PubMed] [Google Scholar]
- 84. Hoshi T, Kitagawa K, Yamagami H, Furukado S, Hougaku H, Hori M. Relations of serum high‐sensitivity C‐reactive protein and interleukin‐6 levels with silent brain infarction. Stroke. 2005;36:768‐772. [DOI] [PubMed] [Google Scholar]
- 85. Ishikawa J, Tamura Y, Hoshide S, et al. Low‐grade inflammation is a risk factor for clinical stroke events in addition to silent cerebral infarcts in Japanese older hypertensives: the Jichi medical school ABPM study, wave 1. Stroke. 2007;38:911‐917. [DOI] [PubMed] [Google Scholar]
- 86. Koh SH, Park CY, Kim MK, et al. Microbleeds and free active MMP‐9 are independent risk factors for neurological deterioration in acute lacunar stroke. Eur J Neurol. 2011;18:158‐164. [DOI] [PubMed] [Google Scholar]
- 87. Fornage M, Chiang YA, O'Meara ES, et al. Biomarkers of inflammation and MRI‐defined small vessel disease of the brain: the cardiovascular health study. Stroke. 2008;39:1952‐1959. [DOI] [PMC free article] [PubMed] [Google Scholar]
- 88. Wada M, Nagasawa H, Kurita K, et al. Cerebral small vessel disease and C‐reactive protein: results of a cross‐sectional study in community‐based Japanese elderly. J Neurol Sci. 2008;264:43‐49. [DOI] [PubMed] [Google Scholar]
- 89. Wright CB, Moon Y, Paik MC, et al. Inflammatory biomarkers of vascular risk as correlates of leukoariosis. Stroke. 2009;40:3466‐3471. [DOI] [PMC free article] [PubMed] [Google Scholar]
- 90. Mitaki S, Nagai A, Oguro H, Yamaguchi S. C‐reactive protein levels are associated with cerebral small vessel‐related lesions. Acta Neurol Scand. 2016;133:68‐74. [DOI] [PubMed] [Google Scholar]
- 91. Walker KA, Windham BG, Power MC, et al. The association of mid‐to late‐life systemic inflammation with white matter structure in older adults: the atherosclerosis risk in communities study. Neurobiol Aging. 2018;68:26‐33. [DOI] [PMC free article] [PubMed] [Google Scholar]
- 92. Hilal S, Ikram MA, Verbeek MM, et al. C‐reactive protein, plasma amyloid‐β levels, and their interaction with magnetic resonance imaging markers. Stroke. 2018;49:2692‐2698. [DOI] [PubMed] [Google Scholar]
- 93. Schmidt R, Schmidt H, Pichler M, et al. C‐reactive protein, carotid atherosclerosis, and cerebral small‐vessel disease: results of the Austrian stroke prevention study. Stroke. 2006;37:2910‐2916. [DOI] [PubMed] [Google Scholar]
- 94. van Dijk EJ, Prins ND, Vermeer SE, et al. C‐reactive protein and cerebral small‐vessel disease: the Rotterdam scan study. Circulation. 2005;112:900‐905. [DOI] [PubMed] [Google Scholar]
- 95. Umemura T, Kawamura T, Umegaki H, et al. Endothelial and inflammatory markers in relation to progression of ischaemic cerebral small‐vessel disease and cognitive impairment: a 6‐year longitudinal study in patients with type 2 diabetes mellitus. J Neurol Neurosurg Psychiatry. 2011;82:1186‐1194. [DOI] [PubMed] [Google Scholar]
- 96. Elkind MS, Luna JM, Coffey CS, et al. The levels of inflammatory markers in the treatment of stroke study (LIMITS): inflammatory biomarkers as risk predictors after lacunar stroke. Int J Stroke. 2010;5:117‐125. [DOI] [PMC free article] [PubMed] [Google Scholar]
- 97. Wada M, Takahashi Y, Iseki C, Kawanami T, Daimon M, Kato T. Plasma fibrinogen, global cognitive function, and cerebral small vessel disease: results of a cross‐sectional study in community‐dwelling Japanese elderly. Intern Med. 2011;50:999‐1007. [DOI] [PubMed] [Google Scholar]
- 98. Wei CC, Zhang ST, Liu JF, et al. Association between fibrinogen and Leukoaraiosis in patients with ischemic stroke and atrial fibrillation. J Stroke Cerebrovasc Dis. 2017;26:2630‐2637. [DOI] [PubMed] [Google Scholar]
- 99. You CJ, Liu D, Liu LL, Liu QQ, Li GZ. Correlation between fibrinogen and White matter Hyperintensities among nondiabetic individuals with noncardiogenic ischemic stroke. J Stroke Cerebrovasc Dis. 2018;27:2360‐2366. [DOI] [PubMed] [Google Scholar]
- 100. Guo X, Deng B, Zhong L, et al. Fibrinogen is an independent risk factor for White matter Hyperintensities in CADASIL but not in sporadic cerebral small vessel disease patients. Aging Dis. 2021;12:801‐811. [DOI] [PMC free article] [PubMed] [Google Scholar]
- 101. Shen M, Wei G, Cheng M, Jiang H. Association between enlarged perivascular spaces and internal carotid artery stenosis: a study in patients diagnosed by digital subtraction angiography. J Stroke Cerebrovasc Dis. 2020;29:104635. [DOI] [PubMed] [Google Scholar]
- 102. Liu J, Wang D, Xiong Y, et al. Association between coagulation function and cerebral microbleeds in ischemic stroke patients with atrial fibrillation and/or rheumatic heart disease. Aging Dis. 2017;8:131‐135. [DOI] [PMC free article] [PubMed] [Google Scholar]
- 103. Staszewski J, Piusinska‐Macoch R, Brodacki B, Skrobowska E, Stepien A. Association between hemostatic markers, serum lipid fractions and progression of cerebral small vessel disease: a 2‐year follow‐up study. Neurol Neurochir pol. 2018;52:54‐63. [DOI] [PubMed] [Google Scholar]
- 104. Jefferson AL, Massaro JM, Wolf PA, et al. Inflammatory biomarkers are associated with total brain volume: the Framingham heart study. Neurology. 2007;68:1032‐1038. [DOI] [PMC free article] [PubMed] [Google Scholar]
- 105. Satizabal CL, Zhu YC, Mazoyer B, Dufouil C, Tzourio C. Circulating IL‐6 and CRP are associated with MRI findings in the elderly: the 3C‐Dijon study. Neurology. 2012;78:720‐727. [DOI] [PubMed] [Google Scholar]
- 106. Satizabal CL, Zhu YC, Dufouil C, Tzourio C. Inflammatory proteins and the severity of dilated Virchow‐Robin spaces in the elderly. J Alzheimers Dis. 2013;33:323‐328. [DOI] [PubMed] [Google Scholar]
- 107. Noz MP, Ter Telgte A, Wiegertjes K, et al. Trained immunity characteristics are associated with progressive cerebral small vessel disease. Stroke. 2018;49:2910‐2917. [DOI] [PubMed] [Google Scholar]
- 108. Tchalla AE, Wellenius GA, Sorond FA, Travison TG, Dantoine T, Lipsitz LA. Elevated circulating vascular cell adhesion Molecule‐1 (sVCAM‐1) is associated with concurrent depressive symptoms and cerebral white matter Hyperintensities in older adults. BMC Geriatr. 2015;15:62. [DOI] [PMC free article] [PubMed] [Google Scholar]
- 109. Wu BN, Wu J, Hao DL, Mao LL, Zhang J, Huang TT. High serum sICAM‐1 is correlated with cerebral microbleeds and hemorrhagic transformation in ischemic stroke patients. Br J Neurosurg. 2018;32:631‐636. [DOI] [PubMed] [Google Scholar]
- 110. Han JH, Wong KS, Wang YY, Fu JH, Ding D, Hong Z. Plasma level of sICAM‐1 is associated with the extent of white matter lesion among asymptomatic elderly subjects. Clin Neurol Neurosurg. 2009;111:847‐851. [DOI] [PubMed] [Google Scholar]
- 111. Huang Z, Yin Q, Sun W, et al. Microbleeds in ischemic stroke are associated with lower serum adiponectin and higher soluble E‐selectin levels. J Neurol Sci. 2013;334:83‐87. [DOI] [PubMed] [Google Scholar]
- 112. Noz MP, Ter Telgte A, Wiegertjes K, et al. Pro‐inflammatory monocyte phenotype during acute progression of cerebral small vessel disease. Front Cardiovasc Med. 2021;8:639361. [DOI] [PMC free article] [PubMed] [Google Scholar]
- 113. Markus HS, Hunt B, Palmer K, Enzinger C, Schmidt H, Schmidt R. Markers of endothelial and hemostatic activation and progression of cerebral white matter hyperintensities: longitudinal results of the Austrian stroke prevention study. Stroke. 2005;36:1410‐1414. [DOI] [PubMed] [Google Scholar]
- 114. Kawamura T, Umemura T, Kanai A, et al. Soluble adhesion molecules and C‐reactive protein in the progression of silent cerebral infarction in patients with type 2 diabetes mellitus. Metabolism. 2006;55:461‐466. [DOI] [PubMed] [Google Scholar]
- 115. Kario K, Matsuo T, Kobayashi H, Asada R, Matsuo M. 'Silent' cerebral infarction is associated with hypercoagulability, endothelial cell damage, and high Lp(a) levels in elderly Japanese. Arterioscler Thromb Vasc Biol. 1996;16:734‐741. [DOI] [PubMed] [Google Scholar]
- 116. Gottesman RF, Cummiskey C, Chambless L, et al. Hemostatic factors and subclinical brain infarction in a community‐based sample: the ARIC study. Cerebrovasc Dis. 2009;28:589‐594. [DOI] [PMC free article] [PubMed] [Google Scholar]
- 117. Wang X, Chappell FM, Valdes Hernandez M, et al. Endothelial function, inflammation, thrombosis, and basal ganglia perivascular spaces in patients with stroke. J Stroke Cerebrovasc Dis. 2016;25:2925‐2931. [DOI] [PMC free article] [PubMed] [Google Scholar]
- 118. Longstreth WT Jr, Katz R, Olson J, et al. Plasma total homocysteine levels and cranial magnetic resonance imaging findings in elderly persons: the cardiovascular health study. Arch Neurol. 2004;61:67‐72. [DOI] [PubMed] [Google Scholar]
- 119. Matsui T, Arai H, Yuzuriha T, et al. Elevated plasma homocysteine levels and risk of silent brain infarction in elderly people. Stroke. 2001;32:1116‐1119. [DOI] [PubMed] [Google Scholar]
- 120. Zylberstein DE, Skoog I, Björkelund C, et al. Homocysteine levels and lacunar brain infarcts in elderly women: the prospective population study of women in Gothenburg. J Am Geriatr Soc. 2008;56:1087‐1091. [DOI] [PubMed] [Google Scholar]
- 121. Vermeer SE, van Dijk EJ, Koudstaal PJ, et al. Homocysteine, silent brain infarcts, and white matter lesions: the Rotterdam scan study. Ann Neurol. 2002;51:285‐289. [DOI] [PubMed] [Google Scholar]
- 122. Naka H, Nomura E, Takahashi T, et al. Plasma total homocysteine levels are associated with advanced leukoaraiosis but not with asymptomatic microbleeds on T2*‐weighted MRI in patients with stroke. Eur J Neurol. 2006;13:261‐265. [DOI] [PubMed] [Google Scholar]
- 123. Ma Y, Zhao X, Zhang W, et al. Homocysteine and ischemic stroke subtype: a relationship study in Chinese patients. Neurol Res. 2010;32:636‐641. [DOI] [PubMed] [Google Scholar]
- 124. Pavlovic AM, Pekmezovic T, Obrenovic R, et al. Increased total homocysteine level is associated with clinical status and severity of white matter changes in symptomatic patients with subcortical small vessel disease. Clin Neurol Neurosurg. 2011;113:711‐715. [DOI] [PubMed] [Google Scholar]
- 125. Feng C, Bai X, Xu Y, Hua T, Huang J, Liu XY. Hyperhomocysteinemia associates with small vessel disease more closely than large vessel disease. Int J Med Sci. 2013;10:408‐412. [DOI] [PMC free article] [PubMed] [Google Scholar]
- 126. Gao Y, Wei S, Song B, et al. Homocysteine level is associated with White matter Hyperintensity locations in patients with acute ischemic stroke. PLoS One. 2015;10:e0144431. [DOI] [PMC free article] [PubMed] [Google Scholar]
- 127. Miwa K, Tanaka M, Okazaki S, et al. Increased Total homocysteine levels predict the risk of incident dementia independent of cerebral small‐vessel diseases and vascular risk factors. J Alzheimers Dis. 2016;49:503‐513. [DOI] [PubMed] [Google Scholar]
- 128. Wright CB, Paik MC, Brown TR, et al. Total homocysteine is associated with white matter hyperintensity volume: the northern Manhattan study. Stroke. 2005;36:1207‐1211. [DOI] [PMC free article] [PubMed] [Google Scholar]
- 129. Seshadri S, Wolf PA, Beiser AS, et al. Association of plasma total homocysteine levels with subclinical brain injury: cerebral volumes, white matter hyperintensity, and silent brain infarcts at volumetric magnetic resonance imaging in the Framingham offspring study. Arch Neurol. 2008;65:642‐649. [DOI] [PMC free article] [PubMed] [Google Scholar]
- 130. Raz N, Yang Y, Dahle CL, Land S. Volume of white matter hyperintensities in healthy adults: contribution of age, vascular risk factors, and inflammation‐related genetic variants. Biochim Biophys Acta. 2012;1822:361‐369. [DOI] [PMC free article] [PubMed] [Google Scholar]
- 131. Narayan SK, Firbank MJ, Saxby BK, et al. Elevated plasma homocysteine is associated with increased brain atrophy rates in older subjects with mild hypertension. Dement Geriatr Cogn Disord. 2011;31:341‐348. [DOI] [PubMed] [Google Scholar]
- 132. Kloppenborg RP, Geerlings MI, Visseren FL, et al. Homocysteine and progression of generalized small‐vessel disease: the SMART‐MR study. Neurology. 2014;82:777‐783. [DOI] [PubMed] [Google Scholar]
- 133. Baune BT, Ponath G, Rothermundt M, Roesler A, Berger K. Association between cytokines and cerebral MRI changes in the aging brain. J Geriatr Psychiatry Neurol. 2009;22:23‐34. [DOI] [PubMed] [Google Scholar]
- 134. Altendahl M, Maillard P, Harvey D, et al. An IL‐18‐centered inflammatory network as a biomarker for cerebral white matter injury. PLoS One. 2020;15:e0227835. [DOI] [PMC free article] [PubMed] [Google Scholar]
- 135. Kuipers S, Overmars LM, van Es B, et al. A cluster of blood‐based protein biomarkers reflecting coagulation relates to the burden of cerebral small vessel disease. J Cereb Blood Flow Metab. 2022;42:1282‐1293. [DOI] [PMC free article] [PubMed] [Google Scholar]
Associated Data
This section collects any data citations, data availability statements, or supplementary materials included in this article.
Data Availability Statement
Data sharing is not applicable to this article as no new data were created or analyzed in this study.