

Abstract
Mustard oil is the most commonly adulterated edible oil, invariably with argemone oil. This study was aimed to develop a parallel plate capacitive sensor for measurement of dielectric properties of pure mustard oil, pure argemone oil and their blends (25, 50 and 75%) at five levels of varying temperature (10 to 50 °C). The effect of blend ratio and temperature on the selected dielectric properties of oil—capacitance (C), dielectric loss tangent (tanδ), dielectric constant (), dielectric loss factor () and electrical conductivity (σ) were investigated. It was observed that composition of the individual oils in terms of moisture and fatty acids influenced the physical and dielectric properties. The sensor was used to relate the dielectric properties of oil samples with blend ratio and temperature by means of statistically significant (p < 0.05) and robust (R2 > 0.8) multiple linear regression model. The effect of temperature on C and was negative, while it was otherwise for tanδ, and σ. Increase in argemone oil content in the blends, increased the dielectric measures due to the associated changes in the physical and chemical properties. The capacitive sensor could distinctly identify mustard oil, argemone oil and its blends on the basis of dielectric properties.
Keywords: Mustard oil, Argemone oil, Edible oil adulteration, Dielectric properties, Capacitive sensors
Introduction
Oils and fats are plant or animal derived products that are consumed worldwide for frying, cooking, baking, salad dressing and flavouring. They are an indispensable part of the kitchen across all cuisines. Mustard (here mustard includes black, brown and yellow) oil is the third most consumed edible oil in the world, preceded by palm and soybean oil (USDA 2017). Prevalence of wide acceptance of mustard oil is due to its typical odour and distinct flavour. Mustard oil has anti-carcinogenic, antibacterial, antifungal properties and several other health benefits (Kaur et al. 2019). Though India is among the leading producers of mustard oil, but still its domestic price is high as compared to international prices. Circumstances have developed a case for widespread adulteration of mustard oil.
Argemone (Argemone mexicana) seeds have a physical appearance similar to mustard seeds and are widely used as an adulterant for the latter. Intake of argemone oil is toxic and dangerous to human health because it can cause dropsy, nausea, cardiac and respiratory problems (Mishra et al. 2012). Several outbreaks have been reported which occurred due to consumption of edible mustard oil adulterated with argemone oil (Lakshmi et al. 2014). Perhaps strict quality control procedures are required to be in place to protect the consumers. Traditional quality testing of oils include−chromatography, spectroscopy, chemical analysis, infra-red detection and sensory analysis (Sudhakar et al. 2021). These methods have their own limitations, they require extensive use of expensive chemicals, are time consuming, costly, etc.
In agri-food sector, investigations and understandings related to dielectric properties of food materials are getting popular because of its applicability in quality assessment and its ability to gauge subtle changes in food composition/matrix. This approach provides several benefits like simple, rapid, low-cost and non-destructive measurement (Jha et al. 2011). Dielectric properties are influenced by several factors—frequency of the alternating current electric field, temperature, moisture content, density and composition of food (Içier and Baysal 2004; Khaled et al. 2015). But it is often advisable to measure the dielectric properties as a function of temperature (Nelson 2015). Type of fatty acid is also an important factor affecting the dielectric properties of oil (Lizhi et al. 2008). Blending of oils causes changes in fatty acid profile (Dhyani et al. 2018). All told, in the present study it was hypothesized that distinctive dielectric constants shall emerge which can conclusively evince difference between mustard oil and argemone oil, or for that matter the changes in dielectric property of mustard oil due to the presence of argemone oil as an adulterant can be detectable.
Several methods of measuring dielectric properties of food materials have been described by Içier and Baysal (2004), they concluded that parallel plate capacitors are relatively simple and inexpensive tools suitable for liquid materials. Several attempts were made to develop a parallel plate capacitive sensor for measuring dielectric properties of oils (Cataldo et al. 2012; Rashvand et al. 2016; Valantina et al. 2017). These sensors can detect the change in dielectric properties of oils and the data generated thereof can be used to evaluate the oil quality or the deviation of it. Most research works were found to focus mainly on the application of the developed capacitive sensors for quality evaluation of degraded vegetable oils due to frying or detection of adulteration in olive oil and corn oil.
The present study elucidates the design of an intermeshed parallel plate capacitive sensor that can be used to determine the dielectric properties for pure mustard oil, pure argemone oils and their blends. Also, the alterations in dielectric properties due to variations in temperature and blend ratio (argemone oil: mustard oil) was analyzed using multivariate modeling.
Materials and methods
Materials
Mustard (Brassica nigra L.) seeds variety RH-0749 was purchased from National Seed Corporation, Bhopal, India. Argemone seed (Argemone mexicana L.) was procured from a farmer of district Dhoulpur in the north-western state of Rajasthan, India. Standard hot air oven method (FSSAI 2015) was used for determination of moisture content of the seed. The oil content of both seeds were determined using solvent extraction method (AOCS 2005). Dielectric properties of oil samples were measured using a dual band (120 Hz/1 kHz) LCR meter (Hioki 3511-50, Japan) having an accuracy of ± 0.08%.
Sample preparation
A single screw mechanical cold press oil expeller (SH-17, Shreeja Health Care, Surat, Maharashtra, India) was used to express the oil from mustard and argemone seeds, separately. Extracted crude oil was filtered through a sieve to remove large particles and later through muslin cloth to separate the suspended small particulate matter and flocculated solids. Experimental samples comprised pure mustard and argemone oils along with the three different blends − 25, 50 and 75%. In all there were 5 experimental samples. The levels of blending were selected based on the preliminary studies conducted for measuring dielectric properties of binary mixture of mustard oil and other vegetable oils (Agrawal and Bhatnagar 2005). Prepared samples were filled in polyethylene terephthalate (PET) bottles and kept in a refrigerator at 4 °C.
Oil quality indices
The physical and chemical properties of pure oil samples were determined before conducting the experiments. Moisture content was determined by hot air oven method (FSSAI 2015). Oil sample weighing 10 ± 0.005 g was kept in a hot air oven at 105 ± 1 °C for 1 h and weight was recorded till constant weight was achieved. Specific gravity and refractive index were determined by of AOAC (Pycnometer method) 920.212 (1920) and AOAC (Index of refraction of oils and fats) 921.08 method (1921), respectively. Specific gravity and refractive index were determined by the method as enumerated in FSSAI (2015). Sine-wave vibro viscometer (SV-10A, A D Company Ltd., Tokyo, Japan) was used to measure the viscosity of oils (Khaled et al. 2018). ISO 660: Animal and vegetable fats and oils—determination of acid value and acidity method (1996) was adopted for the determination of acid value and free fatty acid. Acid value and fatty acid were expressed as mg NaOH per gram and percentage of oleic acid, respectively (AOCS Cd 3d-63, Sampling and analysis of commercial fats and oils; Acid Value method, 2009). All the chemicals used for experiments were of analytical grade.
Fatty acid analysis
Fatty acid methyl esters (FAME) were determined using gas chromatography (GC) along with mass spectroscopy (MS). The analysis of the type of fatty acid present in the oil samples was done according to the method described by Zhang et al. (2017) with some modifications. Prior to conducting GC-MS, the samples were derivatized to fatty acid methyl esters using Boron-Trifluoride (BF3) as per AOAC Official Method 969.33 (1997). Then 2 µl of the derivatized sample was injected into the gas chromatograph (GC-2010 Pro, Shimadzu Corporation, Tokyo, Japan) comprising an AOC-20i auto-sampler interfaced to a mass spectrometer (QP 2010 Plus, Shimadzu Corporation, Tokyo, Japan) equipped with a polar fused silica column, Rtx2330 (highly polar phase; biscyanopropyl cyanopropylphenyl polysiloxane, 60 m length, 0.25 mm internal diameter, 0.2 μm film thickness). An electron ionization system was operated in electron impact (EI) mode with ionization energy of 70 eV. Helium gas (99.99% purity) was used as a carrier gas at a constant flow rate of 1.25 mL/min, and an injection volume of 2 μL was employed with a split ratio of 50:1. The injector temperature was maintained at 250 °C, the ion-source temperature was maintained at 230 °C. The column oven temperature was programmed from 60 °C with an increase of 15 °C/min to 165 °C (isothermal for 1 min), followed by an increased rate of 2 °C/min to 225 °C (isothermal for 2 min).
Dielectric properties
A capacitive sensor works as an open capacitor. It comprises two electrodes separated by a narrow gap. When a voltage is applied across the electrodes then electric energy is stored in the electrodes until the potential difference across the capacitor matches with that of the source voltage. The electrical energy stored in a capacitor is represented by capacitance (C), determined by using the following equation,
| 1 |
where, A is common area of electrodes, d is gap between electrodes, εo is the permittivity of free space (8.85 × 10⁻¹² Fm−1), and εr is the permittivity of the dielectric material.
Capacitance of a capacitor is a measure of its ability to store electric charge. It depends on the common area of two electrodes, the gap between the electrodes and the dielectric material between the electrodes. An LCR meter (Hitester 3511-50, Hioki, Japan) with two frequency levels (120 Hz and 1 kHz) was used for the determination of dielectric properties of oil samples. The used LCR meter displayed the value of capacitance and dissipation factor (D) as an output. The probe of LCR meter was connected to the parallel plate capacitive sensor mentioned above using a wire with a male banana pin at both ends. During preliminary experiments, it was observed that there was a large fluctuation in the measured capacitance at 120 Hz. Therefore, in this study, only 1 kHz frequency was selected for recording the capacitance. The amplitude of the voltage test signal was kept at 1 V. The instrument was calibrated against a known ceramic capacitor of 100 pF capacitance value prior to conducting the experiments. The dielectric properties of oil samples at different temperature (10–50 °C) were recorded at room temperature (28 ± 1) °C. The dielectric properties like—capacitance and loss tangent, were measured directly using the LCR meter. The capacitance measured (Cm) by the LCR meter was the sum of capacitance due to acrylic sheet (Ca) and oil sample present (Cs) between the plates. The mathematical expression adopted for calculation of Cm for the designed capacitive sensor was,
| 2 |
where, n is the number of copper plates. Loss tangent (tanδ) is the measure of signal loss due to the inherent dissipation of electromagnetic energy in the substrate and it is same as D. The value of tanδ was measured directly by the displayed value of D in LCR meter output display screen. Dielectric constant () is the ability of a material to store energy when it is subjected to an electric field; it influences the electric field distribution and the phase of waves travelling through the material. Dielectric constant of oil samples was determined using the relationship as shown in Eq. 3. This relationship found basis on the geometry of the eventually developed sensor. Dielectric loss factor () is the ability to dissipate heat energy in response to an applied electric field or various polarization mechanisms. Electrical conductivity (σ) is the measure of the ability of a material to conduct electricity. Dielectric loss factor () and electrical conductivity (σ) of oil samples were determined using Eqs. 4 and 5, respectively (Tripathi et al. 2015).
| 3 |
where, Cm is the measured capacitance which was as an output of the instrument, Ce is the capacitance due to error which was calculated by measuring the difference in actual and theoretical capacitance of the parallel plate capacitor having air as a dielectric medium.
| 4 |
| 5 |
where, σ is electrical conductivity (nmhos/cm) and f is frequency (kHz).
Development of capacitive sensor
In the present study, an electric box developed by Garvin (2000) was re-designed with slight alterations (Fig. 1). A polypropylene plastic box of length, width, height and thickness 217, 147, 95 and 2.25 mm, respectively; was partitioned into two halves such that the upper half was used as the sample holder and the lower half housed the electrical circuitry and the oil sample heating assembly. This heating unit could raise the temperature of the oil samples within the experimental range of temperature varying from 10 to 50 °C. All the readings were recorded when the temperature of oil reached the test temperature (± 0.5 °C). An aluminum plate was used as a heating element which was connected to positive temperature coefficient (PTC) wire. When electric current was supplied through PTC wire the electrical energy was converted into heat energy. The upper half was further divided into two compartments by a separating wall of 45 mm high—one compartment was used for keeping the oil sample and the other contained a silicon gel pouch to dehumidify the air contained in the box during the experiments. The silica gel ensured accurate measurement, since the dielectric property is sensitive to environmental components like—humidity and temperature (Singh et al. 2020). The area of compartment chosen for oil sample was such that the parallel plate capacitor assembly can easily fit into it. A hole of diameter 15 mm was made on the lid of the box just over the oil containing compartment for insertion of digital temperature sensor probe into oil sample, when not in use this hole was plugged by a rubber cap.
Fig. 1.

Schematic diagram of the capacitive sensor
Intermesh parallel plate capacitor comprising four copper plates (1.2 mm thick) were used to make capacitive sensor. Each square shaped plate had an area of 1 × 104 mm2 and gap between plates was 2 mm. This gap was maintained by means of a 2 mm acrylic sheet fixed at the opposite edges of the plates. The acrylic sheet also acted as an insulator. All four plates were tightly screwed with acrylic sheet ensuring that no slide gap was present between the plates. Four C-shaped aluminum hooks each of height 54 mm was used to suspend the parallel plate capacitor assembly from the lid of the box so that it can remain submerged in the oil sample during use. The effective common area between two parallel plates in the final assembly was 7 × 103 mm2. The electric connection of plates were done in parallel i.e. two alternate plates were connected to one female banana pin on the lid of the box. Considering air as the material between the plates and dielectric constant of acrylic sheet as 3.3, the theoretical capacitance value was 224 pF but the actual capacitance measured was 212 pF. It can be assumed that the error (± 12 pF) was due to fringing effect, uncertainty introduced due to the dielectric constant value of acrylic sheet or misalignment of the plates. The sample volume required for the complete submergence of electrodes into the oil sample for the designed recipient was approximately 350 ml. Before recording the measurand value of an oil sample, the sensor was rinsed with approximately 20 ml of the same oil sample 3–5 time so as to clean it of the traces from previous experimentation and prepare the probes for fresh experiments. Use of water or other organic solvent was avoided in order to prevent corrosion or contamination of oil samples.
Computational methods
A full factorial design with two factors and each factor having five levels was selected for this study. So, the total possible combinations for all the factors were twenty-five runs. Three trials were performed for each measurement. The average and standard deviation of the measured dielectric properties of oil samples were calculated in Microsoft Excel software (2010 version). Comparison of the effect of temperature and blend ratio on the mean of all the responses for each specific group was carried out by post-hoc Tukey’s Honestly Significant Difference test. Multiple regression models (Eq. 6) were developed to study the effect of temperature and blend ratio on the measured dielectric properties. ANOVA for multiple regression additive model was performed using SAS 9.3 software.
| 6 |
where, y is the dependent variable. The independent terms x1 and x2 are blend ratio and temperature, respectively. The coefficients bo, b1, b2 and b3 are parametric estimates and e is error.
Results and discussion
Measurement of oil quality indices
The moisture content of mustard and argemone seeds was 5.8 ± 0.32 and 5.2 ± 0.49%, respectively; while the oil content was 35 and 43%, respectively. Although, there was a minor difference in the moisture content of both the seeds, the moisture content in the oil was more than double for argemone oil as compared with mustard oil (Table 1). The free fatty acid and acid value of argemone oil were double as compared to mustard oil which resulted in the retention of comparatively more water (Shelar et al. 2011). The presence of more water in the oil resulted in a higher specific gravity of argemone oil as well. The same found expression in refractive index as well, argemone oil offered more resistance to the travel of light through it as compared to mustard oil. Mustard oil was observed to be more viscous than argemone oil, this can be attributed to the presence of an overwhelming amount of polyunsaturated fatty acids which is contributing to the increased viscosity (Yalcin et al. 2012).
Table 1.
Properties and composition of mustard and argemone oil influencing their dielectric properties
| Properties | Mustard oil | Argemone oil |
|---|---|---|
| Moisture content (%) | 0.044 ± 0.03 | 0.09 ± 0.02 |
| Specific gravity (30 °C) | 0.916 ± 0.02 | 0.948 ± 0.01 |
| Refractive index (30 °C) | 1.464 ± 3.3 × 10−04 | 1.466 ± 1.9 × 10−04 |
| Viscosity at 30 °C (mPa-s) | 26.2 ± 1.56 | 20.8 ± 0.09 |
| Free fatty acid as oleic acid (%) | 0.902 ± 0.29 | 1.875 ± 0.42 |
| Acid value (mg NaOH/g) | 1.79 ± 0.59 | 3.73 ± 0.84 |
| Fatty acid content (%) | ||
| Lauric acid | 0.02 | ND |
| Myristic acid | 0.23 | 0.23 |
| Pentadecylic acid | 0.06 | 0.03 |
| Palmitic acid | 3.85 | 11.96 |
| Palmitoleic acid | 0.51 | 0.38 |
| Margaric acid | 0.11 | 0.07 |
| Stearic acid | 3.05 | 4.91 |
| Oleic acid | 11.25 | 2.02 |
| Linoleic acid | 13.48 | 32.26 |
| Arachidic acid | 2.48 | 1.30 |
| Gondoic acid | 6.73 | 7.09 |
| Linolenic acid | 5.78 | 13.37 |
| Eicosadienoic acid | 1.76 | 1.48 |
| Behenic acid | 1.22 | 1.70 |
| Erucic acid | 43.72 | 1.97 |
| Lignoceric acid | 1.89 | 0.65 |
| Nervonic acid | 3.86 | ND |
| Lauric acid | ND | 20.58 |
| SFA | 12.91 | 20.85 |
| UFA | 87.09 | 79.15 |
| MUFA | 66.07 | 32.04 |
| PUFA | 21.02 | 47.11 |
SFA, Saturated fatty acid; UFA, Unsaturated fatty acid; MUFA, Mono unsaturated fatty acid; PUFA, Poly unsaturated fatty acid
Fatty acid profiling of oil samples
The result of the fatty acid analysis of oil samples using GC-MS is presented in Table 1. Erucic acid was found dominant in mustard oil, while linoleic acid was the most dominant fatty acid in argemone oil. These findings are in agreement with Jamwal et al. (2020). It was also observed that, linoleic acid content was dominant even in a blend prepared at 50:50 (v/v) ratio. The saturated fatty acid (SFA) content in argemone oil is about 8% more than in mustard oil. The MUFA content was more in mustard oil, while the PUFA content was higher in argemone oil.
Operating the capacitive sensor
The capacitive sensor is envisaged to detect the dielectric properties of mustard oil and argemone oil in a pure state as well as in their blended form. It was imperative to understand the factors that cause change in the dielectric properties so as to conclusively settle for the operating conditions of the capacitive sensor. Kumar et al. (2013) observed a strong correlation between viscosity and dielectric properties of the oil. Experiments conducted in the present study indicated a strong statistically significant (R2 ~ 0.98) quadratic correlation between viscosity and temperature (Fig. 2). This may be due to the increase in the energy level of the molecules when heat is applied, which in turn decreases the intermolecular forces between the molecules causing a fall in the viscosity (Valantina et al. 2017). Since the viscosity of argemone oil was far less than that of mustard oil so it was apparent that the overall viscosity of the blended oil sample would decrease with an increase in the per cent of the former in the blend.
Fig. 2.
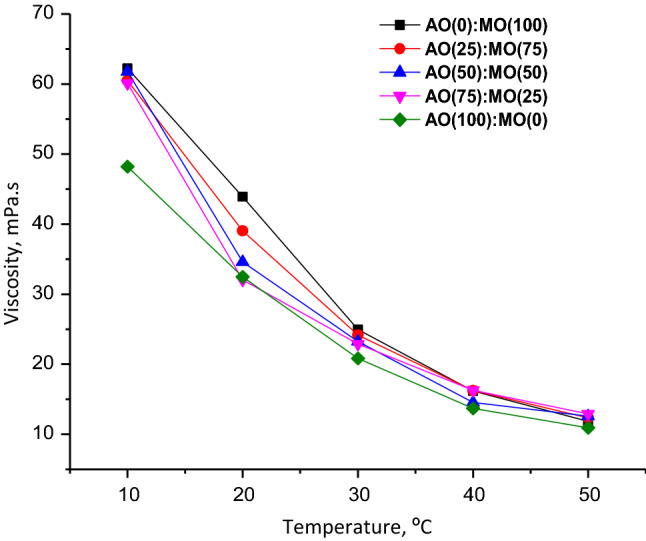
Graphical representation of the variation in viscosity with temperature for pure mustard oil, argemone oil and its blends
Effect of temperature on dielectric properties
It was observed that the temperature of the oil sample had a negative relation with C and (Table 2). An increase in temperature introduces a degree of randomness within the molecular matrix of oil samples resulting in a continual change of the dipole orientation. A similar trend has been observed for rice bran oil as well (Angeline et al. 2017). On the other hand, , tanδ and σ increase with an increase in temperature. Both tanδ and indicates quantitative dissipation of the electrical energy due to electrical conduction, dielectric relaxation and dielectric resonance. In the present study, loss from non-linear processes attributed to the rapid movement of the molecules and higher oscillation of dipoles caused by an increased temperature resulting in an increase in tanδ and . These observations are in sync with the findings of Yu et al. (2015) for canola seeds and Hamid et al. (2016) for vegetable oils at 50 Hz. Perusal of Table 2 reveals that there is a remarkable increase in the σ of the oil samples with an increase in temperature. Viscosity of the oil decreases with increase in temperature causing an increase in the mobility of polar molecules, this results in an increase in the σ of the oil (Kumar et al. 2013).
Table 2.
Measure of dielectric properties for different blends of oil samples
| Temperature (°C) | AO (0): MO (100) | AO (25): MO (75) | AO (50): MO (50) | AO (75): MO (25) | AO (100): MO (0) |
|---|---|---|---|---|---|
| C (pF) | |||||
| 10 | 396.333 ± 1.94Ad | 407.667 ± 1.63Ac | 409.333 ± 0.82Ac | 419.167 ± 1.33Ab | 422.5 ± 2.19Aa |
| 20 | 396.167 ± 0.75Ad | 407.667 ± 1.21Ac | 409.5 ± 0.84Ac | 419.333 ± 1.03Ab | 421.833 ± 2.17Aa |
| 30 | 396.333 ± 1.21Ac | 405.5 ± 0.84Bb | 407.167 ± 0.75Bb | 418.167 ± 1.83Aa | 419.333 ± 2.45Aa |
| 40 | 396.167 ± 1.17Ac | 405.167 ± 1.17Bb | 407.167 ± 0.75Bb | 417.833 ± 1.47Aa | 418.333 ± 1.87Ba |
| 50 | 396.167 ± 0.52Ad | 405.33 ± 1.03Bc | 407.833 ± 0.75Bb | 417.833 ± 1.17Aa | 418.167 ± 2.17Ba |
| tan δ | |||||
| 10 | 0.014 ± 1.21 × 10⁻³ Ed | 0.016 ± 7.53 × 10⁻⁴ Dd | 0.017 ± 7.53 × 10⁻⁴ Dc | 0.022 ± 1.94 × 10⁻³ Da | 0.020 ± 1.22 × 10⁻³ Db |
| 20 | 0.015 ± 7.53 × 10⁻⁴ Dd | 0.017 ± 1.47 × 10⁻³ Dcd | 0.018 ± 1.03 × 10⁻³ Dc | 0.024 ± 1.94 × 10⁻³ CDb | 0.022 ± 1.82 × 10⁻³ DCa |
| 30 | 0.019 ± 5.48 × 10⁻⁴ Cb | 0.019 ± 8.16 × 10⁻⁴ Cb | 0.020 ± 7.53 × 10⁻⁴ Cb | 0.025 ± 1.17 × 10⁻³ BCa | 0.024 ± 3.35 × 10⁻³ Ca |
| 40 | 0.023 ± 5.48 × 10⁻⁴ Bb | 0.023 ± 7.53 × 10⁻⁴ Bb | 0.023 ± 7.53 × 10⁻⁴ Bb | 0.028 ± 1.03 × 10⁻³ Ba | 0.028 ± 2.7 × 10⁻³ Ba |
| 50 | 0.028 ± 7.53 × 10⁻⁴ Ab | 0.027 ± 9.83 × 10⁻⁴ Ab | 0.027 ± 8.16 × 10⁻⁴ Ab | 0.031 ± 1.21 × 10⁻³ Aa | 0.032 ± 2.17 × 10⁻³ Aa |
| 10 | 2.841 ± 0.02Ad | 2.965 ± 0.02Ac | 2.982 ± 0.01Ac | 3.088 ± 0.01Ab | 3.124 ± 0.02Aa |
| 20 | 2.841 ± 0.01Ad | 2.965 ± 0.01Ac | 2.984 ± 0.01Ac | 3.09 ± 0.01Ab | 3.117 ± 0.02Aa |
| 30 | 2.843 ± 0.01Ac | 2.941 ± 0.01Bb | 2.959 ± 0.01Bb | 3.077 ± 0.02Aa | 3.090 ± 0.03Ba |
| 40 | 2.841 ± 0.01Ac | 2.938 ± 0.01Bb | 2.959 ± 0.01Bb | 3.074 ± 0.02Aa | 3.079 ± 0.02Ba |
| 50 | 2.843 ± 0.01Ad | 2.939 ± 0.01Bc | 2.966 ± 0.01Bb | 3.074 ± 0.01Aa | 3.077 ± 0.02Ba |
| 10 | 0.039 ± 3.51 × 10⁻³ Ed | 0.047 ± 2.23 × 10⁻³ Dc | 0.050 ± 2.27 × 10⁻³ Dc | 0.068 ± 6.06 × 10⁻³ Db | 0.061 ± 3.47 × 10⁻³ Ca |
| 20 | 0.043 ± 2.18 × 10⁻³ Dd | 0.051 ± 4.43 × 10⁻³ Dc | 0.053 ± 3.02 × 10⁻³ Dc | 0.075 ± 5.89 × 10⁻³ CDa | 0.067 ± 5.42 × 10⁻³ Cb |
| 30 | 0.053 ± 1.71 × 10⁻³ Cb | 0.057 ± 2.41 × 10⁻³ Cb | 0.059 ± 2.24 × 10⁻³ Cb | 0.077 ± 3.43 × 10⁻³ BCa | 0.074 ± 1.07 × 10⁻² CBa |
| 40 | 0.064 ± 1.62 × 10⁻³ Bb | 0.067 ± 2.24 × 10⁻³ Bb | 0.068 ± 2.37 × 10⁻³ Bb | 0.085 ± 2.96 × 10⁻³ Ba | 0.087 ± 8.80 × 10⁻³ Ba |
| 50 | 0.080 ± 2.20 × 10⁻³ Ab | 0.079 ± 2.86 × 10⁻³ Ab | 0.081 ± 2.46 × 10⁻³ Ab | 0.094 ± 3.62 × 10⁻³ Aa | 0.1 ± 7.31 × 10⁻³ Aa |
| σ (nmhos/cm) | |||||
| 10 | 0.022 ± 1.95 × 10⁻³ Ed | 0.026 ± 1.24 × 10⁻³ Dc | 0.028 ± 1.26 × 10⁻³ Dc | 0.038 ± 3.37 × 10⁻³ Da | 0.034 ± 1.93 × 10⁻³ Cb |
| 20 | 0.024 ± 1.21 × 10⁻³ Dd | 0.028 ± 2.46 × 10⁻³ Dc | 0.029 ± 1.68 × 10⁻³ Dc | 0.042 ± 3.27 × 10⁻³ Ca | 0.037 ± 3.01 × 10⁻³ Cb |
| 30 | 0.029 ± 9.52 × 10⁻⁴ Cb | 0.032 ± 1.34 × 10⁻³ Cb | 0.033 ± 1.25 × 10⁻³ Cb | 0.043 ± 1.91 × 10⁻³ Ca | 0.041 ± 5.96 × 10⁻³ BCa |
| 40 | 0.036 ± 9.03 × 10⁻⁴ Bb | 0.037 ± 1.24 × 10⁻³ Bb | 0.038 ± 1.32 × 10⁻³ Bb | 0.047 ± 1.64 × 10⁻³ Ba | 0.048 ± 4.89 × 10⁻³ ABa |
| 50 | 0.045 ± 1.22 × 10⁻³ Ab | 0.044 ± 1.59 × 10⁻³ Ab | 0.044 ± 1.37 × 10⁻³ Ab | 0.052 ± 2.01 × 10⁻³ Aa | 0.051 ± 4.06 × 10⁻³ Aa |
Superscripts (A, B, C, D, E) and (a, b, c, d, e) followed by the same letter in the same column and same row are not significantly different (P < 0.05), respectively
Effect of blend ratio on dielectric properties
Noticeable changes in the values of the dielectric properties can be observed with respect to an increase in the blend ratio (Table 2). Specific gravity or density and type of fatty acid of the oil samples are some of the important factors affecting the dielectric behaviour of oil samples (İçier and Baysal 2004). Valantina et al. (2017) showed a positive correlation of density with C and ɛ' of vegetable oils. Higher density means more particles per unit volume, thus there will be more interaction of molecules with the electric field which in turn leads to an increase in C and . This trend was exhibited by the oil blends as the proportion of argemone oil increased. It has already been reported that the specific gravity of argemone oil (0.948 ± 0.01) was more than that of mustard oil (0.916 ± 0.02). A relatively higher amount of moisture in argemone oil may also have contributed to an increase in C and ; water being a highly polar molecule reacts to an applied electric field by orienting itself accordingly and storing energy far greater than fatty acid molecules present in the oils.
An increase in the level of argemone oil in the blend resulted in an increase in tanδ and . Perhaps this was due to the increased polyunsaturated fatty acids (PUFA) content (Table 1) which entails an increase in the number of double bonds and long molecular chain length in the majority of polar fats present in the argemone oil. Valantina et al. (2016) and Lizhi et al. (2008) also observed a similar result for tanδ and of different vegetable oils. Greater density and viscosity of argemone oil as compared to mustard oil resulted in higher electrical conductivity. May be more molecules resulted in an increased Brownian motion resulting in an increased electrical conductivity (Valantina et al. 2018). Viscosity depicted a negative correlation with argemone oil due to its higher PUFA content, this is because of the presence of an increased number of double bonds that does not allow close bonding of fatty acid molecules, consequently the structure is loosely packed, hence the oil is less viscous.
Interrelationship of temperature and blend ratio with dielectric properties
The values of the coefficients of multiple linear regression models for C, tanδ, , and σ is given in Table 3. The value of Pr >|t| shows that all the variables in the model were individually highly significant at 95% confidence level, except for temperature; which failed to cast a significant effect on C and . Depending on the oil samples sandwiched between the electrodes of the capacitor, the capacitance would vary. Inverse relation of C and temperature can be attributed to the higher conductance at higher temperatures which would eventually lead to an internal leakage of the capacitor causing a lower capacitance. An increase in blend ratio results in an overall decrease of viscosity of the blend leading to a positive correlation of tanδ. Temperature dependence of tanδ was primarily due to, one- the decrease in viscosity with an increase in temperature causes a double bond effect on the quantum of power losses resulting in an increase in tanδ; two—degree of dipole orientation is increased with increase in temperature causing a decrease in tanδ. However, the first factor overwhelms the second up to an extent that the overall effect results into a direct proportionality between temperature and tanδ. The significance of blend ratio on all the measured dielectric parameters indicates that a small amount of mixing AO to MO can alter the original dielectric properties of MO. The individual effect of temperature on C and was not significant whereas tanδ, and σ were significantly affected at 95% confidence level. However, the interaction effect of temperature and blend ratio was significant (p < 0.05) only for C and .
Table 3.
Analysis of the variables in multiple linear regression models in relation to the dielectric properties
| Parameter | Variable | Parameter estimate | Standard error | t value | Pr >|t| |
|---|---|---|---|---|---|
| C | Intercept | 398.27 | 0.84 | 473.88 | < .0001 |
| Blend ratio | 0.265 | 0.014 | 19.35 | < .0001 | |
| Temperature | − 0.013 | 0.025 | − 0.51 | 0.609 | |
| Blend ratio × Temperature | − 8.8 × 10⁻⁴ | 4.1 × 10⁻⁴ | − 2.13 | 0.035 | |
| tanδ | Intercept | 0.0096 | 6.93 × 10⁻⁴ | 13.79 | < .0001 |
| Blend ratio | 8.53 × 10⁻⁵ | 1.13 × 10⁻⁵ | 7.55 | < .0001 | |
| Temperature | 3.17 × 10⁻⁴ | 2.1 × 10⁻⁵ | 15.16 | < .0001 | |
| Blend ratio × Temperature | − 6.33 × 10⁻⁷ | 3.41 × 10⁻⁷ | − 1.85 | 0.0657 | |
| Intercept | 2.86 | 0.009 | 317.21 | < .0001 | |
| Blend ratio | 0.003 | 1.47 × 10⁻⁴ | 19.35 | < .0001 | |
| Temperature | − 1.39 × 10⁻⁴ | 2.72 × 10⁻⁴ | − 0.51 | 0.609 | |
| Blend ratio × Temperature | − 9.45 × 10⁻⁶ | 4.44 × 10⁻⁶ | − 2.13 | 0.035 | |
| Intercept | 0.027 | 0.002 | 12.52 | < .0001 | |
| Blend ratio | 2.95 × 10⁻⁴ | 3.55 × 10⁻⁴ | 8.30 | < .0001 | |
| Temperature | 9.01 × 10⁻⁴ | 6.57 × 10⁻⁵ | 13.72 | < .0001 | |
| Blend ratio × Temperature | − 1.31 × 10⁻⁵ | 4.44 × 10⁻⁶ | − 1.22 | 0.224 | |
| σ | Intercept | 0.015 | 0.001 | 12.52 | < .0001 |
| Blend ratio | 1.6 × 10⁻⁴ | 1.97 × 10⁻⁵ | 8.30 | < .0001 | |
| Temperature | 5.01 × 10⁻⁴ | 3.65 × 10⁻⁴ | 13.72 | < .0001 | |
| Blend ratio × Temperature | − 7.27 × 10⁻⁷ | 5.96 × 10⁻⁷ | − 1.22 | 0.224 |
C, capacitance (pF); tanδ, loss tangent; , dielectric constant; , dielectric loss factor; σ, electrical conductivity (nmhos/mm); Degree of freedom for each variables is unity.
The viscous nature of the oil recedes as the temperature increases; leading to increased mobility of the polar compounds. Overall effect of this phenomenon is a decrease of with an increase in temperature, which stands invariably true except in case of pure mustard oil, AO(0):MO(100). However, rise in with increased blend ratio can be attributed to three factors, one—argemone oil has lesser viscosity compared to mustard oil; two—content of saturated fatty acids (SFA) in the oil blends increased, as the SFA (trans form of fatty acids produced as a result of isomerization of saturated fatty acids) content (Table 1) of argemone (20.85%) was much higher than that of mustard (12.91%) which in turn is responsible for increase in (Angeline et al. 2017; Valantina et al. 2018); three—decrease in oleic acid content and increase in linoleic acid content of the blends (Table 1). Perhaps, the overall positive correlation of blend ratio with as observed in the multivariate model analysis can be because of the extent of lowering effect of oleic acid is far lesser than the increasing effect of linoleic acid (Woo et al. 2019). It can be conclusively inferred that increases with the increase in the degree of unsaturation in the sample.
The measure of dielectric conductivity in nothing but the manifestation of the motion of the polar molecules in liquid system. An increase in temperature and blend ratio will result in a decrease in the viscosity of the oil sample responsible for an increase in electrical conductivity (σ).
Results of the multiple linear regression model relating dielectric properties with temperature and blend ratio is shown in Table 4. The analysis of variance (ANOVA) indicates that multivariate models for the measured dielectric properties were significant (p < 0.0001), robust (R2 of more than 0.8) and that the experiments were reasonably accurately conducted (c.v. < 10%). The value of R2 shows that all the variables in the models were highly significant at 95% confidence level. Graphical representation of the performance of the models for different response have been presented in Fig. 3.
Table 4.
ANOVA for multiple linear regression model
| Model | DF | RMSE | c.v | R2 | Adj R2 | F value | Pr > F |
|---|---|---|---|---|---|---|---|
| C | 3 | 2.534 | 0.618 | 0.918 | 0.917 | 563.46 | < 0.0001 |
| tanδ | 3 | 0.002 | 9.33 | 0.833 | 0.831 | 250.57 | < 0.0001 |
| 3 | 0.027 | 0.911 | 0.918 | 0.917 | 563.46 | < 0.0001 | |
| 3 | 0.007 | 9.79 | 0.839 | 0.837 | 257.15 | < 0.0001 | |
| σ | 3 | 0.004 | 9.79 | 0.839 | 0.837 | 257.15 | < 0.0001 |
DF, Degrees of freedom; RMSE, Root mean square error; c.v., coefficient of variation (%); R2, Coefficient of determination; Adj R2, Adjusted R2
Fig. 3.

Graphical representation of the actual (150 observations) and predicted values obtained from the multiple linear regression models of a Capacitance, C b Dielectric loss tangent, tanδ c Dielectric constant, ɛ' d Dielectric loss factor, ɛ'' e Electrical conductivity, σ
Conclusions
Adulteration of mustard oil with argemone oil is common and prevalent; it has been reported to be the cause of serious health hazards. Increasing demand for mustard oil will only aggravate the current situation more. In the present context it would be apt to use techniques and protocols that can be useful in determining the purity of mustard oil rapidly. Keeping this in view, a parallel plate capacitor was developed in this study. The developed sensor set-up could measure the dielectric properties (C, , tanδ, and σ) of mustard oil, argemone oil and their blends; the set-up was operated at different temperatures. Temperature showed a negative correlation with C and while a positive correlation with tan δ, and σ. The presence of argemone oil (and its increase in the blends) resulted in a positive correlation with all the measured dielectric properties. The ANOVA of multiple regression models relating dielectric properties with temperature and blend ratio were highly significant (p < 0.05) and robust (R2 > 0.8). It was also understood that introduction of argemone oil to the mustard oil matrix resulted in changes with the physical and fatty acid profile of the oil which resulted in some conspicuous changes in the dielectric properties. Overall, it can be concluded that the developed sensor can sense the change in dielectric property of mustard oil brought about by the presence of argemone oil as an adulterant.
Acknowledgements
The authors wish to thank the laboratory staff of Engineering Properties Laboratory for their help during the experimentation. Gratitude is also expressed for Director, ICAR-Central Institute of Agricultural Engineering, Bhopal, India for providing all the logistics.
Author contributions
AS was responsible for conducting the experiments, collection of data and preparation of the manuscript, SKC conceptualized the research work, provided the logistics and edited the manuscript, AK helped with data analysis and preparation of the manuscript.
Funding
This research work has been funded by Indian Council of Agricultural Research, New Delhi.
Data availability
The data generated during this research work is available with the authors.
Code availability
Not Applicable.
Declarations
Conflicts of interest
The authors declare that they have no known competing financial interests or personal relationships that could have appeared to influence the work reported in this paper.
Consent to participate
Not Applicable.
Consent for publication
The authors’ have no objection regarding publishing of the data presented in the tables or the images reported in this paper.
Ethics approval
Not Applicable.
Footnotes
Publisher's Note
Springer Nature remains neutral with regard to jurisdictional claims in published maps and institutional affiliations.
References
- Agrawal S, Bhatnagar D. Dielectric study of binary mixtures of edible unsaturated oils. Indian J Pure Appl Phys. 2005;43:624–629. [Google Scholar]
- Angeline DP, Valantina SR, Mukesh Kumar V. Empirical models to correlate the basic physical and chemical indices of modified rice bran and mustard oil. Int J Food Prop. 2017;20:2805–2816. doi: 10.1080/10942912.2016.1252921. [DOI] [Google Scholar]
- AOCS 2005 Approved Procedure Am 5-04 Rapid Determination of Oil/Fat Utilizing High Temperature Solvent Extraction
- Cataldo A, Piuzzi E, Cannazza G, De Benedetto E. Classification and adulteration control of vegetable oils based on microwave reflectometry analysis. J Food Eng. 2012;112:338–345. doi: 10.1016/j.jfoodeng.2012.04.012. [DOI] [Google Scholar]
- Dhyani A, Chopra R, Garg M. A review on blending of oils and their functional and nutritional benefits. Chem Sci Rev Lett. 2018;7:840–847. [Google Scholar]
- FSSAI (2015) FSSAI manual of methods of analysis of foods: Oils and Fats. Ministry of Health and Family Welfare, GoI, New Delhi
- Hamid MHA, Ishak MT, Din MM, Suhaimi NS, Katim NIA (2016) Dielectric properties of natural ester oils used for transformer application under temperature variation. In: 2016 IEEE International Conference on Power and Energy (PECon) (pp. 54–57). IEEE. 10.1109/PECON.2016.7951472.
- Içier F, Baysal T. Dielectrical properties of food materials—1: factors affecting and industrial uses. Crit Rev Food Sci Nutr. 2004;44:465–471. doi: 10.1080/10408690490886692. [DOI] [PubMed] [Google Scholar]
- Jamwal R, Kumari S, Balan B, Dhaulaniya AS, Kelly S, Cannavan A, Singh DK. Attenuated total Reflectance-Fourier transform infrared (ATR–FTIR) spectroscopy coupled with chemometrics for rapid detection of argemone oil adulteration in mustard oil. LWT-Food Sci Technol. 2020;120:108945. doi: 10.1016/j.lwt.2019.108945. [DOI] [Google Scholar]
- Jha SN, Narsaiah K, Basediya AL, Sharma R, Jaiswal P, Kumar R, Bhardwaj R. Measurement techniques and application of electrical properties for nondestructive quality evaluation of foods—A review. J Food Sci Technol. 2011;48:387–411. doi: 10.1007/s13197-011-0263-x. [DOI] [PMC free article] [PubMed] [Google Scholar]
- Kaur R, Sharma AK, Rani R, Mawlong I, Rai PK. Medicinal qualities of mustard oil and its role in human health against chronic diseases: a review. Asian J Dairy Food Res. 2019;38:98–104. [Google Scholar]
- Khaled AY, Abd Aziz S, Rokhani FZ. Capacitive sensor probe to assess frying oil degradation. Inf Process Agric. 2015;2:142–148. [Google Scholar]
- Khaled AY, Abd Aziz S, Rokhani FZ, Ibrahim NUA. Interdigitated electrode for degradation assessment of palm olein during batch deep fat frying. Trans ASABE. 2018;61:15–24. doi: 10.13031/trans.11840. [DOI] [Google Scholar]
- Kumar D, Singh A, Tarsikka PS. Interrelationship between viscosity and electrical properties for edible oils. J Food Sci Technol. 2013;50:549–554. doi: 10.1007/s13197-011-0346-8. [DOI] [PMC free article] [PubMed] [Google Scholar]
- Lakshmi PVM, Sharma A, Bhatia D, Tikoo K, Kumar R. Case Report: Dropsy outbreak in a single family in Punjab. India. Am J Trop Med. 2014;91:786. doi: 10.4269/ajtmh.14-0108. [DOI] [PMC free article] [PubMed] [Google Scholar]
- Lizhi H, Toyoda K, Ihara I. Dielectric properties of edible oils and fatty acids as a function of frequency, temperature, moisture and composition. J Food Eng. 2008;88:151–158. doi: 10.1016/j.jfoodeng.2007.12.035. [DOI] [Google Scholar]
- Mishra V, Mishra M, Ansari KM, Chaudhari BP, Khanna R, Das M. Edible oil adulterants, argemone oil and butter yellow, as aetiological factors for gall bladder cancer. Eur J Cancer. 2012;48:2075–2085. doi: 10.1016/j.ejca.2011.09.026. [DOI] [PubMed] [Google Scholar]
- Nelson S. Book: Dielectric properties of agricultural materials and their applications. Georgia: Academic Press; 2015. Dielectric properties of selected food materials; pp. 147–165. [Google Scholar]
- Rashvand M, Omid M, Mobli H, Firouz MS. Adulteration detection in olive oil using dielectric technique and data mining. Sens Bio-Sens Res. 2016;11:33–36. doi: 10.1016/j.sbsr.2016.10.005. [DOI] [Google Scholar]
- Shelar MK, Bafna AR, Wahile AM, Tupkari SV. Evaluation of edible oils for Argemone mexicana seed oil adulteration. Res J Pharm Biol Chem Sci. 2011;2:927–936. [Google Scholar]
- Singh S, Ojha VN, Kumar A. Effect of temperature and humidity on dielectric and impedance properties of K (Nb0. 8Ta0. 2) 0.99 Mn0. 01O3 electroceramics. Mater Res Express. 2020;7(4):046302. doi: 10.1088/2053-1591/ab8587. [DOI] [Google Scholar]
- Sudhakar A, Chakraborty SK, Mahanti NK, Verghese C. A comprehensive review of recent trends in edible oils authentication techniques. Crit Rev Food Sci Nutr. 2021 doi: 10.1080/10408398.2021.1956424. [DOI] [PubMed] [Google Scholar]
- T Garvin (2000) U.S. Patent No. 6,144,016. Washington, DC: U.S. Patent and Trademark Office.
- Tripathi M, Sahu JN, Ganesan P, Dey TK. Effect of temperature on dielectric properties and penetration depth of oil palm shell (OPS) and OPS char synthesized by microwave pyrolysis of OPS. Fuel. 2015;153:257–266. doi: 10.1016/j.fuel.2015.02.118. [DOI] [Google Scholar]
- USDA (2017) USDA National Agricultural Statistics Service, 2017 Census of Agriculture
- Valantina SR, Susan D, Bavasri S, Priyadarshini V, Saraswathi RR, Suriya M. Experimental investigation of electro-rheological properties of modeled vegetable oils. J Food Sci Technol. 2016;53:1328–1337. doi: 10.1007/s13197-015-2050-6. [DOI] [PMC free article] [PubMed] [Google Scholar]
- Valantina SR, Angeline DP, Uma S, Prakash BJ. Estimation of dielectric constant of oil solution in the quality analysis of heated vegetable oil. J Mol Liq. 2017;238:136–144. doi: 10.1016/j.molliq.2017.04.107. [DOI] [Google Scholar]
- Valantina SR, Jayalatha KA, Angeline DP, Uma S, Ashvanth B. Synthesis and characterisation of electro-rheological property of novel eco-friendly rice bran oil and nanofluid. J Mol Liq. 2018;256:256–266. doi: 10.1016/j.molliq.2018.01.183. [DOI] [Google Scholar]
- Woo Y, Kim MJ, Lee J. Prediction of oxidative stability in bulk oils using dielectric constant changes. Food Chem. 2019;279:216–222. doi: 10.1016/j.foodchem.2018.12.012. [DOI] [PubMed] [Google Scholar]
- Yalcin H, Toker OS, Dogan M. Effect of oil type and fatty acid composition on dynamic and steady shear rheology of vegetable oils. J Oleo Sci. 2012;61:181–187. doi: 10.5650/jos.61.181. [DOI] [PubMed] [Google Scholar]
- Yu DU, Shrestha BL, Baik OD. Radio frequency dielectric properties of bulk canola seeds under different temperatures, moisture contents, and frequencies for feasibility of radio frequency disinfestation. Int J Food Prop. 2015;18:2746–2763. doi: 10.1080/10942912.2015.1013630. [DOI] [Google Scholar]
- Zhang L, Yuan Z, Li P, Wang X, Mao J, Zhang Q, Hu C. Targeted multivariate adulteration detection based on fatty acid profiles and Monte Carlo one-class partial least squares. Chemom Intell Lab Syst. 2017;169:94–99. doi: 10.1016/j.chemolab.2017.09.002. [DOI] [Google Scholar]
Associated Data
This section collects any data citations, data availability statements, or supplementary materials included in this article.
Data Availability Statement
The data generated during this research work is available with the authors.
Not Applicable.