

Summary
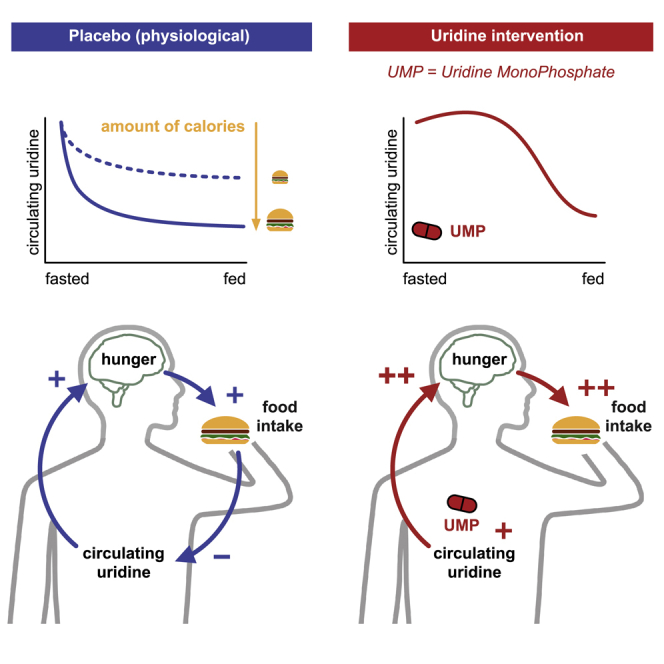
Feeding behavior must be continuously adjusted to match energy needs. Recent discoveries in murine models identified uridine as a regulator of energy balance. Here, we explore its contribution to the complex control of food intake in humans by administering a single dose of uridine monophosphate (UMP; 0.5 or 1 g) to healthy participants in two placebo-controlled studies designed to assess food behavior (registration: DRKS00014874). We establish that endogenous circulating uridine correlates with hunger and ensuing food consumption. It also dynamically decreases upon caloric ingestion, prompting its potential role in a negative feedback loop regulating energy intake. We further demonstrate that oral UMP administration temporarily increases circulating uridine and—when within the physiological range—enhances hunger and caloric intake proportionally to participants’ basal energy needs. Overall, uridine appears as a potential target to tackle dysfunctions of feeding behavior in humans.
Keywords: uridine, food intake, hunger, adaptive behavior
Graphical abstract
Highlights
-
•
In healthy humans, circulating uridine relates to hunger and ensuing food intake
-
•
Uridine levels dynamically decrease proportionally to caloric ingestion
-
•
Oral uridine monophosphate (UMP) increases circulating uridine levels
-
•
Under certain conditions, UMP supplementation can promote food consumption
A study by Hanssen, Rigoux, et al. shows that, in humans, circulating uridine is a mediator of hunger and food intake that is dynamically regulated by caloric ingestion. Oral administration of uridine monophosphate (UMP) increases circulating uridine levels and can, under the right conditions, alter food behavior regulation.
Introduction
Uridine is mostly known as a precursor for RNA; however, this nucleoside and its derivatives also play a critical role in glycogen synthesis, bio-membrane integrity, and normal neurophysiological function.1,2,3 While circulating uridine levels are long known to be tightly controlled to ensure correct cell function in mammals,4,5 recent insights into its systemic regulation in murine models suggest that blood uridine also reflects the animals’ nutritional status, hence turning the spotlight on the involvement of uridine in the regulation of energy balance of the whole organism.6,7 Indeed, while basal uridine homeostasis is predominantly ensured by the liver in the fed state,8 uridine levels are increased during fasting as the lipolysis in adipose tissue triggers de novo uridine synthesis in the adipocytes.7,9 Conversely, circulating uridine quickly decreases upon feeding, cleared by the liver and excreted in bile.7,8 Altogether, such physiological regulation establishes circulating uridine as a signal of the nutritional status of an organism and suggests a role for uridine in the control of energy balance.
This hypothesis is further supported by recent discoveries on the role of circulating uridine in the neural control of metabolism. Indeed, beyond its long known influences on peripheral homeostasis2—such as the regulation of glycogen storage in the liver10,11—uridine and its phosphorylated derivatives have been more recently revealed as novel players in the central regulation of food intake. In particular, uridine diphosphate (UDP), whose synthesis in the CNS directly depends on the peripheral circulating uridine levels,12,13 stimulates the orexigenic agouti-related peptide/neuropeptide Y (AgRP/NPY) neurons of the arcuate nucleus of the hypothalamus, thereby promoting food intake in mice.6 Disrupting UDP signaling in these hunger-mediating neurons reduces the consumption of a high-fat diet,14 further supporting the role of uridine in the central control of food intake. Moreover, mice lacking the UDP receptor globally, restricted in AgRP neurons, or adipose tissue present with improved glucose metabolism in obesity.14,15
Although the role of circulating uridine in the control of metabolic balance and energy intake is progressively unraveled in rodent models, the relevance of this pathway in the regulation of human food intake remains unclear. While obesity has been repeatedly associated with abnormal uridine regulation in humans, it is often confounded with other metabolic disorders.16,17 In the general population, the mechanisms of the metabolic regulation of circulating uridine and, reciprocally, the potentially causal role of uridine on food intake, are still unknown. In the era of a soaring obesity pandemic, defining the complex mechanisms regulating food intake in humans is of paramount interest. We here address the role of uridine in human feeding behavior using two interventional studies, defining a function of circulating uridine in the control of food intake in humans.
Results and discussion
To investigate the potential relevance of circulating uridine levels in the regulation of hunger and food intake in humans, we measured blood uridine, subjective hunger, and food intake of healthy, normal-weight participants (Table 1) before and during an ad libitum buffet (Figure 1). To further assess the causal impact of uridine on intake behavior, we concurrently modulated circulating uridine levels using an oral administration (placebo controlled, cross-over, double blind) of the uridine precursor uridine monophosphate (UMP; 0.5 g: n = 17 or 1 g: n = 22).
Table 1.
Participants’ characteristics
| Parameter | Study 1 g (mean ± SEM) | Study 0.5 g (mean ± SEM) |
|---|---|---|
| n (female:male) | 22 (12:10) | 17 (11:8) |
| Age (years) | 24.1 ± 0.6 | 25.1 ± 0.9 |
| BMI (kg/m2) | 22.6 ± 0.5 | 22.7 ± 0.4 |
| Female (kg/m2) | 21.8 ± 0.8 | 22.1 ± 0.5 |
| Male (kg/m2) | 22.4 ± 0.5 | 23.4 ± 0.5 |
| Fat-free mass (kg) | 54.2 ± 2.6 | 52.2 ± 1.6 |
| Female (kg) | 45.6 ± 2.6 | 44.6 ± 0.5 |
| Male (kg) | 64.4 ± 1.6 | 60.8 ± 1.3 |
| Fat-free mass (%) | 79.6 ± 1.9 | 67.5 ± 1.3 |
| Female (%) | 72.7 ± 1.5 | 82.3 ± 1.5 |
| Male (%) | 89.0 ± 1.2 | 71.3 ± 1.1 |
Data are mean ± SEM. BMI, body mass index.
Figure 1.

Study design
(A) Study with 1 g UMP. Participants arrived fasted at the testing site at 8:00 a.m. A baseline blood sample was taken, and the body composition analyzed on an impedance scale. Participants then received 1 g UMP dissolved in orange juice or pure orange juice as placebo condition and were given access to a personal buffet, from which they could serve themselves ad libidum. Further blood draws followed at 10:00 a.m. (after 2 h) and at 12:00 p.m. (after 4 h). Every hour, participants were asked to rate their hunger levels on a continuous 100 mm visual analog scale (VAS). Food intake was assessed every 2 h by weighting missing items from the buffet. The experiment ended at 2:00 p.m. with a short debriefing.
(B) Study with 0.5 g UMP. Participants arrived fasted at the testing site at 8:00 a.m., and a baseline blood sample was taken. They then received a standardized breakfast (686 kcal) with either 0.5 g UMP dissolved in orange juice or pure orange juice as placebo condition. Next, the body composition was analyzed on an impedance scale. Further blood samples were taken at 10:00 (after 2 h) and 11:30 a.m. (after 3.5 h). A personal buffet was served at 11:30 a.m. and refilled every 1.5 h, measuring the missing amount of food at the same time. VASs were used to measure hunger ratings at 8:00 and 10:00 a.m. and every 1.5 h from 11:30 a.m. onward. Behavioral tasks were used as distraction lasting for 15 min at 11:15 a.m. and 12:30, 2:00, and 3:30 p.m. The experiment ended at 5:30 p.m. with a short debriefing. UMP, uridine monophosphate.
Circulating uridine correlates with hunger ratings and food intake
To characterize the influence of circulating uridine on food-related behavior, we first analyzed how blood measurements of circulating uridine, hunger ratings, and food consumption concomitantly unfolded in time under physiological conditions (study [1 g], placebo intervention). We found that higher uridine levels were consistently associated with higher hunger ratings at the same time point (F(1, 44.7) = 29.4, p < 0.001, ω2 = 0.38; Figure 2B; Table S5) and anticipated larger food intakes in the next 2 h (F(1, 46.2) = 8.4, p = 0.006, ω2 = 0.13; Figures 2C and 2F; Table S6). We furthermore showed that hunger mediates the positive influence of uridine on food intake (mediation analysis, c = 0.58, p = 0.002; Figure 2G; Table S7), suggesting that uridine exacerbates subjective hunger, which in turn drives caloric intake in the next 2 h (F(1, 55.6) = 25.7, p < 0.001, ω2 = 0.30; Figure 2E; Table S8). Strengthening our findings, satiety and appetite ratings, instead of hunger, yielded congruent results (Tables S9 and S10).
Figure 2.

Uridine regulates hunger and food intake in a feedback loop under physiological conditions (study [1 g], placebo)
(A–C) Lines and error bars represents the mean and SEM, respectively.
(A) Blood uridine level as a function of time. Lighter colors represent later time points. Statistics correspond to post-hoc comparisons between time points (Table S35).
(B) Hunger ratings as a function of time. Purple points represent average ratings for the half of the participants with the highest (dark) or lowest (light) circulating uridine levels at each time point (median split). Statistics correspond to the main effect of uridine on hunger (Table S5).
(C) Caloric intake in each time bin. Green points represent average intake for the half of the participants with the highest (dark) or lowest (light) hunger ratings at the beginning of the time bin. Statistics correspond to the main effect of hunger on food intake (Table S8).
(D–F and H–J) Thin blue lines are the best linear fit for each time point (same color code as for data points and in A). Yellow lines represent the linear fit across all timepoints, i.e., for the whole time span of the buffet. All p values correspond to the main effect of the variable in the x axis on the variable in the y axis (see supplemental tables for details).
(D) Effect of blood uridine levels on hunger. Higher uridine levels predicted higher hunger ratings at the same time point (Table S5).
(E) Effect of hunger on food intake. Higher hunger levels predicted higher food intake in the next 2 h (Table S8).
(F) Effect of blood uridine levels on food intake. Higher uridine levels predicted higher food intake in the next 2 h (Table S6).
(G) Graphical representation of the mediation analysis uridine → hunger → following food intake (Table S7). Top left arrow represents the influence of uridine (dependent variable) on hunger ratings (mediator). Top right arrow represents the influence of hunger ratings on following food intake (independent variable), controlling for uridine. Bottom arrow represents the effect of uridine on following food intake either overall (total effect, values above) or once removed the effect mediated by hunger (direct effect, values below in parentheses). Values correspond to the standardized effect size and the sign, the direction of the effect. Global statistics on top quantify the relative size and significance of the mediation itself (difference between the total and direct effect).
(H) Effect of food consumed within 2 h on the change of blood uridine levels ( uridine = uridine after – uridine before). Higher amount of consumed kcal predicted a stronger decrease in blood uridine concentrations (Table S12).
(I) Effect of the change in uridine concentration on the change of hunger level ( hunger ratings = hunger rating after – hunger rating before). A stronger drop in uridine levels predicted a stronger post-prandial decrease in hunger ratings (Table S13).
(J) Effect of consumed food within 2 h on the change of hunger ratings. Higher amount of consumed kcal predicted a stronger decrease in hunger ratings (Table S11).
(K) Graphical representation of the mediation analysis consumed food → uridine → hunger ratings (Table S14), similar to (G).
Uridine has been evidenced to regulate food intake in rodents by increasing central UDP to activate AgRP neurons in the arcuate nucleus of the hypothalamus (ARH), known to control intake behavior.6 Interestingly, uridine’s effect is conveyed via the control of the subjective sensation of energy need as reflected by the modulation of hunger, satiety, and appetite ratings. More importantly, our experimental design allows us to demonstrate the dynamic nature of this regulatory signal: as time progresses, uridine levels dynamically adapt to caloric intake (see below), thus modulating participants’ physiological state perception (hunger, satiety, and appetite ratings) and therefore their food ingestion. Uridine hence closely and continuously resembles caloric intake.
In addition to this short-term influence, we also tested if uridine levels could serve as a long-term predictor of energy intake and storage and, therefore, body composition. The narrow range of body mass index (BMI) of our participants (20–25 kg/m2) did not allow us to reveal a link between basal uridine levels (prior to the buffet) and body fat (Tables S10A and S10B). Basal uridine levels did not predict total caloric intake in the placebo condition either (Tables S10C and S10D). Together, these results hint that the dynamic regulation of uridine, rather than its basal levels, is determinant in the regulation of energy balance.
Food intake downregulates serum uridine and hunger
Next, we analyzed the inverse relationship, i.e., how food intake affects uridine levels, again under physiological conditions (study [1 g], placebo). Unsurprisingly, hunger ratings decrease as a function of calories ingested in the previous 2 h (F(1,60) = 54.3, p < 0.001, ω2 = 0.46; Figure 2I; Table S11). As demonstrated by Deng et al.,7 in overweight women, we here reproduce the finding that uridine levels decrease upon food ingestion in healthy-weight humans. Furthermore, we can show that the magnitude of the post-prandial uridine decline is directly proportional to the caloric load (F(1, 37.7) = 19.3, p < 0.001, ω2 = 0.32; Figure 2H; Table S12). Moreover, the decrease in hunger matches the amplitude of the drop in uridine levels (main effect: F(1, 36.4) = 18.4, p < 0.001, ω2 = 0.31; Figure 2I; Table S13), echoing our results above. Critically, the change in uridine mediates the negative effect of calories ingestion on hunger (c = 0.17, p = 0.034; Figure 2K; Table S14), indicating that blood uridine contributes to the regulation of hunger sensation following food intake. Again, using satiety or appetite ratings yielded congruent results (Tables S15 and S16).
In line with the results of Deng et al.,7 we demonstrate here that food intake reduces circulating uridine levels. This phenomenon is likely driven by the liver, which clears peripheral uridine via biliary excretion upon food.7 We further show that the rate of uridine clearance depends on the precise number of ingested calories. This finding indicates a tight bidirectional regulation between uridine levels and energy intake, suggesting an acting role for uridine in a feedback loop regulating energy levels in humans. It further raises the question of which type of macro- or micro-nutrients might specifically contribute to this regulation.
Oral UMP increases circulating uridine and potentiates hunger and food intake
We above established that, in physiological conditions, circulating uridine correlates with hunger sensation and subsequent food intake. To define the causal role of uridine and thus evaluate its potential relevance for the control of intake behavior, we orally administered to our study participants a single dose of the uridine precursor UMP (Pharma Waldhof, 98% purity, see supplemental information) before they engaged with an ad libitum buffet.
The oral supplementation of 0.5 g UMP (study [0.5 g]) significantly increased circulating uridine levels, preventing the initial post-prandial decline in serum uridine concentrations and stabilizing uridine at a high physiological level, above placebo values (time × intervention: F(1, 78.1) = 13.6, p < 0.001, ω2 = 0.24; intervention – placebo at t0: 0.11 ± 0.26 μM, p = 0.665, at t + 2 h: 2.04 ± 0.26 μM, p < 0.001, at t + 3.5 h: 1.11 ± 0.26 μM, p < 0.001; Figure 3A; Tables S17 and S18; see Figure S6 for intra-subject variability of uridine measurement). Notably, the drug effect did not depend on gender or body composition (all p > 0.222; Table S17).
Figure 3.

Effect of 0.5 g oral UMP on blood uridine, food intake, and hunger (study [0.5 g])
In all panels, placebo is indicated in blue and intervention (0.5 g UMP) in red. Lines and error bars represent the mean and SEM, respectively.
(A) Blood uridine levels over time for placebo and 0.5 g UMP conditions (Table S17).
(B) Food intake over time for placebo and 0.5 g UMP conditions separated for high and low fat-free body mass by a median split. Displayed values were corrected for confounds (fat mass and dinner size, sport, and late snacking the day prior to the testing day) by regressing out their effect beforehand. The p value corresponds to the intervention × fat-free mass interaction effect on the total food intake (Table S20).
(C) Increase in total food intake due to the intervention ( total food intake = total food intake under UMP – total food intake under placebo) as a function of fat-free body mass. The p value corresponds to the intervention × fat-free mass interaction term (Table S20).
(D) Hunger ratings over time for placebo and 0.5 g UMP conditions, corrected for the initial hunger (average ratings before the buffet) and separated for high and low fat-free body mass by median split. The p value corresponds to the intervention × fat-free mass interaction on total average corrected ratings (Table S19).
(E) Increase in average hunger ratings during the buffet due to the intervention ( hunger ratings = ratings under UMP – ratings under placebo) as a function of fat-free body mass. The p value corresponds to the intervention × fat-free mass interaction term (Table S19).
See also Figure S6.
Previous studies showed that lean mass is one of the main determinants of energy needs, hence caloric intake, in humans.18 Accordingly, food behavior in the placebo condition (study [0.5 g]) revealed that total food intake was strongly driven by lean mass (Pearson r = 0.71, p = 0.001, Figure 3B)—the participant with the highest lean mass ate 3.16 times more than the one with the smallest one. Based on this strong influence of lean mass on food behavior, we expected the effect of uridine to be potentiated by lean mass and therefore integrated this factor as a covariate in the follow up analyses.
Compared with placebo, UMP supplementation significantly increases, especially in participants with a higher lean mass, both hunger ratings (intervention: F(1,152.2) = 5.6, p = 0.019, ω2 = 0.03, intervention × fat-free body mass, F(1, 154.65) = 5.8, p = 0.017, ω2 = −0.03; Figures 3C and 3D; Table S19) and total food intake (intervention: F(1,16.2) = 4.04, p = 0.061, ω2 = 0.14, intervention × fat-free-body mass F(1, 15.9) = 5.5, p = 0.032, ω2 = 0.68; Figures 3E and 3F; Table S20). While we did not expect, based on our results in the placebo condition, that the effect of UMP would depend on the body composition, it should be noted that participants with a higher lean mass have larger energy needs and eat considerably more overall (F(1,13.2) = 32.9, p < 0.001, ω2 = 0.38; Table S20). It is therefore not surprising that participants with higher energy needs more readily increased their food intake when UMP application increased their uridine levels. Together, our results thus prove that circulating uridine promotes food intake and exerts feeding-regulatory effects in humans.
A single dose of oral UMP does not alter markers of the post-ingestive metabolic response
In order to further characterize the role of UMP supplementation and the ensuing increase in serum uridine levels in the control of food behavior, we assessed how our intervention affected multiple physiological markers of the metabolic response to food intake. As artificial elevation—especially in the long term—of uridine levels has been previously linked to alterations of glucose metabolism, leptin function, and amino acids levels,2 we focused our analyses on those particular metabolites.
In the study [0.5 g], all participants consumed the same standardized breakfast after receiving the drug or the placebo, allowing for direct comparison of their metabolic response across interventions. Concerning glucose metabolism, we first ensured that insulin resistance, as assessed by the homeostatic model assessment for insulin resistance (HOMA-IR), correlated with adiposity in our group (F(1,15) = 4.7, p = 0.047, ω2 = 0.18; Figure 4A; Table S21). As expected, we also found a transient increase in insulin levels (F(2,80) = 42, p < 0.001, ω2 = 0.5; Figure 4B; Table S22) as well as a drop in blood glucose (F(2,80) = 12.5, p < 0.001, ω2 = 0.22; Figure 4C; Table S23) 2 h after the initial food intake. Crucially, we found no evidence for an influence of UMP supplementation on neither insulin (all p > 0.633; Table S22) nor glucose (all p > 0.170; Table S23) post-prandial responses. Conforming its putative role as a long-term signal of energy reserve, fasting leptin levels displayed a typical exponential relationship with body adiposity (F(1,15) = 127.8, p < 0.001, ω2 = 0.88; Figure 4D; Table S24) and negatively correlated with total food intake (F(1,16.9) = 25.7, p < 0.001, ω2 = 0.58; Figure 4E; Table S25). We also observed a decrease in circulating leptin (F(2,80) = 5.7, p = 0.005, ω2 = 0.10; Figure 4F; Table S26) as was already observed after the ingestion of mixed meals containing lipids.19 Again, we found no evidence for any influence of UMP supplementation (all p > 0.150; Table S26). Finally, the analysis of amino acids levels revealed an overall tendency for a slight post-prandial increase (Figures 4G and S1; Table S27), although this effect, after correcting for multiple comparisons, only remained significant for alanine, asparagine, and proline (all p < 0.029, Bonferroni corrected). While few amino acids also showed a main effect of intervention, this trend was likely driven by a difference at baseline rather than a drug effect (no interaction with time) and did not remain significant after correction for multiple correction (Table S27).
Figure 4.

Metabolic profile of the participants in the study [0.5 g]
(A) Insulin resistance as measured by HOMA-IR = (fasting glucose [mg/dL] × fasting insulin [mU/L])/405 as a function of adiposity. Linear fit (Table S21).
(B and C) Serum insulin (B) and glucose (C) as a function of time. Statistics correspond to the post-hoc comparison between time points (Tables S22 and S23).
(D) Basal serum leptin increases exponentially as a function of adiposity. Statistics correspond to the fitted model: leptin ∼ + exp(∗bodyfat) (Table S24).
(E) Total food intake as a function of the (log−) basal serum leptin. Linear fit. (Table S25).
(F and G) Serum leptin (log scale) (F) and leucine (G) as a function of time. Statistics correspond to the post-hoc comparison between time points (Tables S26 and S27).
In all panels, placebo and intervention (0.5 g UMP) are shown in blue and red, respectively. Thin lines and error bars represent the mean and SE (B, C, F, and G) or the best fit (A, D, and E) for each session, thick black lines the grand average, and lighter colors mean later time points. The pill symbol with “n.s.” indicates the absence of any significant difference (main effect or interaction) between the UMP and the placebo conditions.
See also Figures S1–S3.
We performed precisely the same set of analyses in the study [1 g] to see if higher doses of UMP might be necessary to induce a change in the metabolic response of our participants. Bearing in mind the difference of experimental design (food intake was prolonged and might have differed between sessions), we found results congruent with the [0.5 g] study (Figures S2 and S3; Tables S28–S34). More precisely, we could qualitatively reproduce the expected basal and post-prandial signature of all our markers but found no significant effect of any kind relating to the UMP supplementation compared with placebo.
In summary, although we observed a typical dynamic post-prandial regulation of the investigated parameters in our groups of participants, we could not detect in either of our studies an influence of UMP administration on a selection of metabolic markers usually associated with uridine. It is therefore unlikely that the effect of UMP supplementation of food behavior we depicted in the previous section is mediated by those metabolites. While this negative result might seem at odd with previous literature in animals,7,20,21 those studies used much higher doses (one or two orders of magnitude more than in our studies) and/or reported effects only after repeated uridine administration over multiple days or weeks. Overall, our data suggest that while a single (low) dose of UMP, which elevates uridine within the physiological range, might not immediately alter glucose metabolism and leptin signaling, it can alter modulatory mechanisms of food intake that might contribute, in the long term, to metabolic dysregulation.
Supraphysiological concentrations of circulating uridine do not alter intake behavior
To further explore the pharmacological properties of UMP, we analyzed the participants’ intake behavior after a larger dose of the supplement (study [1 g]). The oral administration of 1 g of the drug largely and durably increased uridine levels compared with the placebo condition (time × intervention: F(2, 103.1) = 108.9, p < 0.001, ω2 = 0.67; Figure 5A; Tables S35 and S36). In particular, the uridine level reached a peak at 2 h (12.5 + 2.8), way outside the physiological range and around 4-fold higher than in the placebo condition.
Figure 5.

Effect of 1 g UMP on blood uridine and food intake (study [1 g])
In all panels, placebo is indicated in blue and intervention (1 g UMP) in red.
(A) Blood uridine levels over time for placebo and 1 g UMP (Table S21). Lines and error bars represent the mean and SEM, respectively.
(B) Food intake in each 2 h time bin as a function of uridine levels measured before the time bin. The yellow line represents the best quadratic fit across all time points and conditions; the p value refers to this quadratic effect (Table S25).
Again, the drug response does not depend on absolute body composition or gender (all p > 0.397; Table S35).
Applying the same analysis as for the 0.5 g dose regimen did not reveal any significant effect on hunger or food intake (Tables S37 and S38), hinting at a non-uniform role of blood uridine. Pooling data across time points and conditions, however, revealed that the relationship between uridine level and food intake in the ensuing 2 h followed a typical inverted U shape (quadratic effect, F(1,128.7) = 5.6, p = 0.021, ω2 = 0.03; Figure 5B; Table S39). Here, the threshold at which uridine starts to lose its influence on food intake is ∼8.50 μM, strikingly close to the maximum of the observed physiological range. Thus, while uridine levels indeed positively predict food intake when in the physiological range, this effect reverts when circulating uridine reaches larger values. Overall, our results demonstrate that the influence of uridine on intake behavior exhibits an inverted U-shape dose-response curve, suggesting that the capacity of UMP supplementation to exert its positive effect on caloric intake is limited by the otherwise tightly regulated physiological range of circulating uridine.
Our results evidence that uridine plays a relevant role in the control of food intake in humans. More precisely, circulating uridine implements a negative feedback loop contributing to the maintenance of energetic balance: when fasted, uridine levels are high and stimulate hunger and consequently food intake; when calories are ingested, its levels decline and thus reduce the sensation of hunger to limit caloric ingestion. These findings suggest that the reciprocal link between uridine and energy intake previously identified in murine models6,7 can be readily translated to humans. The fact that uridine participates in the short-term regulation of caloric intake raises the question of its role in the maintenance of body weight in the long term.
Obesity and insulin resistance are usually linked to chronically elevated uridine levels both in animals and humans, and the long-term administration of uridine is associated with the induction of metabolic disorders.16,20 In contrast to this steady-state association, we do not find a direct link between acute UMP administration and insulin or leptin dynamics; instead, we reveal the importance of the dynamical modulation of uridine levels by energy intake to control food intake. Interestingly, a high-fat diet blunts such uridine fluctuations induced by fasting-refeeding in wild-type mice.7 Moreover, obesity is connected to a disruption of the post-prandial decrease in blood uridine concentrations not only in mice7 but also in humans with BMIs >50 m/kg2.17 Overall, these impairments in blood uridine control in obesity suggest that the integrity of the uridine modulatory mechanisms by food intake might be necessary to sustain a healthy energy balance in the long run.
By demonstrating the importance of uridine dynamics for the regulation of food intake in humans, our results accentuate the need to further disentangle the mechanisms governing uridine levels in humans and provide the impetus for additional research addressing its role in body weight control and obesity. Other physiological pathways potentially modulated by uridine, like fatty acids or mitochondrial function, are particularly enticing avenues of investigation.
Conclusion
Using two interventional studies, we demonstrate that serum uridine (1) adapts dynamically to caloric intake, operating as a negative feedback loop controlling caloric ingestion, and (2) can be stimulated by acute oral administration of UMP to boost—when in the physiological range—both hunger and food intake without acutely altering glucose metabolism or leptin signaling. Collectively, our results evidence the relevance of uridine in the stimulation of food intake in humans. Although numerous challenges still need to be addressed—untangling the relative role of basal versus dynamically changing levels of uridine, for instance—this pathway emerges as a promising therapeutic target for treating general dysfunctions of human intake behavior.
Limitations of the study
A limitation of our study may be its small sample size and the lack of prospective registration, which was not requested by the ethical board of the University of Cologne at the time they reviewed the study plans. Additional larger, prospectively designed studies are needed to confirm our results. Furthermore, a shortcoming in the estimation of participants’ metabolic needs relates to our data being solely based on body composition. Indirect calorimetry accounting for measurements of respiratory gas exchange would be better suited to assess metabolic rate. Finally, to initially define a function of circulating uridine in control of food intake in humans, we so far only measured the consequences of a single dose of UMP on food behavior, leaving open the question of the effect of UMP supplementation in the long term.
STAR★Methods
Key resources table
| REAGENT or RESOURCE | SOURCE | IDENTIFIER |
|---|---|---|
| Chemicals, peptides, and recombinant proteins | ||
| Uridine-5′-Monophosphoric Acid, Disodium (5′-UMP, Na2) | pharmaWaldhof | Product code 2432 CAS No. 3387-36-8 |
| Critical commercial assays | ||
| Ultrasensitive Insulin ELISA (Human) | DRG Diagnostics GmbH | Cat# EIA-2337 |
| Leptin ELISA (Human) | DRG Diagnostics GmbH | Cat# EIA-2395 |
Resource availability
Lead contact
Further requests for information should be directed to and will be answered by Prof. Dr. Marc Tittgemeyer, Max-Planck-Institute for Metabolism Research, Gleueler Str. 50, 50931 Cologne, Germany marc.tittgemeyer@sf.mpg.de.
Materials availability
This study did not generate new unique reagents.
Experimental model and subject details
Human participants
All participants (Study [1 g]: n = 22, BMI 22.6 kg/m2 (±0.5), age 24.1 (±0.6) years; Study [0.5 g]: n = 17, BMI 22.7 kg/m2 (±0.4), age 25.1 (±0.9) years, Table 1) were recruited from a preexisting database maintained at the Max-Planck-Institute for Metabolism Research. Healthy, non-smoking volunteers of normal weight (BMI 20–25 kg/m2) and between the age of 18–39 years without any history of neurological, psychiatric, metabolic, or eating disorders were invited to participate in the study. We excluded volunteers on special diets, or with any known food allergy and food sensitivities such as gluten or lactose intolerance. Dysphagia and acute diseases, e.g. common cold, affecting food intake were also reasons for exclusion. The local ethics committee of the Medical Faculty of the University of Cologne approved the study (Cologne, Germany; No. 15–096). All subjects gave written informed consent to participate in the study prior to any study-related activities. Participants received an expense allowance of 10 Euros/hour. They were also informed after the second testing day about the measurement of their food intake.
Study design
This study comprised two separate studies, which were each set up as a monocentric, within-subject (cross-over), double-blinded, controlled interventional studies each comprising of two testing days. On one of the testing days, participants received either 0.5 g or 1 g of the food supplement Uridine-5′-Monophosphoric Acid, Disodium (UMP; Pharma Waldhof GmbH, Düsseldorf, Germany; 98% purity measured by HPLC according to product specification sheet) dissolved in 0.2L of orange juice (Orangensaft Rewe Beste Wahl); on the other testing day, orange juice was served pure as the placebo control condition. The order of the conditions was balanced across participants by pseudo randomization. Testing days were at least 48 h apart to ensure sufficient washout time between both interventions as based on pharmacokinetics of oral uridine supplementation.22
Study [0.5 g]
Participants arrived fasted (since 10 p.m. the night before) at the testing site at 8 a.m. and a baseline blood sample was taken. They then received a standardized breakfast (686 kcal) along with the UMP/placebo juice. Next, the body composition was analyzed on an impedance scale (see below) and participants were asked to fill in a general questionnaire about their activities the day preceding the testing day. Further blood samples were taken after 2 h (10.00 a.m.) and 3.5 h (11:30 a.m.). A personal buffet, from which participants could serve themselves ad libitum, was served at 11:30 a.m. and refilled every 1.5 h until 17:30 p.m. Each refill was done by taking all the dishes away from the experimental room and bringing them back full, which gave the opportunity to measure the amount of food missing out of view from the subject. Participants were asked to rate their state (hunger, warm/cold; see below) on a continuous visual analogue scale (VAS, see below) at 8 a.m., 10 a.m., and every 1.5 h from 11:30 a.m. onwards. Behavioral tasks lasting 15 min were used as a distraction at 11:15 a.m., 12:30 p.m., 2 p.m., and 3:30 p.m. The experiment ended at 17:30 p.m. with a short debriefing (Figure 1B).
Study [1 g]
The second study followed the same general structure with some variations. As for study [0.5 g], participants arrived fasted at the testing site at 8 a.m. After the baseline blood sample, previous activity questionnaire, and the body composition measurement, participants were incited to drink a glass of orange juice, either pure or containing the 1 g dose UMP, and directly accessed the personal buffet. Further blood draws followed after 2 h (10 a.m.) and 4 h (12 a.m.). Participants rated their state on a VAS scale every hour, while food intake was measured every 2 h. The experiment ended at 2 p.m. with a short debriefing (Figure 1A).
Method details
State ratings
Continuous 100 mm visual analogue scales (VAS) were used to assess internal state ratings as previously described by Wewers and Lowe 1990.23 The left anchor (0 mm) representing a low extreme value (e.g. “gar nicht hungrig”, i.e. “not hungry”) and the right anchor (100 mm) representing the high extreme value (e.g. “sehr hungrig”, ie. “extremely hungry”). Participants were asked to indicate their perceived internal state by drawing a straight line on the scale, between the two anchors.
Apart from hunger, satiety, and appetite ratings, the VAS evaluation contained other states both as controls and to disperse the attention away from food intake, namely: Study [0.5 g] stressed, relaxed, tired, energetic, thirsty, bored, cold, able to concentrate, awake, warm, annoyed; Study [1 g] feeling good, bored, cold, warm, thirsty, relaxed, stressed, tired.
Questionnaires
Entry
At the beginning of each testing day, participants provided their activities on the day before.
In study [0.5 g], this activity questionnaire covered meals (dinner and food intake after dinner), alcohol consumption, and sport the day prior to the testing day, as well as physical activity when reaching the testing site. In study [1 g], the questionnaire was identical to study [0.5 g], except meals questions concerned breakfast, lunch, dinner, and snacks, and also included an evaluation of the stress level.
Debriefing
In a second questionnaire (debriefing), participants were asked to report about their planned activities and their food intake behavior.
In study [0.5 g], participants were asked if they thought they had received UMP or placebo, what their evening plans were, and the activities they engaged with during the testing period. The questionnaire of the second testing day also enquired of the participants if their evening plans affected their food intake during the experiment and if they had noticed that their food intake had been measured.
In study [1 g], the debriefing questionnaire was handed out at the end of the second measurement day only. Participants were asked to rate the buffet and to indicate reasons for their food intake (such as hunger, appetite, boredom) on both testing days.
English translations of all questionnaires can be found in the supplemental material.
Buffet, standardized breakfast, and food intake measuring
In both studies, participants were housed in separate rooms, without direct social interaction. Each participant was served an individual buffet, consisting of typical meal options in Germany, from which they were allowed to serve themselves ad libitum. In order to measure the actual food intake, the buffet refill was performed in absence of the participant allowing the experimenters to weigh (study [0.5 g]) or count (study [1 g]) each food item without the participant’s knowledge.
Study [0.5 g]
The study with 0.5 g of UMP study started with a standardized breakfast (Table S3). Later, the participant accessed a buffet consisting of warm (vegetarian or meat ravioli, depending on the participant’s preference) and cold (rice pudding, sour cherries, and a cinnamon-sugar-mixture) dishes (see Table S4 for details), and included four 1-L bottles of mineral water with the option of refill. The buffet was refilled every 1.5 h between 11:30 a.m. until 5:30 p.m. Prior to the experiment, participants underwent a pretesting procedure during which they rated all food items on a scale from 1 to 10. Only subjects who rated the main dishes (ravioli and rice pudding) above average were included in the study.
Study [1 g]
In the study with 1 g of UMP, the buffet consisted of a selection of cold dishes and drinks (Table S2). Food intake was measured every 2 h between 8 a.m. and 2 p.m. by counting the missing items. No breakfast was served prior to the buffet.
Blood draws and analyses
Study [0.5 g]
Blood samples were taken at 8:00 a.m., 10:00 a.m. and 11:30 a.m. using an S-Monovette with Lithium-Heparin-Gel (SARSTEDT AG & Co. KG, Nuembrecht, Germany). Blood samples were centrifuged (1200 g, 10 min at 4°C), plasma was aliquoted and frozen at-20° and then −80C until further processing.
Study [1 g]
Blood samples were taken at 8:00 a.m., 10:00 a.m., and 12:00 p.m. using an S-Monovette with Lithium-Heparin-Gel (SARSTEDT AG & Co. KG, Nuembrecht, Germany). Blood samples were centrifuged (1200 g, 10 min at 4°C), serum was aliquoted and frozen at −20° and then - 80C until further processing.
Glucose measurement
Serum glucose levels were measured by the Clinical Chemistry Department of the University Hospital Cologne applying an optometric procedure.
Insulin and leptin measurements
Human insulin and leptin concentrations after placebo or Uridine treatment were determined according to the manufacturer’s (DRG International, Inc.) kit instructions, using an ultrasensitive insulin (EIA-2337) and leptin sandwich ELISA (EIA-2395) assays respectively. For insulin measurements, 5 μL of serum samples were diluted 1:5 using calibrator 0 provided in the kit. Briefly, samples were incubated on a plate shaker (700–900 rpm) for an hour at RT with 100 μL of enzyme conjugate. Samples were then washed and incubated in 200 μL of substrate TMB for 30 min at RT. Finally, 50 μL of stop solution was added to each sample and read at 450 nm using a spectrophotometer. For leptin measurements, serum samples were undiluted. Samples were incubated with assay buffer provided in the kit for 2 h at RT. 100 μL of antiserum was added to each sample and incubated for 30 min at RT. Further, 100 μL of enzyme complex was added to each sample and incubated for 30 min at RT. 100 μL of substrate solution and incubated for 15 min at RT. Finally, 50 μL of stop solution was added to each sample and read at 450 nm using a spectrophotometer.
A standard curve is constructed for each ELISA by plotting the absorbance (Y axis) obtained from each standard against its concentration absorbance value (X axis). Serum insulin and leptin concentrations were determined using the absorbance value and the corresponding concentration from the standard curve.
Sample preparation for uridine measurement
Study [0.5 g]
For each plasma sample, an aliquot of 50 μL was extracted in 850 μL of pre-cooled (−20°C) extraction buffer (UPLC-grade actonitrile:methanol:water [40:40:20 v/v]), which was spiked with 50 ng/mL uridine d2 as an internal standard. The sample was immediately vortexed until the plasma was homogenously suspended and samples were incubated for 30 min on an orbital mixer at 4°C and 1500 rpm, before sonicating them for 10 min in an ice-cooled bath-type sonicator. After sonication samples were centrifuged for 10 min at 21.100 × g at 4°C and the cleared supernatant was transferred to fresh 1.5 mL Eppendorf tubes and concentrated to dryness using a Speed Vac concentrator (www.eppendorf.com).
Parallel to the analytical samples, we prepared reference samples which were essentially extracted as described above. These reference samples contained 50 μL of plasma, which were differentially spiked with distinct concentrations of the internal standard (uridine d2 calibration curve).
Study [1 g]
Serum was deproteinized as follows: ice-cold perchloric acid (final concentration of 0.5 M) was added to the serum followed by a 5 min incubation on ice. Following centrifugation (13,000 g, 2 min at 4°C), the supernatant was collected and subjected to additional centrifugation (13,000 g, 2 min at 4°C). Supernatants were kept at −20°C followed by immediate use for Ultra Performance Liquid Chromatography (UPLC) analysis.
Ultra-performance liquid chromatography (UPLC) for uridine measurement
The standard curve is depictured in Figure S4.
Study [0.5 g]
For the mass spectrometric analysis of plasma uridine levels and the uridine d2 standard, the concentrated metabolite pellet was re-suspended in 50 μL of UPLC grade water. 5 μL of the cleared supernatant of the re-suspended samples was analyzed on a UPLC (Acquity iClass, Waters), using a HSST3 (100 × 1.0 mm column with 1.8 μm particle size, Waters) connected to a Xevo TQ-S (Waters) triple quadrupole mass spectrometer.
The flow rate was set to 100 μL/min of buffer A (0.1% formic acid in UPLC grade water) and buffer B (0.1% formic acid in UPLC-grade acetonitrile) using the following gradient: 0–1 min 99–90% A; 1–5 min 90–50% A; 5–6.5 min 50–1%A; 6.6–7.5 min 1% A; 7.5–7.7 min 1–99% A. The column was re-equilibrated at 99% A for an additional 3.3 min.
The eluting metabolites were detected in positive ion mode using MRM (multi reaction monitoring) applying the following settings: capillary voltage 2.0 kV, desolvation temperature 550°C, desolvation gas flow rate 800 L/h, cone gas flow 150 mL/min, collision cell gas flow 0.15 mL/min. The following MRM transitions were used for relative compound quantification of uridine and uridine d2, respectively: m/z precursor mass (M + H+) 245/247, fragment mass (M + H+) m/z 113/115 using a cone voltage of 26/6V and a collision energy of 16/10V. For confirmation purpose of the analyzed compound an additional transition of the precursor mass (M + H+) m/z 245/247, fragment mass (M + H+) m/z 133/98 using a cone voltage of 26/6 and a collision energy of 16/32 was analyzed. Data analysis, peak integration, and compound quantification were performed using the ‘TargetLynx’ Software (Waters™).
Study [1 g]
For absolute quantification of serum uridine concentrations an Acquity UPLC iClass System (Waters) connected to a Xevo TQ-S (Waters) was used. Samples were separated on an Acquity BEH C18 column (Waters) 50 × 2.1 mm × 1.7 μm column at 25°C. Solvent A was 5 mM ammonium, 0.15% formic acid in UPLC-grade water (Sigma-Aldrich), while solvent B consisted of acetonitrile (VWR). The samples and the standards were injected with 1 μL per sample. The separation was performed using a linear gradient from 98% to 90% A in 2.5 min using a flow rate of 300 μL/min. After this short gradient, the column was washed composition at 0% A from 2.5 min to 3 min, before re-equilibrating the column for 2 min at 98% A. The sample manager was set to 8°C and the TQ-S MS was operated in positive MRM mode. The source temperature was set to 150°C, the dissolving temperature was 550°C, and dissolving gas was set to 800 L/h, cone gas to 150 L/h. The following MRM transitions were used for uridine m/z 244.84 to 112.98 (quantifier), m/z 244.84 to 132.94 (qualifier) in both cases the gases were set to collision 16V and cone 26V. Quantification of the uridine levels was performed using, as described in the 0.5 g study, using ‘TargetLynx’ (Waters™). The calibration standards were freshly prepared before injection into solvent A.
Semi-targeted liquid chromatography-high-resolution mass spectrometry-based (LC-HRS-MS) analysis of amino acids in serum
Amino acid levels of all timepoints were assessed using LC-HRMS. We measured levels of alanine, arginine, asparagine, aspartic acid, cysteine, glutamic acid, glutamine, glycine, histidine, isoleucine, leucine, lysine, methionine, phenylalanine, proline, serine, threonine, tryptophane, tyrosine and valine.
The LC-HRMS analysis of amino acids was performed using an adapted benzoylchlorid-based derivatisation method.24
In brief: The polar fraction of the metabolite extract was re-suspended in 150 μL of LC-MS-grade water (Optima-Grade, Thermo Fisher Scientific) and incubated at 4°C for 15 min on a thermomixer. The re-suspended extract was centrifuged for 5 min at 16.000 × g at 4°C and 50 μL of the cleared supernatant were mixed at RT in an auto-sampler vial with 25 μL of 100 mM sodium carbonate (Sigma), followed by the addition of 25 μL 2% [v/v] benzoylchloride (Sigma) in acetonitrile (Optima-Grade, Thermo Fisher Scientific).
For the LC-HRMS analysis, 1 μL of the derivatized sample was injected onto a 100 × 2.1 mm HSS T3 UPLC column (Waters). The flow rate was set to 400 μL/min using a binary buffer system consisting of buffer A (10 mM ammonium formate (Sigma), 0.15% [v/v] formic acid (Sigma) in LC-MS-grade water (Optima-Grade, Thermo Fisher Scientific). Buffer B consisted of acetonitrile (Optima-grade, Thermo Fisher-Scientific). The column temperature was set to 40°C, while the LC gradient was: 0% B at 0 min, 0–15% B 0- 4.1 min; 15–17% B 4.1–4.5 min; 17–55% B 4.5–11 min; 55–70% B 11–11.5 min, 70–100% B 11.5–13 min; B 100% 13 - 14 min; 100–0% B 14–14.1 min; 0% B 14.1–19 min; 0% B. The mass spectrometer (Orbitrap Q-Exactive Plus, Thermo Fisher Scientific) was operating in positive ionization mode recording the mass range m/z 100–1000. The heated ESI source settings of the mass spectrometer were: Spray voltage 3.5 kV, capillary temperature 300°C, sheath gas flow 60 AU, aux gas flow 20 AU at a temperature of 340°C and the sweep gas to 1 AU. The RF-lens was set to a value of 60. Semi-targeted data analysis for the samples was performed using the ‘TraceFinder’ software (Version 4.1, Thermo Fisher Scientific). The identity of each compound was validated and normalized using U-13C15N labeled amino acids (MSK_A2-1.2, Cambridge Isotope Laboratories), which were added as internal standards during the metabolite extraction. Peak areas of [M + nBz + H]+ ions were extracted using a mass accuracy (<5 ppm) and a retention time tolerance of <0.05 min.
Body composition
Body composition was analyzed using the SECA medical Body Composition Analyzer 515 (mBCA 515). Output measures included lean body mass in kg and percent, fat mass in kg and percent, BMI, visceral fat in liters, intra- and extracellular water content. To ascertain the quality of the body composition analysis, the output of the mBCA 515 was first evaluated against whole body fat MRI measurements (for details see Figure S5).
Evaluation of impedance scale against whole body MRI
We evaluated our impedance scale (seca medical Body Composition Analyzer 515, mBCA 515) against a whole-body MRI-measurement to ensure reliable estimation of the body composition, in particular percentage of lean and fat mass.
The whole-body MRI was performed on a 3T MAGNETOM Prisma (Siemens, Healthcare, Erlangen, Germany) with a gradient of 80 mT/m and a rate of up to 200T/m/s. A VIBE-sequence was used with a multi-station procedure, in which the whole-body volume was split into several partial volumes, which were measured after each other and recomposed afterward. Each partial volume comprised 60 transversal slices. For most participants, 10 partial volumes were required. The protocol of the whole-body scan comprised.
| voxel size in mm | 1.6 ×. 1.6 × 3 |
|---|---|
| matrix size in pixle | 320 × 312 |
| Repetition time in ms | 4 |
| Echo time in ms | 1.23/2.46 |
| Flip angel in ° | 9 |
| Bandwidth in Hz/Pixel | 820 |
| Measuring time in min | 15 |
We applied a linear regression model to test the amount of variance in MRI whole body fat percentage measurements explained by fat percentage measurements on the mBCA 515 (see Figure S2).
WB = whole body
The high coefficient of determination r2 = 0.935 indicated that the impedance scale mBCA 515 can be used as reliable alternative to assess body composition.
Quantification and statistical analysis
Data were analyzed using RStudio version 1.4.171725; and R version 4.0.0.26; Repeated measures analyses were implemented as mixed effect models and fitted via REML maximization using R’s ‘blme’ version 1.0–527; or ‘lmer4’ version 1.1–2128; package in case of convergence problem. Significance was tested via type III analyses of variance (ANOVAs) using the ‘lmerTest’ package version 3.1-0.29; We used so called ‘sum contrasts’ to guarantee the interpretation of main effects in the presence of interaction. Effect sizes were calculated using the package ‘effectsize’ version 0.4.5.30; Analyses without repeated measures were implemented as linear models and significance was tested via type III ANOVAs using the ‘car’ package version 3.0–3.31; Mediation analyses were performed using the ‘mediation’ package version 4.5.0.32; All post-hoc analyses were performed with R’s ‘emmeans’ package (version 1.6.0; https://CRAN.R-project.org/package=emmeans) using Sidak’s correction for multiple comparison or Bonferroni correction if indicated as such. Statistical significance was reported at a level of p < 0.05. In order to avoid overfitting, the influence of confounding factors was tested first and only trending (p < 0.10) were included in subsequent analyses. For all analyses, we report in the Supplementary Material the formula of the model using the Wilkinson notation in addition to the degrees of freedom, F values, and significance of the respective regressors.
Additional resources
The study was registered in the German Clinical Trials Register (DRKS, Deutsches Register Klinischer Studien), registration number DRKS00014874 (https://drks.de/search/en/trial/DRKS00014874). In addition, our study has been reported in clincialsite.org (SMS) with the ID 2683.
Acknowledgments
We highly appreciate the technical assistance of Elke Bannemer and Patrick Weyer. We are also grateful to Bertram Huth for his support with graphical illustrations and to Univ. Prof. Dr. Uwe Fuhr (University of Cologne, Faculty of Medicine and University Hospital Cologne, Institute of Pharmacology, Cologne, Germany) for allowing us to use his research facility unit. For this study, S.M.S., J.C.B., and M.T. are supported by funding from the German Centre for Diabetes Research (DZD) – Project IDs 82DZD00502, 82DZD03C2G, 82DZD03C3G, and, 82DZD05C1G, as well as by the Deutsche Forschungsgemeinschaft (DFG; German Research Foundation) under Germany’s Excellence Strategy – EXEC 2030–390661388. M.T. furthermore receives funding from the Deutsche Forschungsgemeinschaft (DFG) – Project ID 431549029 – SFB 1451.
Author contributions
All authors contributed to the work presented in this paper. M.T., J.C.B., R.H., L.R., and S.M.S. conceptualized the study; the experimental setup was designed by M.T., R.H., and J.C.B. Data acquisition was performed by R.H., A.C.K., and K.A. Statistical analyses were performed by L.R. and R.H.; ultra-performance liquid chromatography (UPLC) was performed by Y.H. and P.G. and further measurements of blood values by W.C. The manuscript was written by R.H., L.R., and M.T. Required infrastructure was provided, set up, and controlled by S.E.T. The supervision of the study was performed by M.T., O.A.C., and J.C.B.
Declaration of interests
O.A.C. reports grants or contracts from Amplyx, Basilea, BMBF, Cidara, DZIF, EU-DG RTD (101037867), F2G, Gilead, Matinas, MedPace, MSD, Mundipharma, Octapharma, Pfizer, and Scynexis; consulting fees from Amplyx, Biocon, Biosys, Cidara, Da Volterra, Gilead, Matinas, MedPace, Menarini, Molecular Partners, MSG-ERC, Noxxon, Octapharma, PSI, Scynexis, and Seres; honoraria for lectures from Abbott, Al-Jazeera Pharmaceuticals, Astellas, Grupo Biotoscana/United Medical/Knight, Hikma, MedScape, MedUpdate, Merck/MSD, Mylan, and Pfizer; payment for expert testimony from Cidara; participation on a data safety monitoring board or advisory board from Actelion, Allecra, Cidara, Entasis, IQVIA, Janssen, MedPace, Paratek, PSI, and Shionogi; a pending patent from the German Patent and Trade Mark Office; and other interests from DGHO, DGI, ECMM, ISHAM, MSG-ERC, and Wiley.
Inclusion and diversity
We support inclusive, diverse, and equitable conduct of research.
Published: January 17, 2023
Footnotes
Supplemental information can be found online at https://doi.org/10.1016/j.xcrm.2022.100897.
Supplemental information
Data and code availability
Raw data reported in this paper will be shared by the lead contact upon request. The request necessitates that the purpose of data re-analysis is in line with the study aims as approved by the ethics review board (see text) and participants consent. Furthermore, consent to data privacy needs to be assured by signing an agreement form accordingly. This paper does not report original code. Any additional information required to reanalyze the data reported in this paper is available from the lead contact upon request.
References
- 1.Connolly G.P., Duley J.A. Uridine and its nucleotides: biological actions, therapeutic potentials. Trends Pharmacol. Sci. 1999;20:218–225. doi: 10.1016/s0165-6147(99)01298-5. [DOI] [PubMed] [Google Scholar]
- 2.Zhang Y., Guo S., Xie C., Fang J. Uridine metabolism and its role in glucose, lipid, and amino acid homeostasis. BioMed Res. Int. 2020;2020:7091718. doi: 10.1155/2020/7091718. [DOI] [PMC free article] [PubMed] [Google Scholar]
- 3.Yamamoto T., Koyama H., Kurajoh M., Shoji T., Tsutsumi Z., Moriwaki Y. Biochemistry of uridine in plasma. Clin. Chim. Acta. 2011;412:1712–1724. doi: 10.1016/j.cca.2011.06.006. [DOI] [PubMed] [Google Scholar]
- 4.Karle J.M., Anderson L.W., Erlichman C., Cysyk R.L. Serum uridine levels in patients receiving N-(phosphonacetyl)-L-aspartate. Cancer Res. 1980;40:2938–2940. [PubMed] [Google Scholar]
- 5.Traut T.W. Physiological concentrations of purines and pyrimidines. Mol. Cell. Biochem. 1994;140:1–22. doi: 10.1007/BF00928361. [DOI] [PubMed] [Google Scholar]
- 6.Steculorum S.M., Paeger L., Bremser S., Evers N., Hinze Y., Idzko M., Kloppenburg P., Brüning J.C. Hypothalamic UDP increases in obesity and promotes feeding via P2Y6-dependent activation of AgRP neurons. Cell. 2015;162:1404–1417. doi: 10.1016/j.cell.2015.08.032. [DOI] [PubMed] [Google Scholar]
- 7.Deng Y., Wang Z.V., Gordillo R., An Y., Zhang C., Liang Q., Yoshino J., Cautivo K.M., De Brabander J., Elmquist J.K., et al. An adipo-biliary-uridine axis that regulates energy homeostasis. Science. 2017;355:eaaf5375. doi: 10.1126/science.aaf5375. [DOI] [PMC free article] [PubMed] [Google Scholar]
- 8.Gasser T., Moyer J.D., Handschumacher R.E. Novel single-pass exchange of circulating uridine in rat liver. Science. 1981;213:777–778. doi: 10.1126/science.7256279. [DOI] [PubMed] [Google Scholar]
- 9.Deng Y., Wang Z.V., Gordillo R., Zhu Y., Ali A., Zhang C., Wang X., Shao M., Zhang Z., Iyengar P., et al. Adipocyte Xbp1s overexpression drives uridine production and reduces obesity. Mol. Metabol. 2018;11:1–17. doi: 10.1016/j.molmet.2018.02.013. [DOI] [PMC free article] [PubMed] [Google Scholar]
- 10.Larner J., Takeda Y., Hizukuri S. The influence of chain size and molecular weight on the kinetic constants for the span glucose to polysaccharide for rabbit muscle glycogen synthase. Mol. Cell. Biochem. 1976;12:131–136. doi: 10.1007/bf01741711. [DOI] [PubMed] [Google Scholar]
- 11.Alonso M.D., Lagzdins E.J., Lomako J., Lomako W.M., Whelan W.J. New and specific nucleoside diphosphate glucose substrates for glycogenin. FEBS Lett. 1995;359:110–112. doi: 10.1016/0014-5793(95)00018-5. [DOI] [PubMed] [Google Scholar]
- 12.Cansev M. Uridine and cytidine in the brain: their transport and utilization. Brain Res. Rev. 2006;52:389–397. doi: 10.1016/j.brainresrev.2006.05.001. [DOI] [PubMed] [Google Scholar]
- 13.Ipata P.L. Origin, utilization, and recycling of nucleosides in the central nervous system. Adv. Physiol. Educ. 2011;35:342–346. doi: 10.1152/advan.00068.2011. [DOI] [PubMed] [Google Scholar]
- 14.Steculorum S.M., Timper K., Engström Ruud L., Evers N., Paeger L., Bremser S., Kloppenburg P., Brüning J.C. Inhibition of P2Y6 signaling in AgRP neurons reduces food intake and improves systemic insulin sensitivity in obesity. Cell Rep. 2017;18:1587–1597. doi: 10.1016/j.celrep.2017.01.047. [DOI] [PubMed] [Google Scholar]
- 15.Jain S., Pydi S.P., Toti K.S., Robaye B., Idzko M., Gavrilova O., Wess J., Jacobson K.A. Lack of adipocyte purinergic P2Y6 receptor greatly improves whole body glucose homeostasis. Proc. Natl. Acad. Sci. USA. 2020;117:30763–30774. doi: 10.1073/pnas.2006578117. [DOI] [PMC free article] [PubMed] [Google Scholar]
- 16.Dudzinska W. Uridine correlates with the concentration of fructosamine and HbA1c in children with type 1 diabetes. Acta Paediatr. 2011;100:712–716. doi: 10.1111/j.1651-2227.2011.02146.x. [DOI] [PubMed] [Google Scholar]
- 17.Kohli R., Bhattacharjee J., Inge T.H. Post-prandial uridine physiology is altered by obesity. Gastroenterology. 2018;155:1645–1646. doi: 10.1053/j.gastro.2018.07.043. [DOI] [PMC free article] [PubMed] [Google Scholar]
- 18.Blundell J.E., Caudwell P., Gibbons C., Hopkins M., Näslund E., King N.A., Finlayson G. Body composition and appetite: fat-free mass (but not fat mass or BMI) is positively associated with self-determined meal size and daily energy intake in humans. Br. J. Nutr. 2012;107:445–449. doi: 10.1017/s0007114511003138. [DOI] [PubMed] [Google Scholar]
- 19.Larsen M.A., Isaksen V.T., Paulssen E.J., Goll R., Florholmen J.R. Postprandial leptin and adiponectin in response to sugar and fat in obese and normal weight individuals. Endocrine. 2019;66:517–525. doi: 10.1007/s12020-019-02102-9. [DOI] [PubMed] [Google Scholar]
- 20.Urasaki Y., Pizzorno G., Le T.T. Chronic uridine administration induces fatty liver and pre-diabetic conditions in mice. PLoS One. 2016;11:e0146994. doi: 10.1371/journal.pone.0146994. [DOI] [PMC free article] [PubMed] [Google Scholar]
- 21.Hawkins M., Angelov I., Liu R., Barzilai N., Rossetti L. The tissue concentration of UDP-N-acetylglucosamine modulates the stimulatory effect of insulin on skeletal muscle glucose uptake. J. Biol. Chem. 1997;272:4889–4895. doi: 10.1074/jbc.272.8.4889. [DOI] [PubMed] [Google Scholar]
- 22.Leyva A., van Groeningen C.J., Kraal I., Gall H., Peters G.J., Lankelma J., Pinedo H.M. Phase I and pharmacokinetic studies of high-dose uridine intended for rescue from 5-fluorouracil toxicity. Cancer Res. 1984;44:5928–5933. [PubMed] [Google Scholar]
- 23.Wewers M.E., Lowe N.K. A critical review of visual analogue scales in the measurement of clinical phenomena. Res. Nurs. Health. 1990;13:227–236. doi: 10.1002/nur.4770130405. [DOI] [PubMed] [Google Scholar]
- 24.Wong J.-M.T., Malec P.A., Mabrouk O.S., Ro J., Dus M., Kennedy R.T. Benzoyl chloride derivatization with liquid chromatography–mass spectrometry for targeted metabolomics of neurochemicals in biological samples. J. Chromatogr. A. 2016;1446:78–90. doi: 10.1016/j.chroma.2016.04.006. [DOI] [PMC free article] [PubMed] [Google Scholar]
- 25.R Studio Team . 2020. RStudio: Integrated Development Environment for R. [Google Scholar]
- 26.R Core Team . R Foundation for Statistical Computing; 2018. R: A Language and Environment for Statistical Computing. [Google Scholar]
- 27.Chung Y., Rabe-Hesketh S., Dorie V., Gelman A., Liu J. A nondegenerate penalized likelihood estimator for variance parameters in multilevel models. Psychometrika. 2013;78:685–709. doi: 10.1007/s11336-013-9328-2. [DOI] [PubMed] [Google Scholar]
- 28.Bates D., Mächler M., Bolker B., Walker S. Fitting linear mixed-effects models using lme4. J. Stat. Software. 2015;67:1–48. doi: 10.18637/jss.v067.i01. [DOI] [Google Scholar]
- 29.Kuznetsova A., Brockhoff P.B., Christensen R.H.B. lmerTest package: tests in linear mixed effects models. J. Stat. Software. 2017;82:1–26. doi: 10.18637/jss.v082.i13. [DOI] [Google Scholar]
- 30.Ben-Shachar M., Lüdecke D., Makowski D. Effectsize: estimation of effect size indices and standardized parameters. J Open Source Softw. 2020;5:2815. doi: 10.21105/joss.02815. [DOI] [Google Scholar]
- 31.Fox J., Weisberg S. Third Edition. Sage; 2019. An R Companion to Applied Regression. [Google Scholar]
- 32.Tingley D., Yamamoto T., Hirose K., Keele L., Imai K. mediation: R package for causal mediation analysis. J. Stat. Software. 2014;59 doi: 10.18637/jss.v059.i05. [DOI] [Google Scholar]
Associated Data
This section collects any data citations, data availability statements, or supplementary materials included in this article.
Supplementary Materials
Data Availability Statement
Raw data reported in this paper will be shared by the lead contact upon request. The request necessitates that the purpose of data re-analysis is in line with the study aims as approved by the ethics review board (see text) and participants consent. Furthermore, consent to data privacy needs to be assured by signing an agreement form accordingly. This paper does not report original code. Any additional information required to reanalyze the data reported in this paper is available from the lead contact upon request.