

To the Editors:
Coronavirus disease 2019 (COVID‐19) and the development of acute respiratory distress syndrome (ARDS) are often related to hospitalization and/or intensive care unit (ICU) admission, a context that leads to several sequelae. 1
We evaluated 172 critical COVID‐19 survivors and observed that 60.5% presented with poor sleep quality 3 months after hospital discharge, with a remarkable fragmentation of the circadian rest‐activity pattern, which was predicted by the use of invasive mechanical ventilation (IMV) during ICU stay. 2 Nevertheless, long‐term evaluations of sleep within this context are scarce and mainly based on self‐reported symptom questionnaires, while the assessment of circadian function is yet to be performed. 3 Hence, we aimed to investigate the sleep and circadian health of critical COVID‐19 survivors 6 months after hospital discharge. Additional analyses were also performed to identify possible predictors for sleep and circadian alterations at the 6‐month follow‐up and to evaluate possible correlations with mental health.
Consecutive patients were prospectively recruited during the ICU stay. The inclusion criteria comprised individuals more than 18 years old, who developed ARDS and had a confirmed diagnosis of severe acute respiratory syndrome coronavirus 2 (SARS‐CoV‐2) infection. A clinical evaluation was performed at the first and second medical appointments (3 and 6 months after hospital discharge), followed by subjective assessments of sleep (Pittsburgh Sleep Quality Index [PSQI] and Epworth Sleepiness Scale [ESS]). Additionally, the patients were randomly selected for objective evaluation of sleep and circadian rest‐activity pattern through the use of a wrist‐mounted actigraph (Actiwatch 2, Philips Respironics) for 7 days. Participants' mental health was assessed with the Hospital Anxiety and Depression Scale (HADS).
Absolute and relative frequencies describe qualitative data while means (SD) and medians (25th percentile; 75th percentile [p25; p75]) were estimated for quantitative variables with normal and non‐normal distributions, respectively. Changes between 3 and 6 months of follow‐up were evaluated using paired t‐test. Linear regression models were performed to identify baseline predictors (age, sex, BMI, comorbidities, time spent at the hospital, time spent in the ICU, IMV, noninvasive mechanical ventilation [NIMV], prone position and pharmacotherapy) of sleep quality (PSQI) and circadian function at the 6‐month follow‐up. Circadian function was represented by the interdaily stability (IS, indicates the synchronization between the endogenous rhythms and the external cues), intradaily variability (IV, indicates the fragmentation of the rhythms within each 24‐h period) and relative amplitude (RA, indicates the robustness of the rhythms). 4 The associations between sleep/circadian function and mental health were assessed using Pearson coefficient tests. R statistical software version 4.0.1 (R Foundation for Statistical Computing) was used for the analyses.
The cohort was composed of 145 patients (66.9% males), with a median [p25; p75] age of 62.0 [56.0; 68.0] years and a BMI of 29.3 [26.2; 33.0] kg m−2 (Table 1). The most frequent comorbidities were hypertension (53.8%) and obesity (44.4%). The median length of hospital stay was 24.0 [15.0; 38.0] days, from which 14.0 [6.00; 27.0] were spent in the ICU, and where 60.7% of the patients required IMV. The subset of 75 patients randomly selected for the objective evaluation presented similar characteristics. According to the PSQI, 48.3% of the cohort presented with poor sleep quality at the 6‐month follow‐up, which was confirmed by the objective analysis (Table 2). Sleep duration was the most affected component. Based on the ESS, 11.1% of the patients presented with daytime somnolence 6 months after hospital discharge. In relation to the circadian rest‐activity pattern, there was substantial variability among the sample, especially concerning the fragmentation of the rhythm.
TABLE 1.
Baseline characteristics of the cohort
| Global | With actigraphy | Without actigraphy | p‐value | |
|---|---|---|---|---|
| n = 145 | n = 75 | n = 70 | ||
| Sociodemographic data | ||||
| Sex, male | 97 (66.9%) | 50 (66.7%) | 47 (67.1%) | 1.000 |
| Age, years | 62.0 [56.0; 68.0] | 62.0 [55.0; 67.0] | 63.5 [56.5; 70.0] | 0.173 |
| BMI, kg m−2 | 29.3 [26.2; 33.0] | 30.2 [27.6; 34.7] | 28.1 [25.7; 31.2] | 0.017 |
| Habits | ||||
| Tobacco | 0.182 | |||
| Current | 4 (2.76%) | 1 (1.33%) | 3 (4.29%) | |
| Former | 71 (49.0%) | 42 (56.0%) | 29 (41.4%) | |
| Non‐smoker | 70 (48.3%) | 32 (42.7%) | 38 (54.3%) | |
| Chronic alcohol abuse | 0.356 | |||
| Current | 4 (3.03%) | 1 (1.43%) | 3 (4.84%) | |
| Former | 3 (2.27%) | 3 (4.29%) | 0 (0.00%) | |
| Non‐alcohol abuse | 125 (94.7%) | 66 (94.3%) | 59 (95.2%) | |
| Comorbidities | ||||
| Hypertension | 78 (53.8%) | 40 (53.3%) | 38 (54.3%) | 1.000 |
| Obesity | 64 (44.4%) | 39 (52.0%) | 25 (36.2%) | 0.083 |
| Diabetes mellitus | 37 (25.5%) | 18 (24.0%) | 19 (27.1%) | 0.808 |
| Asthma | 12 (8.28%) | 5 (6.67%) | 7 (10.0%) | 0.670 |
| COPD | 6 (4.14%) | 3 (4.00%) | 3 (4.29%) | 1.000 |
| Hospitalization | ||||
| Duration, days | 24.0 [15.0; 38.0] | 25.0 [14.5; 37.0] | 24.0 [15.0; 39.5] | 0.719 |
| Before ICU admission, days | 1.00 [0.00; 2.00] | 1.00 [0.00; 2.50] | 0.50 [0.00; 2.00] | 0.332 |
| After ICU discharge, days | 8.00 [5.00; 12.0] | 8.00 [5.00; 12.5] | 8.00 [5.25; 12.0] | 0.800 |
| ICU stay | ||||
| Duration, days | 14.0 [6.00; 27.0] | 13.0 [6.00; 26.0] | 14.0 [8.00; 26.8] | 0.304 |
| Procedures | ||||
| Mechanical ventilation | ||||
| Invasive | 88 (60.7%) | 41 (54.7%) | 47 (67.1%) | 0.172 |
| Days | 14.5 [8.00; 27.0] | 18.0 [11.0; 31.0] | 13.0 [7.00; 25.0] | 0.096 |
| Non‐invasive | 99 (68.3%) | 50 (66.7%) | 49 (70.0%) | 0.801 |
| Days | 3.00 [1.00; 5.00] | 3.00 [2.00; 5.00] | 3.00 [1.00; 5.00] | 0.747 |
| Prone position | 83 (57.6%) | 41 (55.4%) | 42 (60.0%) | 0.697 |
| Hours | 44.5 [24.0; 81.2] | 40.0 [21.2; 67.8] | 68.0 [29.0; 98.0] | 0.048 |
| Pharmacotherapy | ||||
| Antibiotics | 118 (84.9%) | 63 (86.3%) | 55 (83.3%) | 0.802 |
| Corticosteroids | 127 (90.1%) | 67 (90.5%) | 60 (89.6%) | 1.000 |
| Hydroxychloroquine | 48 (33.1%) | 30 (40.0%) | 18 (25.7%) | 0.099 |
| Interferon beta | 26 (19.7%) | 18 (25.7%) | 8 (12.9%) | 0.104 |
| Lopinavir/ritonavir | 47 (32.4%) | 29 (38.7%) | 18 (25.7%) | 0.137 |
| Remdesivir | 27 (18.6%) | 19 (25.3%) | 8 (11.4%) | 0.053 |
| Tocilizumab | 84 (57.9%) | 39 (52.0%) | 45 (64.3%) | 0.184 |
| Post‐COVID | ||||
| First visit, days | 96.0 [85.0; 107] | 96.5 [87.2; 108] | 96.0 [84.2; 106] | 0.878 |
| Second visit, days | 201 [186; 221] | 197 [185; 214] | 208 [186; 227] | 0.189 |
| Time between visits, days | 109 [91.0; 132] | 104 [91.0; 119] | 112 [97.2; 136] | 0.005 |
Note: Qualitative data are represented as n (%). The medians [p25; p75] were estimated for quantitative variables. Missings: antibiotics, 6; chronic alcohol abuse, 13; corticosterioids, 4; interferon beta, 13; obesity, 1; prone position, 1.
Abbreviations: COPD, chronic obstructive pulmonary disease; ICU, intensive care unit; n, number; p, percentile.
TABLE 2.
Sleep and circadian rest‐activity pattern
| Questionnaires | n = 145 |
|---|---|
| PSQI | 6.20 (4.25) |
| Good sleep quality | 75 (51.7%) |
| Poor sleep quality | 70 (48.3%) |
| Subjective sleep quality | 1.13 (0.78) |
| Very good | 27 (18.6%) |
| Fairly good | 80 (55.2%) |
| Fairly bad | 30 (20.7%) |
| Very bad | 8 (5.52%) |
| Sleep latency | 0.98 (1.02) |
| ≤15 min | 59 (40.7%) |
| 16–30 min | 47 (32.4%) |
| 31–60 min | 22 (15.2%) |
| >60 min | 17 (11.7%) |
| Sleep duration | 1.14 (1.08) |
| >7 h | 54 (37.2%) |
| 6–7 h | 38 (26.2%) |
| 5–6 h | 32 (22.1%) |
| <5 h | 21 (14.5%) |
| Sleep efficiency | 0.89 (1.07) |
| ≥85% | 72 (49.7%) |
| 75%–84% | 37 (25.5%) |
| 65%–74% | 16 (11.0%) |
| <65% | 20 (13.8%) |
| Sleep disturbance | 0.77 (0.64) |
| Not during past month | 50 (34.5%) |
| Less than once a week | 78 (53.8%) |
| Once or twice a week | 17 (11.7%) |
| Three or more times a week | 0 (0%) |
| Sleep medication intake | 0.77 (1.29) |
| Not during past month | 106 (73.1%) |
| Less than once a week | 2 (1.38%) |
| Once or twice a week | 2 (1.38%) |
| Three or more times a week | 35 (24.1%) |
| Daytime dysfunction | 0.52 (0.76) |
| Never | 90 (62.1%) |
| A few times | 37 (25.5%) |
| Sometimes | 15 (10.3%) |
| A lot of times | 3 (2.07%) |
| ESS | 5.61 (3.69) |
| Actigraphy | n = 75 |
|---|---|
| Total sleep time (TST), h | 6.98 [6.45; 7.66] |
| >9 h | 1 (1.33%) |
| 7–9 h | 36 (48.0%) |
| <7 h | 38 (50.7%) |
| Time in bed (TIB), h | 8.37 [7.49; 9.06] |
| Sleep efficiency (SE), % | 84.4 [79.5; 88.2] |
| ≥85% | 36 (48.0%) |
| 75%–84% | 30 (40.0%) |
| <75% | 9 (12.0%) |
| Latency, min | 12.0 [6.00; 21.5] |
| ≤30 min | 67 (89.3%) |
| 31–45 min | 3 (4.00%) |
| >45 min | 5 (6.67%) |
| Arousals, number | 23.2 [18.9; 29.5] |
| WASO, min | 48.0 [34.0; 62.5] |
| 0–20 min | 4 (5.33%) |
| 21–40 min | 21 (28.0%) |
| >40 min | 50 (66.7%) |
Note: Qualitative data are presented as n (%). The means (SD) and medians [p25; p75] were estimated for quantitative data with normal and non‐normal distributions, respectively.
Abbreviations: ESS, Epworth Sleepiness Scale; n, number; p, percentile; PSQI, Pittsburgh Sleep Quality Index; WASO, wake after sleep onset.
There was a slight improvement in sleep between the 3–6‐month follow‐ups, demonstrated by a mean (95% CI) change of −0.73 (−1.30 to −0.16) in the PSQI (Figure 1). Such improvement was higher among those patients who presented with poor sleep quality 3 months after hospital discharge, with a mean change of −1.71 (−2.59 to −0.82). No significant difference between the investigated time points was observed in relation to the ESS and the circadian rest‐activity pattern.
FIGURE 1.
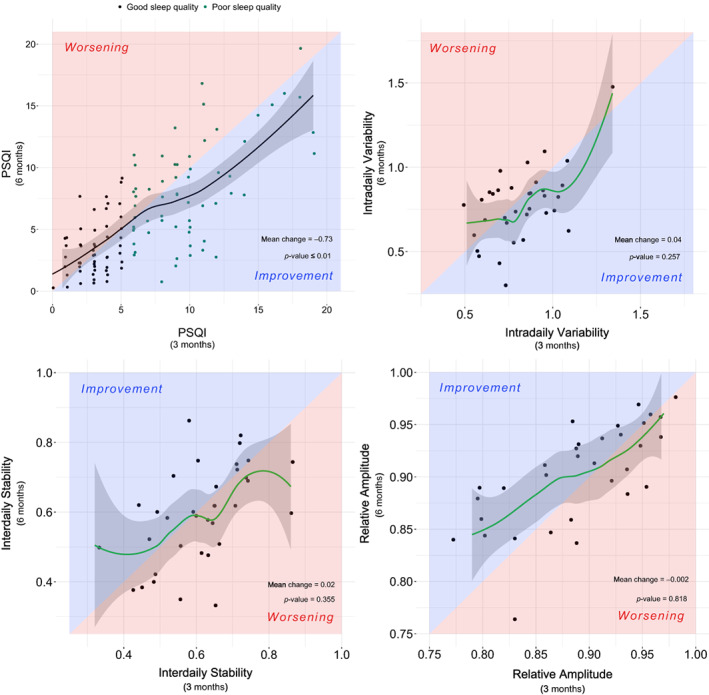
Evolution of sleep quality and circadian rest‐activity pattern between 3 and 6‐month follow‐up. The red background indicates worsening from 3 to 6‐month follow‐up and the blue background indicates an improvement between these time‐points. The black dots indicate good sleep quality (PSQI ≤ 5) at the 3‐month follow‐up while green dots indicate poor sleep quality (PSQI > 5) at the same time‐point. Only the patients with available data in both time‐points (3 and 6‐month follow‐up) were included in this analysis. The p‐value threshold defining statistical significance was set at <0.05. PSQI, Pittsburgh Sleep Quality Index
Additional analyses revealed that higher BMI at baseline was associated with worse sleep quality and increased fragmentation of the rest‐activity rhythm at the 6‐month follow‐up with effect sizes (SD) of 0.184 (0.082) (p < 0.05) and 0.252 (0.110) (p < 0.05), respectively. Similarly, time spent in hospital, time spent in the ICU and the use of IMV predicted an increased fragmentation of the rhythm with respective effect sizes of 0.536 (0.189) (p < 0.01), 0.271 (0.112) (p < 0.01) and 0.473 (0.228) (p < 0.05). Correlation analysis revealed a positive relationship between worse sleep quality and both symptoms of anxiety (r = 0.51) (p < 0.001) and depression (r = 0.57) (p < 0.001) at 6‐month follow‐up.
Previous studies reveal that COVID‐19 patients present with compromised sleep quality in the short term. 2 Nevertheless, long‐term evaluations within this context are scarce and no assessment of the circadian function has been performed. In non‐COVID‐19‐related ARDS survivors, short‐term poor sleep quality is also reported and the circadian rest‐activity pattern is remarkably unstable, fragmented and less robust compared to community‐dwelling adults. 5 , 6 To our knowledge, this is the first study presenting a proper characterization of sleep and circadian health of COVID‐19 patients in the long term, which is also relevant to long‐term evaluations of ARDS patients.
Our analysis showed that the BMI at baseline predicted both sleep quality and circadian health at the 6‐month follow‐up. Obesity, sleep and circadian health present a complex relationship. On the one hand, poor sleep quality and increased fragmentation of the rest‐activity rhythm are associated with greater rates of weight gain. 7 , 8 On the other, erratic eating times and increased neck circumference usually related to obesity may enhance the risk of circadian disruption and incidence of obstructive sleep apnoea. 9
The length of stay in hospital and ICU, and the use of IMV also predicted fragmentation of the circadian rest‐activity rhythm. The hospital environment is well known for its detrimental effects on sleep and circadian rhythms due to mistimed artificial light, interruptions during the night and unusual eating schedules. Also, pharmacological treatments within this context and the use of IMV are related to several sleep and circadian‐related sequelae. 10
This study has some limitations. First, given the context of COVID‐19, it was not possible to perform a baseline evaluation of sleep and circadian function, preventing the identification of possible sleep and circadian alterations prior to hospitalization or SARS‐CoV‐2 infection. Second, with the study's observational design, it is not possible to establish relationships of causality between predictive factors and outcomes as well as between the correlated sequelae. The evaluation of causality among the variables of interest was beyond the objectives of the study.
In summary, our findings reveal that sleep and circadian alterations are maintained in COVID‐19 survivors who developed ARDS and were admitted to the ICU. Within this context, characteristics such as BMI, time spent in the hospital and ICU, and the use of IMV during the ICU stay could aid in the prediction of ongoing adverse outcomes related to sleep and circadian rest‐activity rhythm. Altogether, this highlights the importance of considering the sleep and circadian health of critical patients in the longer term.
AUTHOR CONTRIBUTION
Adriano Targa: Conceptualization (lead); data curation (supporting); investigation (lead); writing – original draft (lead); writing – review and editing (lead). Iván D. Benítez: Data curation (equal); formal analysis (lead); investigation (supporting); writing – review and editing (supporting). Jessica González Gutiérrez: Conceptualization (supporting); methodology (equal); writing – review and editing (supporting). Gerard Torres: Investigation (supporting); writing – review and editing (supporting). Sally Santisteve: Methodology (supporting); writing – review and editing (supporting). Rafaela Vaca: Methodology (lead); writing – review and editing (supporting). Olga Minguez: Methodology (equal); writing – review and editing (supporting). Maria Aguilà: Methodology (equal); writing – review and editing (supporting). Paola Carmona: Methodology (supporting); writing – review and editing (supporting). Anna Moncusí‐Moix: Data curation (lead); formal analysis (supporting); writing – review and editing (supporting). Clara Gort‐Paniello: Data curation (equal); formal analysis (supporting); writing – review and editing (supporting). Gonzalo Labarca: Conceptualization (supporting); writing – review and editing (supporting). Jesús Caballero: Methodology (equal); writing – review and editing (supporting). Carme Barberà: Methodology (equal); writing – review and editing (supporting). Antoni Torres: Conceptualization (supporting); funding acquisition (lead); investigation (supporting); writing – review and editing (supporting). David de Gonzalo‐Calvo: Funding acquisition (equal); investigation (supporting); writing – review and editing (supporting). Ferran Barbé: Conceptualization (equal); funding acquisition (lead); investigation (supporting); writing – review and editing (supporting).
CONFLICT OF INTEREST
None declared.
HUMAN ETHICS APPROVAL DECLARATION
This study was approved by the Medical Ethics Committee of the Hospital Universitari Arnau de Vilanova (Identifier: CEIC‐2510) and conducted according to the principles outlined by the Declaration of Helsinki. Informed consent was acquired for all patients.
ACKNOWLEDGEMENTS
Research funding: This study was supported by ISCIII (CIBERESUCICOVID, COV20/00110), co‐funded by ERDF, ‘Una manera de hacer Europa’ and by the Donation program ‘estar preparados’, UNESPA, Madrid, Spain. Gonzalo Labarca has received financial support from Agencia Nacional de Investigacion y Desarrollo (ANID), Chile, grant COVID 1005. David de Gonzalo‐Calvo has received financial support from Instituto de Salud Carlos III (Miguel Servet 2020: CP20/00041), co‐funded by the European Social Fund (ESF)/‘Investing in your future.’
Targa ADS, Benítez ID, González J, Torres G, Santisteve S, Vaca R, et al. Sleep and circadian health 6 months after critical COVID‐19 disease. Respirology. 2022;27(12):1083–1088. 10.1111/resp.14390
Associate Editor: Albert Li; Senior Editor: Paul King
Funding information European Regional Development Fund; Instituto de Salud Carlos III, Grant/Award Numbers: CIBERESUCICOVID, COV20/00110; MiguelServet2020, CP20/00041; UNESPA; Agencia Nacional de Investigacion y Desarrollo (ANID), Grant/Award Number: COVID 1005; European Social Fund (ESF)
DATA AVAILABILITY STATEMENT
The data that support the findings of this study are available from the corresponding author upon reasonable request.
REFERENCES
- 1. Seyed Hosseini E, Riahi Kashani N, Nikzad H, Azadbakht J, Hassani Bafrani H, Haddad KH. The novel coronavirus Disease‐2019 (COVID‐19): mechanism of action, detection and recent therapeutic strategies. Virology. 2020;551:1–9. 10.1016/j.virol.2020.08.011 [DOI] [PMC free article] [PubMed] [Google Scholar]
- 2. Benítez ID, Moncusí‐Moix A, Vaca R, Gort‐Paniello C, Minguez O, Santisteve S, et al. Sleep and circadian health of critical COVID‐19 survivors 3 months after hospital discharge. Crit Care Med. 2022. 10.1097/ccm.0000000000005476 [DOI] [PMC free article] [PubMed] [Google Scholar]
- 3. Huang C, Huang L, Wang Y, Li X, Ren L, Gu X, et al. 6‐month consequences of COVID‐19 in patients discharged from hospital: a cohort study. Lancet. 2021;397:220–32. 10.1016/S0140-6736(20)32656-8 [DOI] [PMC free article] [PubMed] [Google Scholar]
- 4. Gonçalves BSB, Adamowicz T, Louzada FM, Moreno CR, Araujo JF. A fresh look at the use of nonparametric analysis in actimetry. Sleep Med Rev. 2015;20:84–91. 10.1016/j.smrv.2014.06.002 [DOI] [PubMed] [Google Scholar]
- 5. Yang PL, Ward TM, Burr RL, Kapur VK, McCurry SM, Vitiello MV, et al. Sleep and circadian rhythms in survivors of acute respiratory failure. Front Neurol. 2020;11:1–9. [DOI] [PMC free article] [PubMed] [Google Scholar]
- 6. Lee CM, Herridge MS, Gabor JY, Tansey CM, Matte A, Hanly PJ. Chronic sleep disorders in survivors of the acute respiratory distress syndrome. Intensive Care Med. 2009;35:314–20. [DOI] [PubMed] [Google Scholar]
- 7. Wu Y, Zhai L, Zhang D. Sleep duration and obesity among adults: a meta‐analysis of prospective studies. Sleep Med. 2014;15:1456–62. [DOI] [PubMed] [Google Scholar]
- 8. Laermans J, Depoortere I. Chronobesity: role of the circadian system in the obesity epidemic. Obes Rev. 2016;17:108–25. [DOI] [PubMed] [Google Scholar]
- 9. Lopez‐Minguez J, Gómez‐Abellán P, Garaulet M. Timing of breakfast, lunch, and dinner. Effects on obesity and metabolic risk. Nutrients. 2019;11:1–15. [DOI] [PMC free article] [PubMed] [Google Scholar]
- 10. Gao CA, Knauert MP. Circadian biology and its importance to intensive care unit care and outcomes. Semin Respir Crit Care Med. 2019;40:629–37. [DOI] [PubMed] [Google Scholar]
Associated Data
This section collects any data citations, data availability statements, or supplementary materials included in this article.
Data Availability Statement
The data that support the findings of this study are available from the corresponding author upon reasonable request.