

Abstract
Background
In California, >29,000 residents in skilled nursing facility (SNFs) were diagnosed with novel coronavirus disease 2019 (COVID‐19) between March 2020 and November 2020. Prior research suggests that SNFs serving racially and ethnically minoritized residents often have fewer resources and lower quality of care. We performed a cross‐sectional analysis of COVID‐19 incidence among residents in California SNFs, assessing the association of SNF‐level racial and ethnic compositions and facility‐ and neighborhood‐level (census tract‐ and county‐level) indicators of socioeconomic status (SES).
Methods
SNFs were grouped based on racial and ethnic composition using data from the Centers for Medicare and Medicaid Services; categories included SNFs with ≥88% White residents, SNFs with ≥32% Black or Latinx residents, SNFs with ≥32% Asian residents, or SNFs not serving a high proportion of any racial and ethnic composition (mixed). SNF resident‐level COVID‐19 infection data were obtained from the National Healthcare Safety Network from May 25, 2020 to August 16, 2020. Multilevel mixed‐effects negative binomial regressions were used to estimate incidence rate ratios (IRR) for confirmed COVID‐19 infections among residents.
Results
Among 971 SNFs included in our sample, 119 (12.3%) had ≥88% White residents; 215 (22.1%) had ≥32% Black or Latinx residents; 78 (8.0%) had ≥32% Asian residents; and 559 (57.6%) were racially and ethnically mixed. After adjusting for confounders, SNFs with ≥32% Black or Latinx residents (IRR = 2.40 [95% CI = 1.56, 3.68]) and SNFs with mixed racial and ethnic composition (IRR = 2.12 [95% CI = 1.49, 3.03]) both had higher COVID‐19 incidence rates than SNFs with ≥88% White residents. COVID‐19 incidence rates were also found to be higher in SNFs with low SES neighborhoods compared to those in high SES neighborhoods.
Conclusion
Public health personnel should consider SNF‐ and neighborhood‐level factors when identifying facilities to prioritize for COVID‐19 outbreak prevention and control.
Keywords: COVID, disparities, nursing home, socioeconomic status
Key points
Skilled nursing facilities with mixed resident racial and ethnic composition and those with ≥32% Black or Hispanic/Latinx residents had higher COVID‐19 incidence rates compared to SNFs with majority White residents even after adjusting for facility‐, neighborhood‐, and county‐level factors.
Skilled nursing facilities with the worst financial performances and those located in neighborhoods with the lowest socioeconomic status and in communities of color exacerbated resident COVID‐19 disparities.
Why does this paper matter?
Our findings help magnify the need for greater policy‐level efforts to encourage greater resources and support for facilities that require more assistance within vulnerable communities.
INTRODUCTION
The novel coronavirus disease 2019 (COVID‐19) has resulted in substantial morbidity and mortality among residents in skilled nursing facilities (SNFs), facilities that provide 24‐hour skilled nursing care. As of April 2022, more than 86,000 COVID‐19 infections and 9,000 deaths have been reported among residents of California (CA) SNFs. 1 COVID‐19 has disproportionately affected older adults and persons with specific underlying health conditions, 2 and also substantially impacted Black and Hispanic/Latinx communities in the general population with similar patterns observed among residents of SNFs, where these demographic and underlying health characteristics intersect and concentrate risks of transmission and severe disease and death. 3 , 4
The conditions in which people live, and the quality of the health care that they have access to, are key social determinants of how the COVID‐19 pandemic has differentially decimated marginalized demographic and socioeconomic groups. Place matters, including for SNFs. Staff who work in SNFs in communities with high COVID‐19 infection rates—communities which often have higher proportions of Black and Hispanic/Latinx residents—tend to use public transportation and themselves live in areas disproportionately impacted by the pandemic. 5 Prior research on racial and ethnic disparities suggests that SNFs with higher proportions of racially and ethnically minoritized patient populations often have fewer resources, less staffing, and lower quality of care. 6 , 7 , 8 , 9 , 10 For example, SNFs that serve predominantly Black residents have been shown to have poorer financial performance and quality of care compared to SNFs that serve predominantly White residents; this suggests that SNFs serving predominantly White residents may have greater access to resources and consequently greater opportunity to invest in the quality of care. 5 SNF resident population characteristics often reflect the residential segregation within metropolitan areas in which they are located, with disparities in care resulting from limited access to care and resources. 7 For instance, neighborhood segregation was found to be associated with SNF resident segregation, 8 and, past work has shown SNFs are less likely to be located in communities of color. 11 As a result of limited access to resources, SNFs that are located in communities of color are less likely to have protective measures such as personal protective equipment (PPE) and are of lower quality compared to SNFs located in predominantly White neighborhoods. 12 , 13
Unequal access to resources, racial and ethnic composition of residents, and neighborhood‐level factors may therefore be associated with higher COVID‐19 incidence in SNFs. 14 , 15 Recent research found SNFs with higher staffing and quality ratings had a lower number of confirmed COVD‐19 infections and deaths, and SNFs that predominantly served racially and ethnically minoritized residents had more COVID‐19 infections. 14 , 16 , 17 County‐level socioeconomic status (SES), racial and ethnic composition, and per capita income may also be associated with COVID‐19 incidence in both the community and within SNFs. 18 , 19 For instance, recent work has found staff who work in SNFs located in neighborhoods with high COVID‐19 prevalence tend to live in areas disproportionally impacted by COVID‐19. 5 In effect, a long‐standing maldistribution of social investment in SNFs, and a racial and ethnic disparities in health at the community level have amplified the pandemic in places that provide long‐term services. 5 , 19 , 20 To better understand the importance of these neighborhood‐level and SNF‐level factors with COVID‐19 outcomes, we performed a cross‐sectional analysis of COVID‐19 incidence and deaths among residents in California SNFs, assessing the impact of SNF‐level racial and ethnic compositions and SNF‐ and neighborhood‐level indicators of SES.
METHODS
We analyzed the Centers for Medicare and Medicaid Services' (CMS) Nursing Home COVID‐19 Public File from May 25, 2020–August 16, 2020 to avoid inconsistencies in reporting prior to May 25, while including early surges. 21 Key elements in the publicly available file include weekly counts of incident COVID‐19 infections and deaths among SNF residents, as well as facility‐reported size and bed capacity. CMS performed data quality verification to ensure the accuracy of the reported numbers.
We linked the COVID‐19 incidence data to several other datasets, including 2020 California Department of Health Care Access and Information (HCAI) SNF resident demographic information and SNF facility and financial characteristics 22 ; CMS Nursing Home Compare (NHC) organizational, staffing, and quality of care data (updated on March 21, 2020) 23 ; the LTCFocus file created by Brown University for additional SNF resident characteristics 24 ; the numbers of laboratory‐confirmed COVID‐19 infections in all counties in California obtained from the California Department of Public Health (CDPH) Open Data Portal, 25 and SES at the neighborhood level obtained from the CA Healthy Places Index 18 (HPI), and the American Community Survey (ACS, 2014‐2018 data). 26 For context, the HPI was created as a tool rooted in the social determinants of health for place‐based policy making and program targeting and evaluated SES as an aggregated variable. 27
Main predictor and outcomes
The main predictor variable was SNF resident racial and ethnic composition. SNFs were grouped by racial and ethnic composition using facility‐reported data from HCAI into categories that improved our sample size and aligned with those used in published research. 6 , 7 Categories included majority White residents (≥88% of residents are White), high proportion of Black or Hispanic/Latinx residents (≥32% of residents are Black or Hispanic/Latinx), high proportions of Asian residents (≥32% of residents are Asian), or racially and ethnically mixed (SNFs did not include high proportions of any race and ethnicity). The thresholds for high proportion of racial and ethnic groups were chosen based on past work that used similar cutpoints to represent facilities with high proportion of Black and high proportion of racially and ethnically minoritized SNF residents. 6 Because of the limited sample size for SNFs, we chose to combine SNFs with high proportion of Black or Hispanic/Latinx residents into the same category, though this may mask differences between racial and ethnic categories. Given the limited number of SNFs with high proportions of Asian residents (N = 78), this category was excluded from our main results. Our primary outcomes of interest included numbers of COVID‐19 laboratory‐confirmed infections among residents and deaths among residents.
Covariates
In addition to resident demographic variables (racial and ethnic composition, sex, age) and health insurance information (use of Medicaid called Medi‐Cal in CA), SNF financial characteristics collected from HCAI included operating margin, employee turnover percentage, SNF ownership, and number of beds within a facility. Operating margin was calculated by dividing net income from health care operations by total health care revenue. The ratio indicated the percentage of health care revenue that remained as income after operating expenses had been deducted. Employee turnover percentage reflected the total number of people employed from January to December 2019 relative to the average number of employees during this time period. Additional facility characteristics included ratings on staffing, quality, health‐inspection, and overall obtained from NHC (range: 1–5 [higher scores indicated better ratings]); and average activities of daily living score (ADL) collected from the LTCFocus file (range: 0–28).
Neighborhood‐level covariates were determined at the census tract‐level. The HPI 2.0 provided a composite measure of SES at the neighborhood level based on 25 indicators that encompassed economics, education, healthcare access, housing, built and social environment, and transportation (range: 1–100). The ACS provided data on racial and ethnic composition of neighborhoods by enumerating the number of racially and ethnically minoritized individuals within each census tract. In addition to neighborhood‐level covariates, we included county‐level data such as the total number of COVID‐19 confirmed infections as of August 16, 2020, and population size to determine county COVID‐19 incidence. Both variables were obtained from the CDPH Open Data Portal.
Statistical analyses
We used cross‐sectional data to evaluate differences in COVID‐19 confirmed infections and deaths, by SNF racial and ethnic composition, as well as other facility, neighborhood, and county characteristics. Mixed‐effects negative binomial regressions with three levels (facility, neighborhood, county) were used to model the COVID‐19 infection count among residents. Mixed‐effects zero‐inflated negative binomial regression was used to model death counts due to the large proportion of SNFs that reported zero deaths. Incidence rate ratios (IRR) were used to interpret the associations. To further investigate the association of neighborhood level factors and financial characteristics of SNFs, stratified analyses were conducted to examine the association between resident racial and ethnic composition and COVID‐19 incidence and deaths by HPI score and racial and ethnic composition of the neighborhood, and facility operating margin and employee turnover. Each stratification variable was also assessed as a predictor variable to examine its association with COVID‐19 incidence and deaths by racial and ethnic composition. In addition, to test the robustness of findings, we conducted sensitivity analyses with lower cut‐points for categorizing SNF racial and ethnic compositions, comparing ≥32%–≥25% Black or Hispanic/Latinx residents, and ≥88% (top 10th percentile) to ≥80% (top 20th percentile) White residents. We also conducted racial and ethnic ‐specific analyses to assess if the association between SNF resident composition and COVID‐19 incidence was specific to certain racial or ethnic groups.
Based on a priori directed acyclic graphs, 20 published literature, and an effort to evaluate the most parsimonious models, all models controlled for: number of beds within a facility; average age of facility residents; proportion of Medi‐Cal recipients; average ADL score; overall CMS NHC facility rating; operating margin; employee turnover; HPI score; racial and ethnic composition of the neighborhood (proportion Black and Hispanic/Latinx); and county COVID‐19 incidence. 19 The baseline model consisted of facility‐level variables and subsequent models included variables with additional levels (neighborhood and county). All covariates were categorized as tertiles, except for HPI score, which was categorized as binary (median cut point) in the full analysis, with below the median cut points indicating less healthy community conditions (low HPI). In secondary analyses, covariates were categorized as binary to accommodate the anticipated limited sample size of the reference group (SNFs with majority White residents). Analyses were performed using R statistical software (lme4 28 and glmmTMB 29 packages) version 3.6.2 (R Project for Statistical Computing).
RESULTS
Among 971 SNFs included in our sample, 119 (12.3%) had ≥88% White residents; 215 (22.1%) had ≥32% Black or Latinx residents; 78 (8.0%) had ≥32% Asian residents; and 559 (57.6%) were racially and ethnically mixed (Table 1). SNFs with majority White residents had higher proportions of women, older residents, smaller proportion of Medi‐Cal recipients, and fewer beds compared to other SNF categories. In addition, SNFs with majority White residents had higher operating margins and were located in neighborhoods with higher HPI and smaller proportions of Black or Hispanic/Latinx populations and counties with lower COVID‐19 incidence compared to their counterparts. Furthermore, the majority of SNFs were for‐profit for each racial and ethnic category; however, SNFs with majority White residents had the largest proportion of SNFs that were not‐for‐profit compared to SNFs with high proportions of Black or Hispanic/Latinx residents, although the sample size was limited (Table S2).
TABLE 1.
Comparison of select facility and neighborhood characteristics for skilled nursing facilities by racial and ethnic composition
| Characteristic | Overall (Mean [SD]) a | Mixed (Mean [SD]) | ≥32% Black or Hispanic/Latinx (Mean [SD]) | ≥88% White (Mean [SD]) | ≥32% Asian (Mean [SD]) |
|---|---|---|---|---|---|
| N | 971 | 559 | 215 | 119 | 78 |
| Women (%) | 56 (11) | 56 (11) | 51 (11) | 64 (9.0) | 59 (7.0) |
| Average facility age (years) | 76.49 (7.54) | 75.89 (7.35) | 73.30 (7.42) | 81.94 (6.17) | 80.10 (5.06) |
| Overall 5‐star rating | 3.42 (1.35) | 3.42 (1.36) | 2.97 (1.34) | 3.98 (1.25) | 3.77 (1.10) |
| Medi‐Cal users (%) | 52 (29) | 53 (27) | 51 (.29) | 48 (37) | 52 (29) |
| Number of beds | 101.36 (48.77) | 102.33 (49.10) | 103.97 (42.68) | 87.14 (47.45) | 110.49 (58.41) |
| Activities Daily Living Score | 18.20 (3.27) | 17.86 (3.54) | 18.86 (2.98) | 17.58 (2.48) | 19.78 (2.35) |
| Operating margin b | 9.28 (19.14) | 8.75 (19.46) | 7.43 (8.79) | 16.12 (30.39) | 7.09 (7.58) |
| Employee turnover (%) | 46.3 (20.96) | 46.5 (21.11) | 47.4 (20.96) | 45.3 (21.34) | 43.6 (19.28) |
| Healthy Places Index Score | 44.10 (27.13) | 45.47 (27.75) | 33.55 (22.94) | 53.68 (25.27) | 47.12 (27.55) |
| Proportion of neighborhood Black or Hispanic/Latinx (%) | 0.44 (0.24) | 0.42 (0.22) | 0.62 (0.22) | 0.26 (0.17) | 0.42 (0.23) |
| County COVID‐19 incidence | 0.02 (0.01) | 0.02 (0.01) | 0.02 (0.01) | 0.01 (0.01) | 0.02 (0.01) |
Includes SNFs with ≥32% Asian residents.
Operating margin was calculated by dividing net income from health care operations by total health care revenue.
Compared with SNFs with majority White residents, racially and ethnically mixed SNFs had a significantly higher COVID‐19 incidence rate among residents after controlling for SNF‐level factors (IRR = 2.98 [95% confidence interval (CI) = 1.95, 4.57]). After controlling for neighborhood and county‐level factors; this association was attenuated but remained statistically significant (IRR = 2.12 [95% CI = 1.49, 3.03]) (Figure 1). Incidence rates were higher among SNFs with high proportions of Black or Hispanic/Latinx residents compared to SNFs with majority White residents, after controlling for SNF‐level factors (IRR = 5.12 [95% CI = 3.09, 8.51]) and neighborhood and county‐level factors (IRR = 2.40 [95% CI = 1.56, 3.68]), although results were attenuated after further adjustments. In our sensitivity analyses, when cut‐points were lowered for SNFs with Black or Hispanic/Latinx residents the COVID‐19 incidence rates increased in these populations; when cut‐points were lowered for SNFs with majority White residents, the COVID‐19 incidence rates decreased for both racially and ethnically mixed SNFs and those with high proportions of Black or Hispanic/Latinx residents (Table S1). However, the overall trends in differences remained consistent with our main results. We further examined Black and Hispanic/Latinx specific analyses and found similar patterns to our previous results, however, the sample sizes for both groups were limited, and final models were not significant (Table S3).
FIGURE 1.
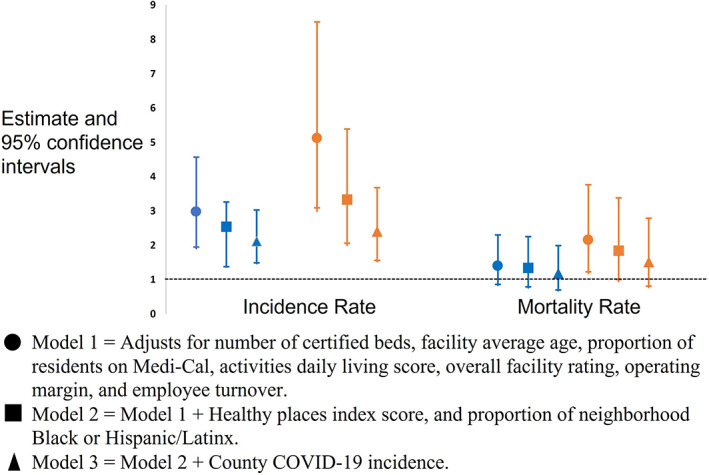
Association of racially and ethnically mixed SNFs (blue) & SNFs with ≥32% Black or Hispanic/Latinx residents (orange) compared to majority White SNFs with COVID‐19 outcomes
SNFs with high proportions of Black or Hispanic/Latinx residents had higher mortality rates compared to SNFs with majority White residents even when controlling for SNF‐ (IRR = 2.15 [95% CI = 1.23, 3.76]) and neighborhood‐level factors (IRR = 1.84 [95% CI = 1.00,3.83]); however, the association was attenuated and no longer significant after adjustment for county‐level factors (IRR = 1.51 [95% CI = 0.81, 2.79]) (Figure 1). In comparison, there were no significant differences identified in mortality rates between racially and ethnically mixed SNFs and SNFs with majority White residents.
When stratified by SNF‐ and neighborhood‐level factors (Table 2), racially and ethnically mixed SNFs with a low HPI score (IRR = 3.19 [95% CI = 1.98, 5.13]) and SNFs with high proportions of Black or Hispanic/Latinx residents and a low HPI score (IRR = 3.38 [95% CI = 2.03, 5.60]) had significantly higher COVID‐19 incidence rates compared to SNFs with majority White residents. Similarly, when restricting analysis to SNFs with high employee turnover, racially and ethnically mixed SNFs (IRR = 3.37 [95% CI = 1.89, 6.03]) and SNFs with high proportions of Black or Hispanic/Latinx residents (IRR = 4.11 [95% CI = 2.07, 8.17]) had significantly higher COVID‐19 incidence rates compared to SNFs with majority White residents. When we restricted analysis to SNFs in neighborhoods with low proportion of Black or Hispanic/Latinx, racially and ethnically mixed SNFs (IRR = 3.66 [95% CI = 2.00, 6.69]) and SNFs with high proportions of Black or Hispanic/Latinx residents (IRR = 3.09 [95% CI = 1.20, 8.00]) had significantly higher COVID‐19 incidence rates among residents compared to SNFs with majority White residents. In addition, when we stratified analysis based on COVID‐19 county‐level incidence, we found the largest differences in incidence rates between SNFs with high proportions of Black or Hispanic/Latinx residents and those with majority White residents to be in counties with higher COVID‐19 incidence (IRR = 2.63 [95% CI = 1.58, 4.36]).
TABLE 2.
Association of skilled nursing facility racial and ethnic composition with COVID‐19 outcomes stratified by skilled nursing facility‐ and neighborhood‐level factors
| Model | ≥88% White (IRR [95% CI]) | Mixed (IRR [95% CI]) | ≥32% Black or Hispanic/Latinx (IRR [95% CI]) |
|---|---|---|---|
| COVID‐19 incidence rate | |||
| Healthy places index | |||
| Highest | Ref | 1.35(0.74, 2.46) | 1.74 (0.78, 3.87) |
| Lowest | Ref | 3.19 (1.98,5.13) a | 3.38 (2.03, 5.60) a |
| Operating margin | |||
| Highest | Ref | 1.79 (0.99, 3.25) | 1.61 (0.77, 3.38) |
| Lowest | Ref | 2.36 (1.48, 3.74) a | 3.06 (1.71, 5.47) a |
| Employee turnover | |||
| Highest | Ref | 3.37 (1.89, 6.03) a | 4.11 (2.07, 8.17) a |
| Lowest | Ref | 1.45 (0.89, 2.38) | 1.40 (0.74, 2.63) |
| Percent of neighborhood Black or Hispanic/Latinx | |||
| Highest | Ref | 0.72 (0.47, 1.11) | 0.96 (0.60, 1.53) |
| Lowest | Ref | 3.66 (2.00, 6.69) a | 3.09 (1.20, 8.00) a |
| County COVID‐19 incidence | |||
| Highest | Ref | 2.01 (1.28, 3.17) a | 2.63 (1.58, 4.36) a |
| Lowest | Ref | 2.34(1.30, 4.21) a | 2.25 (1.04, 4.89) a |
| COVID‐19 mortality rate | |||
| Healthy places index | |||
| Highest | Ref | 0.73 (0.34, 1.57) | 1.11 (0.42, 2.93) |
| Lowest | Ref | 0.50 (0.26, 0.99) a | 1.15 (0.78, 1.69) |
| Operating margin | |||
| Highest | Ref | 0.97 (0.54, 1.75) | 0.83 (0.41, 1.69) |
| Lowest | Ref | 1.47 (0.64, 3.36) | 2.17 (0.83, 5.67) |
| Employee turnover | |||
| Highest | Ref | 2.19 (1.04, 4.58) a | 3.27 (1.40, 7.87) a |
| Lowest | Ref | 0.80 (0.39, 1.65) | 0.78 (0.32, 1.93) |
| Percent of neighborhood Black or Hispanic/Latinx | |||
| Highest | Ref | 0.96 (0.44, 2.10) | 1.11 (0.50, 2.45) |
| Lowest | Ref | 1.32 (0.64, 2.71) | 1.90 (0.65, 5.54) |
| County COVID‐19 incidence | |||
| Highest | Ref | 1.02 (0.48, 2.17) | 1.19 (0.51, 2.74) |
| Lowest | Ref | 0.95 (0.47, 1.92) | 1.31 (0.50, 3.46) |
Note: All models adjusted for number of certified beds, facility average age, proportion of residents on Medi‐Cal, activities daily living score, and overall facility rating. Models also adjusted for variables that were not used for stratification. All stratification variables were coded as binary.
Abbreviations: CI, Confidence intervals; IRR, Incidence Rate Ratio.
Indicates p‐value <0.05.
We also examined the association of SNF‐, neighborhood, and county‐level factors with COVID‐19 incidence and COVID‐19 mortality rates stratified by SNF racial and ethnic composition to identify differences within racial and ethnic groups (Table 3). Among racially and ethnically mixed SNFs, COVID‐19 incidence rates were higher in SNFs in low HPI neighborhoods compared to those in high HPI neighborhoods (IRR = 1.61 [95% CI = 1.07, 2.42]). In contrast, among SNFs with majority White residents, SNFs in low HPI neighborhoods had lower COVID‐19 incidence rates compared to those in high HPI neighborhoods (IRR = 0.14 [95% CI = 0.04, 0.50]); however, sample size was limited (low HPI [N = 50] versus high HPI [69]). Higher county COVID‐19 incidence was associated with higher COVID‐19 incidence rates and mortality rates among residents in racially and ethnically mixed SNFs when compared to their counterparts in counties with low COVID‐19 incidence. Similar results for mortality rates were observed among SNFs with high proportions of Black or Hispanic/Latinx residents.
TABLE 3.
Association of skilled nursing facility‐ and neighborhood‐ level factors with COVID‐19 outcomes stratified by skilled nursing facility racial and ethnic composition
| Model | Reference | ≥88% White (IRR [95% CI]) | ≥32% Black or Hispanic/Latinx (IRR [95% CI]) | Mixed (IRR [95% CI]) |
|---|---|---|---|---|
| COVID‐19 incidence rate | ||||
| Low Healthy Places Index | High HPI | 0.14 (0.04, 0.50) a | 0.93 (0.57, 1.51) | 1.61 (1.07, 2.42) a |
| Low operating margin | High operating margin | 0.84 (0.52, 1.34) | 1.03 (0.88, 1.21) | 1.01 (0.86, 1.20) |
| High employee turnover | Low turnover | 1.24 (0.59, 2.62) | 1.10 (0.79, 1.54) | 1.00 (0.80, 1.23) |
| High percent of neighborhood Black or Hispanic/Latinx | Low proportion | 11.63 (4.36, 31.03) a | 1.60 (0.94, 2.72) | 1.02 (0.70, 1.49) |
| High county COVID‐19 Incidence | Low incidence | 2.20 (0.59, 8.23) | 3.33 (1.65, 6.69) a | 4.07 (2.40, 6.89) a |
| COVID‐19 mortality rate | ||||
| Low healthy Places Index | High HPI | 0.08 (0.01, 0.58) a | 1.12 (0.66, 1.88) | 1.57 (0.96, 2.57) |
| Low operating margin | High operating margin | 0.60 (0.22, 1.62) | 1.14 (0.79, 1.63) | 0.97(0.68, 1.40) |
| High employee turnover | Low turnover | 0.60 (0.21, 1.76) | 1.45 (0.85, 2.46) | 1.06 (0.80, 1.42) |
| High percent of neighborhood Black or Hispanic/Latinx | Low proportion | 18.5 (4.40, 77.91) a | 1.10 (0.63, 1.92) | 1.09 (0.67, 1.78) |
| High county COVID‐19 Incidence | Low incidence | 7.67 (3.92, 14.99)a | 1.36 (0.77, 2.39) | 3.43 (1.63, 7.21)a |
Abbreviations: CI, Confidence intervals; IRR, Incidence Rate Ratio.
Note: All models adjusted for number of certified beds, facility average age, proportion of residents on Medi‐Cal, activities daily living score, overall facility rating, and county COVID‐19 incidence. Models also adjusted for neighborhood‐level variables that were not main predictors in the model. All stratification variables were coded as binary.
Indicates p‐value <0.05.
DISCUSSION
In a statewide analysis, we found SNF‐ and neighborhood‐level factors further widen racial and ethnic disparities in COVID‐19 incidence in SNFs in California. SNFs with mixed composition and those with ≥32% Black or Hispanic/Latinx residents had higher COVID‐19 incidence rates compared to SNFs with majority White residents even after adjusting for SNF‐, neighborhood‐, and county‐level factors. Disparities were exacerbated in SNFs located in neighborhoods with the lowest HPI scores, the worst financial performances, and in communities of color. Our findings continue to magnify the need to direct greater resources and attention to SNFs within these vulnerable communities.
Although prior studies have identified racial and ethnic disparities in COVID‐19 infections and deaths among SNF residents, 3 , 16 , 30 our results demonstrate that these disparities are further exacerbated by SNF‐, neighborhood, and county‐level factors. We found that SNFs serving racially and ethnically minoritized residents were more likely to be located in neighborhoods with low HPI, and furthermore, among these SNFs the difference in COVID‐19 incidence between racial and ethnic SNF categories widened. SNF financial characteristics are associated with disadvantaged communities, resident demographics, and neighborhood demographics. 7 SNFs with poorer financial performance may be less able to invest in resources, staffing, and quality improvement efforts that could prevent COVID‐19 transmission. For instance, reduced financial resources may limit access to testing resources necessary for routing screening testing of staff to identify infectious staff or may represent limited access to competing for infection prevention and control (IPC) equipment. 31 In addition to lower financial performance, SNFs located in communities of color also tend to have limited resources, low quality of care, and be racially and ethnically concentrated. 6 , 7 , 8 , 12
The racial and ethnic separation and concentration across SNFs reflects patterns of residential segregation and community‐level socio‐economic barriers. Payment mechanisms that concentrate racially and ethnically minoritized individuals in lower‐resource SNFs with poorer outcomes, and punitive regulatory practices that burden already under‐resourced SNFs, exemplify a type of structural or institutional racism, in which policies and systems produce different outcomes for different racial and ethnic groups in a manner that benefits the dominant group. 32 Past literature has consistently indicated that SNFs remain highly segregated, and racially and ethnically minoritized residents tend to be concentrated in a relatively small number of facilities. 8 , 12 , 33 Payer status, income, or financial barriers may also directly affect access to care facilities, limiting potential options and reinforcing segregation. In addition, corporate decisions on where to locate SNFs (favoring higher‐income neighborhoods) and how to distribute resources are manifestations of institutional racism. 32 As a result, residents in SNFs with higher proportions of racially and ethnically minoritized groups continue to face inequities in healthcare opportunities, leaving them more vulnerable to higher risks of poor health outcomes, as evidenced by increased COVID‐19 morbidity and mortality.
Overall, our results suggest that disparities in COVID‐19 incidence within SNF mirrors disparities in COVID‐19 burden among their surrounding communities. Racially and ethnically minoritized and low SES communities disproportionately experience the highest rates of COVID‐19 and have been found to have higher disease transmission due to difficulty maintaining social distancing. Social distancing is exceedingly challenging when residing in overcrowded housing, multigenerational households, or having an essential worker occupation. 4 , 34 , 35 These factors increase the probability of rapid spread of COVID‐19 at the community‐level, placing staff from these communities at higher risk of COVID‐19 infection and inadvertent introduction and transmission among residents. 36
Our study has several limitations. First, although SNF‐level characteristics are important, the current study was limited by the lack of individual‐level data on COVID‐19 infections and deaths among SNF residents and staff to study disparities more explicitly. Second, due to our limited sample size, we combined Black and Hispanic/Latinx racial and ethnic composition into one category in our main analysis, potentially limiting our ability to investigate racial and ethnic‐specific disparities; however, we conducted additional racial and ethnic‐specific analyses and found that results were similar to those found in our main analysis. Third, although others have described the importance of SNF staff employment networks in predicting COVID‐19 infections, 37 we lacked information on staff members' employment histories to quantify the proportion of staff working at multiple facilities. Fourth, COVID‐19 infection and death counts were self‐reported by SNF administration; while this captured total counts, it did not account for readmissions or discharges of residents. Fifth, we were unable to assess other characteristics of SNFs that have been shown to be predictive of COVID‐19 mortality: resident crowding, 38 ; IPC, and linguistic concordance between patients and staff. 39 Sixth, by coding SNF financial‐ and neighborhood‐level variables as binary in additional analyses due to the limited sample size, we potentially created broad categories that could mask important characteristics; however, additional analyses with tertiles suggested similar results. Seventh, in addition to the inability to determine how facilities assessed race and ethnicity of SNF residents, we did not have sufficient sample size to explore additional resident racial and ethnic compositions such as Asian, Native Hawaiian or Pacific Islander or American Indian/Alaska Native populations, preventing us from further evaluating populations that have been found to have an increase in COVID‐19 mortality. 19 , 40 Finally, our cross‐sectional study evaluated SNF COVID‐19 disparities after initial surges in 2020; however, more work is needed to assess these associations longitudinally and after subsequent waves and the introductions of vaccines.
We found that not only do SNFs with higher percentages of Black or Latinx residents have higher COVID‐19 incidence, but these associations are exacerbated by SNF financial characteristics and neighborhood factors. Our findings underscore the imperative for public health agencies to prioritize disproportionately impacted communities and co‐located SNFs for public health support and resources, such as those in low resourced communities, those located in predominantly Black and Hispanic/Latinx communities, or SNFs with poor financial performance to mitigate the impact of COVID‐19. In the context of greater resources and technical assistance to SNFs, work is then needed to strengthen regulatory oversight to ensure that all facilities meet minimum federal and state nursing home standards for quality, staffing, IPC, sanitation, and emergency requirements, with an expectation that providers and corporations will be held accountable. Furthermore, focused attention on the social determinants of health in these vulnerable communities should be a long‐term priority beyond COVID‐19 outbreak control efforts, as SES factors at the SNF‐ and neighborhood level that drive disparities in COVID‐19 preceded the pandemic and will continue to impact health outcomes post‐pandemic.
AUTHOR CONTRIBUTIONS
All authors have read and approved of the submission of this manuscript. All authors contributed to the study concept and design. All authors contributed to the acquisition, analysis, and interpretation of data. Joseph C. Engeda and Ellora N. Karmarkar drafted the manuscript. All authors contributed to critical revisions of the manuscript for important intellectual content. Joseph C. Engeda was responsible for statistical analysis. Erin Epson provided study supervision.
FUNDING INFORMATION
No specific funding was received for this work.
SPONSOR'S ROLE
None.
CONFLICT OF INTEREST
The authors have no conflicts.
Supporting information
Table S1. Association of racial and ethnic composition with COVID‐19 incidence rate with multiple scenarios
Table S2. Facility ownership by skilled nursing facility resident racial and ethnic composition
Table S3. Association of racial and ethnic‐specific composition with COVID‐19 incidence rate
ACKNOWLEDGMENTS
This article has not been previously published and is not being considered for publication elsewhere, in whole or in part, in any language, except as an abstract.
Engeda JC, Karmarkar EN, Mitsunaga TM, Raymond KL, Oh P, Epson E. Resident racial and ethnic composition, neighborhood‐level socioeconomic status, and COVID‐19 infections in California SNFs . J Am Geriatr Soc. 2023;71(1):157‐166. doi: 10.1111/jgs.18076
The findings and conclusions in this article are those of the author(s) and do not necessarily represent the views or opinions of the California Department of Public Health or the California Health and Human Services Agency.
REFERENCES
- 1. California Department of Public Health. Skilled nursing facilities: COVID‐19.
- 2. Jordan RE, Adab P, Cheng KK. Covid‐19: risk factors for severe disease and death. BMJ (Clinical research ed). 2020;368:m1198. [DOI] [PubMed] [Google Scholar]
- 3. Li Y, Cen X, Cai X, Temkin‐Greener H. Racial and ethnic disparities in COVID‐19 infections and deaths across U.S. Nursing Homes. J Am Geriatr Soc. 2020;68(11):2454‐2461. [DOI] [PMC free article] [PubMed] [Google Scholar]
- 4. Webb Hooper M, Nápoles AM, Pérez‐Stable EJ. COVID‐19 and racial/ethnic disparities. JAMA. 2020;323(24):2466–2467. [DOI] [PMC free article] [PubMed] [Google Scholar]
- 5. Shippee TP, Akosionu O, Ng W, et al. COVID‐19 pandemic: exacerbating racial/ethnic disparities in long‐term services and supports. J Aging Social Pol. 2020;32(4‐5):323‐333. [DOI] [PMC free article] [PubMed] [Google Scholar]
- 6. Chisholm L, Weech‐Maldonado R, Laberge A, Lin FC, Hyer K. Nursing home quality and financial performance: does the racial composition of residents matter? Health Serv Res. 2013;48(6 Pt 1):2060‐2080. [DOI] [PMC free article] [PubMed] [Google Scholar]
- 7. Park YJ, Martin EG. Geographic disparities in access to nursing home services: assessing fiscal stress and quality of care. Health Serv Res. 2018;53(Suppl 1):2932‐2951. [DOI] [PMC free article] [PubMed] [Google Scholar]
- 8. Smith DB, Feng Z, Fennell ML, Zinn JS, Mor V. Separate and unequal: racial segregation and disparities in quality across U.S. nursing homes. Health Aff. 2007;26(5):1448‐1458. [DOI] [PubMed] [Google Scholar]
- 9. Li Y, Harrington C, Mukamel DB, Cen X, Cai X, Temkin‐Greener H. Nurse staffing hours at nursing homes with high concentrations of minority residents, 2001‐11. Health Aff. 2015;34(12):2129‐2137. [DOI] [PMC free article] [PubMed] [Google Scholar]
- 10. Campbell LJ, Cai X, Gao S, Li Y. Racial/ethnic disparities in nursing home quality of life deficiencies, 2001 to 2011. Gerontol Geriatr Med. 2016;2:2333721416653561. [DOI] [PMC free article] [PubMed] [Google Scholar]
- 11. Konetzka RT, Werner RM. Disparities in long‐term care: building equity into market‐based reforms. Med Care Res Rev. 2009;66(5):491‐521. [DOI] [PubMed] [Google Scholar]
- 12. Mor V, Zinn J, Angelelli J, Teno JM, Miller SC. Driven to tiers: socioeconomic and racial disparities in the quality of nursing home care. The Milbank Quart. 2004;82(2):227‐256. [DOI] [PMC free article] [PubMed] [Google Scholar]
- 13. Kim SJ, Hollender M, DeMott A, et al. COVID‐19 Cases and Deaths in Skilled Nursing Facilities in Cook County, Illinois. Vol 2022. Public Health Reports; 1974:333549221074381. [DOI] [PMC free article] [PubMed] [Google Scholar]
- 14. Li Y, Temkin‐Greener H, Shan G, Cai X. COVID‐19 infections and deaths among connecticut nursing home residents: facility correlates. J Am Geriatr Soc. 2020;68(9):1899‐1906. [DOI] [PMC free article] [PubMed] [Google Scholar]
- 15. Spurlock B. COVID‐19 in California's nursing homes: factors associated with cases and deaths. 2020. https://www.chcf.org/publication/covid-19-californias-nursing-homes-factors-cases-deaths/#recommendations.
- 16. Gorges RJ, Konetzka RT. Factors associated with racial differences in deaths among nursing home residents with COVID‐19 infection in the US. JAMA Netw Open. 2021;4(2):e2037431. [DOI] [PMC free article] [PubMed] [Google Scholar]
- 17. Travers JL, Agarwal M, Estrada LV, et al. Assessment of coronavirus disease 2019 infection and mortality rates among nursing homes with different proportions of black residents. J Am Med Direct Assoc. 2021;22(4):893‐898.e892. [DOI] [PMC free article] [PubMed] [Google Scholar]
- 18. Karmakar M, Lantz PM, Tipirneni R. Association of social and demographic factors with COVID‐19 incidence and death rates in the US. JAMA Netw Open. 2021;4(1):e2036462. [DOI] [PMC free article] [PubMed] [Google Scholar]
- 19. Sugg MM, Spaulding TJ, Lane SJ, et al. Mapping community‐level determinants of COVID‐19 transmission in nursing homes: A multi‐scale approach. Sci Total Environ. 2021;752:141946. [DOI] [PMC free article] [PubMed] [Google Scholar]
- 20. LeRose JJ, Merlo C, Duong P, et al. The role of the social vulnerability index in personal protective equipment shortages, number of cases, and associated mortality during the coronavirus disease 2019 (COVID‐19) pandemic in Michigan skilled nursing facilities. Infect Control Hospit Epidemiol. 2020;42(7):877‐880. [DOI] [PMC free article] [PubMed] [Google Scholar]
- 21. Centers for medicare and medicaid services: COVID‐19 nursing home data. 2020. https://data.cms.gov/stories/s/COVID-19-Nursing-Home-Data/bkwz-xpvg. [PubMed]
- 22. Romano PS, Zach A, Luft HS, Rainwater J, Remy LL, Campa D. The California Hospital Outcomes Project: using administrative data to compare hospital performance. Joint Commiss J Qual Improv. 1995;21(12):668‐682. [DOI] [PubMed] [Google Scholar]
- 23. Centers for Medicare & Medicaid Services . Five‐star quality rating system. cms.gov website. 2020. Accessed June 12, 2020. https://www.cms.gov/medicare/provider-enrollment-and-certification/certificationandcomplianc/fsqrs.html.
- 24. Brown School of Public Health . Long‐Term Care: Facts on Care in the US. 2017. Accessed June 12, 2020. http://ltcfocus.org/.
- 25. California Open Data Portal . California Department of Public Health. 2020. https://www.cdph.ca.gov/Programs/CID/DCDC/Pages/Immunization/nCOV2019.aspx.
- 26. American Community Survey . Accessed June 12, 2020. https://www.census.gov/programs-surveys/acs.
- 27. Maizlish N, Delaney T, Dowling H, et al. California Healthy Places Index: Frames Matter. Public Health Reports; (). 2019;134(4):354‐362. [DOI] [PMC free article] [PubMed] [Google Scholar]
- 28. Bates D, Mächler M, Bolker B, Walker S. Fitting linear mixed‐effects models using lme4. arXiv preprint arXiv:14065823. 2014;67(1):1–48. [Google Scholar]
- 29. Brooks ME, Kristensen K, Van Benthem KJ, et al. glmmTMB balances speed and flexibility among packages for zero‐inflated generalized linear mixed modeling. R J. 2017;9(2):378‐400. [Google Scholar]
- 30. Caring for Seniors Amid the COVID‐19 Crisis; Hearing Before the United States Senate In. Special Committee on Aging2020.
- 31. Rajak K. COVID‐19 crisis prompting innovation in addressing personal protective equipment shortage. J Patan Acad Health Sci. 2020;7(1):69‐72. [Google Scholar]
- 32. Sloane PD, Yearby R, Konetzka RT, Li Y, Espinoza R, Zimmerman S. Addressing systemic racism in nursing homes: a time for action. J Am Med Direct Assoc. 2021;22(4):886‐892. [DOI] [PubMed] [Google Scholar]
- 33. Fennell ML, Miller SC, Mor V. Facility effects on racial differences in nursing home quality of care. Am J Med Qual Off J Am Col Med Qual. 2000;15(4):174‐181. [DOI] [PubMed] [Google Scholar]
- 34. Sloan C, Chandrasekhar R, Mitchel E, Schaffner W, Lindegren ML. Socioeconomic disparities and influenza hospitalizations, tennessee, USA. Emerg Infect Dis. 2015;21(9):1602‐1610. [DOI] [PMC free article] [PubMed] [Google Scholar]
- 35. Rogers TN, Rogers CR, VanSant‐Webb E, Gu LY, Yan B, Qeadan F. Racial disparities in COVID‐19 mortality among essential workers in the United States. World Med Health Pol. 2020;12(3):311–327. [DOI] [PMC free article] [PubMed] [Google Scholar]
- 36. True S, Cubanski J, Garfield R, et al. COVID‐19 and workers at risk: Examining the long‐term care workforce. 2020.
- 37. Chen MK, Chevalier JA, Long EF. Nursing home staff networks and COVID‐19. Proceed Natl Acad Sci USA. 2021;118(1):e2015455118. [DOI] [PMC free article] [PubMed] [Google Scholar]
- 38. Brown KA, Jones A, Daneman N, et al. Association Between Nursing Home Crowding and COVID‐19 Infection and Mortality in Ontario, Canada. JAMA Inter Med. 2021;181(2):229‐236. [DOI] [PMC free article] [PubMed] [Google Scholar]
- 39. Travers J, Herzig CT, Pogorzelska‐Maziarz M, et al. Perceived barriers to infection prevention and control for nursing home certified nursing assistants: a qualitative study. Geriat Nurs. 2015;36(5):355‐360. [DOI] [PMC free article] [PubMed] [Google Scholar]
- 40. Chu JN, Tsoh JY, Ong E, Ponce NA. The hidden colors of coronavirus: the burden of attributable COVID‐19 deaths. J Gener Inter Med. 2021;36(5):1463‐1465. [DOI] [PMC free article] [PubMed] [Google Scholar]
Associated Data
This section collects any data citations, data availability statements, or supplementary materials included in this article.
Supplementary Materials
Table S1. Association of racial and ethnic composition with COVID‐19 incidence rate with multiple scenarios
Table S2. Facility ownership by skilled nursing facility resident racial and ethnic composition
Table S3. Association of racial and ethnic‐specific composition with COVID‐19 incidence rate