

Abstract
Objective
Cardiac involvement in recovered COVID‐19 patients assessed by cardiac magnetic resonance imaging (MRI).
Methods
Subjects recently recovered from COVID‐19 and with an abnormal left ventricular global longitudinal strain were enrolled. Cardiac MRI in all the enrolled subjects was done at baseline (within 30–90 days following recovery from COVID‐19) with a follow‐up scan at 6 months in individuals with an abnormal baseline scan. Additionally, 20 age‐and sex‐matched individuals were enrolled as healthy controls (HCs).
Results
All the 30 enrolled subjects were symptomatic during active COVID‐19 disease and were categorized as mild: 11 (36.7%), moderate: 6 (20%), and severe: 13 (43.3%). Of the 30 patients, 16 (53.3%) had abnormal CMR findings. Myocardial edema was reported in 12 (40%) patients while 10 (33.3%) had late gadolinium enhancement (LGE). No difference was observed in terms of conventional left ventricular (LV) parameters; however, COVID‐19‐recovered patients had significantly lower right ventricular (RV) ejection fraction, RV stroke volume, and RV cardiac index compared to HCs. Follow‐up scan was abnormal in 4/16 (25%) with LGE persisting in three patients (who had severe COVID‐19 [3/4;75%]). Subjects with severe COVID‐19 had a greater frequency of LGE (53.8%) and myocardial edema (61.5%) as compared to mild and moderate cases. Myocardial T1 (1284 ± 43.8 ms vs. 1147.6 ± 68.4 ms; p < .0001) and T2 values (50.8 ± 16.7 ms vs. 42.6 ± 3.6 ms; p = .04) were significantly higher in post COVID‐19 subjects compared to HCs. Similarly, T1 and T2 values of severe COVID‐19 patients were significantly higher compared to mild and moderate cases.
Conclusions
An abnormal CMR was seen in half of the recovered patients with persistent abnormality in one‐fourth at 6 months. Our study suggests a need for closer follow‐up among recovered subjects in order to evaluate for long‐term cardiovascular sequelae. COVID‐19 causes structural changes in the myocardium in a small segment of patients with partial spontaneous resolution.
Keywords: cardiovascular magnetic resonance imaging, COVID‐19, myocarditis, speckle tracking echocardiography
1. INTRODUCTION
Coronavirus disease 2019 (COVID‐19) caused by severe acute respiratory syndrome (SARS) Cov‐2 has affected a majority of the global population in multiple waves of infection. 1 , 2 A proportion of patients with COVID‐19 might have persistent symptoms during the convalescence phase despite the recovery. This emerging clinical entity is termed as chronic COVID‐19 syndrome (CCS) or long‐haul COVID. 3 Though the exact etiology of CCS is still unclear, limited studies have attributed myocardial injury, ongoing inflammation, and sub‐clinical myocardial dysfunction to be the potential causes of long haul COVID. 4 Myocardial injury in COVID‐19 is not uncommon and has been reported in up to one‐third of patients. 5 It is still unknown whether COVID‐19 patients with an acute cardiac injury during index hospitalization suffer from sustained myocardial impairment or cardiovascular sequelae during their convalescence phase. 6 Additionally, the clinical implications of persistent cardiac involvement in these patients are unclear.
Cardiovascular magnetic resonance (CMR) imaging being a non‐invasive imaging modality can detect the presence and extent of myocardial injury as well as sub‐clinical left ventricular (LV) dysfunction even before overt regional wall motion abnormalities become apparent. 7 There is limited data utilizing CMR in the detection of myocardial injury/inflammation in COVID‐19‐recovered subjects. 8 , 9 , 10 , 11 , 12 Previous studies have reported the prevalence of abnormal CMR findings in COVID‐19‐recovered subjects to be ranging between 1.4% and 78%. 8 , 9 , 10 , 11 , 12 Puntmann and colleagues 8 reported abnormal CMR findings in 78% of recovered subjects while in a study from China, myocardial edema was reported in 14/26 (54%) COVID‐19 recovered patients while 8 (31%) had late gadolinium enhancement (LGE). 9 However, these studies have been limited by the heterogeneity in the population studied (asymptomatic to severe COVID) and the use of varying methods for the detection of myocardial injury (conventional CMR sequences such as LGE and T2WI vs. native T1 and T2 measurements). The purpose of our study was to evaluate the extent of inflammatory/structural changes in the myocardium in symptomatic COVID‐19‐recovered patients during the convalescence phase using CMR.
2. METHODS
This was a prospective single‐center study in the Department of Cardiology at a tertiary care center in India. A total of 400 consecutive subjects recently recovered from COVID‐19 infection were screened. All these subjects were COVID‐19 positive in the past using reverse transcription‐polymerase chain reaction (RT‐PCR) swab test. Patients were considered recovered by the discharge criteria (normal temperature lasting longer than 3 days, resolved respiratory symptoms, and two consecutive negative RT‐PCR test results separated by at least 24 h) and were isolated for a minimum of 14 days. Of the 400 subjects, 140 underwent two‐dimensional (2D) speckle tracking echocardiography (STE) for the detection of sub‐clinical left ventricular dysfunction. Impaired global longitudinal strain (GLS) was reported in 39/140 (27.8%) of them. All COVID‐19‐recovered subjects with abnormal GLS were further screened for suitability for CMR. Subjects with: (1) a history of coronary artery disease, myocarditis, moderate to severe valvular dysfunction, atrial fibrillation, or prior cardiomyopathy; (2) contradictions to gadolinium contrast; (3) severe renal insufficiency (creatinine clearance rate < 30 ml/min/1.73 m2; (4) pregnancy ; (5) unable to breath‐hold and cooperate during CMR examination, (6) MRI image quality not sufficient for analysis; and (7) unwillingness to participate or provide informed consent were excluded. Post‐exclusion, 30 subjects were finally enrolled who underwent CMR at baseline and a follow‐up scan 6 months later in those with abnormal findings in the initial scan. The baseline CMR was performed within 30–90 days following recovery from COVID‐19 infection. Additionally, 20 age and sex‐matched healthy controls were enrolled who also underwent CMR. All the control subjects had a normal electrocardiogram (ECG), echocardiography and had no antecedent history or serological evidence of prior COVID‐19 infection. Baseline clinical and biochemical parameters including hemogram, liver, and kidney function tests as well as inflammatory markers such as C‐reactive protein (CRP), serum ferritin, interleukin (IL)‐6, lactate dehydrogenase (LDH), and D‐dimer were obtained at the time of admission during COVID‐19 infection for all subjects. A written informed consent was obtained from all the subjects prior to a CMR scan. The study protocol was approved by the institutional ethics committee.
2.1. Cardiac MRI protocol
All the enrolled patients underwent CMR on a 3T MR scanner (Magnetom Skyra, Siemens, Healthineers, Germany). The MRI scanning protocol has been included in the supplementary appendix. CMR was done at baseline for all enrolled subjects and a follow‐up scan after 6 months was planned in individuals who had abnormal imaging findings on the initial scan.
2.2. CMR image analysis
The acquired CMR images were independently analyzed by two cardiac radiologists with 12 and 10 years of MRI diagnosis experience. Discrepancies in the analysis of the two radiologists were adjudicated by a senior radiologist having 20 years of experience in MRI diagnosis. The CMR images were post‐processed and cardiac chamber volumes, mass, and function were measured using software‐based automated cardiac contour detection along with manual correction if required. All the image sequences were analyzed as per the 16‐segment model proposed by the American Heart Association (AHA). 13 The location as well as the pattern (epicardial, mid‐wall, or transmural) of LGE were assessed independently by two observers. The global T1/T2 values were computed by manually delineating the entire LV myocardium on the T1/T2 map. Myocardial edema was evaluated on the T2‐weighted images as per the 16‐segment AHA model. A region of interest was drawn in the affected area and was divided by the signal intensity in the skeletal muscle. Myocardial edema ratio (ER) was defined as the ratio between myocardial signal intensity (SI) to skeletal muscle SI with an ER > 2.0 was considered abnormal. 14 , 15 Myocarditis was diagnosed based on the 2018 revised Lake Louis criteria (LLC) 16 in the presence of both of the main criteria: (1) myocardial edema (T2 mapping or T2 dark blood TIRM‐Sequences) and (2) non‐ischemic myocardial injury (abnormal T1, ECV, or LGE).
2.3. Statistical analysis
Continuous data were expressed as mean ± standard deviation (SD) while categorical data were represented as proportions. The normality of distribution was assessed using the using Shapiro‐Wilk test. Comparison of means of continuous variables was done using Student's t‐test or Mann‐Whitney U test as appropriate while Fisher exact test or χ2 test was used for categorical variables. In addition, ANOVA or Kruskal Wallis was used to compare mean values of continuous variables between the three groups based on the severity of COVID‐19. A two‐sided p‐value of <.05 was considered to be statistically significant. SPSS version 24.0 (IBM Corp, Armonk, NY) and GraphPad Prism version 8.0.0 (GraphPad Software, San Diego, CA) software were used for statistical analysis.
3. RESULTS
A total of 30 COVID‐19 recovered patients were included in the final analysis (Figure 1: Central figure). The mean age of the enrolled patients was 40.6 ± 12.4 years and the cohort mostly comprised of males (18; 60%). Among the healthy controls, the mean age was 39.2 ± 5.3 years. The mean duration from discharge to cardiac MRI examination was 62.3 ± 21.8 days. All the patients were symptomatic at the time of cardiac MRI examination with chest pain in 18 (60%), shortness of breath in 8 (13.3%), palpitations in 5 (16.7%), and dizziness in 2 (6.7%) being the predominant symptoms. None of the patients had typical anginal symptoms or syncope. Co‐morbidities such as diabetes mellitus, hypertension, and bronchial asthma were reported in 6 (20%), 2 (6.7%), and 1 (3.3%) patient, respectively. During the index COVID‐19 hospitalization, fever, cough, and dyspnea were the predominant symptoms observed in 24 (80%), 18 (60%), and 17 (56.7%) patients, respectively. The mean duration of hospital stay was 12.5 ± 7.9 days. Of the 30 patients, 11 (36.7%) were diagnosed as mild, 6 (20%) as moderate, and 13 (43.3%) as severe COVID‐19 infection based on the NIH severity classification. 17 In this group of patients, 2 (6.7%) underwent mechanical ventilation and 1 (3.3%) required noninvasive ventilation with positive airway pressure. Oxygen supplementation was required in 19 (63.3%) patients with high flow nasal cannula (HFNC) in 3 (10%). Therapy for COVID‐19 included broad‐spectrum antibiotics in all patients, corticosteroids and anticoagulation in 21 (70%) patients each, antivirals such as Remdesivir in 19 (63.3%), antiplatelets in 10 (30%), and immunomodulators such as Tocilizumab in one patient (3.3%). The laboratory parameters and demographic profile have been reported in Table 1.
FIGURE 1.
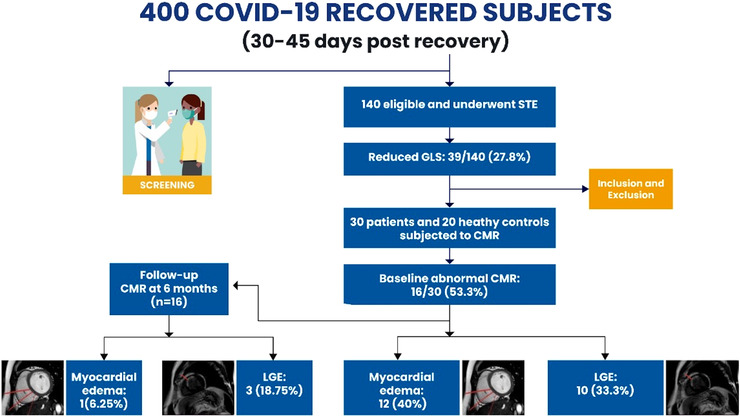
Central illustration of cardiac MRI (CMR) in 30 COVID‐19 recovered subjects. GLS, global longitudinal strain; LGE, late gadolinium STE, speckle tracking echocardiography.
TABLE 1.
Baseline demographic and laboratory parameters of COVID recovered subjects and healthy controlsCharacteristic
| COVID‐19 (n = 30) | Healthy controls (n = 20) | p‐value | |
|---|---|---|---|
| Age (years) | 40.6 ± 12.4 | 39.2 ± 5.3 | .14 |
| Male sex | 18 (60%) | 14 (46.7%) | .52 |
| Comorbidities | |||
| Hypertension | 2 (6.6%) | – | |
| Diabetes mellitus | 6 (20%) | – | |
| Bronchial asthma | 1 (3.3%) | – | |
| Duration of symptoms (days) | 5.2 ± 1.7 | – | |
| Duration of hospitalization (days) | 12.5 ± 7.9 | – | |
| Heart rate (per min) | 86.5 ± 13.8 | 87.7 ± 8.5 | .73 |
| Symptoms on admission | |||
| Fever | 24 (80%) | – | |
| Cough | 18 (60%) | – | |
| Dyspnea | 17 (56.7%) | – | |
| Sore throat | 5 (16.7%) | – | |
| Chest pain | 4 (13.3%) | – | |
| Fatigue | 8 (26.6%) | – | |
| Loss of smell | 2 (6.6%) | – | |
| Loss of taste | 3 (10%) | – | |
| Headache | 2 (6.6%) | – | |
| Post COVID‐19 symptoms | |||
| Chest Pain | 18 (60%) | – | |
| Palpitations | 5 (16.7%) | – | |
| Dyspnea | 8 (26.6%) | – | |
| Fatigue | 1 (3.3%) | – | |
| Dizziness | 2 (6.6%) | – | |
| Severity of COVID‐19 illness | |||
| Mild | 11 (36.7%) | – | |
| Moderate | 6 (20%) | – | |
| Severe | 13 (43.3%) | – | |
| Laboratory parameters | |||
| Hemoglobin (gm%) | 12.54 ± 2.03 | – | |
| TLC (per mm3) | 8510.33 ± 3328.29 | – | |
| Serum creatinine (mg/dl) | .65 ± .12 | – | |
| D‐dimer (μg/L) | 566.47 ± 444.47 | – | |
| CRP (mg/L) | 40.09 ± 46.42 | – | |
| IL‐6 (pg/ml) | 9.70 ± 11.44 | – | |
| Troponin T (μg/L) | 3.36 ± 9.04 | – | |
Abbreviations: CRP, C reactive protein; IL, interleukin; LDH, lactate dehydrogenase; TLC, total leukocyte count.
Bold in the table represent significance of the data.
3.1. CMR findings
A total of 480 myocardial segments of the 30 patients were evaluated. Sixteen patients of the 30 (53.3%) had abnormal CMR findings in terms of increased T2 signal and/or LGE (Figures 2 and 3). Myocardial edema was reported in 12 (40%) patients while 10 (33.3%) patients had LGE. The majority of the patients had a focal linear sub‐epicardial LGE (6/10; 60%) while patchy mid‐wall LGE was reported in 4 (40%) (Figure 3). Most of the LGE lesions were localized in the inferior, infero‐septal segments at base and mid‐LV cavity level. None of the subjects in the healthy controls had any LGE on CMR. A diagnosis of active myocarditis based on the revised LLC 16 was made in 7/30 (23.3%) individuals. In terms of conventional left ventricular CMR parameters such as LVEF, LV end diastolic volume (EDV), LV end systolic volume (ESV), and stroke volume (SV), there was no significant difference between patients who recovered from COVID‐19 and healthy controls (Table 2). However, COVID‐19‐recovered patients had significantly lower RVEF, RV SV, and RV cardiac index (CI) as compared to healthy controls. Follow‐up CMR was performed 6 months later in 16 subjects who had abnormal CMR findings. All these 16 patients had been on medical therapy comprising beta‐blockers and ACE inhibitors/ARBs. Of the 16 subjects, follow‐up scan was abnormal in four of them (25%) with LGE persisting in three individuals (Figure 4) while one had raised myocardial T2 value. Of the four patients with an abnormal CMR on follow‐up, three had severe COVID‐19 infection on initial presentation.
FIGURE 2.
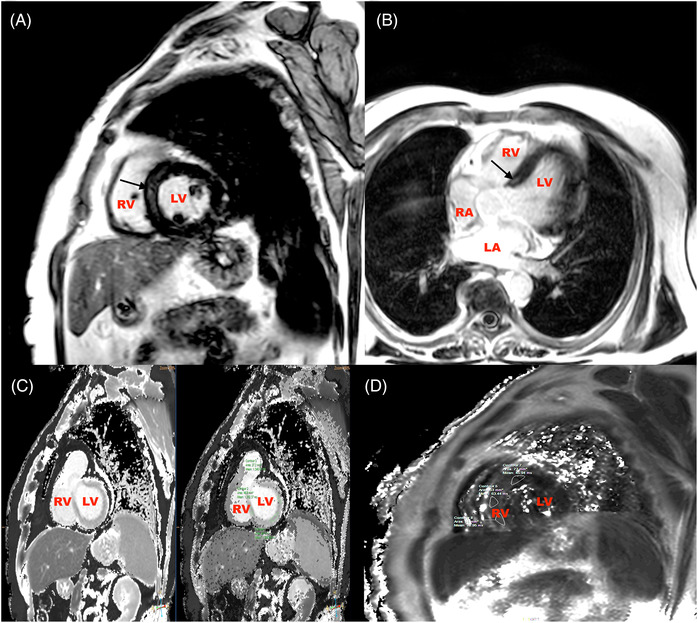
CMR images of a 52‐year‐old male post recovery from severe Covid‐19 showing mid myocardial scar at the basal septum (Figure 2A and B, black arrows) and elevated T1 and T2 values (Figure 2C and D). LA, left atrium; RA, right atrium; LV, left ventricle; RV, right ventricle.
FIGURE 3.
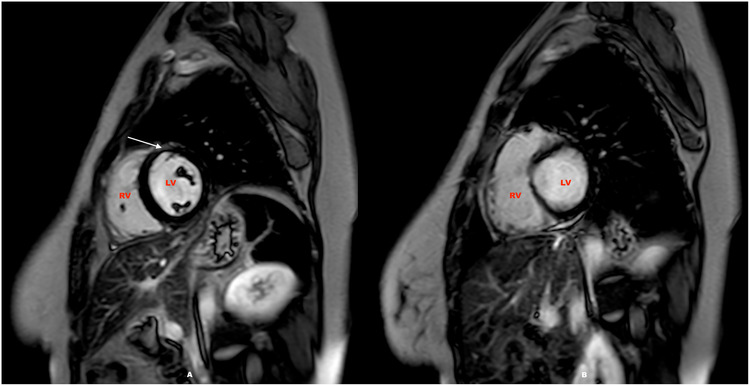
CMR scan of a 26‐year‐old healthcare worker following moderate Covid‐19 infection showing sub epicardial to mid myocardial scar in the mid anterior LV (Figure 3A, white arrow) along with mild pericardial effusion (Figure 3B). LV, left ventricle; RV, right ventricle.
TABLE 2.
Comparative evaluation of CMR parameters between COVID‐19 recovered subjects and healthy controls
| Cardiac MRI parameter | COVID‐19 (n = 30) | Healthy Controls (n = 20) | p‐value |
|---|---|---|---|
| Left ventricle | |||
| EF (%) | 59.6 ± 6.4 | 64.5 ± 14.7 | .17 |
| EDV (ml) | 99.78 ± 30.39 | 103 ± 13.20 | .658 |
| ESV (ml) | 38.83 ± 15.85 | 41.86 ± 9.58 | .447 |
| SV (ml) | 58.3 ± 16.5 | 61.1 ± 8.4 | .49 |
| CO (L/min) | 4.45 ± 1.21 | 5.33 ± .72 | .005 |
| CI (L/min/m2) | 2.57 ± .69 | 3.33 ± .66 | .0001 |
| Myocardial native T1 (ms) | 1284.04 ± 43.86 | 1147.6 ± 68.4 | .0001 |
| Myocardial native T2 (ms) | 50.8 ± 16.7 | 42.6 ± 3.6 | .04 |
| Right ventricle | |||
| EF (%) | 48.03 ± 11.85 | 56.51 ± 8.54 | .008 |
| EDV (ml) | 76.92 ± 39.78 | 107.88 ± 13.40 | .002 |
| ESV (ml) | 40.37 ± 33.13 | 47.24 ± 12.65 | .382 |
| SV (ml) | 35.17 ± 17.95 | 60.64 ± 10.85 | .0001 |
| CO (L/min) | 2.73 ± .97 | 5.27 ± .79 | .0001 |
| CI (L/min/m2) | 1.57 ± .54 | 3.29 ± .62 | .0001 |
Abbreviations: CI, cardiac index; CO, cardiac output; EDV, end‐diastolic volume; EF, ejection fraction; ESV, end‐systolic volume; L, liters; min, minute; mL, milliliters; ms, milli‐second; SI, stroke index; SV, stroke volume.
Bold in the table represent significance of the data.
FIGURE 4.
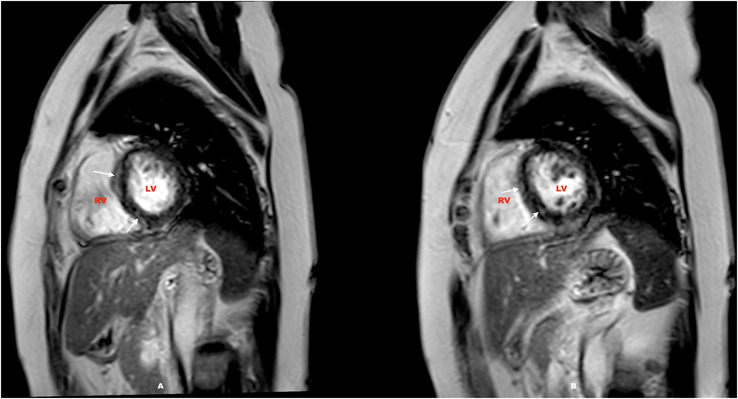
CMR scan of a 47‐year‐old recovered from severe Covid‐19 with hyper intensity indicating enhancement on LGE sequence in the sub epicardial at the basal septal and mid myocardial in the inferoseptal wall on short axis views with raised T1 and T2 values were suggestive of post covid myocarditis (Figure 4A, white arrows). Follow‐up scan done 6 months later reporting patchy sub‐epicardial LGE (Figure 4B, white arrows). LV, left ventricle; RV, right ventricle.
3.2. Results of native T1 and T2 mapping
Using the 2SD above the mean T1 (1284.4 ms) and T2 (49.8 ms) values of the healthy controls as a cut‐off, raised T1 was reported in 16 (53.3%) patients and raised T2 in 12 (40%) patients. Myocardial T1 (1284 ± 43.8 ms vs. 1147.6 ± 68.4 ms; p < .0001) and T2 values (50.8 ± 16.7 ms vs. 42.6 ± 3.6 ms; p = .04) were significantly higher among post COVID‐19 recovered subjects as compared to healthy controls (Table 2). Additionally, subjects with abnormal CMR findings had significantly higher myocardial T1 (1301.04 ± 42.19 ms vs. 1264.62 ± 38.41 ms; p = .022) and T2 values (55.62 ± 21.85 ms vs. 45.25 ± 3.02 ms; p = .004) as compared to those with normal CMR findings (Table 3).
TABLE 3.
Comparative evaluation between COVID‐19 recovered subjects with abnormal and normal CMR
| Abnormal CMR (n = 16) | Normal CMR (n = 20) | p‐value | |
|---|---|---|---|
| Age (years) | 41.9 ± 14.1 | 39 ± 10.2 | .749 |
| Male sex | 10 (62.5%) | 8 (40%) | .73 |
| Severity of COVID‐19 illness | |||
| Mild | 4 (25%) | 7 (35%) | .27 |
| Moderate | 3 (18.7%) | 3 (15%) | |
| Severe | 9 (56.2%) | 4 (20%) | |
| Laboratory parameters | |||
| Hemoglobin (gm%) | 12.21 ± 1.75 | 12.90 ± 2.32 | .129 |
| TLC (per mm3) | 10245.63 ± 3091.05 | 6527.14 ± 2396.89 | .003 |
| CRP (mg/L) | 43.20 ± 40.13 | 36.54 ± 54.08 | .28 |
| IL‐6 (pg/ml) | 11.37 ± 12.71 | 7.80 ± 9.92 | .205 |
| D‐dimer (μg/L) | 394.57 ± 192.72 | 716.88 ± 545.93 | .044 |
| Troponin T (μg/L) | .49 ± 1.00 | 5.88 ± 11.95 | .012 |
| Cardiac MRI parameter | |||
| Left ventricle | |||
| EF (%) | 60.8 ± 14.5 | 68.6 ± 14.2 | .195 |
| EDV (ml) | 105.98 ± 31.93 | 92.69 ± 27.96 | .237 |
| ESV (ml) | 42.05 ± 14.38 | 35.14 ± 17.15 | .653 |
| SV (ml) | 59.78 ± 17.62 | 56.70 ± 15.73 | .683 |
| CO (L/min) | 4.36 ± 1.35 | 4.55 ± 1.05 | .009 |
| CI (L/min/m2) | 2.51 ± .78 | 2.62 ± .60 | .001 |
| Myocardial native T1 (ms) | 1301.04 ± 42.19 | 1264.62 ± 38.41 | .022 |
| Myocardial native T2 (ms) | 55.62 ± 21.85 | 45.25 ± 3.02 | .004 |
| Right ventricle | |||
| EF (%) | 47.75 ± 10.98 | 48.35 ± 13.20 | .018 |
| EDV (ml) | 72.71 ± 28.53 | 81.72 ± 50.43 | .0001 |
| ESV (ml) | 37.08 ± 16.03 | 44.12 ± 46.09 | .007 |
| SV (ml) | 35.03 ± 19.55 | 35.33 ± 16.67 | .965 |
| CO (L/min) | 2.56 ± .75 | 2.92 ± 1.17 | .321 |
| CI (L/min/m2) | 1.46 ± .40 | 1.70 ± .67 | .237 |
Abbreviations: CRP, C reactive protein; CI, cardiac index; CO, cardiac output; EDV, end‐diastolic volume; EF, ejection fraction; ESV, end‐systolic volume; IL, interleukin; L, liters; LDH, lactate dehydrogenase; min, minute; ml, milliliters; ms, milli‐second; SI, stroke index; SV, stroke volume; TLC, total leukocyte count.
Bold in the table represent significance of the data.
3.3. CMR parameters based on severity of COVID‐19 illness
A significant proportion of severe COVID‐19 patients had abnormalities on CMR as compared to mild and moderate cases. Subjects with severe COVID‐19 infection had greater frequency of LGE and myocardial edema as compared to mild and moderate cases. Similarly, severe COVID‐19 subjects had greater frequency of raised T1 and T2 values (Table 4). In terms of the conventional CMR parameters, there was a significant difference in only LVEF, LVEDV among the three groups based on severity of COVID‐19 illness (Table 4). Myocardial native T1 values of severe COVID‐19 patients were significantly higher as compared to mild and moderate COVID‐19 patients (mild: 1253.9 ± 35.6 ms vs. moderate: 1283.2 ± 37.6 ms vs. severe: 1309.9 ± 38.1 ms; p = .007). Similarly, myocardial native T2 values of severe COVID‐19 patients were also significantly higher as compared to mild and moderate COVID‐19 patients (mild: 44.1 ± 1.5 ms vs. moderate: 48.5 ± 6.1 ms vs. severe: 57.4 ± 23.8 ms; p = .002).
TABLE 4.
Comparison between the three groups based on severity of illness
| Mild (n = 11) | Moderate (n = 6) | Severe (n = 13) | p‐value | |
|---|---|---|---|---|
| Age (years) | 45.18 ± 15.67 | 34.33 ± 7.55 | 39.54 ± 10.08 | .341 |
| Male sex (%) | 6 (54.5%) | 4 (66.7%) | 8 (61.5%) | .878 |
| NIV (%) | 0 (0%) | 0 (0%) | 1 (7.7%) | .50 |
| Mechanical ventilation (%) | 0 (0%) | 0 (0%) | 2 (15.3%) | .24 |
| Laboratory parameters | ||||
| Haemoglobin (gm%) | 12.37 ± 2.30 | 12.93 ± 1.96 | 12.50 ± 1.95 | .72 |
| TLC (per mm 3 ) | 7540.91 ± 2698.54 | 7015.00 ± 2689.92 | 10020.77 ± 3638.17 | .012 |
| Serum creatinine (mg/dl) | .65 ± .11 | .71 ± .12 | .64 ± .14 | .433 |
| D‐dimer (μg/L) | 476.64 ± 519.95 | 535.77 ± 346.48 | 797.67 ± 482.36 | .003 |
| CRP (mg/L) | 20.82 ± 37.09 | 45.10 ± 54.80 | 54.09 ± 47.39 | .028 |
| IL‐6 (pg/ml) | 7.45 ± 9.22 | 8.08 ± 13.39 | 12.12 ± 10.97 | .021 |
| Ferritin (μg/L) | 418.03 ± 427.08 | 537.72 ± 435.76 | 585.57 ± 272.50 | .008 |
| LDH (U/L) | 342.55 ± 185.27 | 459.50 ± 71.65 | 523.69 ± 204.30 | .05 |
| Troponin T (μg/L) | .019 ± .008 | 2.12 ± 1.19 | 6.77 ± 13.16 | .179 |
| Cardiac MRI findings | ||||
| Abnormal CMR (%) | 4 (36.4%) | 3 (50%) | 9 (69.2%) | .26 |
| Myocardial oedema (%) | 2 (18.2%) | 2 (33.3%) | 8 (61.5%) | .09 |
| LGE (%) | 1 (9.1%) | 2 (33.3%) | 7 (53.8%) | .06 |
| Raised T1 (%) | 4 (36.4%) | 4 (66.7%) | 8 (61.5%) | .35 |
| Raised T2 (%) | 2 (18.2%) | 2 (33.3%) | 8 (61.5%) | .09 |
| Cardiac MRI parameter | ||||
| Left ventricle | ||||
| EF (%) | 76.36 ± 8.74 | 69.33 ± 14.97 | 52.23 ± 8.04 | .0001 |
| EDV (ml) | 85.24 ± 28.11 | 95.61 ± 16.99 | 114.0 ± 32.12 | .031 |
| ESV (ml) | 34.11 ± 15.65 | 38.26 ± 17.60 | 43.07 ± 15.28 | .314 |
| SV (ml) | 50.06 ± 10.91 | 57.18 ± 14.31 | 65.88 ± 18.78 | .06 |
| Myocardial native T1 (ms) | 1253.96 ± 35.64 | 1283.22 ± 37.62 | 1309.87 ± 38.06 | .007 |
| Myocardial native T2 (ms) | 44.15 ± 1.54 | 48.55 ± 6.09 | 57.43 ± 23.78 | .002 |
| Right ventricle | ||||
| EF (%) | 50.90 ± 6.93 | 56.83 ± 10.72 | 41.53 ± 12.63 | .738 |
| EDV (ml) | 67.21 ± 32.96 | 86.76 ± 33.45 | 80.58 ± 47.99 | .263 |
| ESV (ml) | 31.24 ± 15.68 | 35.75 ± 16.92 | 50.23 ± 46.23 | .251 |
| SV (ml) | 34.80 ± 19.0 | 50.85 ± 24.31 | 28.25 ± 7.56 | .763 |
Abbreviations: μg, microgram; CI, cardiac index; CO, cardiac output; CRP, C reactive protein; EDV, end‐diastolic volume; EF, ejection fraction; ESV, end‐systolic volume; IL, interleukin; L, liters; LDH, lactate dehydrogenase; min, minute; ml, milliliters; ms, milli‐second; SI, stroke index; SV, stroke volume; TLC, total leukocyte count.
Bold in the table represent significance of the data.
4. DISCUSSION
The present prospective study evaluated the presence of myocardial injury and subclinical myocardial dysfunction using CMR in COVID‐19 recovered subjects. The major findings of our study were the presence of abnormal CMR in 16 (53.3%) patients who had recently recovered from COVID‐19. A significant proportion of patients had either raised T2 (40%) and/or LGE (33.3%). These findings persisted even on follow‐up (13.3% of patients had abnormal CMR scan at 6 months). These findings are important as myocardial injury and subclinical cardiac involvement is not well elucidated and is often overlooked in patients who have recovered from COVID‐19 infection. The authors have earlier reported sub‐clinical left ventricular dysfunction in one‐third of COVID‐19 recovered subjects using STEs. 4
Previous studies have reported variable myocardial inflammation in heterogenous group of COVID‐19 recovered subjects. 8 , 11 In our study, an abnormal CMR was reported in 16 (53.3%) subjects recovered from COVID‐19. This figure is considerably lower as compared to those previously reported by Puntmann et al. 8 (78%). The population group studied by Puntmann et al. 8 markedly differs from ours in terms of inclusion of large number of patients with various comorbidities such as diabetes mellitus, hypertension, coronary artery disease that may have otherwise contributed to the ongoing inflammation. Our study addresses all the limitations of previous studies including incorporation of both the conventional parameters such as LGE and T2WI as well as T1 and T2 mapping.
Myocardial involvement has been one of the important findings in COVID‐19 infection as assessed by raised cardiac troponins, CMR, and autopsy. In our study, myocardial involvement based on CMR findings of LGE and myocardial edema was seen in more than 50% of the patients recovering from COVID‐19 infection. The presence of LGE in CMR denotes tissue inflammation, necrosis, and early fibrosis. CMR findings in acute COVID‐19 infection have demonstrated the presence of LGE in a non‐ischemic distribution pattern. 18 As in subjects with other forms of viral myocarditis, LGE in acute COVID‐19 infection are often seen in the inferior and inferior‐lateral wall with most of the lesions being patchy sub‐epicardial in nature. 19 Similar findings were observed in our study too where the predominant distribution of LGE was sub‐epicardial involving inferior and infero‐septal segments at base and mid‐LV cavity level. Previous studies in other forms of viral myocarditis have documented the prognostic significance of LGE wherein it serves as an important predictor of mortality. 20 The areas of myocardial necrosis and fibrosis as evident by LGE on CMR in COVID‐19 might play an important role in genesis of ventricular arrhythmias as well as progressive LV remodeling and dysfunction over a longer period of time. The presence of LGE at baseline and its persistence on follow‐up CMR scans can contribute to risk stratification for future adverse outcomes after COVID‐19 infection. In our study, patients with myocardial edema and or LGE had significantly higher levels of cardiac troponins as compared to those with a normal scan. These findings provide important insights regarding the association of myocardial injury during index hospitalization and cardiac involvement in the convalescence phase of COVID‐19. Patients with acute cardiac injury are far more prone to develop myocardial fibrosis following recovery. Another important finding in our study was raised myocardial T1 and T2 values in COVID‐19 patients as compared to healthy controls. In our study, elevated T1 was reported in 53.3% while raised T2 was reported in 40% subjects. These findings are concurrent to those in the previous studies. 9 , 10 , 11 , 12 Elevated T2 values in CMR corresponds to the areas of myocardial edema while elevated T1 values reflect development of myocardial interstitial fibrosis. 21 , 22 These findings often reflect the inflammatory damage to the myocardium during active COVID‐19 infection or an ongoing low‐grade localized inflammation during the convalescent phase.
Severity of the initial COVID‐19 infection has an important bearing on the findings on CMR as seen in our study wherein subjects with severe COVID‐19 infection had significantly higher T1 and T2 values as compared to those with mild and moderate COVID‐19 infection. Additionally, these subjects had a higher proportion of LGE and myocardial edema on CMR. Severe COVID‐19 infection is characterized by higher levels of inflammatory markers and greater immune mediated myocardial damage leading to significantly higher T1 and T2 values as compared to those with mild and moderate disease. 11 Previous studies evaluating convalescent CMR findings among moderate or severe COVID‐19 infection have reported “myocarditis‐like pattern” of LGE in 26% and 45% patients respectively. 23 , 24 Contrarily, CMR data in athletes with asymptomatic or mild COVID‐19 infection have reported T1 and T2 values similar to the control population. 10 In our study, COVID‐19 recovered patients had evidence of right ventricular (RV) dysfunction on CMR as compared to healthy controls. RV dysfunction has an important bearing both on short as well long‐term outcomes. 25 , 26 Previous studies using CMR have reported RV dysfunction among COVID‐19 survivors 9 , 27 majority of which has been attributed to pulmonary fibrosis following lung injury and ARDS. Moderate and severe COVID‐19 infection has been associated with far greater RV dysfunction as compared to mild/asymptomatic cases. 27
4.1. Clinical implications and role in follow‐up
CMR serves as an important diagnostic modality in the evaluation of symptomatic COVID‐19 survivors with cardiac symptoms. Though the use of CMR as a routine investigation in COVID‐19 recovered subjects is not possible, it does provide important insights especially in detection of myocardial involvement in affected individuals. Since, inflammation, LGE and fibrosis play an important role in the development of dilated cardiomyopathy, it is all the more prudent to follow‐up COVID‐19 recovered patients with an abnormal baseline CMR. There is limited data regarding follow‐up CMR imaging in recovered COVID‐19 patients. In our study, one‐fourth of patients with an abnormal baseline CMR had persistent abnormalities even after 6 months of follow‐up. Of the four subjects, three had persistent LGE while one had a raised myocardial T2 value. Similar findings were observed among 27 patients with COVID‐19 wherein 29% had persistent cardiac involvement on CMR at 6 months of follow‐up. 28 There is a need for longer follow‐up studies to determine the clinical impact in terms of cardiac dysfunction or electrophysiological abnormalities over a period of time in these subjects.
4.2. Study limitations
One of the important limitations of the study is the modest sample size and the heterogeneity of population group studied. Since a significant proportion of severe COVID‐19 patients succumb to the illness, patients surviving COVID‐19 infection might not reflect the true severity of the disease leading to a survival bias. Further, a longer duration of follow‐up is needed to determine the sequence of evolution of CMR changes in COVID‐19 recovered subjects and long‐term prognostic implications.
5. CONCLUSION
The findings from our study reveal that there is an unmet need for close monitoring of cardiovascular status in COVID recovered subjects. CMR serves as an important and sensitive imaging modality in detection of cardiac involvement in patients with COVID‐19. Findings such as myocardial edema or LGE points towards systemic inflammation mediated myocardial damage. All the more presence of fibrosis and/or edema calls for follow‐up cardiac imaging in form to CMR to detect long term outcomes in COVID‐19.
CONFLICT OF INTEREST
Authors have no conflicts of interest to declare
Supporting information
Supporting information
Kunal S, Bagarhatta P, Palleda GM, et al. Role of cardiovascular magnetic resonance imaging in COVID‐19 recovered patients: A short‐term follow‐up study. Echocardiography. 2022;39:1401–1411. 10.1111/echo.15466
REFERENCES
- 1. Zhou P, Yang XL, Wang XG, et al. A pneumonia outbreak associated with a new coronavirus of probable bat origin. Nature. 2020;579:270‐273. [DOI] [PMC free article] [PubMed] [Google Scholar]
- 2. Nishiga M, Wang DW, Han Y, et al. COVID‐19 and cardiovascular disease: from basic mechanisms to clinical perspectives. Nat Rev Cardiol. 2020;17:543‐558. [DOI] [PMC free article] [PubMed] [Google Scholar]
- 3. Kunal S, Madan M, Tarke C, et al. Emerging spectrum of post‐COVID‐19 syndrome. Postgrad Med J. 2022;98:633‐643. [DOI] [PubMed] [Google Scholar]
- 4. Mahajan S, Kunal S, Shah B, et al. Left ventricular global longitudinal strain in COVID‐19 recovered patients. Echocardiography. 2021;38:1722‐1730. [DOI] [PMC free article] [PubMed] [Google Scholar]
- 5. Shi S, Qin M, Shen B, et al. Association of cardiac injury with mortality in hospitalized patients with COVID‐19 in Wuhan, China. JAMA Cardiol. 2020;5:802‐810. [DOI] [PMC free article] [PubMed] [Google Scholar]
- 6. Kunal S, Sharma SM, Sharma SK, et al. Cardiovascular complications and its impact on outcomes in COVID‐19. Indian Heart J. 2020;72:593‐598. [DOI] [PMC free article] [PubMed] [Google Scholar]
- 7. Emrich T, Halfmann M, Schoepf UJ, et al. CMR for myocardial characterization in ischemic heart disease: state‐of‐the‐art and future developments. Eur Radiol Exp. 2021;5:14. [DOI] [PMC free article] [PubMed] [Google Scholar]
- 8. Puntmann VO, Carerj ML, Wieters I, et al. Outcomes of cardiovascular magnetic resonance imaging in patients recently recovered from coronavirus disease 2019 (COVID‐19). JAMA Cardiol. 2020;5:1265‐1273. [DOI] [PMC free article] [PubMed] [Google Scholar]
- 9. Huang L, Zhao P, Tang D, et al. Cardiac involvement in patients recovered from COVID‐2019 identified using magnetic resonance imaging. J Am Coll Cardiol Img. 2020;13:2330‐2339. [DOI] [PMC free article] [PubMed] [Google Scholar]
- 10. Starekova J, Bluemke DA, Bradham WS, et al. Evaluation for myocarditis in competitive student athletes recovering from coronavirus disease 2019 with cardiac magnetic resonance imaging. JAMA Cardiol. 2021;6:945‐950. [DOI] [PMC free article] [PubMed] [Google Scholar]
- 11. Pan C, Zhang Z, Luo L, et al. Cardiac T1 and T2 mapping showed myocardial involvement in recovered COVID‐19 patients initially considered devoid of cardiac damage. J Magn Reson Imaging. 2021;54:421‐428. [DOI] [PMC free article] [PubMed] [Google Scholar]
- 12. Wang H, Li R, Zhou Z, et al. Cardiac involvement in COVID‐19 patients: mid‐term follow up by cardiovascular magnetic resonance. J Cardiovasc Magn Reson. 2021;23:14. [DOI] [PMC free article] [PubMed] [Google Scholar]
- 13. Cerqueira MD, Weissman NJ, Dilsizian V, et al. American heart association writing group on myocardial segmentation and registration for cardiac imaging. standardized myocardial segmentation and nomenclature for tomographic imaging of the heart. A statement for healthcare professionals from the cardiac imaging committee of the council on clinical cardiology of the American heart association. Int J Cardiovasc Imaging. 2002;18:539‐542. [PubMed] [Google Scholar]
- 14. Luetkens JA, Doerner J, Thomas DK, et al. Acute myocarditis: multiparametric cardiac MR imaging. Radiology. 2014;273:383‐392. [DOI] [PubMed] [Google Scholar]
- 15. Chaikriangkrai K, Abbasi MA, Sarnari R, et al. Prognostic value of myocardial extracellular volume fraction and T2‐mapping in heart transplant patients. JACC Cardiovasc Imaging. 2020;13:1521‐1530. [DOI] [PMC free article] [PubMed] [Google Scholar]
- 16. Ferreira VM, Schulz‐Menger J, Holmvang G, et al. Cardiovascular magnetic resonance in nonischemic myocardial inflammation: expert recommendations. J Am Coll Cardiol. 2018;72:3158‐3176. [DOI] [PubMed] [Google Scholar]
- 17. COVID‐19 Treatment Guidelines Panel . Coronavirus Disease 2019 (COVID‐19) Treatment Guidelines. National Institutes of Health. Accessed on March 19, 2022. Available at https://www.covid19treatmentguidelines.nih.gov/ [PubMed] [Google Scholar]
- 18. Petersen SE, Friedrich MG, Leiner T, et al. Cardiovascular magnetic resonance for patients with COVID‐19. JACC Cardiovasc Imag. 2022;15:685‐699. [DOI] [PMC free article] [PubMed] [Google Scholar]
- 19. Barssoum K, Victor V, Salem A, et al. Echocardiography, lung ultrasound, and cardiac magnetic resonance findings in COVID‐19: a systematic review. Echocardiography. 2021;38:1365‐1404. [DOI] [PMC free article] [PubMed] [Google Scholar]
- 20. Greulich S, Seitz A, Müller KAL, et al. Predictors of mortality in patients with biopsy‐proven viral myocarditis: 10‐year outcome data. J Am Heart Assoc. 2020;9:e015351. [DOI] [PMC free article] [PubMed] [Google Scholar]
- 21. Li H, Zhu H, Yang Z, et al. Tissue characterization by mapping and strain cardiac MRI to evaluate myocardial inflammation in fulminant myocarditis. J Magn Reson Imaging. 2020;52:930‐938. [DOI] [PubMed] [Google Scholar]
- 22. Hinojar R, Varma N, Child N, et al. T1 mapping in discrimination of hypertrophic phenotypes: hypertensive heart disease and hypertrophic cardiomyopathy: findings from the international T1 multicenter cardiovascular magnetic resonance study. Circ Cardiovasc Imaging. 2015;8:e003285. [DOI] [PubMed] [Google Scholar]
- 23. Kotecha T, Knight DS, Razvi Y, et al. Patterns of myocardial injury in recovered troponin‐positive COVID‐19 patients assessed by cardiovascular magnetic resonance. Eur Heart J. 2021;42:1866‐1878. [DOI] [PMC free article] [PubMed] [Google Scholar]
- 24. Knight DS, Kotecha T, Razvi Y, et al. COVID‐19: myocardial injury in survivors. Circulation. 2020;142:1120‐1122. [DOI] [PMC free article] [PubMed] [Google Scholar]
- 25. Rifaie O, Reda A, Hatata A, et al. Short‐term impact of COVID‐19 infection on right ventricular functions: single center observational study. Egypt Heart J. 2022;74:7. [DOI] [PMC free article] [PubMed] [Google Scholar]
- 26. Scudiero F, Silverio A, Muraca I, et al. Long‐term prognostic impact of right ventricular dysfunction in patients with COVID‐19. J Pers Med. 2022;12:162. [DOI] [PMC free article] [PubMed] [Google Scholar]
- 27. Lan Y, Liu W, Zhou Y. Right ventricular damage in COVID‐19: association between myocardial injury and COVID‐19. Front Cardiovasc Med. 2021;8:606318. [DOI] [PMC free article] [PubMed] [Google Scholar]
- 28. Wu X, Deng KQ, Li C, et al. Cardiac involvement in recovered patients from COVID‐19: a preliminary 6‐month follow‐up study. Front Cardiovasc Med. 2021;8:654405. [DOI] [PMC free article] [PubMed] [Google Scholar]
Associated Data
This section collects any data citations, data availability statements, or supplementary materials included in this article.
Supplementary Materials
Supporting information