

Abstract
Purpose
Coronavirus disease 2019 (COVID‐19) continues to threaten public health globally. Severe acute respiratory coronavirus type 2 (SARS‐CoV‐2) infection‐dependent alterations in the host cell signaling network may unveil potential target proteins and pathways for therapeutic strategies. In this study, we aim to define early severity biomarkers and monitor altered pathways in the course of SARS‐CoV‐2 infection.
Experimental Design
We systematically analyzed plasma proteomes of COVID‐19 patients from Turkey by using mass spectrometry. Different severity grades (moderate, severe, and critical) and periods of disease (early, inflammatory, and recovery) are monitored. Significant alterations in protein expressions are used to reconstruct the COVID‐19 associated network that was further extended to connect viral and host proteins.
Results
Across all COVID‐19 patients, 111 differentially expressed proteins were found, of which 28 proteins were unique to our study mainly enriching in immunoglobulin production. By monitoring different severity grades and periods of disease, CLEC3B, MST1, and ITIH2 were identified as potential early predictors of COVID‐19 severity. Most importantly, we extended the COVID‐19 associated network with viral proteins and showed the connectedness of viral proteins with human proteins. The most connected viral protein ORF8, which has a role in immune evasion, targets many host proteins tightly connected to the deregulated human plasma proteins.
Conclusions and Clinical Relevance
Plasma proteomes from critical patients are intrinsically clustered in a distinct group than severe and moderate patients. Importantly, we did not recover any grouping based on the infection period, suggesting their distinct proteome even in the recovery phase. The new potential early severity markers can be further studied for their value in the clinics to monitor COVID‐19 prognosis. Beyond the list of plasma proteins, our disease‐associated network unravels altered pathways, and the possible therapeutic targets in SARS‐CoV‐2 infection by connecting human and viral proteins. Follow‐up studies on the disease associated network that we propose here will be useful to determine molecular details of viral perturbation and to address how the infection affects human physiology.
Keywords: data integration, early severity biomarker, plasma proteome, SARS‐CoV‐2 infection, turkey patient profile
1. INTRODUCTION
The world has been under the influence of Coronavirus disease 2019 (COVID‐19) caused by the infection of severe acute respiratory coronavirus type 2 (SARS‐CoV‐2) since December 2019. COVID‐19 disease is categorized into five different grades based on the severity of the disease: asymptomatic, mild, moderate, severe, and critical [1]. COVID‐19 starts as a mild infection with upper respiratory tract infection symptoms. In some patients, the infection worsens and progresses into pneumonia by the end of the first week. If hypoxia with oxygen saturation (SpO2) below 94% develops, patients are categorized in the severe illness group [2]. Finally, the intensified inflammatory response in some patients may lead to progression of critical illness manifested by respiratory failure, multiple organ failure, and need of intensive care [3, 4]. The pathogenesis of the progression to critical disease is still not well characterized, and patients may become clinically critical rapidly and unexpectedly. Therefore, identification of potential indicators which can be used to predict severe or critical illness is crucial for the management of cases and preventing fatal outcomes.
Mass spectrometry‐based proteomics is a useful technology for detecting even subtle changes at the proteome level under different conditions [5, 6]. Several global proteomic studies were released to identify underlying proteome level changes in COVID‐19 [7, 8, 9] including plasma‐based proteomics [10, 11, 12, 13, 14, 15, 16, 17].
Plasma‐based proteomics is a non‐invasive approach to elucidate the disease progression in terms of proteins. The impact of SARS‐CoV‐2 on human physiology can be monitored as plasma contains disease‐related biomarkers circulating in the blood that are released from different organs [16]. Plasma‐based proteomics studies compared the proteomic changes after SARS‐CoV‐2 infection between patients and controls from a single measurement [9, 12–15, 18, 19] or with multiple measurements in a time‐dependent manner [10, 11, 17, 20]. In general, inflammatory response, immune system‐related proteins [9, 17], metabolic reconstitution, tissue repair‐related proteins, and regulators of coagulation [9, 21] have been shown to be deregulated after infection [10, 11].
On the other hand, many efforts have been made to develop antiviral drugs for the treatment since the beginning of the COVID‐19 pandemic. One approach is to repurpose existing FDA‐approved drugs to treat COVID‐19. Gordon et al. released 26 SARS‐CoV‐2 proteins and determined their interactions with host proteins by performing affinity purification. A total of 332 prominent viral‐host interactions were identified that include several druggable proteins [7].
In drug repurposing studies, identification of host–virus interactions is critical [7]. Therein lies the need to determine molecular details of the interaction between proteins of SARS‐CoV‐2 and host proteins and potential therapeutic targets. In an effort by the COVID‐19 Disease Map Community, a computational repository was released about COVID‐19 molecular mechanisms which include the perturbed pathways by the virus infection, drug target information, and disease network map [22].
In this study, we applied plasma‐based proteomics and identified a total of 1147 proteins from 52 COVID‐19 samples that are from patients with different severity grades and at different infection periods. We identified 111 significantly altered plasma proteins and constructed a COVID‐19 associated network orienting from viral proteins to host proteins and their downstream interactions. This network uncovers the highly connected SARS‐CoV‐2 proteins that perturb human plasma protein expression, eventually signaling mechanisms. As a result of our comprehensive comparison, we identified nine most commonly altered human proteins across six studies and presented their severity grade‐dependent expression profiles (moderate, severe, and critical) [9, 10, 11, 12, 13]. Our analyses also revealed potential biomarkers for the early prediction of the disease progression to the critical grade.
2. MATERIALS AND METHOD
2.1. Ethics statement
The study proposal was approved by the Ethics Committee of Koç University in December 2020 (No: 2020.273.IRB1.096).
2.2. Study population and sample collection
Thirteen adult patients who had a positive SARS‐CoV‐2 (Wuhan strain) nasopharyngeal PCR test and were diagnosed as COVID‐19 in Koç University Hospital and Vehbi Koç Foundation American Hospital, Turkey were included in the study (Figure 1A). Severity of the illness was determined according to WHO criteria and four moderate, three severe and six critical patients were categorized. None of the patients received antiviral therapy, or steroid therapy. IL‐6 receptor antagonist tocilizumab was used only for one critical patient (P9). Blood samples were collected at three different time periods after the onset of symptoms: during the early period of the SARS‐CoV‐2 disease course (1–5 days), virus replication is rapid, and innate immune response becomes active. This period is labeled as early infection. Five to 15 days after the onset of symptoms is labeled as an inflammatory response. With the initiation of inflammatory response and release of cytokines, various local and systemic reactions are seen during this period. After 15 days, the first negative PCR test from the nasal swab is labeled as the recovery phase.
FIGURE 1.
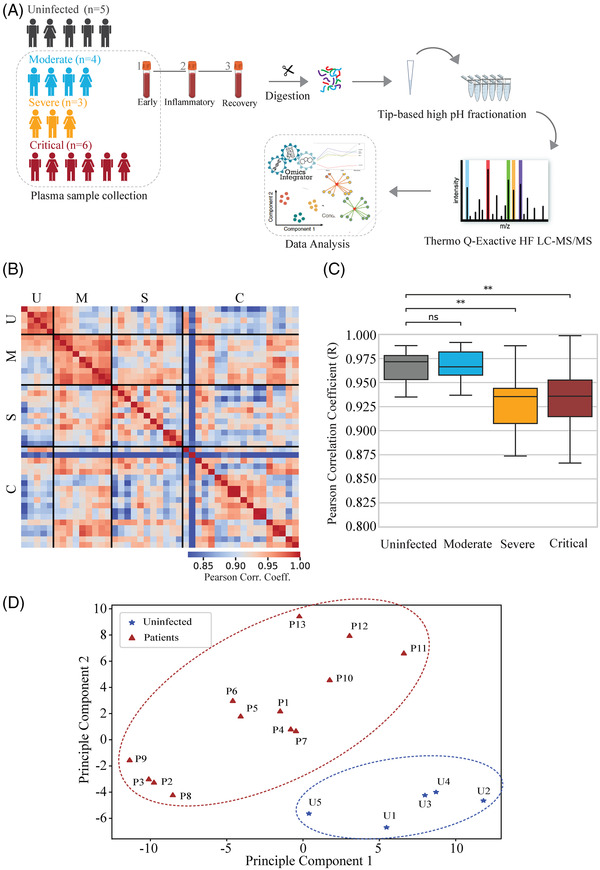
Global host proteome analysis of COVID‐19 patients in plasma. (A) Overview of the experimental outline and study cohort including five uninfected (black) individuals with single time point samples and 13 COVID‐19 patients (moderate: turquoise, severe: orange, and critical: brown) with three time point samples were collected after the onset of symptoms. (B) Pairwise Pearson correlation across all 52 proteome samples of uninfected individuals and COVID‐19 patients (red: high coefficients of variation, blue: low coefficients of variation). U, uninfected; M, moderate; S, severe; C, critical. (C) Pearson correlation coefficients of samples between severity grades (moderate, severe, and critical) and uninfected individuals. Kruskal–Wallis statistical test was used for statistical analysis: 0.01 < *p < 0.05, **p < 0.01, ***p < 0.001. (D) PCA of COVID‐19 patients (red, triangular) (n = 13) and uninfected individuals (blue, star) (n = 5). COVID‐19, coronavirus disease 2019; ns, non‐significant; PCA, principal component analysis.
The control group comprised five uninfected individuals who have not had COVID‐19, influenza, or bacterial infection in the last 6 months and have no chronic disease (diabetes, MS, asthma, hypertension, etc.). A single blood sample was collected from uninfected volunteers. Then, the plasma of these blood samples was supplemented with %1 sodium deoxycholate (SDC) in 100 mM Tris pH 8.5 and stored at 80°C. Clinical and demographic data of the patients in detail is summarized in Supporting Information File 1.
2.3. In‐solution protein digest of plasma samples
For protein isolation, plasma samples were boiled at 95°C for 10 min after adding 1% SDC buffer (%1 SDC in 100 mM Tris pH 8.5 containing complete EDTA‐free protease inhibitor mixture [0.5 tablets for 5 mL]). Then, samples were cooled on ice and sonicated in a water bath ultrasonicator for 2 min at 50% cycle duty. The protein concentration of the samples was measured using the BCA assay (Pierce, Thermo Fisher Scientific). Protein disulfide bond reduction and cysteine alkylation were performed using TCEP (tris(2‐carboxyethyl)phosphine) and 40 mM 2‐chloroacetamide for 5 min at 45°C at 1000 rpm. After reduction and alkylation, tryptic digestion was done using 1:50 trypsin (enzyme:protein amount) at 37°C overnight. Tryptic digestion was stopped by acidification with 0.1% trifluoroacetic acid (TFA). Samples were dried by SpeedVac and stored at −20°C.
2.4. Peptide desalting using SDB‐RPS (styrenedivinylbenzene‐reverse phase sulfonate) stage tips
Stage tips were prepared by placing three discs of SDB‐RPS cartridge per sample. The stage tips were conditioned with 100 μL condition buffer (%1 TFA, %30 methanol). After the condition buffer, tips were washed twice with 100 μL wash buffer (%2 ACN, %0.2 TFA). Samples were dissolved in 100 μL loading buffer (1% v/v TFA in isopropanol). Reconstituted peptides were loaded onto SDB‐RPS tips. After samples passed through, tips were washed twice with a loading buffer and once with a wash buffer. Elution of the peptides from SDB‐RPS tips was done with 75 μL elution buffer (%1.25 NH4OH, %80 ACN) at 200g. Lastly, peptides were dried using SpeedVac and stored at −20°C.
Significance Statement
In this study, we aim to define early severity biomarkers by monitoring severity grades of COVID‐19 patients (moderate, severe, and critical) and periods of infection (early infection, inflammatory response, and recovery). We constructed a COVID‐19 associated network from 111 significantly deregulated human plasma proteins. By monitoring different severity grades (moderate, severe, and critical) and periods of disease (early, inflammatory, and recovery), CLEC3B, MST1, ITIH2, MB, and S100A9 were identified as potential early predictors of COVID‐19 severity. Besides the plasma proteomics, the network clearly shows their connectedness and additionally clinically important host targets and viral proteins. The most connected viral protein is ORF8 in the network. Our reconstructed disease network provides insight into how virus‐modulated signaling pathways lead to physiological changes in blood coagulation, complement activation, and lipid homeostasis.
2.5. High‐pH fractionation of samples
Samples were fractionated on‐tip using 15 mM ammonium hydroxide by high pH fractionation to reduce sample complexity and enhance proteome coverage. The dried peptides were reconstituted in a 50 μL loading buffer (15 mM ammonium hydroxide and 2% ACN, pH 10). Stage‐tips were prepared using five discs of C18 cartridges and equilibrated by sequential addition of the following solutions: 100% mass grade methanol, twice with 15 mM ammonium hydroxide buffer (pH 10, containing 60% ACN), and once with 15 mM ammonium hydroxide buffer (pH 10, containing 2% ACN) at 2500g. After column equilibration, reconstituted peptides were loaded, and flow‐through was collected as the first fraction. By increasing acetonitrile percentage, subsequent elution was done in increasing order of acetonitrile percentage (6–10–12–14–16–18–20–22–24–26–28–30–60–90% ACN). For the last fraction, 26–28–30–60–90% ACN fractions were combined. All fractions were dried using SpeedVac and stored at −20°C.
2.6. Data acquisition
For the data‐dependent shotgun proteomics approach, the collected 11 fractions were reconstituted in 20 μL MS loading buffer (5% FA and 5% ACN) and analyzed with 60 min linear gradients on an UltiMate 3000 RSLC‐nano reversed‐phase chromatographic platform (Thermo Fisher Scientific) coupled to a Q Exactive HF hybrid quadrupole‐Orbitrap mass spectrometer (Thermo Fisher Scientific). Five microliter of each fraction was injected onto EASY‐Spray LC Column 2 μm 75 μm 500 mm and run with a flow rate of 300 nL/min. The chromatographic separation of the peptides started at 4% of solution B (ACN with 0.1% FA) and gradually increased to 25% in 25 min. The gradient continued from 25% to 45% of solution B in the next 15 min. For the MS1 spectra acquisition, the resolution was set to 120,000, the automatic gain control (AGC) target to 3e6, and the maximum injection time to 100 ms. The top 20 most intense peptides per cycle (Top20) were selected for fragmentation in the higher‐energy collisional dissociation (HCD) cell with normalized collision energy (NCE) of 28. MS2 spectra acquisition was conducted at a resolution of 30,000, an AGC target of 1.2e3, a maximum injection time of 60 ms, and a fixed first mass of 100 m/z. Furthermore, the isolation window was set to 1.2 m/z, the dynamic exclusion set to 40 s, and the charge exclusion as unassigned, 1, 6–8, >8.
2.7. Data processing and analysis
Proteins were identified by Proteome Discoverer (PD) (v2.3, Thermo Scientific) using the SequestHT (Reference proteomes are Homo sapiens [UP000005640] and SARS‐CoV‐2 [NC‐045512‐2]). Trypsin was selected as a hydrolytic enzyme with a maximum number of allowed missed cleavages of 2. For peptide identification, a mass tolerance of ±10 ppm for precursor masses and ±0.02 Da for fragment mass tolerance was selected. Cysteine carbamidomethylation was set as fixed modification. Oxidation and phosphorylation were selected as dynamic modifications. The false discovery rate (FDR) for peptide and protein identifications was set to 1% and a filter was applied to allow for protein identifications with medium confidence. The peptide identification sequence length was set between 7 and 25 and with a peptide rank of a minimum of 1. PSM values were normalized sample‐wise by the mean of the commonly found abundant proteins (PSM > 200). Across all subjects, proteins that have over 60% missing values were excluded. Pearson correlation coefficients were calculated for the comparison by using Python scipy.stats (v 1.7.1) function. sklearn.decomposition was used for principal component analysis (PCA).
2.8. Statistical analysis
To demonstrate the variation between severity grades and uninfected individuals, correlation coefficients of each group were compared, using Kruskal–Wallis test with statannot.add_stat_annotation (v 0.2.3). Based on the severity grades, the plasma proteome of each patient group (moderate, severe, and critical) is tested against uninfected group. Significantly deregulated proteins between patient and uninfected groups were determined using Welch's t‐test (scipy.stats.ttest_ind [(v 1.7.1]). To adjust the p‐values, Benjamini–Hochberg correction was employed, utilizing scikit_posthocs.posthoc_ttest (v0.6.7). Due to the small cohort size, we only reported adjusted p‐values but continued our analysis with p‐values. We did not apply a cutoff for the fold change values. However, after applying the p‐value cutoff of 0.05, we observed log fold change values being greater than 0.3.
The level of differentially expressed proteins in moderate–severe and critical grades were compared (Welch's t‐test, p‐value < 0.05). The differentially expressed proteins in moderate–severe versus critical grades were compared with z scores , where xi denotes the log fold change of ith sample, μ the mean, and σ is the standard deviation of the samples) in early infection period (pairwise t‐test, scikit_posthocs.posthoc_ttest function [v 0.6.7]). Mean and standard deviation are calculated using uninfected samples in the early infection period. To measure the overlap between protein lists identified in this study and others, fisher.test (R: v 3.6.2) was employed, and the p‐values were adjusted using Bonferroni correction. For all statistical tests p‐value <0.05 is selected as significant.
2.9. Principal component analysis and hierarchical clustering
All samples were combined, and PCA was performed using sklearn.decomposition module. Out of the total 1147 proteins, taking at least 30% of all samples, 141 proteins were used for the PCA. Also, unsupervised clustering was applied sample‐wise on the COVID‐19 patient samples. For each severity grade, early infection, inflammatory response, and recovery samples were combined. Protein levels in each sample were normalized to their corresponding mean values in uninfected individuals. The subsequent clustering was performed using the linkage function of scipy.hierarchy module with “complete” weight method and “Canberra” distance metric. For the determination of statistically significant proteins across resulting clusters, Student's t‐test was applied (scipy.stats.ttest_ind [v 1.7.1]).
2.10. Gene Ontology (GO) annotation
GO enrichment of biological processes for the differentially expressed proteins in COVID‐19 conditions was analyzed in the “PANTHER” (v 16.0) platform with an FDR setting of 0.05 [23]. Reactome functional enrichment analysis on differentially expressed proteins obtained from the comparison of cluster 1 and cluster 2 was performed, utilizing the “g‐profiler” web tool [24]. Top 10 annotations were selected according to adjusted p values of each term. “PANTHER” platform was also used for the GO enrichment of biological processes for different network communities and ORF8 downstream protein list.
2.11. COVID‐19 network construction by integrating plasma proteins with the human interactome
To build the network of the differentially expressed proteins from patients and study their signaling network, Omics Integrator 2 (OI2) [25] software was used. OI2 applies the Prize‐Collecting Steiner Forest algorithm which is an algorithm to indicate relevant sub‐networks or pathways from a large background interactome. HIPPIE [26] human protein–protein reference interactome was utilized to map patients’ differentially expressed proteins into a network. The prize file was generated by taking the absolute value of log2 fold changes of protein expression levels. The interactome file was pre‐processed for the algorithm by calculating the cost value of each interaction from its corresponding confidence value (cost value = 1.5 − confidence value). The parameters of this algorithm were tuned and different w, b, and g values between 0 and 10 were examined. The Louvain clustering method [23] was employed to extract communities from the network. The subcellular localization of proteins was done with the help of OI2. Cytoscape (v3.8.2) was used for the visualization of the final network. The up‐stream virus–human interaction path was added by applying the NetworkX shortest_path function (v 2.6.2) between virus–human protein interaction data [7] and the plasma proteins network. FDA‐approved drug target interactions of the biomarker and kinase pathway related proteins were retrieved from DrugBank database [27].
3. RESULTS
3.1. Comparative analysis of plasma proteomes across severity grades in SARS‐CoV‐2 infection
We performed a label‐free quantitative analysis of blood samples of thirteen COVID‐19 patients and five uninfected individuals to find plasma proteome alterations. We grouped the patient samples in two dimensions: severity grade and time periods. The number of moderate‐, severe‐, and critical‐grade patients are four, three, and six, respectively (13 patients in total, Figure 1A). Multiple samples are retrieved from each patient at different infection time periods starting after the day of symptom onset: early infection (first 5 days after the onset of symptoms), inflammatory response (between day 5 and day 15 after the onset of symptoms), and recovery (15 days after the onset of symptoms which is confirmed by the first negative PCR test for SARS‐CoV‐2 from the nasal swab) periods. Clinical information about the patients and uninfected individuals is provided in Supporting Information File 1.
For a comprehensive analysis, we performed tryptic digestion of SDC treated plasma samples. The digested peptides were desalted using SDB‐RPS material to remove detergent and salts [28]. The peptides were then fractionated into 11 by performing tip‐based high pH pre‐fractionation [29, 30]. All fractions were analyzed in LC‐MS/MS and raw data were processed using PD (Figure 1A). As a result, we identified 1147 unique proteins from all samples with a FDR of 0.01.
In agreement with high reproducibility across 52 samples, we observed high pairwise correlation (Figure 1B). Notably, within severity grades, there are higher correlations than across severity grades (Figure 1C, Supporting Information Figure 1A–D). In each severity grade, commonly expressed proteins show high correlation (r > 0.9) within each severity grade, however, we note relatively higher variation within severe and critical grades compared to uninfected and moderate groups (Figure 1C). Based on the expression profiles of 141 commonly quantified proteins in plasma, uninfected individuals are grouped into a distinct cluster that is clearly separated from the COVID‐19 patients (Figure 1D).
To discover severity grade‐dependent plasma proteome changes in COVID‐19, we compared the protein levels between moderate, severe, and critical patients and uninfected individuals. Moderate patients and uninfected individuals revealed 60 differentially expressed proteins of which 12 are downregulated and 48 upregulated in response to SARS‐CoV‐2 infection (Supporting Information Figure S1E). The same comparison between uninfected and severe groups resulted in 55 differentiated proteins (10 downregulated and 45 upregulated) (Supporting Information Figure S1F). Comparison of critical patients with uninfected individuals yielded 11 downregulated and 50 upregulated proteins in critical patients (Supporting Information Figures S1G, S2).
Out of 1147 identified proteins, 111 differentially expressed proteins between patients and uninfected individuals were obtained (Supporting Information File 2), 15 of them were found to be differentially expressed in all stages (Supporting Information Figure S1H) that mainly function in the complement and coagulation cascades.
Considering the age difference between uninfected individuals and patient groups, we explored the association between SARS‐CoV‐2 infection and age affect by comparing 111 differentially expressed proteins in our study with 232 age‐related proteins that were collected from 33 independent studies [31]. Differences in COVID‐19 severity is highly related with the age [32]. Thus, 23 proteins are age‐dependent among the differentially expressed plasma proteins, including myoglobin (MB), ITIH2, CRP, and SAA1 (Supporting Information Table S1).
Several plasma proteomic datasets [9–15, 17, 19, 20] were accumulated since the pandemic has started. We compared our dataset with five COVID‐19 plasma proteome studies [9, 10, 11, 12, 13] to find consistent alterations across different datasets (Figure 2A, Supporting Information File 3). Our dataset (111 deregulated plasma proteins) significantly overlaps (57 proteins, p value < 2.2E‐16) with the COMBAT consortium dataset (153 deregulated blood proteins) (Figure 2A, Supporting Information Table S2), and 15 deregulated plasma proteins were also reported in Mohammed et al. which identified 31 plasma proteins in critical grade [17]. Our study revealed 35 additional plasma proteins deregulated with SARS‐CoV‐2 infection and not present in the explored studies (Figure 2A). These proteins include immunoglobulins, complement component 3, EE1A1, NRPS1, ANPEP, and MB, which primarily take roles in complement activation, humoral immune response, and immunoglobulin mediated immune response. Across all studies [9, 10, 11, 12, 13], the most common deregulated proteins are SAA2, SAA1, ITIH3, LBP, LGALS3BP, CFB CRP, and APOA1 (Figure 2C). We checked the most common deregulated proteins’ expression profiles at different severity grades. In addition to CRP, which is a commonly used inflammation marker in the clinic [33], the levels of SAA1, SAA2, ITIH3, and LBP increased in parallel to the severity of the disease. In comparison to uninfected individuals, levels of LGALS3BP, ITIH4, and CFB increase in all COVID‐19 patients independent from their severity grades. In contrast, APOA1 protein levels decrease in both moderate–severe and critical grades in comparison with uninfected individuals (Figure 2C).
FIGURE 2.
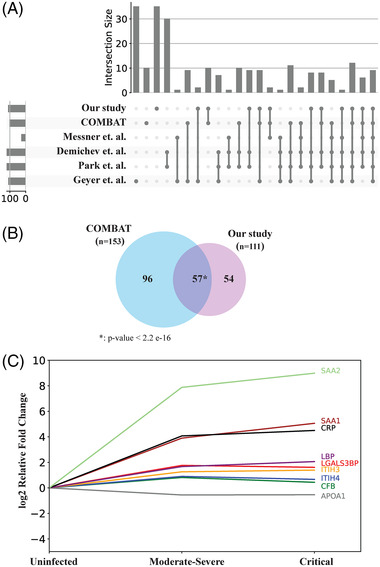
Analysis of significantly deregulated proteins in coronavirus disease 2019 (COVID‐19) stages. (A) Upset plot showing the comparison of 111 deregulated plasma proteins with the significantly regulated proteins found in other proteomics data sets. (B) Venn diagram showing the validation of 111 deregulated proteins with the 153 deregulated proteins in the COMBAT plasma‐based proteomics data sets. p‐value: 2.2 e‐16. (C) Protein expression level trends of nine overlapping proteins with other proteomics data sets in different severity grades. Protein names and their corresponding trends were similarly color coded.
3.2. Plasma proteome of critical patients intrinsically clustered in a distinct group than severe and moderate ones
Next, we investigated the proteomic trajectory of the infection by collecting samples at different days. We compared proteomic profiles of only patient samples during different SARS‐CoV‐2 time periods of the infection (early, inflammatory, and recovery). Out of 111 differentially expressed proteins, 96 were expressed in at least 30% of patient samples. The PCA of expression profiles of 96 proteins in COVID‐19 patient samples at different time periods divided the patients into two clusters (Figure 3A). As a result of this unsupervised clustering, critical patients are exclusively grouped into cluster 1 and the rest (severe and moderate cases) are located in cluster 2. Two critical cases (the inflammatory response and recovery samples) are exceptionally located in cluster 2. Importantly, we did not recover any grouping based on the infection period; they were rather scattered and grouped based on the severity grades (moderate, severe, and critical). This suggests the distinct proteomes of COVID‐19 patients even in the recovery phases. The heat map of all samples in cluster 1 and cluster 2 is shown Figure 3B.
FIGURE 3.
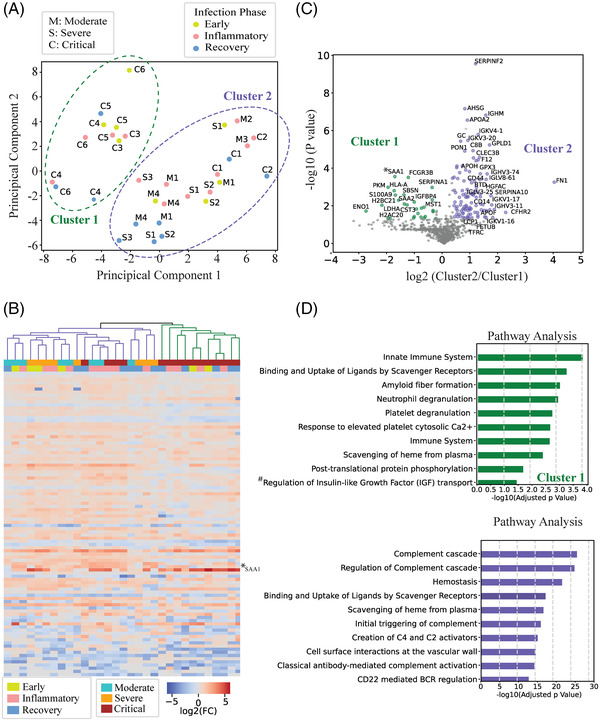
Stratification of COVID‐19 patients based on their plasma proteome profile. (A) PCA of COVID‐19 samples (M, moderate; S, severe; and C, critical) from different infection periods (early infection period: green, inflammatory response period: pink, and recovery period: blue). Biological variance showing each cluster profile. Cluster 1 (green) and cluster 2 (purple) are circled with dashed lines respectively. (B) Hierarchical clustering of COVID‐19 patients. *SAA1 – specific to critical patients’ cluster (cluster 1). (C) Volcano plot of deregulated proteins between cluster 1 and cluster 2. For statistical analysis of deregulated proteins, p‐value considered as 0.05. Student t‐test was applied for the statistical analysis. (D) Pathway analyses of proteins from cluster 1 and cluster 2, based on reactome annotation of g‐profiler website tool. Top 10 terms for each cluster were annotated and full annotation of a term marked with #: regulation of IGF transport and uptake by IGFBPs. COVID‐19, coronavirus disease 2019; IGF, insulin‐like growth factor; IGFBP, insulin‐like growth factor binding protein; PCA, principal component analysis; SAA1, serum amyloid A1.
We further investigated two resulting clusters and found significant expression differences between two clusters (Student's t‐test: p‐value < 0.05). A total of 134 significantly differentially expressed proteins are identified (28 are significantly over‐expressed in cluster 1, and 106 are significantly over‐expressed in cluster 2) (Figure 3C, Supporting Information File 4). Cluster 1 specific proteins were primarily involved in the pathways of the innate immune system, amyloid fiber formation, and neutrophil degranulation. While cluster 2 was enriched in the pathways of complement cascades, creation of C4 and C2 activators, and hemostasis (Figure 3D). Significantly over‐ or less‐expressed proteins between these two clusters may be clinically important to label the severity level of the infection.
3.3. Expression profile of early infection period samples of critical patients gives cues for severity biomarkers
Detection of prognostic biomarkers is important for the prediction of clinical phenotype of the patients. Only five proteins are differentially expressed in critical patients compared to moderate and severe ones (Figure 4A) which are also among the proteins separating the patients into two distinct clusters (Figure 3B, Supporting Information File 4). S100A9 and MST1 are significantly over‐expressed in cluster 1 while ITIH2 and CLEC3B are significantly over‐expressed in cluster 2 (Figure 3B). Because identification of proteins altering at the early infection time periods could be more beneficial to predict the disease progression, we analyzed expression trajectory of these five proteins at different infection periods in critical patients (Figure 4B). We observed that MB, S100A9, and MST1 protein levels are significantly increased at the early infection period while levels of CLEC3B and ITIH2 are decreased. MB and S100A9 expression levels continued to increase in the recovery phase while the level of MST1 decreased to almost the expression level of uninfected individuals.
FIGURE 4.
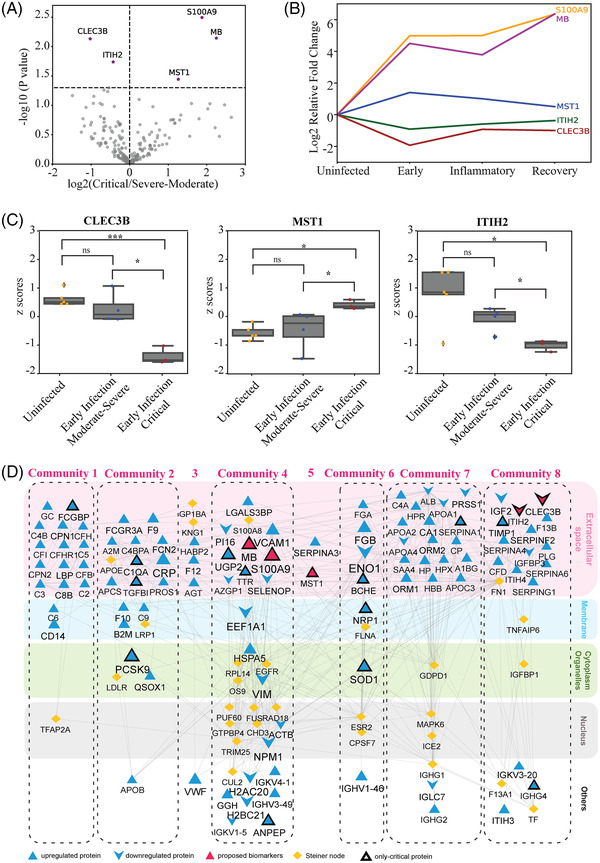
Detection of individual severity biomarkers for the early prediction of the disease progression and the interaction network of plasma proteins with SARS‐CoV‐2 proteins. (A) Volcano plot showing five deregulated proteins from the comparison of critical and moderate–severe severity grades. (B) Protein expression level trends of the biomarkers for critical patients during the course of the disease (early infection period, inflammatory infection period, and recovery period). MB: purple, S100A9: orange, MST1: blue, ITIH2: green, CLEC3B: brown. (C) Expression levels of MST1, ITIH2, and CLEC3B in the early infection period of the disease. For the statistical analysis pairwise t‐test with 0.05 p‐value cutoff was used. 0.01<*p < 0.05, **p < 0.01, ***p < 0.001. (D) Interaction network of deregulated proteins with addition of intermediate proteins found using OI2. Subcellular location of proteins was retrieved from OI2 and illustrated with color backgrounds. GO annotation of each Louvain cluster obtained from PANTHER. Expression values of network proteins were represented by shape and font sizes. Critical‐specific deregulated proteins and our proposed severity biomarker proteins were indicated by black border and pink color, respectively. Steiner nodes were represented as yellow. GO, Gene Ontology; MB, myoglobin; OI2, Omics Integrator 2; SARS‐CoV‐2, severe acute respiratory coronavirus type 2.
To test the severity biomarkers for the prediction of disease progression to critical stage, we compared early infection periods of critical patients to uninfected and severely moderate ones. Intriguingly, expression levels of all severity biomarkers excluding S100A9 and MB were significantly altered when comparing early periods of critical stage with severe–moderate ones (Figure 4C, Supporting Information Figure S3A, B). Therefore, we suggested that low CLEC3B, low ITIH2, and high MST1 can be potentially used for predicting the prognosis of critical COVID‐19 patients at the early period of the infection.
3.4. Network modeling of COVID‐19 associated plasma proteins and screening their potential drug targets
Beyond the list of deregulated plasma proteins, we elaborated into the connections between them and other intermediate proteins to reconstruct a perturbed interaction network of SARS‐CoV‐2 infection. We used Omics Integrator that connects the deregulated proteins to the network with the high confidence protein interactions either directly or by adding intermediate proteins [25]. We used the fold changes values of 111 proteins as the node weights and HIPPIE as the weighted reference interactome. A total of 102 out of 111 differentially expressed plasma proteins were present in the reference interactome. As a result, the integrated network is composed of 131 proteins (102 proteins from the proteomic analysis of plasma samples, 29 proteins as the intermediates) connected by 385 interactions. Recovering these proteins is important because the network modeling can add clinically important proteins at the reconstruction stage. Among the 29 intermediate proteins, TF, IGHG1, F13A1, FLNA, GP1BA, KNG1, S100A8, FN1, and APOE were found in at‐least one other COVID‐19 plasma proteomic studies [10, 11, 12, 13, 14, 15] despite being absent in our initial dataset.
Next, we topologically partitioned the reconstructed network into functionally related communities (Louvain community detection algorithm, Supporting Information File 5). We found eight communities and their corresponding enrichments in GO biological processes using Panther DB (Figure 4D). Significant pathways associated with the communities include complement activation, negative regulation by host of viral process, lipid transport, blood coagulation, apoptotic cell clearance, and neuron death. Components of complement system (C2, C3, C5, and C6) and complement factor proteins (CFB, CFI, CFH, and CFHR1) in community 1 mainly highlight the activation of the complement cascade pathway. Community 2 comprises a variety of biological pathways including complement activation. C‐reactive protein (CRP) which is widely used in clinics as a marker of inflammation [34] lies in Community 2. Community 3 is a sparse community, it contains AGT which has been shown to have correlation with viral load and tissue damage [11]. Community 4 is enriched in neutrophil aggregation and chronic inflammatory response pathways. Neutrophils are related to the uncontrolled pathological damage and play a key role in the pathogenesis of COVID‐19 [35]. Community 5 contains only two topologically distant proteins and Community 6 contains FGA, FGB, and ENO1 which are enriched in blood coagulation pathways. Additionally, it includes NRP‐1 protein which is known as the SARS‐CoV‐2 infectivity driver [36]. Community 7 contains apolipoproteins (APOA1, APOA2, APOA4, and APOC3) and is majorly enriched in the lipid transport pathway. Community 8 on the other hand contains SERPIN family proteins (SERPING1, SERPINA6, SERPINF2, and SERPINA4), which plays a significant role in complement and coagulation cascade pathway (Figure 4D). Together with the coagulation, the complement system is a conserved immunity component that is hyperactive in clinical cases of COVID‐19 [37]. Finally, the inter‐module connection in the disease network illustrates the crosstalk between different pathways that are highly relevant to the viral infection. Among them, innate immune response, lipid homeostasis, complement system regulation of ERK1 and ERK2 cascade, and blood coagulation are linked to each other.
We presumed that this reconstructed network is modulated by the virus proteins. To elucidate the proximity and connectedness of the virus proteins to human host proteins and eventually to the disease network, we applied a network‐based approach at the level of protein–protein interactions. The interaction analysis between SARS‐CoV‐2 and human proteins was used for this purpose [7]. We constructed a layered network where the core is the reconstructed disease network, the second shell is the human host proteins, and the third shell is the virus proteins. We note that the disease network contains the plasma proteins and the intermediate proteins. Out of 131 proteins only one, GGH, is a direct target of a virus protein (SARS‐CoV‐2 ORF8) [38]. GGH is a hydrolase and a key enzyme in metabolism. The rest is connected through 247 host proteins (host protein modules [M1–M27], green) that have a direct interaction with SARS‐CoV‐2 proteins (blue) (Figure 5A). This analysis shows that many viral proteins are one step away from the modulated network. The most connected viral protein to our reconstructed network is ORF8 that connects to 27 deregulated plasma proteins via 24 direct interactions with host proteins (Figure 5B). ORF8 is a rapidly evolving protein functioning in immune evasion [38], our analysis revealed that it primarily interacts with host proteins that function in blood coagulation and complement activation.
FIGURE 5.
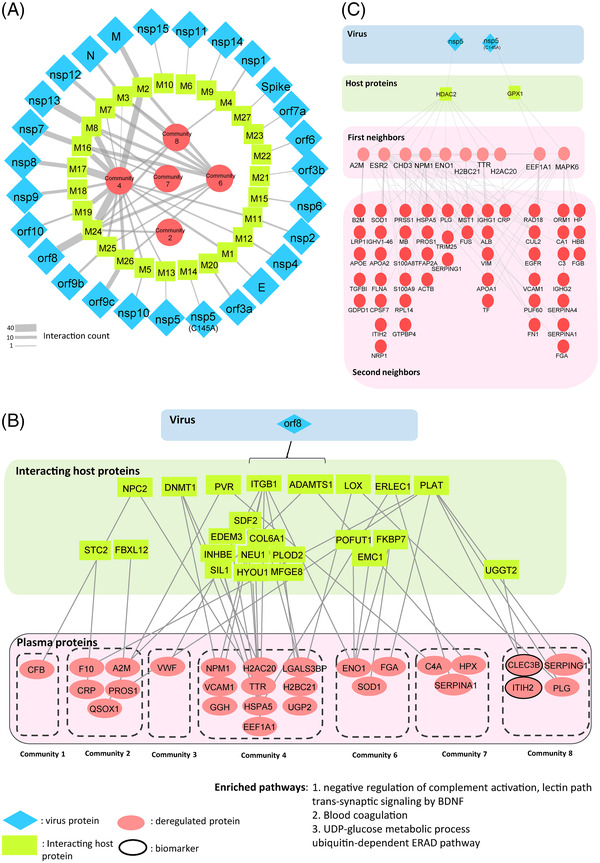
Analysis of plasma proteins interaction with severe acute respiratory coronavirus type 2 (SARS‐CoV‐2) proteins and drug targets. (A) Overall view from viral proteins (blue) to its downstream deregulated communities of proteins (red) intermediated by modules of host proteins (green). (B) The downstream plasma proteins of ORF8 SARS‐CoV‐2 virus protein through a module of interacting host proteins. Same color codes were used. (C) The downstream plasma proteins of NSP5 and NSP5(C145A) SARS‐CoV‐2 virus proteins through HDAC2 and GPX1 host proteins. Same color codes were used.
Among them, we elaborated more on a virus protein called the nucleocapsid protein 5 (NSP5) also known as SARS‐CoV‐2‐3CL since many antiviral drug candidates inhibit viral replication through NSP5 [39]. An oral antiviral drug candidate called PAXLOVID targets NSP5 by blocking its protease activity [40]. PAXLOVID was found to reduce the risk of death and hospitalization by almost 90% in adults [39, 40, 41]. We observed that NSP5 protein interacts with plasma proteins through HDAC2 and GPX1 host proteins. NSP5 interacts with a set of proteins that are topologically close to our COVID‐19 associated network (Figure 5C). NSP5 protein has the downstream sub‐network (Figure 5B) that may be targeted by potential drug candidates like PAXLOVID [39].
Lastly, the disease network may contain possible drug targets that are already used in the clinics. Considering the importance of the signaling pathways in regulating cellular functions in inflammation and metabolism [27], we focused on the signaling proteins. A total of 30 biomarker and kinase pathway related proteins were found among the network communities. Among these proteins nine of them are targets of at least one FDA‐approved drug or dietary supplement [27]. Supporting Information Figure S3C depicts the drug‐target interaction of these nine targets, some of which are dietary supplements including zinc, calcium, and copper that are binding to S100A9 and CLEC3B. In addition, anticoagulants and thrombolytic agents that bind to F10 and PLG; kinase inhibitors that target EGFR; and zinc cation that binds to S100A9 strike in this analysis.
4. DISCUSSION
In this study, we performed label‐free quantitative plasma proteomic analysis of COVID‐19 patients and identified 1147 plasma proteins. Despite its great potential in carrying biomarkers for disease prognosis and therapeutic monitoring [42] plasma proteomics is rather challenging due to its complex nature and its wide range of protein concentrations. In this study, through extensive fractionation, we were able to identify more than 1000 proteins without performing immune‐depletion against highly abundant plasma proteins. Interestingly, we observed that as the COVID‐19 severity grade increases the variation between patient plasma proteomes increases with a higher deviation in critical patients which supports the stable proteome profile of healthy individuals [43].
Expression of 111 proteins out of 1147 proteins is deregulated at COVID‐19 infection. We reconstructed a network using 111 differentially expressed proteins. Fifty‐seven of these deregulated proteins intersect with the 153 plasma proteins reported in the COMBAT cohort which validates our approach. Additionally, our reconstructed network and its close neighbors provide further commonalities with the COMBAT study (22 proteins) [9]. The signaling pathways are grouped into eight communities which are composed of significant pathways like blood coagulation, innate immune response, lipid homeostasis, complement activation, and neuron death. Intriguingly, 15 proteins which are commonly found in every COVID‐19 severity grade have roles in the pathways of complement and coagulation cascades (C2, C3, C5, C4B, CFI, and SERPING1). Previous studies also show that proteins which are related to complement activation are mostly upregulated in COVID‐19 patients [12, 14, 44, 45] and complement dysregulation is associated with severity of COVID‐19 [44]. It has been suggested that inhibiting complement activation may alleviate the inflammatory lung complications of COVID‐19 patients [46]. Upregulation of blood coagulation‐related proteins, especially a serine protease inhibitor SERPING upon COVID‐19 infection, has also been reported in various studies [10–15, 21].
Importantly, plasma proteomes are separated from each other based on their severity groups rather than infection phases. Majority of critical patients form a distinct cluster than moderate and severe ones in every infection period which suggest that the features of the critical plasma proteome are conserved from early infection until recovery period of the infection. We observed two clusters which are separated based on severity stages. Neutrophil aggregation (HP, SERPINA1, SERPINA3, CST3, PKM, FCGR3B, S100A9, and VNNN1), amyloid formation (SAA1, SAA2, FGA, H2BC21, H2AC20, and CST3) related proteins, CD163, HLA‐A, S100A9, ENO1, and LDHA are among 27 upregulated proteins in critical specific cluster (cluster 1, Figure 3). Previous studies have also suggested that HLA antigens could be one of the parameters that explain different susceptibility or resistance to COVID‐19 disease [47]. Interestingly, Enolase 1 (ENO1) is one of the most differentially expressed proteins in between two clusters which can be used as a potential prognostic biomarker for COVID‐19 severity. ENO1 is significantly downregulated in critical patients, in addition a previous study has shown that expression level of Enolase (ENO1) reduced in COVID‐19 children [48]. Similarly, amyloid formation could be linked to the severity of SARS‐CoV‐2 infection. In line with our findings of overexpression of SAA1 and SAA2 proteins in critical specific cluster (Figure 3B), it was reported that SAA and CRP levels significantly and gradually increase during the progression of the disease from mild to critical COVID‐19 grades [49]. Also, with the combination of transcriptomics and proteomics approaches, another study employed supervised classification models and proposed potential COVID‐19 severity biomarkers, such as SAA2 and CRP which have the highest predictive feature scores [9]. In line with our finding of LDHA and SOD1 being critical cluster specific upregulated proteins, an ELISA based study also suggests that LDHA and SOD1 levels increase in the plasma of COVID‐19 patients with severe syndromes [50]. On the other hand, remarkable proteins from moderate and severe patients‐based cluster 2 are related to the pathways of complement cascades (immunoglobulin proteins, MASP1, C4B, C4BPB, C8A, C8B, CFHR1, C1S, C1QA, CPN2, CPN1, VTN), hemostasis (CLEC3B, SERPINF2, PROC, KLKB1, SERPINA5, SERPINA4, LGALS3BP, AHSG, A2M, PLG, ECM1), and lipid metabolism (PLTP, AGT, APOC2, APOC3, APOA2, PON1). Apolipoproteins (APOC2, APOC3, APOA2) were reported to be downregulated with the increased severity of the COVID‐19 disease [14]. Interestingly, LGALS3BP was also upregulated in cluster 2, which was found as a plasma protein that interacts with SARS‐CoV‐2 spike protein and provides antiviral activities [51]. Hemostasis related proteins, PROC and SERPINA5, were also found to decrease their levels as the severity of the infection increases [52].
We reasoned that the most useful severity markers would be the ones that are deregulated at the early infection period with a distinct expression pattern in critical patients as compared to uninfected individuals, moderate, and severe patients. We propose that MB, S100A9, MST1, CLEB3B, and ITIH2 can be used as an early predictor of COVID‐19 severity where the latter three are detected at the early period. Notably, within these potential severity biomarkers, CLEC3B is a secreted protein which is highly abundant in lung tissue and reported to be a prognostic and diagnostic biomarker in lung cancer based on its significant down regulation in lung cancer [53]. CLEC3B is also suggested as a severity biomarker and potential drug target for COVID‐19 [54]. Another biomarker candidate for severity biomarker for COVID‐19, MST1 is predominantly expressed specifically in immune cells and plays an important role in the cytotoxicity of the cells in response to viral response [55, 56]. It was proposed as a potential early detection biomarker for colorectal cancer and might be useful for predicting the progression of breast cancer [57, 58]. In line with our findings, three other plasma proteomics studies also find MST1 as a deregulated protein in response to COVID‐19 infection [11, 13, 15]. ITIH2 is another possible early predictive biomarker candidate for the severity grade which is a member of the inter‐alpha‐trypsin inhibitor family. Relevant to our work, ITIH2 is also suggested as a mortality biomarker and significantly lower in the plasma of COVID‐19 patients [59]. In addition to downregulated biomarkers, we propose that S100A9 and MB are early severity biomarkers that are upregulated in critical patients. S100A9 plays a role in inducing leukocyte recruitment and stimulating cytokine secretion inflammatory response regulation and neutrophil aggregation [59]. Together with Protein S100‐A8 (S100A8), S100A9 forms Calprotectin, which were reported to be associated with reduced survival of COVID‐19 patients [60]. Lastly, by using deregulated plasma proteins at COVID‐19 infection, we reconstructed the signaling network in COVID‐19 disease and tracked the responsible virus–host interactions. Using COVID‐19 associated network, we highlighted nine proteins that can be targeted by FDA approved drugs dietary supplements.
Intriguingly, ORF8 is the most connected virus protein to our reconstructed COVID‐19 associated network. ORF8 proteins are highly divergent between SARS‐CoV and SARS‐CoV‐2 viral subtypes and they are involved in immune evasion of the infected host cells by downregulating MHC‐I protein [38, 61]. It has been shown that ORF8 protein disrupts interferon signaling (type I) pathway [62]. In our reconstructed plasma protein network, ORF8 primarily interacts with Community 4 proteins that have a role in the pathways of neutrophil aggregation and chronic inflammatory response [35] (Figure 5B). One of the downstream proteins of ORF8 is HSPA5 which has a role in anti‐inflammatory signaling and downregulates TNF‐alpha and IL‐6 cytokines [63]. ORF8 and HSPA5 interaction may promote the anti‐inflammatory role of ORF8. Remarkably, ORF8 interacts with two of the potential early severity biomarkers that we found in our study; CLEC3B and ITIH2 (Figure 5B) through PLAT and UGGT2. PLAT is a secreted serine protease, which has role in coagulation cascade by activating plasminogen and it indirectly interacts with cytolytic complement inhibitor through another ORF8 interacting protein PVR [64, 65]. One study hypothesized that contribution of ORF8 to the COVID‐19 pathogenesis can be via this cascade [65] and our early biomarkers ITIH2 and CLEC3B could be in the downstream of this pathway.
In this study, we explored predictors of critical severity grade which can be identified in the early phase of the disease. Analysis of the plasma proteome through extensive fractionation limited our study to a small patient size, it will be important to verify our findings in a larger cohort. Additionally, the age difference between uninfected individuals and patient groups has raised a question whether observed deregulations in protein expression levels are due to the SARS‐CoV‐2 infection or there is an age dependency. Reviewing the literature on age dependent alterations in plasma proteins, we found 23 common proteins between our study and a list of age‐associated genes identified earlier [31]. These findings are in line with COVID‐19 literature about the age‐dependent factors in disease severity [32, 66]. Similar to age effect, differential alteration in some proteins could be the result of infection and the physiological consequences (e.g., fever) rather than being SARS‐CoV‐2 infection specific. Overall, this study provides new potential early severity biomarkers for prognostic monitoring and a disease associated network showing connectedness between virus and host proteins and unraveling important SARS‐CoV‐2 infection related pathways. These results can be further elaborated for therapeutic purposes.
AUTHOR CONTRIBUTIONS
Ayse Tugce Sahin and Nurhan Ozlu designed the experimental research plan and Nurcan Tuncbag designed the computational research plan. Ayse Tugce Sahin performed proteomics experiments. Busra A. Akarlar and Nazli Ezgi Ozkan Kucuk contribute to data acquisition. Ali Yurtseven performed statistical analysis and data analysis, and Sina Dadmand performed network analysis with the inputs from Aydanur Senturk. Gulin Ozcan, Fusun Can, and Onder Ergonul collected plasma samples and discuss the clinical aspects. Nurhan Ozlu and Nurcan Tuncbag conceived and supervised the study. Ayse Tugce Sahin, Ali Yurtseven, Sina Dadmand, Nurcan Tuncbag, and Nurhan Ozlu wrote the manuscript. All authors discussed the results and commented on the manuscript.
CONFLICT OF INTEREST
The authors declare no conflict of interest.
Supporting information
Supporting Information
Supporting Information
Supporting Information
Supporting Information
Supporting Information
Supporting Information
ACKNOWLEDGMENTS
We thank the KUPAM and KUTTAM OMICS facilities of Koç University for the support and Prof. Ulrike Eggert for fruitful discussion. Koç University Is Bank Center for Infectious Disease (KUISCID) and Royal Society Newton Advanced Fellowship (NA170389) financially supported this study.
Sahin, A. T. , Yurtseven, A. , Dadmand, S. , Ozcan, G. , Akarlar, B. A. , Kucuk, N. E. O. , Senturk, A. , Ergonul, O. , Can, F. , Tuncbag, N. , & Ozlu, N. (2022). Plasma proteomics identify potential severity biomarkers from COVID‐19 associated network. PROTEOMICS – Clinical Applications, 00, e2200070. 10.1002/prca.202200070
Ayse Tugce Sahin, Ali Yurtseven, and Sina Dadmand contributed equally to this study.
Contributor Information
Ayse Tugce Sahin, Email: asahin19@ku.edu.tr.
Gulin Ozcan, Email: gozcan19@ku.edu.tr.
Nurcan Tuncbag, Email: ntuncbag@ku.edu.tr.
Nurhan Ozlu, Email: nozlu@ku.edu.tr.
DATA AVAILABILITY STATEMENT
All raw mass spectrometry data of the fractions from COVID‐19 patients and uninfected individuals are uploaded to the PRIDE database under accession number PXD031813. The datasets ad codes generated during this study are available at GitHub page with doi https://doi.org/10.5281/zenodo.6261357 [https://github.com/aliyurtsevenn/COVID‐19‐Plasma‐Proteomics/tree/1.0]
REFERENCES
- 1. WHO . (2022). WHO coronavirus (COVID‐19). WHO. https://covid19.who.int/ [Google Scholar]
- 2. NIH . (2022). Clinical spectrum of SARS‐CoV‐2 infection. NIH. https://www.covid19treatmentguidelines.nih.gov/overview/clinical‐spectrum/ [Google Scholar]
- 3. Middeldorp, S. , Coppens, M. , van Haaps, T. F. , Foppen, M. , Vlaar, A. P. , Muller, M. C. A. , Bouman, C. C. S. , Beenen, L. F. M. , Kootte, R. S. , Heijmans, J. , Smits, L. P. , Bonta, P. I. , & van Es, N. (2020). Incidence of venous thromboembolism in hospitalized patients with COVID‐19. Journal of Thrombosis and Haemostasis, 18(8), 1995–2002. 10.1111/jth.14888 [DOI] [PMC free article] [PubMed] [Google Scholar]
- 4. Wiersinga, W. J. , Rhodes, A. , Cheng, A. C. , Peacock, S. J. , & Prescott, H. C. (2020). Pathophysiology, transmission, diagnosis, and treatment of coronavirus disease 2019 (COVID‐19): A review. Journal of the American Medical Association, 324(8), 782–793. 10.1001/jama.2020.12839 [DOI] [PubMed] [Google Scholar]
- 5. Bantscheff, M. , Lemeer, S. , Savitski, M. M. , & Kuster, B. (2012). Quantitative mass spectrometry in proteomics: Critical review update from 2007 to the present. Analytical and Bioanalytical Chemistry, 404(4), 939–965. 10.1007/s00216-012-6203-4 [DOI] [PubMed] [Google Scholar]
- 6. Angel, T. E. , Aryal, U. K. , Hengel, S. M. , Baker, E. S. , Kelly, R. T. , Robinson, E. W. , & Smith, R. D. (2012). Mass spectrometry‐based proteomics: Existing capabilities and future directions. Chemical Society Reviews, 41(10), 3912–3928. 10.1039/c2cs15331a [DOI] [PMC free article] [PubMed] [Google Scholar]
- 7. Gordon, D. E. , Jang, G. M. , Bouhaddou, M. , Xu, J. , Obernier, K. , White, K. M. , & Krogan, N. J. (2020). A SARS‐CoV‐2 protein interaction map reveals targets for drug repurposing. Nature, 583(7816), 459–468. 10.1038/s41586-020-2286-9 [DOI] [PMC free article] [PubMed] [Google Scholar]
- 8. Stukalov, A. , Girault, V. , Grass, V. , Karayel, O. , Bergant, V. , Urban, C. , Haas, D. A. , Huang, Y. , Oubraham, L. , Wang, A. , Sabri Hamad, M. , Piras, A. , Hansen, F. M. , Tanzer, M. C. , Paron, I. , Zinzula, L. , Engleitner, T. , Reinecke, M. , Lavacca, T. M. , … Pichlmair, A. (2021). Multilevel proteomics reveals host perturbations by SARS‐CoV‐2 and SARS‐CoV. Nature, 594(7862), 246–252. 10.1038/s41586-021-03493-4 [DOI] [PubMed] [Google Scholar]
- 9. COMBAT . (2022). A blood atlas of COVID‐19 defines hallmarks of disease severity and specificity. Cell, 185(5), 916–938. e58 10.1016/j.cell.2022.01.012 [DOI] [PMC free article] [PubMed] [Google Scholar]
- 10. Geyer, P. E. , Arend, F. M. , Doll, S. , Louiset, M. L. , Winter, V. S. , Müller‐Reif, J. B. , Torun, F. M. , Weigand, M. , Eichhorn, P. , Bruegel, M. , Strauss, M. T. , Holdt, L. M. , Mann, M. , & Teupser, D. (2021). High‐resolution serum proteome trajectories in COVID‐19 reveal patient‐specific seroconversion. EMBO Molecular Medicine, 13(8), e14167. 10.15252/emmm.202114167 [DOI] [PMC free article] [PubMed] [Google Scholar]
- 11. Demichev, V. , Tober‐Lau, P. , Lemke, O. , Nazarenko, T. , Thibeault, C. , Whitwell, H. , Röhl, A. , Freiwald, A. , Szyrwiel, L. , Ludwig, D. , Correia‐Melo, C. , Aulakh, S. K. , Helbig, E. T. , Stubbemann, P. , Lippert, L. J. , Grüning, N.‐M. , Blyuss, O. , Vernardis, S. , White, M. , … von Kalle, C. (2021). A time‐resolved proteomic and prognostic map of COVID‐19. Cell Systems, 12(8), 780–794.e7. 10.1016/j.cels.2021.05.005 [DOI] [PMC free article] [PubMed] [Google Scholar]
- 12. Messner, C. B. , Demichev, V. , Wendisch, D. , Michalick, L. , White, M. , Freiwald, A. , & Ralser, M. (2020). Ultra‐high‐throughput clinical proteomics reveals classifiers of COVID‐19 infection. Cell Systems, 11(1), 11–24.e4. 10.1016/j.cels.2020.05.012 [DOI] [PMC free article] [PubMed] [Google Scholar]
- 13. Park, J. , Kim, H. , Kim, S. Y. , Kim, Y. , Lee, J. S. , Dan, K. , Seong, M.‐W. , & Han, D. (2020). In‐depth blood proteome profiling analysis revealed distinct functional characteristics of plasma proteins between severe and non‐severe COVID‐19 patients. Science Reports, 10(1), 22418. 10.1038/s41598-020-80120-8 [DOI] [PMC free article] [PubMed] [Google Scholar]
- 14. Shen, B. , Yi, X. , Sun, Y. , Bi, X. , Du, J. , Zhang, C. , & Guo, T. (2020). Proteomic and metabolomic characterization of COVID‐19 patient sera. Cell, 182(1), 59–72.e15. 10.1016/j.cell.2020.05.032 [DOI] [PMC free article] [PubMed] [Google Scholar]
- 15. Shu, T. , Ning, W. , Wu, D. , Xu, J. , Han, Q. , Huang, M. , Zou, X. , Yang, Q. , Yuan, Y. , Bie, Y. , Pan, S. , Mu, J. , Han, Y. , Yang, X. , Zhou, H. , Li, R. , Ren, Y. , Chen, X. , Yao, S. , … Zhou, X. (2020). Plasma proteomics identify biomarkers and pathogenesis of COVID‐19. Immunity, 53(5), 1108–1122.e5. 10.1016/j.immuni.2020.10.008 [DOI] [PMC free article] [PubMed] [Google Scholar]
- 16. Memon, D. , Barrio‐Hernandez, I. , & Beltrao, P. (2021). Individual COVID‐19 disease trajectories revealed by plasma proteomics. EMBO Molecular Medicine, 13(8), e14532. 10.15252/emmm.202114532 [DOI] [PMC free article] [PubMed] [Google Scholar]
- 17. Mohammed, Y. , Goodlett, D. R. , Cheng, M. P. , Vinh, D. C. , Lee, T. C. , McGeer, A. , Sweet, D. , Tran, K. , Lee, T. , Murthy, S. , Boyd, J. H. , Singer, J. , Walley, K. R. , Patrick, D. M. , Quan, C. , Ismail, S. , Amar, L. , Pal, A. , Bassawon, R. , & Russell, J. A. (2022). Longitudinal plasma proteomics analysis reveals novel candidate biomarkers in acute COVID‐19. Journal of Proteome Research, 21(4), 975–992. 10.1021/acs.jproteome.1c00863 [DOI] [PubMed] [Google Scholar]
- 18. D'Alessandro, A. , Thomas, T. , Dzieciatkowska, M. , Hill, R. C. , Francis, R. O. , Hudson, K. E. , Zimring, J. C. , Hod, E. A. , Spitalnik, S. L. , & Hansen, K. C. (2020). Serum proteomics in COVID‐19 patients: Altered coagulation and complement status as a function of IL‐6 level. Journal of Proteome Research, 19(11), 4417–4427. 10.1021/acs.jproteome.0c00365 [DOI] [PMC free article] [PubMed] [Google Scholar]
- 19. Feyaerts, D. , Hédou, J. , Gillard, J. , Chen, H. , Tsai, E. S. , Peterson, L. S. , Ando, K. , Manohar, M. , Do, E. , Dhondalay, G. K. R. , Fitzpatrick, J. , Artandi, M. , Chang, I. , Snow, T. T. , Sharon Chinthrajah, R. , Warren, C. M. , Wittman, R. , Meyerowitz, J. G. , Ganio, E. A. , … McIlwain, D. R. (2022). Integrated plasma proteomic and single‐cell immune signaling network signatures demarcate mild, moderate, and severe COVID‐19. Cell Reports Medicine, 3(7), 100680. 10.1016/j.xcrm.2022.100680 [DOI] [PMC free article] [PubMed] [Google Scholar]
- 20. Richard, V. R. , Gaither, C. , Popp, R. , Chaplygina, D. , Brzhozovskiy, A. , Kononikhin, A. , Mohammed, Y. , Zahedi, R. P. , Nikolaev, E. N. , & Borchers, C. H. (2022). Early prediction of COVID‐19 patient survival by targeted plasma multi‐omics and machine learning. Molecular & Cellular Proteomics, 21, 100277. 10.1016/j.mcpro.2022.100277 [DOI] [PMC free article] [PubMed] [Google Scholar]
- 21. Calvet, J. , Berenguer‐Llergo, A. , Gay, M. , Massanella, M. , Domingo, P. , Llop, M. , Sánchez‐Jiménez, E. , Arévalo, M. , Carrillo, J. , Albiñana, N. , Arauz‐Garofalo, G. , Orellana, C. , Delgado, J. F. , Serrano, A. , Llobell, A. , Graell, E. , García‐Manrique, M. , Moreno, M. , Galisteo, C. , & Gratacós, J. (2022). Biomarker candidates for progression and clinical management of COVID‐19 associated pneumonia at time of admission. Science Reports, 12(1), 640. 10.1038/s41598-021-04683-w [DOI] [PMC free article] [PubMed] [Google Scholar]
- 22. Ostaszewski, M. , Niarakis, A. , Mazein, A. , Kuperstein, I. , Phair, R. , Orta‐Resendiz, A. , & Schneider, R. (2021). COVID19 disease map, a computational knowledge repository of virus‐host interaction mechanisms. Molecular Systems Biology, 17(10), e10387. 10.15252/msb.202110387 [DOI] [PMC free article] [PubMed] [Google Scholar]
- 23. Mi, H. , Ebert, D. , Muruganujan, A. , Mills, C. , Albou, L. P. , Mushayamaha, T. , & Thomas, P. D. (2021). PANTHER version 16: A revised family classification, tree‐based classification tool, enhancer regions and extensive API. Nucleic Acids Research, 49(D1), D394–D403. 10.1093/nar/gkaa1106 [DOI] [PMC free article] [PubMed] [Google Scholar]
- 24. Raudvere, U. , Kolberg, L. , Kuzmin, I. , Arak, T. , Adler, P. , Peterson, H. , & Vilo, J. (2019). g:Profiler: A web server for functional enrichment analysis and conversions of gene lists (2019 update). Nucleic Acids Research, 47(W1), W191–W198. 10.1093/nar/gkz369 [DOI] [PMC free article] [PubMed] [Google Scholar]
- 25. Tuncbag, N. , Gosline, S. J. , Kedaigle, A. , Soltis, A. R. , Gitter, A. , & Fraenkel, E. (2016). Network‐based interpretation of diverse high‐throughput datasets through the omics integrator software package. PLoS Computational Biology, 12(4), e1004879. 10.1371/journal.pcbi.1004879 [DOI] [PMC free article] [PubMed] [Google Scholar]
- 26. Blondel, V. D. , Guillaume, J.‐L. , Lambiotte, R. , & Lefebvre, E. (2008). Fast unfolding of communities in large networks. Journal of Statistical Mechanics: Theory and Experiment, 2008(10), P10008. 10.1088/1742-5468/2008/10/p10008 [DOI] [Google Scholar]
- 27. Wishart, D. S. , Feunang, Y. D. , Guo, A. C. , Lo, E. J. , Marcu, A. , Grant, J. R. , Sajed, T. , Johnson, D. , Li, C. , Sayeeda, Z. , Assempour, N. , Iynkkaran, I. , Liu, Y. , Maciejewski, A. , Gale, N. , Wilson, A. , Chin, L. , Cummings, R. , Le, D. , … Wilson, M. (2018). DrugBank 5.0: A major update to the DrugBank database for 2018. Nucleic Acids Research, 46(D1), D1074–D1082. 10.1093/nar/gkx1037 [DOI] [PMC free article] [PubMed] [Google Scholar]
- 28. Kulak, N. A. , Pichler, G. , Paron, I. , Nagaraj, N. , & Mann, M. (2014). Minimal, encapsulated proteomic‐sample processing applied to copy‐number estimation in eukaryotic cells. Nature Methods, 11(3), 319–324. 10.1038/nmeth.2834 [DOI] [PubMed] [Google Scholar]
- 29. Akimov, V. , Barrio‐Hernandez, I. , Hansen, S. V. F. , Hallenborg, P. , Pedersen, A. K. , Bekker‐Jensen, D. B. , Puglia, M. , Christensen, S. D. K. , Vanselow, J. T. , Nielsen, M. M. , Kratchmarova, I. , Kelstrup, C. D. , Olsen, J. V. , & Blagoev, B. (2018). UbiSite approach for comprehensive mapping of lysine and N‐terminal ubiquitination sites. Nature Structural & Molecular Biology, 25(7), 631–640. 10.1038/s41594-018-0084-y [DOI] [PubMed] [Google Scholar]
- 30. Dehghani, A. , Gödderz, M. , & Winter, D. (2018). Tip‐based fractionation of batch‐enriched phosphopeptides facilitates easy and robust phosphoproteome analysis. Journal of Proteome Research, 17(1), 46–54. 10.1021/acs.jproteome.7b00256 [DOI] [PubMed] [Google Scholar]
- 31. Moaddel, R. , Ubaida‐Mohien, C. , Tanaka, T. , Lyashkov, A. , Basisty, N. , Schilling, B. , Semba, R. D. , Franceschi, C. , Gorospe, M. , & Ferrucci, L. (2021). Proteomics in aging research: A roadmap to clinical, translational research. Aging Cell, 20(4), e13325. 10.1111/acel.13325 [DOI] [PMC free article] [PubMed] [Google Scholar]
- 32. Inde, Z. , Croker, B. A. , Yapp, C. , Joshi, G. N. , Spetz, J. , Fraser, C. , Qin, X. , Le Xu, B. D. , Ghelfi, E. , Webb, G. , Carlin, A. F. , Zhu, Y. P. , Leibel, S. L. , Garretson, A. F. , Clark, A. E. , Duran, J. M. , Pretorius, V. , Crotty‐Alexander, L. E. , Li, C. , … Sarosiek, K. A. (2021). Age‐dependent regulation of SARS‐CoV‐2 cell entry genes and cell death programs correlates with COVID‐19 severity. Science Advances, 7(34), eabf8609. 10.1126/sciadv.abf8609 [DOI] [PMC free article] [PubMed] [Google Scholar]
- 33. Du Clos, T. W. , & Mold, C. (2004). C‐reactive protein: An activator of innate immunity and a modulator of adaptive immunity. Immunologic Research, 30(3), 261–277. 10.1385/ir:30:3:261 [DOI] [PubMed] [Google Scholar]
- 34. Pepys, M. B. , & Hirschfield, G. M. (2003). C‐reactive protein: A critical update. Journal of Clinical Investigation, 111(12), 1805–1812. 10.1172/jci18921 [DOI] [PMC free article] [PubMed] [Google Scholar]
- 35. Guo, Q. , Zhao, Y. , Li, J. , Liu, J. , Yang, X. , Guo, X. , Kuang, M. , Xia, H. , Zhang, Z. , Cao, L. , Luo, Y. , Bao, L. , Wang, X. , Wei, X. , Deng, W. , Wang, N. , Chen, L. , Chen, J. , Zhu, H. , … You, F. (2021). Induction of alarmin S100A8/A9 mediates activation of aberrant neutrophils in the pathogenesis of COVID‐19. Cell Host & Microbe, 29(2), 222–235.e4. 10.1016/j.chom.2020.12.016 [DOI] [PMC free article] [PubMed] [Google Scholar]
- 36. Daly, J. L. , Simonetti, B. , Klein, K. , Chen, K. E. , Williamson, M. K. , Antón‐Plágaro, C. , & Yamauchi, Y. (2020). Neuropilin‐1 is a host factor for SARS‐CoV‐2 infection. Science, 370(6518), 861–865. 10.1126/science.abd3072 [DOI] [PMC free article] [PubMed] [Google Scholar]
- 37. Afzali, B. , Noris, M. , Lambrecht, B. N. , & Kemper, C. (2022). The state of complement in COVID‐19. Nature Reviews Immunology, 22(2), 77–84. 10.1038/s41577-021-00665-1 [DOI] [PMC free article] [PubMed] [Google Scholar]
- 38. Flower, T. G. , Buffalo, C. Z. , Hooy, R. M. , Allaire, M. , Ren, X. , & Hurley, J. H. (2021). Structure of SARS‐CoV‐2 ORF8, a rapidly evolving immune evasion protein. Proceedings of the National Academy of Sciences of the United States of America, 118(2), e2021785118. 10.1073/pnas.2021785118 [DOI] [PMC free article] [PubMed] [Google Scholar]
- 39. Anand, K. , Ziebuhr, J. , Wadhwani, P. , Mesters, J. R. , & Hilgenfeld, R. (2003). Coronavirus main proteinase (3CLpro) structure: Basis for design of anti‐SARS drugs. Science, 300(5626), 1763–1767. 10.1126/science.1085658 [DOI] [PubMed] [Google Scholar]
- 40. Phizer . (2021). Pfizer's novel COVID‐19 oral antiviral treatment candidate reduced risk of hospitalization or death by 89% in interim analysis of phase 2/3 EPIC‐HR study. Phizer. 2022. https://www.pfizer.com/news/press‐release/press‐release‐detail/pfizers‐novel‐covid‐19‐oral‐antiviral‐treatment‐candidate [Google Scholar]
- 41. Najjar‐Debbiny, R. , Gronich, N. , Weber, G. , Khoury, J. , Amar, M. , Stein, N. , Goldstein, L. H. , & Saliba, W. (2022). Effectiveness of paxlovid in reducing severe COVID‐19 and mortality in high risk patients. Clinical Infectious Diseases, 10.1093/cid/ciac443 [DOI] [PMC free article] [PubMed] [Google Scholar]
- 42. Jin, W. H. , Dai, J. , Li, S. J. , Xia, Q. C. , Zou, H. F. , & Zeng, R. (2005). Human plasma proteome analysis by multidimensional chromatography prefractionation and linear ion trap mass spectrometry identification. Journal of Proteome Research, 4(2), 613–619. 10.1021/pr049761h [DOI] [PubMed] [Google Scholar]
- 43. Zhong, W. , Edfors, F. , Gummesson, A. , Bergström, G. , Fagerberg, L. , & Uhlén, M. (2021). Next generation plasma proteome profiling to monitor health and disease. Nature Communication, 12(1), 2493. 10.1038/s41467-021-22767-z [DOI] [PMC free article] [PubMed] [Google Scholar]
- 44. Yu, J. , Gerber, G. F. , Chen, H. , Yuan, X. , Chaturvedi, S. , Braunstein, E. M. , & Brodsky, R. A. (2021). Complement dysregulation is associated with severe COVID‐19 illness. Haematologica, 10.3324/haematol.2021.279155 [DOI] [PMC free article] [PubMed] [Google Scholar]
- 45. Lo, M. W. , Amarilla, A. A. , Lee, J. D. , Albornoz, E. A. , Modhiran, N. , Clark, R. J. , Ferro, V. , Chhabra, M. , Khromykh, A. A. , Watterson, D. , & Woodruff, T. M. (2022). SARS‐CoV‐2 triggers complement activation through interactions with heparan sulfate. Clinical Translational Immunology, 11(8), e1413. 10.1002/cti2.1413 [DOI] [PMC free article] [PubMed] [Google Scholar]
- 46. Risitano, A. M. , Mastellos, D. C. , Huber‐Lang, M. , Yancopoulou, D. , Garlanda, C. , Ciceri, F. , & Lambris, J. D. (2020). Complement as a target in COVID‐19? Nature Reviews Immunology, 20(6), 343–344. 10.1038/s41577-020-0320-7 [DOI] [PMC free article] [PubMed] [Google Scholar]
- 47. Tavasolian, F. , Rashidi, M. , Hatam, G. R. , Jeddi, M. , Hosseini, A. Z. , Mosawi, S. H. , Abdollahi, E. , & Inman, R. D. (2020). HLA, immune response, and susceptibility to COVID‐19. Frontiers in Immunology, 11, 601886. 10.3389/fimmu.2020.601886 [DOI] [PMC free article] [PubMed] [Google Scholar]
- 48. Wang, C. , Li, X. , Ning, W. , Gong, S. , Yang, F. , Fang, C. , Gong, Y. , Di Wu, M. , Huang, Y. , Gou, S. , Fu, Y. , Ren, R. , Yang, Y. , Qiu, Y. , Xue, Y. X. , & Zhou, X. (2021). Multi‐omic profiling of plasma reveals molecular alterations in children with COVID‐19. Theranostics, 11(16), 8008–8026. 10.7150/thno.61832 [DOI] [PMC free article] [PubMed] [Google Scholar]
- 49. Li, H. , Xiang, X. , Ren, H. , Xu, L. , Zhao, L. , Chen, X. , Long, H. , Wang, Q. , & Wu, Q. (2020). Serum amyloid A is a biomarker of severe coronavirus disease and poor prognosis. Journal of Infection, 80(6), 646–655. 10.1016/j.jinf.2020.03.035 [DOI] [PMC free article] [PubMed] [Google Scholar]
- 50. Xu, B. , Lei, Y. , Ren, X. , Yin, F. , Wu, W. , Sun, Y. , Wang, X. , Sun, Q. , Yang, X. , Wang, X. , Zhang, R. , Li, Z. , Fang, S. , & Liu, J. (2021). SOD1 is a possible predictor of COVID‐19 progression as revealed by plasma proteomics. ACS Omega, 6(26), 16826–16836. 10.1021/acsomega.1c01375 [DOI] [PMC free article] [PubMed] [Google Scholar]
- 51. Gutmann, C. , Takov, K. , Burnap, S. A. , Singh, B. , Ali, H. , Theofilatos, K. , Reed, E. , Hasman, M. , Nabeebaccus, A. , Fish, M. , McPhail, M. J. W. , O'Gallagher, K. , Schmidt, L. E. , Cassel, C. , Rienks, M. , Yin, X. , Auzinger, G. , Napoli, S. , Mujib, S. F. , & Mayr, M. (2021). SARS‐CoV‐2 RNAemia and proteomic trajectories inform prognostication in COVID‐19 patients admitted to intensive care. Nature Communication, 12(1), 3406. 10.1038/s41467-021-23494-1 [DOI] [PMC free article] [PubMed] [Google Scholar]
- 52. Overmyer, K. A. , Shishkova, E. , Miller, I. J. , Balnis, J. , Bernstein, M. N. , Peters‐Clarke, T. M. , Meyer, J. G. , Quan, Q. , Muehlbauer, L. K. , Trujillo, E. A. , He, Y. , Chopra, A. , Chieng, H. C. , Tiwari, A. , Judson, M. A. , Paulson, B. , Brademan, D. R. , Zhu, Y. , Serrano, L. R. , … Jaitovich, A. (2021). Large‐scale multi‐omic analysis of COVID‐19 severity. Cell Systems, 12(1), 23–40.e7. 10.1016/j.cels.2020.10.003 [DOI] [PMC free article] [PubMed] [Google Scholar]
- 53. Sun, J. , Xie, T. , Jamal, M. , Tu, Z. , Li, X. , Wu, Y. , Li, J. , Zhang, Q. , & Huang, X. (2020). CLEC3B as a potential diagnostic and prognostic biomarker in lung cancer and association with the immune microenvironment. Cancer Cell International, 20, 106. 10.1186/s12935-020-01183-1 [DOI] [PMC free article] [PubMed] [Google Scholar]
- 54. Li, Y. , Hou, G. , Zhou, H. , Wang, Y. , Tun, H. M. , Zhu, A. , Zhao, J. , Xiao, F. , Lin, S. , Liu, D. , Zhou, D. , Mai, L. , Zhang, L. , Zhang, Z. , Kuang, L. , Chen, J. G. Q. , Wen, L. , Zhang, Y. , Zhuo, J. , … Xu, Y. (2021). Multi‐platform omics analysis reveals molecular signature for COVID‐19 pathogenesis, prognosis and drug target discovery. Signal Transduction and Targeted Therapy, 6(1), 155. 10.1038/s41392-021-00508-4 [DOI] [PMC free article] [PubMed] [Google Scholar]
- 55. Bansal, S. , Tokman, S. , Fleming, T. , Maine, G. N. , Sanborn, K. , Hachem, R. , Bharat, A. , Smith, M. A. , Bremner, R. M. , & Mohanakumar, T. (2021). SARS‐CoV‐2 infection in lung transplant recipients induces circulating exosomes with SARS‐CoV‐2 spike protein S2. Clinical and Translational Medicine, 11(11), e576. 10.1002/ctm2.576 [DOI] [PMC free article] [PubMed] [Google Scholar]
- 56. Cheng, J. , Jing, Y. , Kang, D. , Yang, L. , Li, J. , Yu, Z. , Peng, Z. , Li, X. , Wei, Y. , Gong, Q. , Miron, R. J. , Zhang, Y. , & Liu, C. (2018). The role of Mst1 in lymphocyte homeostasis and function. Frontiers in Immunology, 9, 149. 10.3389/fimmu.2018.00149 [DOI] [PMC free article] [PubMed] [Google Scholar]
- 57. Yu, J. , Zhai, X. , Li, X. , Zhong, C. , Guo, C. , Yang, F. , Yuan, Y. , & Zheng, S. (2017). Identification of MST1 as a potential early detection biomarker for colorectal cancer through a proteomic approach. Science Reports, 7(1), 14265. 10.1038/s41598-017-14539-x [DOI] [PMC free article] [PubMed] [Google Scholar]
- 58. Jin, X. , Zhu, L. , Xiao, S. , Cui, Z. , Tang, J. , Yu, J. , & Xie, M. (2021). MST1 inhibits the progression of breast cancer by regulating the Hippo signaling pathway and may serve as a prognostic biomarker. Molecular Medicine Reports, 23(5), 383. 10.3892/mmr.2021.12022 [DOI] [PMC free article] [PubMed] [Google Scholar]
- 59. Völlmy, F. , van den Toorn, H. , Chiozzi, R. Z. , Zucchetti, O. , Papi, A. , Volta, C. A. , Marracino, L. , Sega, F. V. D. , Fortini, F. , Demichev, V. , Tober‐Lau, P. , Campo, G. , Contoli, M. , Ralser, M. , Kurth, F. , Spadaro, S. , Rizzo, P. , & Heck, A. J. (2021). A serum proteome signature to predict mortality in severe COVID‐19 patients. Life Science Alliance, 4(9), e202101099. 10.26508/lsa.202101099 [DOI] [PMC free article] [PubMed] [Google Scholar]
- 60. Wang, S. , Song, R. , Wang, Z. , Jing, Z. , Wang, S. , & Ma, J. (2018). S100A8/A9 in inflammation. Frontiers in Immunology, 9, 1298. 10.3389/fimmu.2018.01298 [DOI] [PMC free article] [PubMed] [Google Scholar]
- 61. Mayne, C. G. , Toy, W. , Carlson, K. E. , Bhatt, T. , Fanning, S. W. , Greene, G. L. , Katzenellenbogen, B. S. , Chandarlapaty, S. , Katzenellenbogen, J. A. , & Tajkhorshid, E. (2021). Defining the energetic basis for a conformational switch mediating ligand‐independent activation of mutant estrogen receptors in breast cancer. Molecular Cancer Research, 19(9), 1559–1570. 10.1158/1541-7786.Mcr-20-1017 [DOI] [PMC free article] [PubMed] [Google Scholar]
- 62. Li, J. Y. , Liao, C. H. , Wang, Q. , Tan, Y. J. , Luo, R. , Qiu, Y. , & Ge, X. Y. (2020). The ORF6, ORF8 and nucleocapsid proteins of SARS‐CoV‐2 inhibit type I interferon signaling pathway. Virus Research, 286, 198074. 10.1016/j.virusres.2020.198074 [DOI] [PMC free article] [PubMed] [Google Scholar]
- 63. Wang, J. , Lee, J. , Liem, D. , & Ping, P. (2017). HSPA5 Gene encoding Hsp70 chaperone BiP in the endoplasmic reticulum. Gene, 618, 14–23. 10.1016/j.gene.2017.03.005 [DOI] [PMC free article] [PubMed] [Google Scholar]
- 64. Lijnen, H. R. , & Collen, D. (1987). Tissue‐type plasminogen activator. Annales de Biologie Clinique (Paris), 45(2), 198–201. [PubMed] [Google Scholar]
- 65. Takatsuka, H. , Fahmi, M. , Hamanishi, K. , Sakuratani, T. , Kubota, Y. , & Ito, M. (2022). In silico analysis of SARS‐CoV‐2 ORF8‐binding proteins reveals the involvement of ORF8 in acquired‐immune and innate‐immune systems. Frontiers in Medicine (Lausanne), 9, 824622. 10.3389/fmed.2022.824622 [DOI] [PMC free article] [PubMed] [Google Scholar]
- 66. Romero Starke, K. , Petereit‐Haack, G. , Schubert, M. , Kämpf, D. , Schliebner, A. , Hegewald, J. , & Seidler, A. (2020). The age‐related risk of severe outcomes due to COVID‐19 infection: A rapid review, meta‐analysis, and meta‐regression. International Journal of Environmental Research and Public Health, 17(16), 5974. 10.3390/ijerph17165974 [DOI] [PMC free article] [PubMed] [Google Scholar]
Associated Data
This section collects any data citations, data availability statements, or supplementary materials included in this article.
Supplementary Materials
Supporting Information
Supporting Information
Supporting Information
Supporting Information
Supporting Information
Supporting Information
Data Availability Statement
All raw mass spectrometry data of the fractions from COVID‐19 patients and uninfected individuals are uploaded to the PRIDE database under accession number PXD031813. The datasets ad codes generated during this study are available at GitHub page with doi https://doi.org/10.5281/zenodo.6261357 [https://github.com/aliyurtsevenn/COVID‐19‐Plasma‐Proteomics/tree/1.0]