

Abstract
Background
Prostatic epithelial cells synthesize the active form of vitamin D (1,25-dihydroxyvitamin D3), which participates in regulating prostate growth. Calcitriol, a synthetic form of vitamin D3, exhibits antiproliferative and prodifferentiation activities in prostate cancer. The function of 1,25-dihydroxyvitamin D3 is mediated by its binding to vitamin D receptor (VDR). VDR forms a heterodimer, typically with retinoid X receptor, to regulate vitamin D target genes. We evaluated the relationship between VDR polymorphism and clinical characteristics associated with prostate cancer risk and prognosis among Egyptian men.
Materials and methods
This case-control study included 2 groups of patients: group A, a control group of 50 subjects with benign prostate hyperplasia, and group B, 50 subjects newly diagnosed with prostate cancer. All participants performed complete blood count, liver and kidney function tests, prostate specific antigen measurement, histopathological analysis and immunohistochemistry for Dickkopf Homolog 3. Restriction fragment length polymorphism-polymerase chain reaction as performed to detect VDR polymorphism.
Results
Patients with prostate cancer and controls showed a significantly different CA genotype frequency (p = 0.007). Furthermore, prostate-specific antigen levels were significantly different in different genotypes in patients with prostate cancer (p < 0.001). Finally, T stage and the VDR ApaI C/A polymorphism were significantly associated (p < 0.041).
Conclusion
The VDR ApaI C/A polymorphism may be a diagnostic and prognostic marker for prostate cancer in Egyptian men.
Keywords: Prostate cancer, Prostate-specific antigen, Vitamin D receptor polymorphism
1. Introduction
Prostate cancer is the most commonly diagnosed cancer and the second most common cause of death among men.[1] Its incidence is highest among Africans, followed by Whites and Mongolians,[2] which may be explained by differences in social, environmental, and genetic factors. In Egypt, prostate cancer accounts for approximately 4.27% of all cancers based on the National Population-Based Registry Program of Egypt 2008–2011. This number is expected to increase because the population and average life expectancy are increasing in Egypt.[3]
However, the etiology of prostate cancer remains unclear. Risk factors for prostate cancer include aging, diet, obesity, lifestyle, ethnicity, smoking, infections, prostate gland inflammation, and vasectomy.[4] Exposure to certain chemicals and genetic predisposition may also be involved. In addition, oncogene activation and subsequent tumor development may be caused by structural genomic rearrangements.[5] Hence, genetic variations in prostate cancer–related genes, including the vitamin D receptor gene (VDR), may be important in determining disease susceptibility.[6]
Vitamin D is involved in many functions other than bone metabolism, including the reduction of inflammation and modulation of cellular processes such as cell growth, neuromuscular and immune functions, and glucose metabolism.[7] Vitamin D also modulates numerous genes encoding proteins that regulate cell proliferation, differentiation, and apoptosis. The VDR is present in many tissues and converts 25-hydroxyvitamin D to 1,25-dihydroxyvitamin D in some of these tissues.[8]
Measurement of the prostate-specific antigen (PSA) level is a standard test used to diagnose prostate cancer. The Food and Drug Administration approved this test in 1986 for evaluating disease progression.[9] However, the specificity of PSA for diagnosing prostate cancer is very low,[10] and thus, more specific molecular markers are required to enable early diagnosis and treatment, which decrease mortality in patients with prostate cancer.
Prostate cell division is influenced by the steroid hormones testosterone and vitamin D, the actions of which are mediated by the androgen receptor (AR) and VDR, respectively.[11] Prostate epithelial cells express multiple members of the nuclear receptor superfamily that regulate cell proliferation and differentiation in the prostate gland. VDR is a nuclear hormone receptor that regulates gene transcription. Although this regulation has been shown to be disturbed in prostate cancer,[12] the role of the VDR in prostate cancer remains controversial. In the Taiwanese (Asian) population, the frequency of any genotype and prostate cancer showed no association.[13] In contrast, other studies suggested that ApaI polymorphism confers susceptibility to sporadic disease.[14,15]
Based on the controversial role of VDR in prostate cancer, studies are needed to determine whether VDR polymorphisms are useful as diagnostic and prognostic markers among Egyptian patients.
2. Materials and methods
2.1. Patients
This prospective study was conducted in the Department of Clinical Oncology and Nuclear Medicine, Zagazig University Hospitals, and Medical Biochemistry and Molecular Biology Department, Faculty of Medicine, Zagazig University, Zagazig, Egypt, in collaboration with the Zoology Department, Faculty of Science, Zagazig University.
This was a case-control study performed to evaluate 2 groups. Group A (control group) included 50 patients with benign prostate hyperplasia. Group B included 50 patients newly diagnosed with prostate cancer as confirmed by histopathological analysis. Participants provided written informed consent after the procedures and possible hazards were explained. The study was approved by the Institutional Review Board of the Faculty of Medicine, Zagazig University.
Inclusion criteria for the patients were as follows: age of between 50 and 85 years, histologically confirmed adenocarcinoma of the prostate without evidence of neuroendocrine or small cell differentiation, Gleason score ≥7, any stage including low-volume metastatic disease, Eastern Cooperative Oncology Group performance status (ECOG PS) between 0 and 2, eligible for hormonal treatment, and adequate organ function. The volume of the disease as a potential predictor was introduced by the chemohormonal therapy versus androgen ablation randomized trial for extensive disease in prostate cancer based on imaging with a bone scan and computed tomographic scanning. High-volume metastasis was defined as ≥4 bone metastases, including ≥1 outside the vertebral column or pelvis and/or visceral metastasis.[14]
Exclusion criteria included an age of <50 or >85 years, unavailable histology, ECOG PS >2, severe concurrent illness, or comorbid disease that would make the subject unsuitable for enrollment.
All eligible patients with prostate cancer were evaluated, treated, and followed-up at the Clinical Oncology and Nuclear Medicine Department. Eligible patients were enrolled from January 2018 to April 2019. Patient follow-up ended in October 2021.
All patients provided full histories and underwent physical examination and complete blood count (CBC), liver and kidney function tests, PSA measurement, histopathological analysis to confirm prostate cancer, and immunohistochemistry (IHC) for Dickkopf homolog 3 (DKK3).
The patients underwent hormonal treatment. Biochemical relapse was defined as a PSA increase of 2 ng/mL above the nadir (Phoenix Criteria, 2005).[16] According to the D'Amico risk stratification system, patients were classified into 3 groups to predict posttreatment biochemical failure. Low risk was defined as 1992 AJCC T1/T2a, PSA level ≤10 ng/mL, and Gleason score of ≤6. Intermediate risk was defined as 1992 AJCC T2b and/or PSA of 10 to 20 ng/mL, and/or Gleason score of 7. High-risk disease was classified as any one of the following high-risk features: 1992 AJCC ≥T2c, PSA >20 ng/mL, or Gleason score of 8 to 10.
2.2. Immunohistochemistry
Immunohistochemical staining was performed using the polymer Envision Detection System and Dako EnVision kit (Dako, Glostrup, Denmark). Tissue sections (3–5 μm) were deparaffinized in xylene and rehydrated in graded alcohol. The slides were incubated for 10 minutes in 3% hydrogen peroxide to block endogenous peroxidase activity, followed by treatment with Dako Target Antigen Retrieval Solution (pH 6.0). The slides were incubated with an anti-DKK3 antibody (ab187532; Abcam, Cambridge, UK). The reaction was visualized by incubating the sections with diaminobenzidine for 15 minutes. The sections were stained with Mayer hematoxylin. Immunohistochemical scoring was performed by a pathologist using a graded scale from 0 to 3+, where 0 to 2 represented weak staining, 2+ to 3 represented moderate staining, and 3+ represented strong staining.
2.3. Biochemical and molecular procedures
Random blood glucose, total bilirubin, direct bilirubin, alanine transaminase, aspartate transaminase, albumin, urea, and creatinine were measured using a semiautomated chemistry analyzer (Sunostik Medical Technology, Changchun, China) using commercially available kits (Spinreact, Girona, Spain). A CBC was determined using a BeneSphera (Avantor, Radnor, PA).
DNA was extracted from EDTA blood samples using a commercially available G-spin Total Genomic DNA Extraction Kit (iNtron Biotechnology, Seongnam, Korea). Polymerase chain reaction (PCR) amplification was performed using a thermal cycler (PerkinElmer, Waltham, MA). The 25-μL PCR sample mixtures contained 100-ng genomic DNA, 1.0 μM of each primer (SBS, Beijing, China), and 12.5 μL of 2X TOP simple PreMIX n-Taq master mix (Enzynomics, Daejeon, Korea). The primer sequences were as follows: F, 5′-CAGAGCATGGACAGGGAGCAA-3′ and R, 5′-GCAACTCCTCATGGCTGAGGTCTC-3′. The PCR products were digested with the restriction enzyme ApaI (Enzymonics), and the fragments were separated using 2% agarose gel electrophoresis with a 100-bp marker. The gels were stained with ethidium bromide and visualized using a UV transilluminator.
2.4. Statistical analysis
Continuous variables are expressed as the mean ± standard deviation and median (range), and categorical variables are expressed as percentages. Variables presented as percentages were compared using the Pearson χ2 test or Fisher exact test, when appropriate. Disease-free survival (DFS) was calculated as the time from the date of local treatment to the date of relapse or censored at the last follow-up visit. Overall survival (OS) was calculated as the time between the date of diagnosis and date of death or final follow-up visit. DFS and OS were stratified based on the DKK3 IHC results in malignant cells and VDR ApaI C/A polymorphism. These time-to-event distributions were estimated using Kaplan-Meier plots and compared using 2-sided exact log-rank tests. Statistical significance was set at p < 0.05. All statistical analyses were performed using SPSS version 22.0 software for Windows (SPSS, Inc., Chicago, IL) and MedCalc Statistical Software version 18.9.1 (MedCalc Software bvba, Ostend, Belgium; http://www.medcalc.org; 2018).
3. Results
3.1. Clinical and biochemical characteristics of study subjects
The 2 groups did not significantly differ in terms of age (p = 0.76). There was a significant decrease in hemoglobin and red blood cell counts in patients with prostate cancer compared with the controls (p = 0.001 and 0.005, respectively), whereas other CBC parameters did not significantly differ between groups (p > 0.05). Total and direct bilirubin levels were significantly increased among prostate cancer cases (p = 0.02 and 0.01, respectively), whereas other liver and kidney function tests showed no significant difference between the 2 groups (p > 0.05). A highly significant increase in pretreatment PSA levels was observed among prostate cancer cases (p < 0.001; Table 1, Fig. 1A).
Table 1.
Difference in clinicopathological features between the studied groups.
| Variables | Mean ± SD | t test | p | |
|---|---|---|---|---|
| Controls (n = 50) | Prostate cancer (n = 50) | |||
| Age, yr | 68.9 ± 6.78 | 62.9 ± 6.33 | 0.27 | 0.76 |
| Hemoglobin, g/dL | 13.2 ± 1.45 | 12.1 ± 1.69 | 3.56 | 0.001* |
| Red blood cells, cells × 106/μL | 4.86 ± 0.46 | 4.61 ± 0.41 | 2.92 | 0.005* |
| White blood cells, cells × 103/μL | 7.04 ± 2.47 | 7.87 ± 2.74 | 1.63† | 0.08 |
| Platelets, cells × 103/μL | 232.5 ± 58.3 | 233.6 ± 75.1 | 0.08 | 0.94 |
| Prothrombin time, s | 13.97 ± 0.66 | 13.9 ± 0.64 | 0.85 | 0.399 |
| RBG, mg/dL | 121.4 ± 32.1 | 114.5 ± 30.9 | 1.1 | 0.29 |
| Total bilirubin, mg/dL | 0.82 ± 0.12 | 0.87 ± 0.12 | 2.31 | 0.02* |
| Direct bilirubin, mg/dL | 0.16 ± 0.04 | 0.18 ± 0.04 | 2.63 | 0.01* |
| Alanine transaminase, U/L | 18.6 ± 8.82 | 23.4 ± 13.1 | 1.13† | 0.08 |
| Aspartate transaminase, U/L | 21.2 ± 9.27 | 24.6 ± 12.6 | 1.37† | 0.17 |
| Albumin, g/dL | 4.23 ± 0.44 | 4.31 ± 0.41 | 0.91 | 0.37 |
| Creatinine, mg/dL | 0.96 ± 0.19 | 1.01 ± 0.26 | 1.11 | 0.26 |
| Urea, mg/dL | 26.3 ± 7.14 | 27.5 ± 9.04 | 0.42 | 0.68 |
| Prostate-specific antigen, ng/mL | 1.86 ± 1.18 | 85.4 ± 34.2 | 8.62 | <0.001‡ |
RBG = random blood glucose; SD = standard deviation.
*p < 0.05 (significant).
†Mann-Whitney test.
‡p < 0.001 (highly significant).
Figure 1.
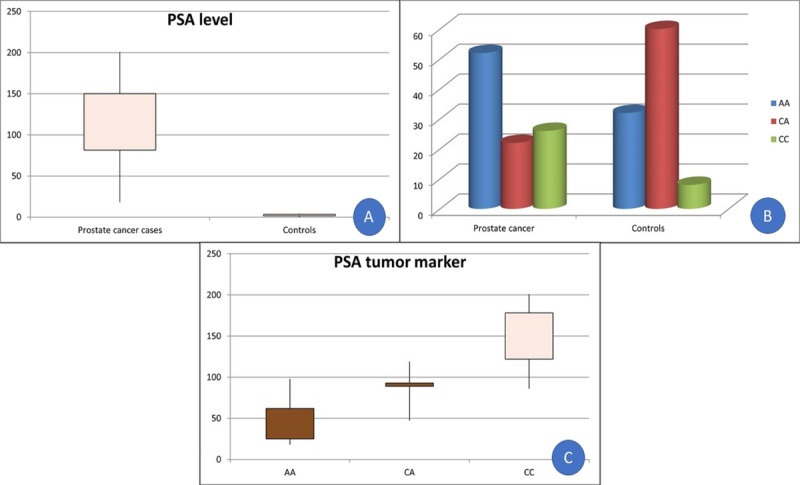
(A) Box-plot analysis of PSA levels among patients with prostate cancer and controls. (B) Genotypes distribution of the VDR gene among patients with prostate cancer and controls. (C) Box-plot analysis of PSA levels in genotypes of VDR among prostate cancer cases. PSA = prostate-specific antigen; VDR = vitamin D receptor.
3.2. Vitamin D receptor gene polymorphism
CA genotype differed significantly between patients with prostate cancer and controls (p = 0.007). However, the distribution of A and C alleles did not differ between groups (p = 0.97) (Table 2, Fig. 1B). In addition, PSA levels were significantly different in the genotypes of group B (p < 0.001; Table 3, Fig. 1C). However, the VDR polymorphism across the 3 D'Amico risk groups did not significantly differ (p = 0.68; Table 3).
Table 2.
Different genotypes and allele distributions of vitamin D receptor gene among the studied groups.
| Genotype | Group | χ 2 | p | Odds ratio (95% confidence interval) | |
|---|---|---|---|---|---|
| Prostate cancer (n = 50) | Controls (n = 50) | ||||
|
AA CA CC |
26 (52%) | 16 (32%) | ‐ | ‐ | 1 |
| 11 (22%) | 30 (60%) | 3.14 | 0.007* | 0.23 (0.09–0.57) | |
| 13 (26%) | 4 (8%) | 1.06 | 0.29 | 2 (0.55–7.2) | |
| A allele | 63 (63%) | 62 (62%) | 0.03 | 0.97 | 0.96 (0.54–1.7) |
| C allele | 37 (37%) | 38 (38%) | |||
*p < 0.05 (significant).
Table 3.
Relation between clinicopathological features and DKK3 IHC in malignant cells/VDR ApaI genotypes in patients with prostate cancer (n = 50).
| DKK3 IHC in malignant cells | VDR ApaI C/A polymorphism | |||||||
|---|---|---|---|---|---|---|---|---|
| Characteristics | Prostate cancer patients (n = 50), n (%) | Low (n = 35), n (%) | High (n = 15), n (%) | p* | CC (n = 13), n (%) | AA (n = 26), n (%) | CA (n = 11), n (%) | p* |
| Age group, yr | ||||||||
| <60 | 24 (48) | 16 (66.7) | 8 (33.3) | 0.621 | 5 (20.8) | 11 (45.8) | 8 (33.3) | 0.173 |
| ≥60 | 26 (52) | 19 (73.1) | 7 (26.9) | 8 (30.8) | 15 (57.7) | 3 (11.5) | ||
| Pretreatment prostate-specific antigen, ng/mL | ||||||||
| <10 | 16 (32) | 13 (81.2) | 3 (18.8) | 0.011† | 125.4 ± 27.8 | 64.9 ± 20.55 | 86.4 ± 24.4 | <0.001† |
| 10–20 | 13 (26) | 12 (92.3) | 1 (7.7) | |||||
| >20 | 21 (42) | 10 (47.6) | 11 (52.4) | |||||
| ECOG PS | ||||||||
| ECOG 0 | 14 (28) | 11 (78.6) | 3 (21.4) | 0.444 | 3 (21.4) | 10 (71.4) | 1 (7.1) | 0.093 |
| ECOG 1 | 19 (38) | 14 (73.7) | 5 (26.3) | 8 (42.1) | 7 (36.8) | 4 (21.1) | ||
| ECOG 2 | 17 (34) | 10 (58.8) | 7 (41.2) | 2 (11.8) | 9 (52.9) | 6 (35.3) | ||
| Gleason score | ||||||||
| Gleason 7 | 6 (12) | 3 (50) | 3 (50) | 0.630 | 1 (16.7) | 4 (66.7) | 1 (16.7) | 0.846 |
| Gleason 8 | 23 (46) | 16 (69.6) | 7 (30.4) | 6 (26.1) | 12 (52.2) | 5 (21.7) | ||
| Gleason 9 | 15 (30) | 11 (73.3) | 4 (26.7) | 3 (20) | 8 (53.3) | 4 (26.7) | ||
| Gleason 10 | 6 (12) | 5 (83.3) | 1 (16.7) | 3 (50) | 2 (33.3) | 1 (16.7) | ||
| ≤7 | 6 (12) | 3 (50) | 3 (50) | 0.348 | 1 (16.7) | 4 (66.7) | 1 (16.7) | 0.741 |
| >7 | 44 (88) | 32 (72.7) | 12 (27.3) | 12 (27.3) | 22 (50) | 10 (22.7) | ||
| Tumor | ||||||||
| T2 | 20 (40) | 16 (80) | 4 (20) | 0.435 | 7 (35) | 8 (40) | 5 (25) | 0.041† |
| T3 | 20 (40) | 13 (65) | 7 (35) | 5 (25) | 14 (70) | 1 (5) | ||
| T4 | 10 (20) | 6 (60) | 4 (40) | 1 (10) | 4 (40) | 5 (50) | ||
| Node | ||||||||
| N0 | 22 (44) | 19 (86.4) | 3 (13.6) | 0.025† | 7 (31.8) | 9 (40.9) | 6 (27.3) | 0.380 |
| N1 | 28 (56) | 16 (57.1) | 12 (42.9) | 6 (21.4) | 17 (60.7) | 5 (17.9) | ||
| Metastasis | ||||||||
| M0 | 39 (78) | 28 (71.8) | 11 (28.2) | 0.713 | 11 (28.2) | 21 (53.8) | 7 (17.9) | 0.413 |
| M1 | 11 (22) | 7 (63.6) | 4 (36.4) | 2 (18.2) | 5 (45.5) | 4 (36.4) | ||
| D'Amico risk | ||||||||
| Low | 2 (25) | 4 (50) | 2 (25) | 0.68 | ||||
| Intermediate | 6 (37.5) | 8 (50) | 2 (12.5) | |||||
| High | 5 (19.2) | 14 (53.8) | 7 (26.9) | |||||
| DKK3 IHC in malignant cells | ||||||||
| Low | 35 (70) | 11 (31.4) | 16 (45.7) | 8 (22.9) | 0.325 | |||
| High | 15 (30) | 2 (13.3) | 10 (66.7) | 3 (20) | ||||
| VDR ApaI C/A polymorphism | ||||||||
| CC | 13 (26) | 11 (84.6) | 2 (15.4) | 0.325 | ||||
| AA | 26 (52) | 16 (61.5) | 10 (38.5) | |||||
| CA | 11 (22) | 8 (72.7) | 3 (27.3) | |||||
DKK3 = Dickkopf homolog 3; ECOG PS = Eastern Cooperative Oncology Group performance status; IHC = immunohistochemistry; VDR = vitamin D receptor.
Categorical variables are expressed as number (percentage).
*χ2 Test.
†p < 0.05 (significant).
3.3. Histopathological results
The benign prostatic gland showed corpora amylacea. Benign glands had undulating luminal contours with tufts and papillary infolding. Tall secretory epithelial cells had a pale clear cytoplasm and uniform round or oval nuclei. In well-differentiated prostate cancer sections, the malignant glands exhibited nuclear enlargement and hyperchromasia, prominent nucleoli, intraluminal blue mucin, and the absence of a basal cell layer. In moderately differentiated prostate cancer, the malignant glands were arranged back-to-back with little intervening stroma and cribriform patterns. Poorly differentiated prostate cancer showed solid groups of malignant epithelial cells with nuclear enlargement and abnormal mitotic figures (Fig. 2).
Figure 2.
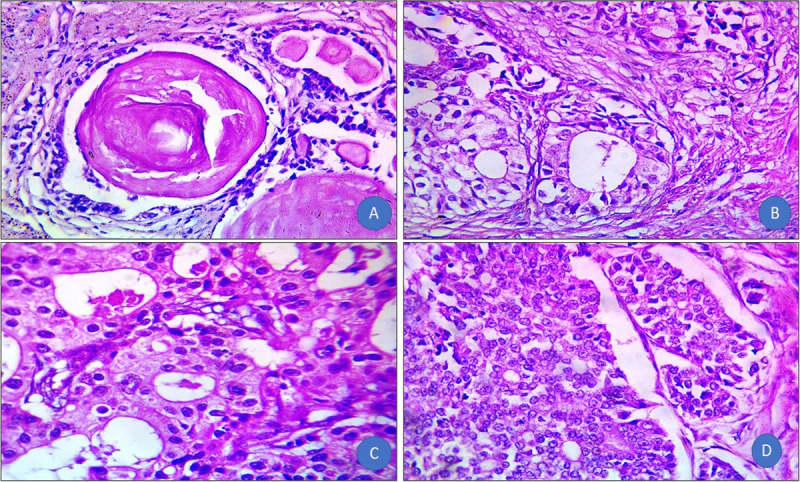
(A) Benign prostate hyperplasia: contains corpora amylacea, undulating luminal contours with tufts and papillary infoldings. The tall secretory epithelial cells have a pale and clear cytoplasm and uniform round or oval nuclei (H&E, original magnification ×100). (B) Well-differentiated prostate cancer: malignant glands showed nuclear enlargement and hyperchromasia, prominent nucleoli, intraluminal blue mucin, and the absence of a basal cell layer (H&E, original magnification ×400). (C) Moderately differentiated: malignant glands are arranged back-to-back with little intervening stroma and cribriform pattern (H&E, original magnification ×400). (D) Poorly differentiated prostate cancer: solid groups of malignant epithelial cells with nuclear enlargement and abnormal mitotic figures (H&E, original magnification ×400). H&E = hematoxylin and eosin.
3.4. Relation between clinicopathological features and DKK3 IHC in malignant cells
High and low expression of DKK3 was detected in 30% and 70% of patients with prostate cancer, respectively (Fig. 3). The pretreatment PSA and DKK3 IHC showed a significant association in malignant cells, where 81.2% of patients with PSA <10 ng/mL exhibited low DKK3 levels versus 47.6% of patients with PSA >20 ng/mL (p = 0.011). In addition, a significant association between the N stage and DKK3 IHC in malignant cells was observed; 86.4% of patients with node-negative disease had low DKK3 levels compared with 57.1% of patients with node-positive disease (p = 0.025; Table 3).
Figure 3.
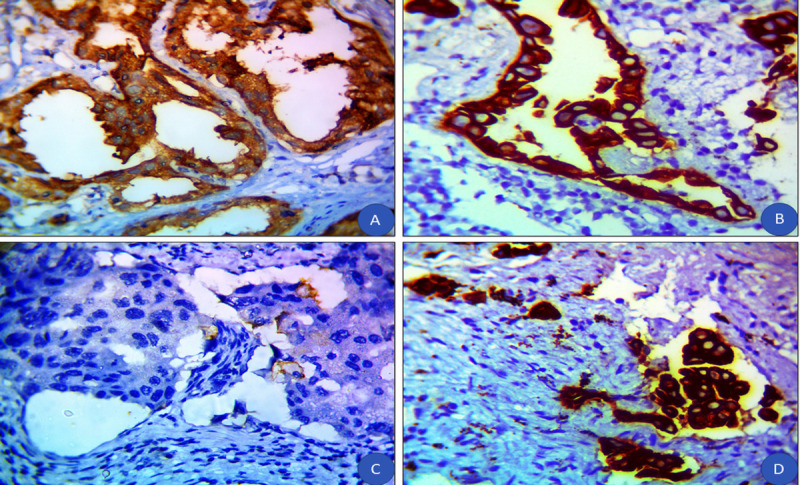
(A) Benign prostatic hyperplasia with a high cytoplasmic expression of DKK3 (IHC, original magnification ×100). (B) Moderately differentiated prostate cancer with negative expression of DKK3 (IHC, original magnification ×400). (C) Poorly differentiated prostate cancer with negative expression of DKK3 (IHC, original magnification ×400). (D) Poorly differentiated prostate cancer with high expression of DKK3 (IHC, original magnification ×400). DKK3 = Dickkopf homolog 3; IHC = immunohistochemistry.
3.5. Relation between clinicopathological features and VDR ApaI C/A polymorphism
T stage and VDR ApaI C/A polymorphism showed a significant association, with 25% of patients with T2 tumors displaying a CA genotype versus 50% of patients with T4 tumors displaying this genotype (p = 0.041; Table 3).
3.6. Clinicopathological features and relapse
The mean follow-up duration was 44.22 months (range, 30–61 months). Sixteen of 39 patients (41%) experienced disease relapse, and 15 patients (30%) died. Pretreatment PSA and relapse were significantly associated: 6.2% of patients with PSA <10 ng/mL relapsed versus 50% of patients with PSA >20 ng/mL (p < 0.001). A significant association was also observed between the Gleason score and relapse: 16.7% of patients with a Gleason score of 7 relapsed versus 100% of patients with a Gleason score of 9 (p = 0.008). Furthermore, T stage and relapse were significantly associated with relapse in 5% of patients with T2 tumors versus in 100% of patients with T4 tumors (p < 0.001). Finally, the N stage and relapse were significantly associated, where 13.6% of patients with node-negative disease relapsed versus 76.6% of patients with node-positive disease (p < 0.001; Table 4).
Table 4.
Relation between clinicopathological features, DKK3 IHC in malignant cells, VDR ApaI C/A polymorphism, and outcomes of patients with prostate cancer (n = 50).
| Relapse | Mortality | |||||||
|---|---|---|---|---|---|---|---|---|
| Characteristics | Patients with prostate cancer (n = 39), n (%) | Absent (n = 23) n (%) |
Present (n = 16) n (%) |
p* | Patients with prostate cancer (n = 50), n (%) | Alive (n = 35), n (%) | Died (n = 15), n (%) | p* |
| Age group, yr | ||||||||
| <60 | 18 (46.2) | 12 (66.7) | 6 (33.3) | 0.366 | 24 (48) | 16 (66.7) | 8 (33.3) | 0.621 |
| ≥60 | 21 (53.8) | 11 (52.4) | 10 (47.6) | 26 (52) | 19 (73.1) | 7 (26.9) | ||
| Pretreatment prostate-specific antigen, ng/mL | ||||||||
| <10 | 16 (41) | 15 (93.8) | 1 (6.2) | <0.001† | 16 (32) | 13 (81.2) | 3 (18.8) | 0.468 |
| 10–20 | 11 (28.2) | 2 (18.2) | 9 (81.8) | 13 (26) | 8 (61.5) | 5 (38.5) | ||
| >20 | 12 (30.8) | 6 (50) | 6 (50) | 21 (42) | 14 (66.7) | 7 (33.3) | ||
| ECOG PS | ||||||||
| ECOG 0 | 14 (35.9) | 9 (64.3) | 5 (35.7) | 0.260 | 14 (28) | 10 (71.4) | 4 (28.6) | 0.002† |
| ECOG 1 | 19 (48.7) | 9 (47.4) | 10 (52.6) | 19 (38) | 18 (94.7) | 1 (5.3) | ||
| ECOG 2 | 6 (15.4) | 5 (83.3) | 1 (16.7) | 17 (34) | 7 (41.2) | 10 (58.8) | ||
| Gleason score | ||||||||
| Gleason 7 | 6 (15.4) | 5 (83.3) | 1 (16.7) | 0.008† | 6 (12) | 5 (83.3) | 1 (16.7) | <0.001† |
| Gleason 8 | 23 (59) | 12 (52.2) | 11 (47.8) | 23 (46) | 20 (87) | 3 (13) | ||
| Gleason 9 | 4 (10.3) | 0 (0) | 4 (100) | 15 (30) | 4 (26.7) | 11 (73.3) | ||
| Gleason 10 | 6 (15.4) | 6 (100) | 0 (0) | 6 (12) | 6 (100) | 0 (0) | ||
| ≤7 | 6 (15.4) | 5 (83.3) | 1 (16.7) | 0.370 | 6 (12) | 5 (83.3) | 1 (16.7) | 0.654 |
| >7 | 33 (84.6) | 18 (54.5) | 15 (45.5) | 44 (88) | 30 (68.2) | 14 (31.8) | ||
| Tumor | ||||||||
| T2 | 20 (51.3) | 19 (95) | 1 (5) | <0.001† | 20 (40) | 17 (85) | 3 (15) | 0.040† |
| T3 | 16 (41) | 4 (25) | 12 (75) | 20 (40) | 14 (70) | 6 (30) | ||
| T4 | 3 (7.7) | 0 (0) | 3 (100) | 10 (20) | 4 (40) | 6 (60) | ||
| Node | ||||||||
| N0 | 22 (56.4) | 19 (86.4) | 3 (13.6) | <0.001† | 22 (44) | 19 (86.4) | 3 (13.6) | 0.025† |
| N1 | 17 (43.6) | 4 (23.5) | 13 (76.5) | 28 (56) | 16 (57.1) | 12 (42.9) | ||
| Metastasis | ||||||||
| M0 | 39 (78) | 33 (84.6) | 6 (15.4) | <0.001† | ||||
| M1 | 11 (22) | 2 (18.2) | 9 (81.8) | |||||
| DKK3 IHC in malignant cells | ||||||||
| Low | 28 (71.8) | 18 (64.3) | 10 (35.7) | 0.307 | 35 (70) | 23 (65.7) | 12 (34.3) | 0.502 |
| High | 11 (28.2) | 5 (45.5) | 6 (54.5) | 15 (30) | 12 (80) | 3 (20) | ||
| VDR ApaI C/A polymorphism | ||||||||
| CC | 11 (28.2) | 7 (63.6) | 4 (36.4) | 0.193 | 13 (26) | 12 (92.3) | 1 (7.7) | 0.082 |
| AA | 21 (53.8) | 10 (47.6) | 11 (52.4) | 26 (52) | 15 (57.7) | 11 (42.3) | ||
| CA | 7 (17.9) | 6 (85.7) | 1 (14.3) | 11 (22) | 8 (72.7) | 3 (27.3) | ||
DKK3 = Dickkopf homolog 3; ECOG PS = Eastern Cooperative Oncology Group performance status; IHC = immunohistochemistry; VDR = vitamin D receptor.
Categorical variables are expressed as number (percentage).
*χ2 Test.
†p < 0.05 (significant).
3.7. Clinicopathological features and mortality
ECOG PS and mortality were significantly associated; 28.6% of patients with ECOG PS 0 died versus 58.8% of patients with ECOG PS 2 (p = 0.002). Similarly, the Gleason score and mortality showed a positive association, where 16.7% of patients with a Gleason score of 7 died versus 73.3% of patients with a Gleason score of 9 (p < 0.001). A significant association was also observed between the T stage and mortality, in which 15% of patients with T2 tumors died compared with 60% of patients with T4 tumors (p = 0.040). In addition, N stage and mortality were associated: 13.6% of patients with node-negative disease died versus 42.9% of patients with node-positive disease (p = 0.025). Finally, the M stage and mortality were significantly associated, in which 15.4% of patients with nonmetastatic disease died compared with 81.8% of patients with metastatic disease (p < 0.001; Table 4).
3.8. Relation between treatment and relapse
Thirty-eight patients (76%) underwent local radiotherapy. Thirty-five patients (70%) were administered a combined androgen blockade (luteinizing hormone-releasing hormone [LHRH] + AR blockers). The mean duration of hormonal treatment was 38.14 months (range, 28–56 months). Twelve patients (24%) were administered neoadjuvant hormonal therapy, and 32 patients (64%) were administered concurrent hormonal treatment. Sixteen patients (32%) showed posttreatment PSA >0.5 ng/mL. A significant association was observed between hormonal deprivation and relapse, as 20% of patients treated with LHRH relapsed versus 54.2% of patients treated with LHRH + AR blockers relapsed (p = 0.035; Table 5).
Table 5.
Relation between treatment and outcomes of patients with prostate cancer (n = 50).
| Treatment | Relapse | Mortality | ||||||
|---|---|---|---|---|---|---|---|---|
| Patients with prostate cancer (n = 39), n (%) | Absent (n = 23), n (%) |
Present (n = 16), n (%) |
p* | Patients with prostate cancer (n = 50), n (%) | Alive (n = 35), n (%) | Died (n = 15), n (%) | p* | |
| Local radiotherapy | ||||||||
| No | 1 (2.6) | 0 (0) | 1 (100) | 0.410 | 12 (24) | 2 (16.7) | 10 (83.3) | <0.001† |
| Yes | 38 (97.4) | 23 (60.5) | 15 (39.5) | 38 (76) | 33 (86.8) | 5 (13.2) | ||
| Hormonal deprivation | ||||||||
| LHRH | 15 (38.5) | 12 (80) | 3 (20) | 0.035† | 15 (30) | 12 (80) | 3 (20) | 0.502 |
| LHRH + AR blockers | 24 (61.5) | 11 (45.8) | 13 (54.2) | 35 (70) | 23 (65.7) | 12 (34.3) | ||
| Neoadjuvant hormonal | ||||||||
| No | 38 (97.4) | 23 (60.5) | 15 (39.5) | 0.410 | 38 (76) | 33 (86.8) | 5 (13.2) | <0.001† |
| Yes | 1 (2.6) | 0 (0) | 1 (100) | 12 (24) | 2 (16.7) | 10 (83.3) | ||
| Concurrent hormonal | ||||||||
| No | 7 (17.9) | 6 (85.7) | 1 (14.3) | 0.206 | 18 (36) | 8 (44.4) | 10 (55.6) | 0.003† |
| Yes | 32 (82.1) | 17 (53.1) | 15 (46.9) | 32 (64) | 27 (84.4) | 5 (15.6) | ||
| Posttreatment prostate-specific antigen, ng/mL | ||||||||
| ≤0.5 | 28 (71.8) | 18 (64.3) | 10 (35.7) | 0.307 | 34 (68) | 24 (70.6) | 10 (29.4) | 1.000 |
| >0.5 | 11 (28.2) | 5 (45.5) | 6 (54.5) | 16 (32) | 11 (68.8) | 5 (31.2) | ||
| Relapse | (n = 39) | (n = 33) | (n = 6) | |||||
| Absent | 23 (59) | 21 (91.3) | 2 (8.7) | 0.205 | ||||
| Present | 16 (41) | 12 (75) | 4 (25) | |||||
AR = androgen receptor; LHRH = luteinizing hormone-releasing hormone.
Categorical variables are expressed as number (percentage).
*χ2 Test.
†p < 0.05 (significant).
3.9. Relation between treatment and mortality
Local radiotherapy was positively associated with mortality: 83.3% of untreated patients died versus 13.2% of treated patients (p < 0.001). In contrast, neoadjuvant hormonal treatment was associated with higher mortality: 13.2% of untreated patients died versus 83.3% of treated patients (p < 0.001). In addition, concurrent hormonal treatment and mortality were positively associated; 55.6% of untreated patients died versus 15.6% of treated patients (p = 0.003; Table 5).
3.10. Kaplan-Meier plot for DFS
The 4-year DFS among group B patients was 55.8%. The 4-year DFS values among patients with low and high DKK3 expression were 62.3% and 36.4%, respectively. The 4-year DFS values among patients with the CA, CC, and AA genotypes were 83.3%, 63.6%, and 42.8%, respectively (Fig. 4).
Figure 4.
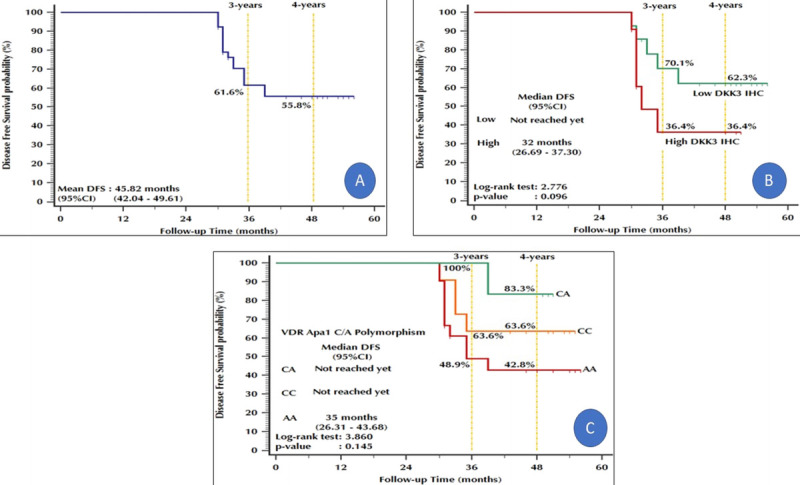
Kaplan-Meier plot: Disease-free survival. (A) All prostate cancer patients. (B) Stratified by DKK3 IHC in malignant cells. (C) Stratified by VDR ApaI C/A polymorphism. DKK3 = Dickkopf homolog 3; IHC = immunohistochemistry; VDR = vitamin D receptor.
3.11. Kaplan-Meier plot for OS
The 5-year OS among the 50 group B patients was 28.6%. The 4-year OS values among patients with low and high DKK3 expression were 67.6% and 71.8%, respectively. In addition, the 4-year OS values among patients with the CA, CC, and AA genotypes were 70%, 91.7%, and 53.3%, respectively (Fig. 5).
Figure 5.
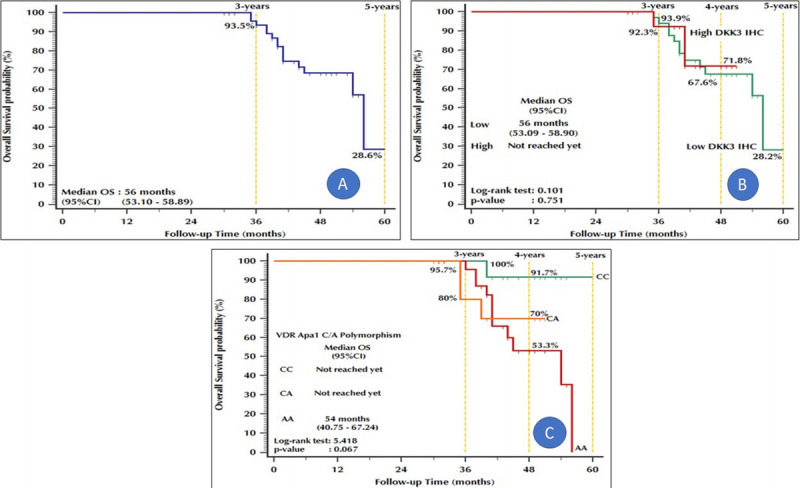
Kaplan-Meier plot: Overall survival. (A) Stratified by DKK3 IHC in malignant cells. (B) Stratified by VDR ApaI C/A polymorphism. (C) All patients with prostate cancer. DKK3 = Dickkopf homolog 3; IHC = immunohistochemistry; VDR = vitamin D receptor.
4. Discussion
In addition to its role in calcium homeostasis, vitamin D affects cell growth and differentiation, and immune function, and can protect against cardiovascular disease, infections, cancer, and autoimmune diseases.[8] Prostatic epithelial cells express VDR and 1α-hydroxylase enzymes that are required for the synthesis and action of calcitriol.[14]
In prostate cancer, various genes function together with individual and environmental factors to affect the development and prognosis of prostate cancer.[17] Thus, identifying genetic risk factors is essential for early disease detection. Single-nucleotide polymorphisms may contribute to the pathogenesis of prostate cancer. Ethnic and geographic variations in the incidence and mortality of prostate cancer may result from polymorphisms in genes associated with androgen secretion and metabolism.[18] The association of VDR polymorphisms with the risk of prostate cancer among different ethnic groups suggests that these polymorphisms can be used as risk markers for the disease.[19]VDR is highly polymorphic, and its allele frequencies are highly variable among different races and ethnic groups.[20]
Age is a well-established risk factor for prostate cancer, with an increased risk after 50 years of age; approximately 6 in 10 men 65 years and older present with the disease.[19] In this study, the 2 groups of men were age-matched.
We observed a significant increase in total and direct bilirubin levels among patients with prostate cancer compared with those in controls. Causes of hyperbilirubinemia in patients with prostate cancer include obstruction of the bile duct by the primary tumor, pressure effect of enlarged lymph nodes, or infiltration of the liver.[21] Paraneoplastic cholestasis may also be responsible for the direct effect of the primary tumor or metastasis. However, these features are extremely rare in patients with prostate cancer.[22] Because we excluded high-volume metastasis from our study, visceral liver involvement was excluded, and thus, one possible explanation for our results is the enlarged lymph node effect.
We found a highly significant increase in PSA levels among patients with prostate cancer compared with those in controls (p < 0.001). An increase was observed in patient PSA levels among CC and CA genotypes compared with in AA genotype. Similarly, Nunes et al.[19] reported a significant association between VDR polymorphisms and PSA levels. PSA expression is controlled by androgens via the AR. A link between VDR and AR has been suggested because prostate cells intensively respond to dihydrotestosterone in the presence of calcitriol.[23] Furthermore, both exhibit synergistic interactions that regulate prostate cell proliferation and PSA secretion. Moreover, VDR polymorphisms associated with PSA levels may be useful prognostic factors. PSA concentrations >10 ng/mL were significantly associated with an increased risk of recurrence. In addition, PSA levels >2 ng/mL during the year before diagnosis increased the risk of mortality, despite treatment with radical prostatectomy.[24]
ApaI polymorphism is in intron 8 of the 3′ untranslated region, a noncoding region; however, this polymorphism has not been shown to affect splicing or transcription factor binding sites and thus does not affect the quantity, structure, or function of VDR protein. Therefore, the polymorphism seems to be silent. However, it influences VDR expression and function, particularly messenger RNA stability and gene transcription. This effect of this polymorphism may be linked to other genetic variations in VDR itself or nearby polymorphic genes and may alter the ability of VDR protein to bind calcitriol or activate vitamin D response element. This influence may alter the expression of regulatory genes, such as that of cyclin-dependent kinases, that control cell division in the prostate.[20,14]
We observed a significant difference in genotype between patients with prostate cancer and controls (p < 0.001). Moreover, the CA genotype was significantly more common in the control group than in the prostate cancer group (p = 0.007), but the distribution of A and C alleles did not differ between groups (p = 0.97). Kambale et al.[14] found similar results and suggested that the CA genotype exerts a protective effect, as it is less responsive to cell proliferation. Similarly, Onen et al.[15] found that VDR ApaI polymorphism may confer susceptibility to sporadic prostate cancer in the Turkish (White) population and demonstrated a relationship between C allele carrier of ApaI polymorphism and sporadic prostate cancer. Other studies revealed no association between the frequency of any genotype and prostate cancer.[13,19,25,26]
No differences in ApaI VDR polymorphisms and prostate cancer predisposition were found in White,[27] African American,[28] and Asian[13] populations between cases and controls. Furthermore, VDR ApaI polymorphism was not significantly correlated with prostate cancer risk in 2 meta-analyses.[26,29] However, Habuchi et al.[30] observed a significant difference between patients with prostate cancer and female controls, and Cicek et al.[31] found an association between ApaI polymorphism and prostate cancer.
We found a significant association between the T stage and VDR ApaI C/A polymorphism. However, no significant difference was found between genotypes regarding tumor differentiation, grade, Glasson score, or DKK3 expression. Similar to our results, Suzuki et al.[32] and Onen et al.[15] observed no relationship between clinicopathological parameters (tumor stage, Gleason score, PSA levels) and the genotype distributions of ApaI. Moreover, Zhang and Shan[25] found no specific relationship between ApaI polymorphism and prostate cancer TNM stage or Gleason score in either a dominant or recessive model. This discrepancy may be explained by ethnic variations and the different sample sizes.
5. Conclusions
VDR ApaI polymorphism may play a role in the development and progression of prostate cancer. ApaI polymorphism may help identify individuals at high risk of prostate cancer and select suitable treatment strategies. Because of the significant association between VDR ApaI polymorphism and both PSA levels and tumor stage, VDR ApaI polymorphism shows potential as a prognostic marker for prostate cancer in Egyptian men.
The outcomes of prostate cancer can be affected by several factors other than VDR polymorphism. We could not reduce selection bias through matched comparison/analysis or subgroup analysis because of the relatively small sample size. Screening for associations between genetic variants and prostate cancer prognosis requires a large sample size and long-term follow-up. Further large-scale case-control and cohort populations of different races and ethnicities with more polymorphic sites are required to confirm the association between VDR polymorphisms and prostate cancer development and progression.
Acknowledgments
None.
Statement of ethics
The study was approved by the Institutional Review Board of the Faculty of Medicine, Zagazig University (ZU-IRB#9237/5-1-2022). Participants provided written informed consent after the procedures, and possible hazards were explained. All procedures performed in this study involving human participants were in accordance with the ethical standards of the institutional and national research committee and with the 1964 Helsinki Declaration and its later amendments or comparable ethical standards.
Conflict of interest statement
No conflict of interest has been declared by the authors.
Funding source
None.
Data availability statement
Data are available upon a reasonable request.
Author contributions
AA, AZE-a, SH: Conception;
AA, SH, SA, MKE, HMI, MH, AZ-a: Interpretation or analysis of data;
SH: Preparation of the manuscript;
All authors: Revision for important intellectual content;
AA, AZE-a, SH: Supervision.
Footnotes
How to cite this article: El-attar AZ, Hussein S, Salama MFA, Ibrahim HM, AlKaramany AS, Elsawi MK, Hemeda M, Algazeery A. Vitamin D receptor polymorphism and prostate cancer prognosis. Curr Urol 2022;16(4):246–255. doi: 10.1097/CU9.0000000000000141
Contributor Information
Ahmed Z. El-attar, Email: ahmedenbedo@hotmail.com.
Mariam F. A. Salama, Email: romasamhood@yahoo.com.
Hanaa M. Ibrahim, Email: dr.hanaaghatwary@gmail.com.
Mansour K. Elsawi, Email: mkmidoa2002@gmail.com.
Mohamed Hemeda, Email: hemedauroclinic@gmail.com.
Ahmed Algazeery, Email: asalgazeery@zu.edu.eg.
References
- 1.Siegel RL, Miller KD, Jemal A. Cancer statistics, 2020. CA Cancer J Clin 2020;70(1):7–30. [DOI] [PubMed] [Google Scholar]
- 2.Tao ZQ, Shi AM, Wang KX, Zhang WD. Epidemiology of prostate cancer: Current status. Eur Rev Med Pharmacol Sci 2015;19(5):805–812. [PubMed] [Google Scholar]
- 3.Ibrahim AS, Khaled HM, Mikhail NN, Baraka H, Kamel H. Cancer incidence in Egypt: Results of the national population-based cancer registry program. J Cancer Epidemiol 2014;2014:437971. [DOI] [PMC free article] [PubMed] [Google Scholar]
- 4.Husby A, Wohlfahrt J, Melbye M. Vasectomy and prostate cancer risk: A 38-year nationwide cohort study. J Natl Cancer Inst 2020;112(1):71–77. [DOI] [PubMed] [Google Scholar]
- 5.Wyatt AW, Mo F, Wang Y, Collins CC. The diverse heterogeneity of molecular alterations in prostate cancer identified through next-generation sequencing. Asian J Androl 2013;15(3):301–308. [DOI] [PMC free article] [PubMed] [Google Scholar]
- 6.Mi YY, Chen YZ, Chen J, Zhang LF, Zuo L, Zou JG. Updated analysis of vitamin D receptor gene FokI polymorphism and prostate cancer susceptibility. Arch Med Sci 2017;13(6):1449–1458. [DOI] [PMC free article] [PubMed] [Google Scholar]
- 7.Jones G. Vitamin D. In: Ross AC, Caballero B, Cousins RJ, Tucker KL, Ziegler TR, eds. Modern Nutrition in Health and Disease. 11th ed. Philadelphia, PA: Lippincott Williams & Wilkins; 2014. [Google Scholar]
- 8.Bouillon R Carmeliet G Verlinden L, et al. Vitamin D and human health: Lessons from vitamin D receptor null mice. Endocr Rev 2008;29(6):726–776. [DOI] [PMC free article] [PubMed] [Google Scholar]
- 9.Tawfik A. Prostate-specific antigen (PSA)–based population screening for prostate cancer: An economic analysis. Ont Health Technol Assess Ser 2015;15(11):1–37. [PMC free article] [PubMed] [Google Scholar]
- 10.Cuzick J Thorat MA Andriole G, et al. Prevention and early detection of prostate cancer. Lancet Oncol 2014;15(11):e484–e492. [DOI] [PMC free article] [PubMed] [Google Scholar]
- 11.Jingwi EY Abbas M Ricks-Santi L, et al. Vitamin D receptor genetic polymorphisms are associated with PSA level, Gleason score and prostate cancer risk in African-American men. Anticancer Res 2015;35(3):1549–1558. [PMC free article] [PubMed] [Google Scholar]
- 12.Li L Shang F Zhang W, et al. Role of vitamin D receptor gene polymorphisms in pancreatic cancer: A case-control study in China. Tumour Biol 2015;36(6):4707–4714. [DOI] [PubMed] [Google Scholar]
- 13.Huang SP Chou YH Wayne Chang WS, et al. Association between vitamin D receptor polymorphisms and prostate cancer risk in a Taiwanese population. Cancer Lett 2004;207(1):69–77. [DOI] [PubMed] [Google Scholar]
- 14.Kambale PR, Haldar D, Kabi BC, Kambale KP. Study of vitamin D receptor gene polymorphism (FokI, TaqI and ApaI) among prostate cancer patients in North India. J Clin Diagn Res 2017;11(6):BC05–8. [DOI] [PMC free article] [PubMed] [Google Scholar]
- 15.Onen IH, Ekmekci A, Eroglu M, Konac E, Yesil S, Biri H. Association of genetic polymorphisms in vitamin D receptor gene and susceptibility to sporadic prostate cancer. Exp Biol Med (Maywood) 2008;233(12):1608–1614. [DOI] [PubMed] [Google Scholar]
- 16.Roach M 3rd Hanks G Thames H Jr., et al. Defining biochemical failure following radiotherapy with or without hormonal therapy in men with clinically localized prostate cancer: Recommendations of the RTOG-ASTRO Phoenix Consensus Conference. Int J Radiat Oncol Biol Phys 2006;65(4):965–974. [DOI] [PubMed] [Google Scholar]
- 17.Hsing AW, Reichardt JK, Stanczyk FZ. Hormones and prostate cancer: Current perspectives and future directions. Prostate 2002;52(3):213–235. [DOI] [PubMed] [Google Scholar]
- 18.Cancel-Tassin G, Cussenot O. Genetic susceptibility to prostate cancer. BJU Int 2005;96(9):1380–1385. [DOI] [PubMed] [Google Scholar]
- 19.Nunes SBR de Matos Oliveira F Neves AF, et al. Association of vitamin D receptor variants with clinical parameters in prostate cancer. Springerplus 2016;5:364. [DOI] [PMC free article] [PubMed] [Google Scholar]
- 20.Uitterlinden AG, Fang Y, Van Meurs JB, Pols HA, Van Leeuwen JP. Genetics and biology of vitamin D receptor polymorphisms. Gene 2004;338(2):143–156. [DOI] [PubMed] [Google Scholar]
- 21.Trauner M, Fickert P, Stauber RE. Inflammation-induced cholestasis. J Gastroenterol Hepatol 1999;14(10):946–959. [DOI] [PubMed] [Google Scholar]
- 22.Gil H, de Wazières B, Desmurs H, Fest T, Dupond JL. Stauffer's syndrome disclosing kidney cancer: Another cause of inflammatory syndrome with anicteric cholestasis. Rev Med Interne 1995;16(10):775–777. [DOI] [PubMed] [Google Scholar]
- 23.Williams H Powell IJ Land SJ, et al. Vitamin D receptor gene polymorphisms and disease free survival after radical prostatectomy. Prostate 2004;61(3):267–275. [DOI] [PubMed] [Google Scholar]
- 24.D'Amico AV Whittington R Malkowicz SB, et al. Biochemical outcome after radical prostatectomy, external beam radiation therapy, or interstitial radiation therapy for clinically localized prostate cancer. JAMA 1998;280(11):969–974. [DOI] [PubMed] [Google Scholar]
- 25.Zhang Q, Shan Y. Genetic polymorphisms of vitamin D receptor and the risk of prostate cancer: A meta-analysis. J BUON 2013;18(4):961–969. [PubMed] [Google Scholar]
- 26.Wang K, Wu G, Li J, Song W. Role of vitamin D receptor gene Cdx2 and Apa1 polymorphisms in prostate cancer susceptibility: A meta-analysis. BMC Cancer 2016;16(1):674. [DOI] [PMC free article] [PubMed] [Google Scholar]
- 27.Oakley-Girvan I Feldman D Eccleshall TR, et al. Risk of early-onset prostate cancer in relation to germ line polymorphisms of the vitamin D receptor. Cancer Epidemiol Biomarkers Prev 2004;13(8):1325–1330. [PubMed] [Google Scholar]
- 28.Rowland GW, Schwartz GG, John EM, Ingles SA. Calcium intake and prostate cancer among African Americans: Effect modification by vitamin D receptor calcium absorption genotype. J Bone Miner Res 2012;27(1):187–194. [DOI] [PMC free article] [PubMed] [Google Scholar]
- 29.Yin M, Wei S, Wei Q. Vitamin D receptor genetic polymorphisms and prostate cancer risk: A meta-analysis of 36 published studies. Int J Clin Exp Med 2009;2(2):159–175. [PMC free article] [PubMed] [Google Scholar]
- 30.Habuchi T Suzuki T Sasaki R, et al. Association of vitamin D receptor gene polymorphism with prostate cancer and benign prostatic hyperplasia in a Japanese population. Cancer Res 2000;60(2):305–308. [PubMed] [Google Scholar]
- 31.Cicek MS, Liu X, Schumacher FR, Casey G, Witte JS. Vitamin D receptor genotypes/haplotypes and prostate cancer risk. Cancer Epidemiol Biomarkers Prev 2006;15(12):2549–2552. [DOI] [PubMed] [Google Scholar]
- 32.Suzuki K Matsui H Ohtake N, et al. Vitamin D receptor gene polymorphism in familial prostate cancer in a Japanese population. Int J Urol 2003;10(5):261–266. [DOI] [PubMed] [Google Scholar]
Associated Data
This section collects any data citations, data availability statements, or supplementary materials included in this article.
Data Availability Statement
Data are available upon a reasonable request.