

Abstract
Background
Magnetic resonance imaging (MRI) is commonly used for the diagnosis of nasopharyngeal carcinoma (NPC) and occipital clivus (OC) invasion, but a proportion of lesions may be missed using non-enhanced MRI. The purpose of this study is to investigate the diagnostic performance of synthetic magnetic resonance imaging (SyMRI) in differentiating NPC from nasopharyngeal hyperplasia (NPH), as well as evaluating OC invasion.
Methods
Fifty-nine patients with NPC and 48 volunteers who underwent SyMRI examination were prospectively enrolled. Eighteen first-order features were extracted from VOIs (primary tumours, benign mucosa, and OC). Statistical comparisons were conducted between groups using the independent-samples t-test and the Mann–Whitney U test to select significant parameters. Multiple diagnostic models were then constructed using multivariate logistic analysis. The diagnostic performance of the models was calculated by receiver operating characteristics (ROC) curve analysis and compared using the DeLong test. Bootstrap and 5-folds cross-validation were applied to avoid overfitting.
Results
The T1, T2 and PD map-derived models had excellent diagnostic performance in the discrimination between NPC and NPH in volunteers, with area under the curves (AUCs) of 0.975, 0.972 and 0.986, respectively. Besides, SyMRI models also showed excellent performance in distinguishing OC invasion from non-invasion (AUC: 0.913–0.997). Notably, the T1 map-derived model showed the highest diagnostic performance with an AUC, sensitivity, specificity, and accuracy of 0.997, 96.9%, 97.9% and 97.5%, respectively. By using 5-folds cross-validation, the bias-corrected AUCs were 0.965–0.984 in discriminating NPC from NPH and 0.889–0.975 in discriminating OC invasion from OC non-invasion.
Conclusions
SyMRI combined with first-order parameters showed excellent performance in differentiating NPC from NPH, as well as discriminating OC invasion from non-invasion.
Supplementary Information
The online version contains supplementary material available at 10.1186/s12880-023-00968-w.
Keywords: Nasopharyngeal carcinoma, Magnetic resonance imaging, Differential diagnosis
Background
Nasopharyngeal carcinoma (NPC) is an aggressive head and neck cancer with high incidence rates in several provinces in south-eastern China [1]. Due to the deep location of the nasopharynx and occult symptoms of NPC, early diagnosis is to some extent difficult. With excellent soft-tissue resolution, MRI is the preferred imaging modality for NPC diagnosis, staging, and treatment monitoring. However, NPC and benign nasopharyngeal mucosal overlap to some extent [2–4] and asymmetric hyperplasia causes up to 14% misdiagnosis rate [5], which poses a challenge to the detection of NPC. Moreover, occipital clivus (OC) invasion, which is a poor survival factor [6], occurs in 45.3% NPC patients at the time of diagnosis [7, 8]. Notably, invaded OC typically shows low-intensity on T1WI, but normal OC exhibits age-related changes from uniformly low to uniformly high intensity [9, 10], leading to increased difficulty in discriminating OC invasion. Accordingly, accurate diagnosis of NPC and OC invasion is vital of importance, by developing advanced imaging techniques.
Recently, synthetic magnetic resonance imaging (SyMRI), based on a multiple-delay multiple-echo (MDME) sequence, could generate multiple contrast images in a single scan without contrast agents. Besides, SyMRI could simultaneously provide the longitudinal and transverse relaxation times (T1 and T2) and proton density (PD) of tissues, which are the basic intrinsic properties of MRI physics and independent from the MRI scanners or scanning parameters at a given field strength [11]. Microstructural differences and histopathological information within lesions could be accurately reflected by these three quantitative values [11, 12]. Recently, many studies have demonstrated the value of SyMRI in nasopharynx, breast, bladder and rectal cancer [13–18]. However, it should be noted that most studies used only the Mean value parameter, and additional information such as the tumour heterogeneity, which could be reflected by first-order features, may have been ignored.
First-order features and analysis, which are relatively easier to understand and implement compared with radiomics, reflect the distribution of voxel intensity with high reproducibility [19, 20]. Previous studies [21–24] showed that whole-tumour first-order features, such as Skewness, Variance and so on, can potentially be used for diagnosis and survival prediction in NPC. The research in SyMRI demonstrated that Mean value could help in discriminating NPC from NPH, but the test–retest repeatability and tumour heterogeneity were not evaluated [13]. To avoid the instability in the feature selection step of radiomics [25], we used first-order features as a complement to the Mean value [19]. Therefore, the purposes of our study are to explore whether first-order features derived from SyMRI could effectively discriminate NPC from NPH, and to explore the performance of SyMRI in evaluating OC invasion.
Methods
Study participants
The study was approved by the Ethics Committee of our hospital, and written informed consent was obtained from all participants prior to any research activities, including MRI examination. From August 2018 to May 2019, 62 consecutive patients were prospectively enrolled. The inclusion criteria were as follows: (1) nasopharyngoscopy- and biopsy-confirmed NPC; (2) no treatments related to the tumour before the MRI examination; and (3) no concurrent tumours. Three patients were excluded based on the following criteria: (1) the maximum short diameter of the tumour was smaller than 0.5 cm (n = 2); and (2) unqualified images on MRI images (n = 1). Finally, a total of 59 NPC patients were included in this research.
In addition, 49 volunteers were recruited from August to September 2019. The inclusion criteria were as follows: (1) no history of cancer; (2) no symptom related to nasopharyngeal disease; (3) the thickness of nasopharyngeal mucosa more than 3 mm on conventional nonenhanced MRI. Since all the volunteers did not accept the endoscopy, a minimum of 2 years of clinical follow-up was conducted and no suspected tumour in nasopharynx was found. Finally, 48 volunteers were included in this study, and only one was excluded due to unqualified images.
MRI protocol
All MRI examinations were performed on a 3 T scanner (Discovery MR 750, GE Healthcare, Milwaukee, WI, USA) with an 8-channel head and neck phase array coil. Detailed information on conventional MRI and SyMRI protocol is listed in Table 1. SyMRI scan was performed without contrast. Volunteers did not undergo enhanced scans.
Table 1.
Imaging parameters for MRI protocol
| Parameters | Axial T1WI | Axial T2WI/FS | DWI | Enhanced axial T1WI/FS | SyMRI |
|---|---|---|---|---|---|
| Sequence | FSE | FSE | EPI | FSE | MAGiC |
| TR (ms) | 482 | 6100 | 2930 | 250 | 6200 |
| TE (ms) | 13.6 | 85 | 80 | 13.63 | 18.9/94.7 |
| FOV (cm) | 26 | 26 | 26 | 26 | 26 |
| Acquisition matrix (phase × frequency) | 256 × 320 | 256 × 288 | 128 × 96 | 256 × 320 | 256 × 320 |
| Slice thickness/gap (mm) | 4.0/0.4 | 4.0/0.4 | 4.0/0.4 | 4.0/0.4 | 4.0/0.4 |
| NEX | 2.0 | 2.0 | 4.0 | 2.0 | 1.0 |
| Acquisition time (min) | 4.02 | 4.41 | 1.22 | 3.47 | 7.02 |
MRI, magnetic resonance imaging; T1WI, T1-weighted Imaging; T2WI, T2-weighted Imaging; FS, fat suppression; DWI = diffusion-weighted imaging; SyMRI, synthetic magnetic resonance imaging; FSE = fast spin echo; EPI = echo planar imaging; NEX = number of excitations; TR = repetition time; TE = echo time; FOV = field of view; MAGiC = magnetic resonance image compilation
Image processing and segmentation
The acquired raw images were processed using SyMRI software (version 8.0, Synthetic MR, Linkoping, Sweden) to generate three quantitative maps (T1 map, T2 map, and PD map) and multiple contrast-weighted images (T1WI, T2WI, T1WI FLAIR, T2WI FLAIR, short inversion recovery (STIR) and PDWI). The ITK-SNAP software (version 2.2.0, www.itksnap.org, open-source software) was used to segmentation. For each patient, radiologists 1 and 2 (X.Y., Y.L.; 18 and 5 years of tumour imaging experience, respectively) manually delineated volumes of interest (VOIs) along the border of the primary tumour/benign mucosa slice-by-slice, excluding obvious necrosis and cystic areas. Other image contrasts, including conventional T2WI with fat suppression and contrast-enhanced T1WI, were used as references.
The OC invasion was considered positive in cases: low-intensity on T1WI, hyperintensity on T2WI and enhancement on contrast-enhanced T1WI with fat-suppressed, as well as erosion or sclerosis of the bone cortex on CT [26–28]. The diagnosis obtained from MRI imaging was used when there had difference among CT and MR image findings for bone marrow invasion. Radiologists 3 and 4 (M.L., F.Y.; 21 and 3 years of tumour imaging experience, respectively) independently evaluated OC invasion with reference to CT and MRI, and any discordance was resolved by discussion. Then the VOIs of invaded OC in NPC and normal OC in volunteers were delineated on SyT1WI by both radiologists 3 and 4. The data from senior radiologists (X.Y. and M.L.) were used for further analysis.
First-order features extraction
First-order features were successively extracted from the T1 map, T2 map and PD map of the SyMRI, specifically: the 10th and 90th percentiles, Energy, Entropy, Interquartile Range (IQR), Kurtosis, Maximum, Mean Absolute Deviation (MAD), Mean, Median, Minimum, Range, Robust Mean Absolute Deviation (rMAD), Root Mean Squared (RMS), Skewness, Total Energy, Uniformity, and Variance. In total, 54 first-order features were obtained for each VOI.
Statistical analysis
All statistical analyses were conducted by IBM SPSS Statistics for Macs (version 26.0, Chicago, IL) and R (version 1.3.1073, R Foundation, Vienna, Austria). A two-tailed P < 0.05 indicated statistical significance. Interobserver consistency was analysed using a two-way random interclass correlation (ICC), and first-order features with ICC < 0.8 were excluded.
To compare NPC and NPH, as well as OC invasion and OC non-invasion, we first used either the independent-samples t-test or the Mann–Whitney U test to compare the first-order features according to the normal distribution proved by Kolmogorov–Smirnov test. Then receiver operating characteristic (ROC) curves and Spearman correlation analysis were performed for all significant features. Redundant features were removed if there was a high correlation (r > 0.80) and a relatively lower area under the curve (AUC). Binary logistic regression analysis with backward selection was used to select features and construct models of each imaging contrast. The goodness-of-fit was assessed by the Hosmer–Lemeshow (HL) test. The AUC, sensitivity, specificity and accuracy of models were obtained through ROC analysis. DeLong’s test was used to compare the differential diagnostic performance of the models. To verify the stability of the models, we used two parallel methods through package “rms” and “caret” of R language: (1) Bootstrap resampling method (n = 1000) to plot calibration curves; (2) 200 times 5-folds cross validation to establish the bias-corrected AUCs.
Results
Clinical characteristics
The clinical characteristics of the participants are listed in Table 2. Among the patients with NPC, 11, 12, 21, and 15 patients had T1, T2, T3, and T4 stage disease of the primary tumour, respectively, according to the 8th edition of the American Joint Committee on Cancer (AJCC) staging system [29]. Thirty-two (54.2%) patients had OC invasion. All first-order features have excellent consistency (all ICC ≥ 0.802, Additional file 1).
Table 2.
Clinical characteristics and population demographics of participants
| Characteristics | NPC | Volunteers | P |
|---|---|---|---|
| Gender | 0.271 | ||
| Male | 45 (76.3%) | 32 (66.7%) | |
| Female | 14 (23.7%) | 16 (33.3%) | |
| Age | 51 (18–68) | 43 (28–65) | 0.186 |
| Histology | NA | NA | |
| Non-keratinising | 21 (35.6%) | ||
| Differentiated | |||
| Non-keratinising | 34 (57.6%) | ||
| Undifferentiated | |||
| Keratinizing squamous cell carcinoma | 2 (3.4%) | ||
| Unknown | 2 (3.4%) | ||
| T stage | NA | NA | |
| T1 | 11 (18.6%) | ||
| T2 | 12 (20.3%) | ||
| T3 | 21 (35.7%) | ||
| T4 | 15 (25.4%) | ||
| OC invasion | NA | NA | |
| Yes | 32 (54.2%) | ||
| No | 27 (45.8%) |
Continuous data were expressed as median and range and categorical variables were expressed as percentage
NPC, nasopharyngeal carcinoma; NA, not appliable; OC, occipital clivus
First-order texture analysis for differentiating NPC tumours from NPH in volunteers
Three unique, diagnostic models each from single, different functional maps and specific first-order features were derived: (1) the PD map (PD_90th percentile and PD_Total Energy); (2) the T1 map (T1_Median, T1_Range and T1_Total Energy); and (3) the T2 map (T2_Minimum and T2_Total Energy). The T2 map-derived model had the best differential value with an AUC of 0.986. There were no significant differences among the three single functional models. The AUC, sensitivity, specificity and accuracy of the PD, T1 and T2 map-derived models are shown in Table 3. The bias-corrected AUCs were 0.965–0.984 (Additional file 1).
Table 3.
ROC curve analysis of three single functional models in differentiation between NPC and NPH in volunteers
| Parameters | NPC | NPH | P | Model fit | AUC (95% CI) | Sensitivity% | Specificity% | Accuracy% |
|---|---|---|---|---|---|---|---|---|
| T1 map derived model | 0.870 | 0.972 (0.948, 0.996) | 88.1 | 95.8 | 88.8 | |||
| T1_Median | 1405.10 (1366.50, 1519.00) | 1617.13 (1464.85, 1761.93) | 0.000 | |||||
| T1_Range | 2718.00 (2170.00, 3256.40) | 2357.80 (1910.30, 3016.78) | 0.041 | |||||
| T1_Total Energy (× 106) | 8800.08 (5866.79, 13,639.98) | 1682.82 (1083.85, 2798.88) | 0.000 | |||||
| T2 map derived model | 1.000 | 0.986 (0.970, 1.000) | 96.6 | 93.7 | 94.4 | |||
| T2_Minimum | 53.70 (47.10, 59.20) | 65.20 (62.93, 68.08) | 0.000 | |||||
| T2_Total Energy (× 106) | 27.36 (20.71, 40.30) | 5.18 (2.88, 7.80) | 0.000 | |||||
| PD map derived model | 0.890 | 0.975 (0.952, 0.998) | 89.8 | 95.8 | 90.7 | |||
| PD_90th percentile | 100.10 (97.7, 100.7) | 101.59 (100.86, 102.12) | 0.000 | |||||
| PD_Total Energy (× 106) | 29.01 (21.29, 49.53) | 5.12 (3.16, 7.75) | 0.000 |
Data was expressed as median (interquartile range)
ROC, receiver operating characteristic; NPC, nasopharyngeal carcinoma; AUC, area under the curve; 95% CI, 95% confidence interval
First-order texture analysis for differentiation between OC invasion and OC non-invasion
The OC invasion group (n = 32) had higher T1_Mean, T1_Total Energy and T2_MAD, lower PD_Maximum, T2_10th percentile and T2_Energy than the OC non-invasion group of volunteers (n = 48). The T1 map-derived model showed higher diagnostic performance than the T2 map-derived model (P = 0.007), and there were no significant differences in AUC between the comparisons of the other single map models (Table 4). The bias-corrected AUCs were 0.889–0.975 (Additional file 1).
Table 4.
ROC curve analysis of three single functional models in discrimination between OC invasion and OC non-invasion
| Models | OC invasion | OC non-invasion | P | Model fit | AUC (95% CI) | Sensitivity% | Specificity% | Accuracy% |
|---|---|---|---|---|---|---|---|---|
| T1 map derived model | 1.000 | 0.997 (0.990, 1.000) | 96.9 | 97.9 | 97.5 | |||
| T1_Mean | 1570.61 (1348.53, 1892.24) | 651.15 (588.75, 756.02) | 0.000 | |||||
| T1_Total Energy (× 106) | 3621.43 (1488.39, 7822.86) | 1398.09 (1048.77, 2008.46) | 0.000 | |||||
| T2 map derived model | 0.885 | 0.913 (0.851, 0.975) | 93.8 | 72.9 | 80.0 | |||
| T2_10th percentile | 72.85 (61.46, 80.28) | 83.06 (75.80, 89.22) | 0.000 | |||||
| T2_Energy (× 106) | 12.14 (7.51, 32.71) | 33.98 (18.90, 54.38) | 0.000 | |||||
| T2_MAD | 15.96 (11.83, 20.44) | 12.79 (10.95, 14.03) | 0.002 | |||||
| PD map derived model | 0.209 | 0.975 (0.945, 1.000) | 93.7 | 95.8 | 93.8 | |||
| PD_Maximum | 107.00 (105.00, 108.15) | 133.5 (122.95, 140.05) | 0.000 |
Data was expressed as median (interquartile range)
ROC, receiver operating characteristic; OC, occipital clivus; AUC, area under the curve; 95% CI, 95% confidence interval; MAD, mean absolute deviation
Typical cases of NPC and volunteer are illustrated in Figs. 1 and 2. Representative images of OC invasion and OC non-invasion are illustrated in Fig. 3. The comparisons between these three single functional models and calibration curves are presented in Fig. 4.
Fig. 1.
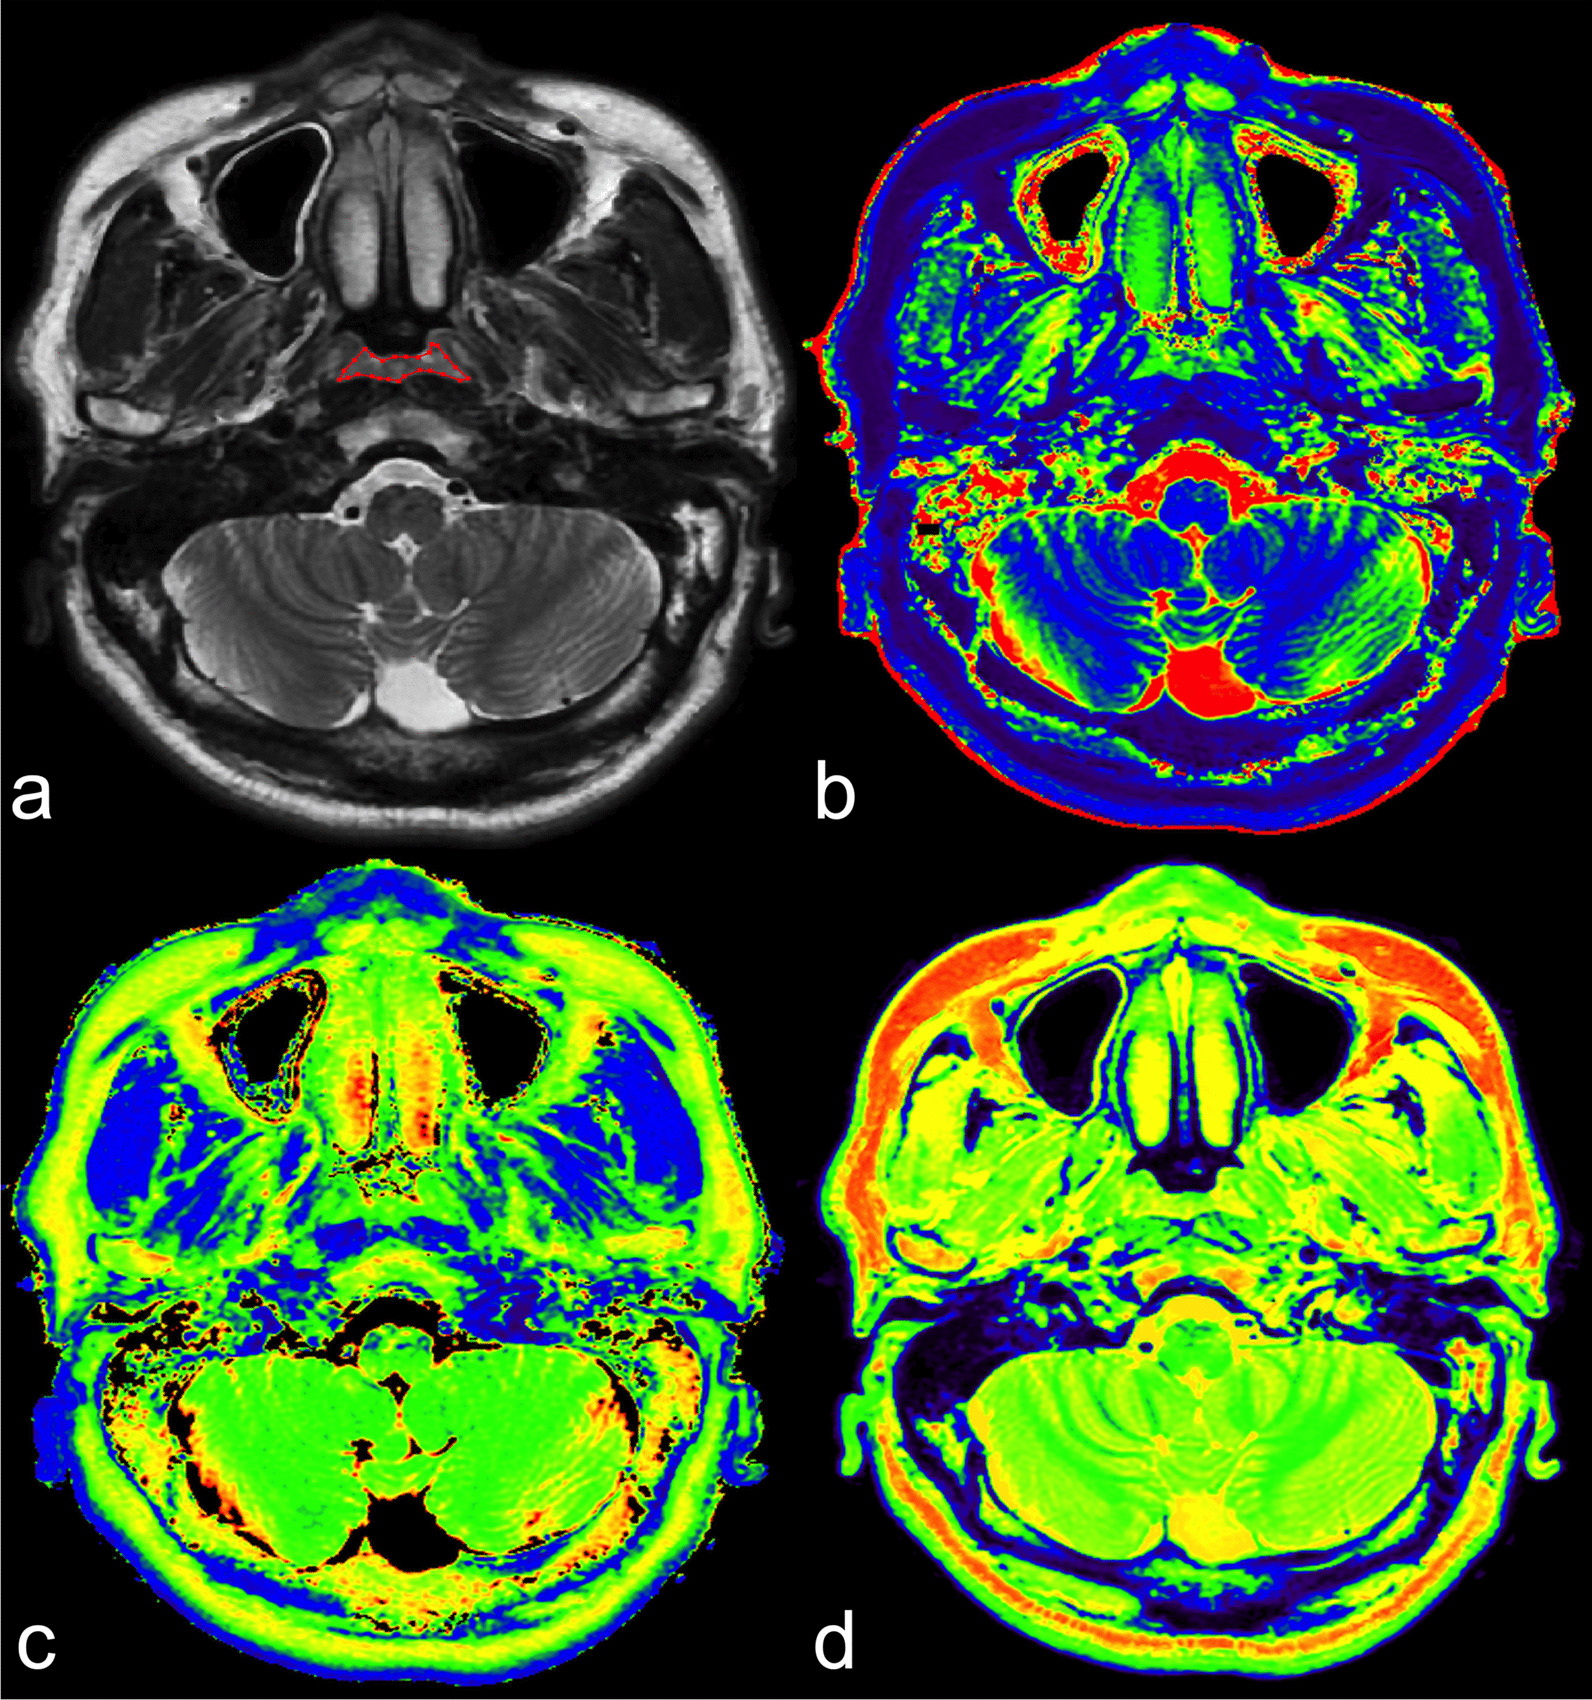
SyMRI of a 48-year-old male NPC patient. a Axial T2WI shows uniform thickening with heterogeneous iso-slightly high signal in the posterior wall of the nasopharyngeal cavity, and bilateral pharyngeal recess are collapsed. VOI was manually delineated along the border of the tumour slice by slice. T1 map (b), T2 map (c) and PD map (d) at the same level as in (a). SyMRI, synthetic magnetic resonance imaging; NPC, nasopharyngeal carcinoma; T2WI, T2-weighted image; VOI, volume of interest; PD, proton density
Fig. 2.
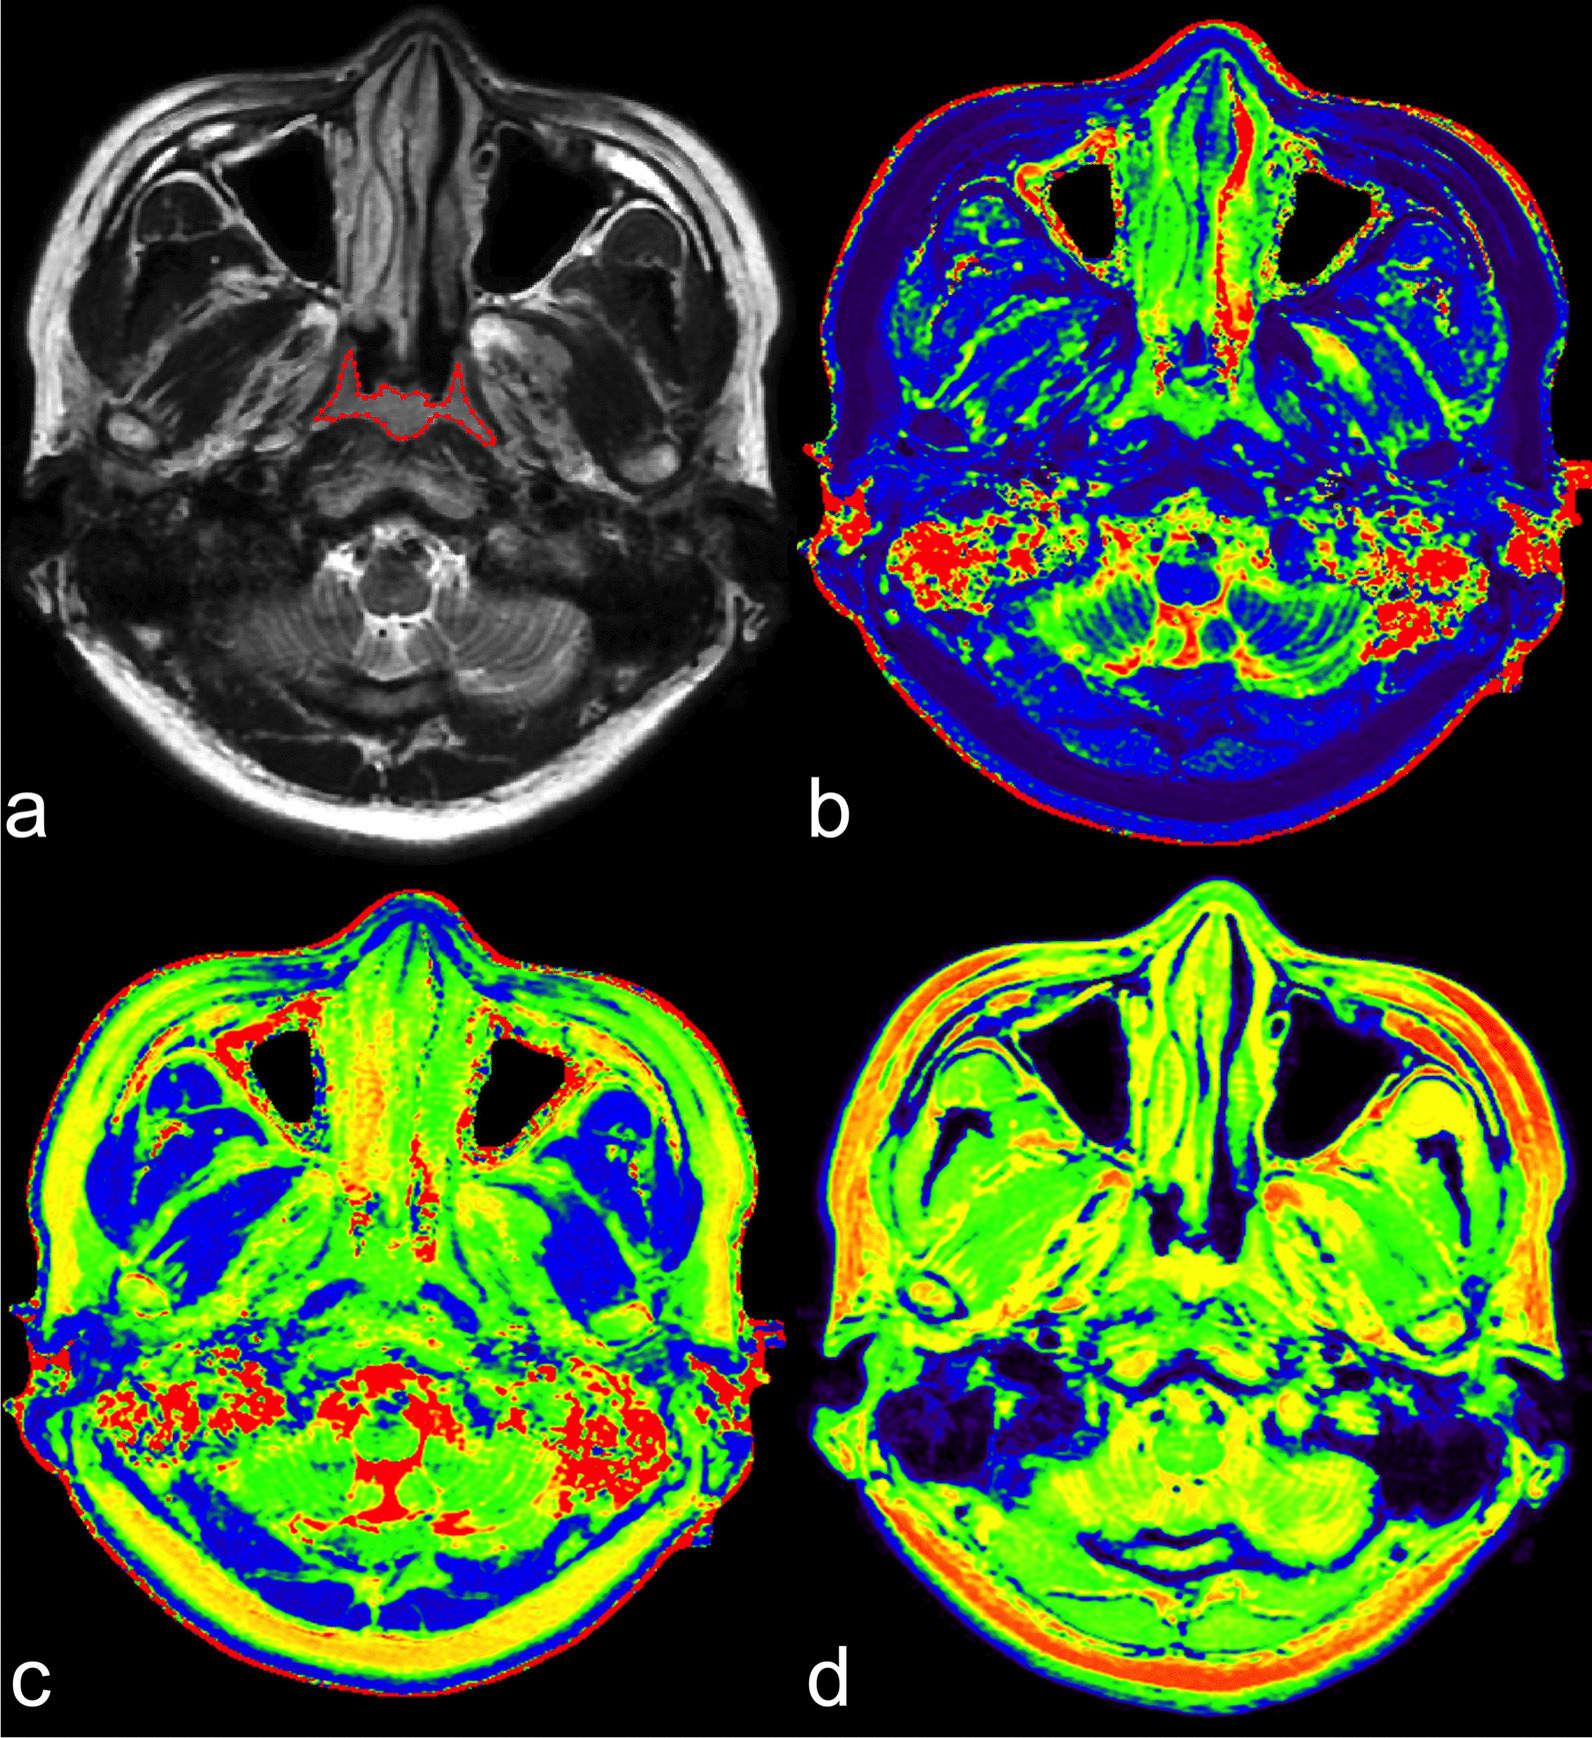
SyMRI of a 38-year-old female volunteer. a Axial T2WI shows hyperenhancing tissue along the posterior nasopharyngeal wall and bilateral lateral nasopharyngeal wall. Bilateral pharyngeal recess are collapsed and show symmetric wall thickness. VOI was manually delineated along the border of the benign mucosa slice by slice. Derived T1 map (b), T2 map (c) and PD map (d). SyMRI, synthetic magnetic resonance imaging; T2WI, T2-weighted image; VOI, volume of interest; PD, proton density
Fig. 3.
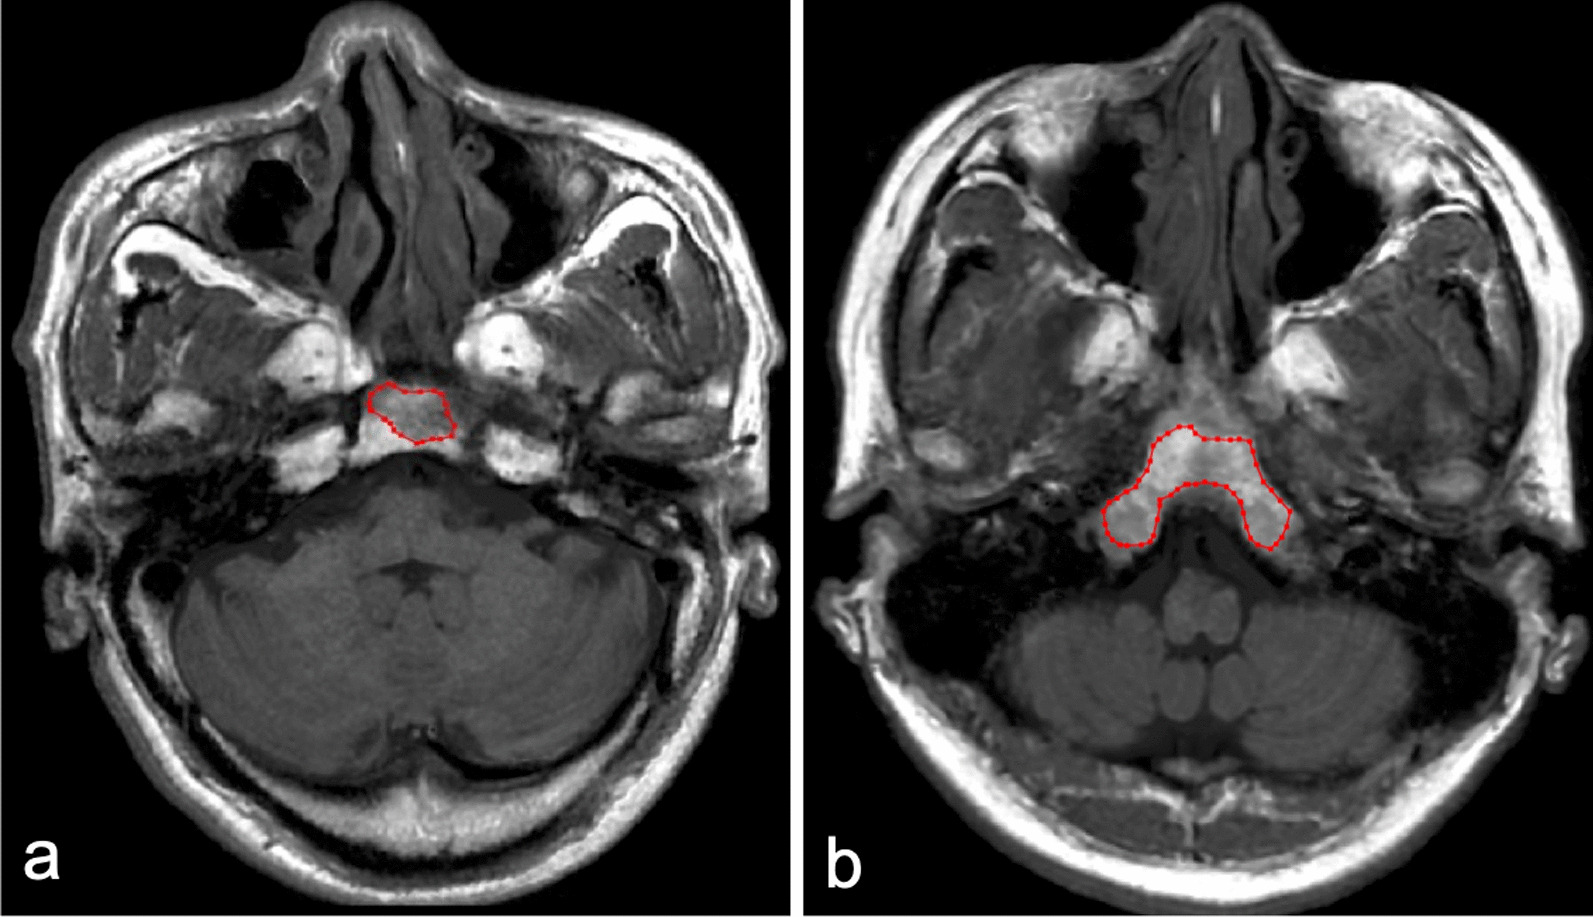
Representative images of OC invasion and OC non-invasion. Invaded OC in 56-year-old NPC patient (a) shows low signal on axial T1WI of SyMRI, which shows similar signal characteristics with non-invaded OC in 38-year-old volunteer (b). VOI was manually delineated along the border of invaded OC and non-invaded OC on axial T1WI of SyMRI. OC, occipital clivus; NPC, nasopharyngeal carcinoma; T1WI, T-weighted image; SyMRI, synthetic magnetic resonance imaging; VOI, volume of interest
Fig. 4.

ROC curves (a, e) and calibration curves (b-d, f–h) of models in all sample. a ROC curves of diagnostic models based on T1, T2 and PD maps for differentiating NPC from NPH in volunteers. Calibration curves of nomogram developed in T1 map (b), T2 map (c) and PD map (d) derived model. e ROC curves of diagnostic models based on T1, T2 and PD maps for the differentiation between OC invasion and OC non-invasion. Calibration curves of nomogram developed in T1 map (f), T2 map (g) and PD map (h) derived model. ROC, receiver operating characteristic; PD, proton density; NPC, nasopharyngeal carcinoma; OC, occipital clivus
Discussion
To our knowledge, this is the first prospective study to investigate the role of SyMRI combined with first-order features for the diagnosis of NPC. Our results demonstrated that the T1, T2 and PD relaxation times of NPC derived from SyMRI images were significantly different from those for NPH. Moreover, in OC invasion discrimination, the T1 map-derived model showed the highest diagnostic performance. These findings indicate that SyMRI could reflect the changes in the intrinsic characteristics of benign nasopharyngeal mucosa progressing to a tumour. These quantitative parameters provide auxiliary value for the morphology, which makes the evaluation more objective.
Endoscopic biopsy is the gold standard for diagnosis of NPC. However, this examination method is invasive and it may miss some lesions generally attributed to submucosal location, coexistent hyperplasia, and difficult pharyngeal recess structure [30, 31]. About 12% of NPC invisible under endoscopy can be successfully detected by MRI [32]. Conventional morphology on MRI, such as location site, symmetry, stripes and signal intensity could be valuable in differentiating NPC from NPH [30]. However, these image features are susceptible to the subjective influence of observers, and contrast agents are required. Recently, radiomics based on T2WI/FS provide a quantitative method to diagnose NPC, but instability in the feature selection step could reduce its reliability [25]. The quantitative parameters of various functional MRIs have also been applied to identify NPC from NPH, and higher Ktrans and blood flow, and lower diffusion parameters (including ADC, D, f) were found in NPC [30, 33, 34]. Moreover, Meng et al. [13] found Mean of T1, T2 and PD maps derived from SyMRI could help in discriminating NPC from NPH, but the performance of PD_Mean was poor (AUC = 0.624) and percentile parameter has an advantage than Mean parameter [35, 36]. Conducted in a non-endemic area, our study increased the sample size and included tumour heterogeneity to further explore the performance of SyMRI in diagnosing NPC, as well as OC invasion.
T1, T2, and PD values reflect the intrinsic properties of tissues. The higher the cellularity is, the lower the extracellular space and free water content, thereby resulting in a reduction in the T1 and T2 values [37]. The 90th percentile, Median and Minimum represent the grey-level intensity within the VOIs. Our results found that NPC had significantly lower T1_Median and T2_Minimum values than NPH. A possible reason was the abundance of mucus in the benign nasopharyngeal mucosa, which correlates with higher T1 and T2 values. Similar results were found in previous studies on NPC vs. NPH, as well as prostate cancer vs. peripheral zone/benign prostatic hyperplasia and cervical cancer vs. normal mucosa [11, 13, 38]. However, recent study [15] found that the mean T1 value of breast malignancy was significantly higher than that of benign tumours, possibly because the ROI of benign tumours included more fat tissue. Thyroid research also showed that papillary thyroid carcinoma had a higher T2 value than contralateral normal tissue [39]. These controversial results stated that the different control groups led to different variations.
The PD value represents the apparent concentration of water protons (mobile hydrogen atoms) in each voxel [40]. When malignant cells invade normal tissue, the density of lesions increases, and the water content decreases, resulting in reduced PD values. The lower PD value also correlates with worse biological tumour behaviour [11, 16]. A study in breast cancer [41] found lower PD values in malignancies than in benign tumours. Our study obtained consistent results, given that several PD values (the 10th, 90th percentile, Mean, Median, Minimum) in NPC were lower than those in NPH, with the most representative being the PD_90th percentile. Due to statistically 90th percentile is less influenced by random fluctuations than Mean value [35], parameter 90th percentile has an advantage over the Mean, which may be one of reasons for the poor performance of PD_Mean in previous study [13].
OC invasion at initial diagnosis is a poor factor for survival of T3 stage NPC patients [6]. Previously studies found the signal intensity of OC is related to age and gender [9], and abnormal residual OC signal could persist several years after radiotherapy without recurrence [27], which make the identification of OC invasion and recurrence somewhat difficult. In addition, according to the criteria reported in studies [26–28], contrast-enhanced sequences are an indispensable examination, so false-positive is more likely to occur in people who only performed non-enhanced scans. Our study demonstrated that SyMRI without contrast agents could objectively evaluate OC invasion. Compared to the OC non-invasion group, the OC invasion group had a higher T1_Mean and lower PD_Maximum and T2_10th percentile, while T1_Mean was the most representative parameter. Cancer cells infiltrate the trabecular architecture and replace the fatty and haematopoietic marrow in normal bone, resulting in increased T1 values and decreased PD and T2 values, which is supported by studies of bone metastasis [42–44]. The MAD parameter may represent tumour heterogeneity, and a higher T2_MAD in the OC invasion group reflects a more heterogeneous tumour structure than that of the OC non-invasion group.
Energy and Total Energy, as larger values, imply a greater sum of the squares of these values and volume-confounded, are thus positively correlated with the magnitude of voxel value and the volume of delineation. In our study, NPC had lower T1, T2 and PD values but higher Total Energy, while OC invasion had a higher T1 value and higher T1_Total Energy, but lower T2 value and lower T2_Energy. We speculated that the volume may greatly impact this formal comparison, since there is a large difference in the parameter volume between NPC tumours and NPH (5945.12 mm3 vs. 1403.05 mm3) but relatively small between OC invasion and non-invasion group (1674.28 mm3 vs. 3281.64 mm3). Zhang et al. [45] found stage IA endometrial carcinoma had lower signal intensities (including Mean, Median and so on) and Total Energy on ADC map than benign endometrial lesions. Ghosh et al. [46] proved that neuroblastomas with MYCN amplification had higher signal intensities (Mean and Maximum) and Energy on ADC map than tumours without MYCN amplification. Zhao et al. [47] also revealed that rectal cancer with lymph node metastasis had both a higher signal intensity (Maximum of the T2 and PD maps) and Energy than cancer without lymph node metastasis. The mapping of values in those three studies was consistent with Energy/Total Energy, so the effect of volume is not mentioned. However, according to our results, we believe that both the mapping value and the volume of the object must be considered when evaluating Energy and Total Energy.
There were several limitations in this study. First, the study sample was relatively small and was not divided into training and validation groups before the model was constructed. We recruited volunteers as control group, who did not perform nasopharyngoscopy and may have nasopharyngeal hyperplasia or inflammation. Therefore, a minimum of 2 years follow-up was conducted on control group, and no tumour sign was found. Due to the spectral deviation of diseases in our hospital and the incidence of tumours, other malignancies (such as lymphoma and adenoid cystic carcinoma) were not included in our research. Second, this was a single-centre study using a certain type of MRI scanner with an identical protocol. Multicentre studies with different MRI scanners and protocols are warranted before our findings are introduced into routine clinical practice. Last, due to the limited number of samples, the tumour stage, histological types and grades of NPC could not be considered, and a comparison between early-stage NPC and NPH could not be conducted in this study. A larger sample size is needed to investigate the correlation between the quantitative parameters of SyMRI and those factors.
Conclusions
The first-order parameters from SyMRI were significantly different between NPC and NPH and between OC invasion and non-invasion. Consequently, SyMRI was shown to be a reliable and useful tool, not only to provide additional quantitative value based on morphology for the diagnosis of NPC but also for evaluating the development of tumours by quantitatively measuring the changes in intrinsic characteristics in tissues.
Supplementary Information
Additional file 1: Supplementary Table 1. Comparison of SyMRI histogram parameters between NPC and NPH. Supplementary Table 2. Comparison of SyMRI histogram parameters between OC invasion group and OC non-invasion group. Supplementary Table 3. AUC analysis and 5-folds Cross-Validation for models.
Acknowledgements
Not applicable.
Abbreviations
- NPC
Nasopharyngeal carcinoma
- ROC
Receiver operating characteristic
- AUC
Area under the curve
- OC
Occipital clivus
- SyMRI
Synthetic magnetic resonance imaging
- PD
Proton density
- RMS
Root mean squared
- VOI
Volumes of interest
- ICC
Interclass correlation
Author contributions
FY, YL and ML conceived this study. FY, YL, XL, XY and ML performed the research and collected the data. FY, YL, XL, YZ and ML analyzed the data. FY and YL wrote and edited the manuscript. XY, LL, LX and ML revised the manuscript for important intellectual content. All authors read and approved the manuscript for publication.
Funding
The authors declares that they received no funding.
Availability of data and materials
The datasets used and analysed during the current study are available from the corresponding author on reasonable request.
Declarations
Ethics approval and consent to participate
The ethics committee of National Cancer Center/National Clinical Research Center for Cancer/Cancer Hospital, Chinese Academy of Medical Sciences and Peking Union Medical College approved this prospective study. Informed consent was obtained from all the participants before the MRI examination. All methods were carried out in accordance with relevant guidelines and regulations.
Consent for publication
Not applicable.
Competing interests
The authors declare that they have no competing interests. And the author Lizhi Xie was the scientist of MR Research China of GE Healthcare who mainly contribute to manuscript editing and did not participate in study design, data collection, analysis or interpretation of this study.
Footnotes
Publisher's Note
Springer Nature remains neutral with regard to jurisdictional claims in published maps and institutional affiliations.
Fan Yang and Yujie Li contributed equally to this paper
Contributor Information
Fan Yang, Email: y731582237@163.com.
Yujie Li, Email: 398599382@qq.com.
Xiaolu Li, Email: limbogo@163.com.
Xiaoduo Yu, Email: yxd136@139.com.
Yanfeng Zhao, Email: zyf24@sina.com.
Lin Li, Email: linlin77216@sina.com.
Meng Lin, Email: lm152@139.com.
References
- 1.Pan JJ, Ng WT, Zong JF, Chan LL, O'Sullivan B, Lin SJ, Sze HC, Chen YB, Choi HC, Guo QJ, et al. Proposal for the 8th edition of the AJCC/UICC staging system for nasopharyngeal cancer in the era of intensity-modulated radiotherapy. Cancer. 2016;122(4):546–558. doi: 10.1002/cncr.29795. [DOI] [PMC free article] [PubMed] [Google Scholar]
- 2.King AD, Woo JKS, Ai QY, Mo FKF, So TY, Lam WKJ, Tse IOL, Vlantis AC, Yip KWN, Hui EP, et al. Early detection of cancer: evaluation of MR imaging grading systems in patients with suspected nasopharyngeal carcinoma. Am J Neuroradiol. 2020;41(3):515–521. doi: 10.3174/ajnr.A6444. [DOI] [PMC free article] [PubMed] [Google Scholar]
- 3.King AD, Woo JKS, Ai QY, Chan JSM, Lam WKJ, Tse IOL, Bhatia KS, Zee BCY, Hui EP, Ma BBY, et al. Complementary roles of MRI and endoscopic examination in the early detection of nasopharyngeal carcinoma. Ann Oncol. 2019;30(6):977–982. doi: 10.1093/annonc/mdz106. [DOI] [PubMed] [Google Scholar]
- 4.King AD, Wong LYS, Law BKH, Bhatia KS, Woo JKS, Ai QY, Tan TY, Goh J, Chuah KL, Mo FKF, et al. MR imaging criteria for the detection of nasopharyngeal carcinoma: discrimination of early-stage primary tumors from benign hyperplasia. Am J Neuroradiol. 2018;39(3):515–523. doi: 10.3174/ajnr.A5493. [DOI] [PMC free article] [PubMed] [Google Scholar]
- 5.Yoo MG, Kim J, Bae S, Ahn SS, Ahn SJ, Koh YW. Detection of clinically occult primary tumours in patients with cervical metastases of unknown primary tumours: comparison of three-dimensional THRIVE MRI, two-dimensional spin-echo MRI, and contrast-enhanced CT. Clin Radiol. 2018;73(4):410.e419–410.e415. doi: 10.1016/j.crad.2017.10.020. [DOI] [PubMed] [Google Scholar]
- 6.Wu B, Guo Y, Yang HH, Gao QG, Tian Y. Predicting bone metastasis risk based on skull base invasion in locally advanced nasopharyngeal carcinoma. Front Oncol. 2022;12:812358. doi: 10.3389/fonc.2022.812358. [DOI] [PMC free article] [PubMed] [Google Scholar]
- 7.Cao C, Jiang F, Jin Q, Jin T, Huang S, Hu Q, Chen Y, Piao Y, Hua Y, Feng X, et al. Locoregional extension and patterns of failure for nasopharyngeal carcinoma with intracranial extension. Oral Oncol. 2018;79:27–32. doi: 10.1016/j.oraloncology.2018.02.004. [DOI] [PubMed] [Google Scholar]
- 8.Cheng YK, Liu LZ, Jiang N, Yue D, Tang LL, Zhang F, Lin L, Liu X, Chen L, Ma J. MRI-detected skull-base invasion: prognostic value and therapeutic implication in intensity-modulated radiotherapy treatment for nasopharyngeal carcinoma. Strahlenther Onkol. 2014;190(10):905–911. doi: 10.1007/s00066-014-0656-7. [DOI] [PubMed] [Google Scholar]
- 9.Bayramoglu A, Aydingöz U, Hayran M, Oztürk H, Cumhur M. Comparison of qualitative and quantitative analyses of age-related changes in clivus bone marrow on MR imaging. Clin Anat. 2003;16(4):304–308. doi: 10.1002/ca.10065. [DOI] [PubMed] [Google Scholar]
- 10.Chen YP, Chan ATC, Le QT, Blanchard P, Sun Y, Ma J. Nasopharyngeal carcinoma. Lancet. 2019;394(10192):64–80. doi: 10.1016/S0140-6736(19)30956-0. [DOI] [PubMed] [Google Scholar]
- 11.Cui Y, Han S, Liu M, Wu PY, Zhang W, Zhang J, Li C, Chen M. Diagnosis and grading of prostate cancer by relaxation maps from synthetic MRI. J Magn Reson Imaging. 2020;52(2):552–564. doi: 10.1002/jmri.27075. [DOI] [PubMed] [Google Scholar]
- 12.Krauss W, Gunnarsson M, Andersson T, Thunberg P. Accuracy and reproducibility of a quantitative magnetic resonance imaging method for concurrent measurements of tissue relaxation times and proton density. Magn Reson Imaging. 2015;33(5):584–591. doi: 10.1016/j.mri.2015.02.013. [DOI] [PubMed] [Google Scholar]
- 13.Meng T, He H, Liu H, Lv X, Huang C, Zhong L, Liu K, Qian L, Ke L, Xie C. Investigation of the feasibility of synthetic MRI in the differential diagnosis of non-keratinising nasopharyngeal carcinoma and benign hyperplasia using different contoured methods for delineation of the region of interest. Clin Radiol. 2021;76(3):238.e9–238.e15. doi: 10.1016/j.crad.2020.10.010. [DOI] [PubMed] [Google Scholar]
- 14.Wang P, Hu S, Wang X, Ge Y, Zhao J, Qiao H, Chang J, Dou W, Zhang H. Synthetic MRI in differentiating benign from metastatic retropharyngeal lymph node: combination with diffusion-weighted imaging. Eur Radiol. 2022;33:152–161. doi: 10.1007/s00330-022-09027-4. [DOI] [PubMed] [Google Scholar]
- 15.Meng T, He N, He H, Liu K, Ke L, Liu H, Zhong L, Huang C, Yang A, Zhou C, et al. The diagnostic performance of quantitative mapping in breast cancer patients: a preliminary study using synthetic MRI. Cancer Imaging. 2020;20(1):88. doi: 10.1186/s40644-020-00365-4. [DOI] [PMC free article] [PubMed] [Google Scholar]
- 16.Cai Q, Wen Z, Huang Y, Li M, Ouyang L, Ling J, Qian L, Guo Y, Wang H. Investigation of synthetic magnetic resonance imaging applied in the evaluation of the tumor grade of bladder cancer. J Magn Reson Imaging. 2021;54:1989–1997. doi: 10.1002/jmri.27770. [DOI] [PubMed] [Google Scholar]
- 17.Zhao L, Liang M, Wu PY, Yang Y, Zhang H, Zhao X. A preliminary study of synthetic magnetic resonance imaging in rectal cancer: imaging quality and preoperative assessment. Insights Imaging. 2021;12(1):120. doi: 10.1186/s13244-021-01063-w. [DOI] [PMC free article] [PubMed] [Google Scholar]
- 18.Ma L, Lian S, Liu H, Meng T, Zeng W, Zhong R, Zhong L, Xie C. Diagnostic performance of synthetic magnetic resonance imaging in the prognostic evaluation of rectal cancer. Quant Imaging Med Surg. 2022;12(7):3580–3591. doi: 10.21037/qims-22-24. [DOI] [PMC free article] [PubMed] [Google Scholar]
- 19.Gourtsoyianni S, Doumou G, Prezzi D, Taylor B, Stirling JJ, Taylor NJ, Siddique M, Cook GJR, Glynne-Jones R, Goh V. Primary rectal cancer: repeatability of global and local-regional MR imaging texture features. Radiology. 2017;284(2):552–561. doi: 10.1148/radiol.2017161375. [DOI] [PMC free article] [PubMed] [Google Scholar]
- 20.Gillies RJ, Kinahan PE, Hricak H. Radiomics: images are more than pictures, they are data. Radiology. 2016;278(2):563–577. doi: 10.1148/radiol.2015151169. [DOI] [PMC free article] [PubMed] [Google Scholar]
- 21.Mao J, Fang J, Duan X, Yang Z, Cao M, Zhang F, Lu L, Zhang X, Wu X, Ding Y, et al. Predictive value of pretreatment MRI texture analysis in patients with primary nasopharyngeal carcinoma. Eur Radiol. 2019;29(8):4105–4113. doi: 10.1007/s00330-018-5961-6. [DOI] [PMC free article] [PubMed] [Google Scholar]
- 22.Li Q, Wang T, Huang Y, Li Q, Liu P, Grimm R, Fu C, Zhang Y, Gu Y. Whole-tumor histogram and texture imaging features on magnetic resonance imaging combined with Epstein-Barr virus status to predict disease progression in patients with nasopharyngeal carcinoma. Front Oncol. 2021;11:610804. doi: 10.3389/fonc.2021.610804. [DOI] [PMC free article] [PubMed] [Google Scholar]
- 23.Ai QYH, Chen W, So TY, Lam WKJ, Jiang B, Poon DMC, Qamar S, Mo FKF, Blu T, Chan Q, et al. Quantitative T1ρ MRI of the head and neck discriminates carcinoma and benign hyperplasia in the nasopharynx. Am J Neuroradiol. 2020;41(12):2339–2344. doi: 10.3174/ajnr.A6828. [DOI] [PMC free article] [PubMed] [Google Scholar]
- 24.Xiao B, Wang P, Zhao Y, Liu Y, Ye Z. Using arterial spin labeling blood flow and its histogram analysis to distinguish early-stage nasopharyngeal carcinoma from lymphoid hyperplasia. Medicine (Baltimore) 2021;100(8):e24955. doi: 10.1097/MD.0000000000024955. [DOI] [PMC free article] [PubMed] [Google Scholar]
- 25.Wong LM, Ai QYH, Zhang R, Mo F, King AD. Radiomics for discrimination between early-stage nasopharyngeal carcinoma and benign hyperplasia with stable feature selection on MRI. Cancers (Basel) 2022;14(14):3433. doi: 10.3390/cancers14143433. [DOI] [PMC free article] [PubMed] [Google Scholar]
- 26.Lu JC, Wei Q, Zhang YQ, Li F. Influence of MRI abnormality in skull base bone on prognosis of nasopharyngeal carcinoma. Cancer Radiother. 2004;8(4):230–233. doi: 10.1016/j.canrad.2004.04.005. [DOI] [PubMed] [Google Scholar]
- 27.Parlak S, Yazici G, Dolgun A, Ozgen B. The evolution of bone marrow signal changes at the skull base in nasopharyngeal carcinoma patients treated with radiation therapy. Radiol Med. 2021;126(6):818–826. doi: 10.1007/s11547-021-01342-y. [DOI] [PubMed] [Google Scholar]
- 28.Hiyama T, Kuno H, Sekiya K, Tsushima S, Sakai O, Kusumoto M, Kobayashi T. Bone subtraction iodine imaging using area detector CT for evaluation of skull base invasion by nasopharyngeal carcinoma. Am J Neuroradiol. 2019;40(1):135–141. doi: 10.3174/ajnr.A5906. [DOI] [PMC free article] [PubMed] [Google Scholar]
- 29.Amin M, Edge S, Greene F. AJCC Cancer Staging Manual. Berlin: Springer; 2016. [Google Scholar]
- 30.Yu JY, Zhang D, Huang XL, Ma J, Yang C, Li XJ, Xiong H, Zhou B, Liao RK, Tang ZY. Quantitative analysis of DCE-MRI and RESOLVE-DWI for differentiating nasopharyngeal carcinoma from nasopharyngeal lymphoid hyperplasia. J Med Syst. 2020;44(4):75. doi: 10.1007/s10916-020-01549-y. [DOI] [PubMed] [Google Scholar]
- 31.Gorolay VV, Niles NN, Huo YR, Ahmadi N, Hanneman K, Thompson E, Chan MV. MRI detection of suspected nasopharyngeal carcinoma: a systematic review and meta-analysis. Neuroradiology. 2022;64(8):1471–1481. doi: 10.1007/s00234-022-02941-w. [DOI] [PMC free article] [PubMed] [Google Scholar]
- 32.King AD, Vlantis AC, Yuen TW, Law BK, Bhatia KS, Zee BC, Woo JK, Chan AT, Chan KC, Ahuja AT. Detection of nasopharyngeal carcinoma by MR imaging: diagnostic accuracy of MRI compared with endoscopy and endoscopic biopsy based on long-term follow-up. Am J Neuroradiol. 2015;36(12):2380–2385. doi: 10.3174/ajnr.A4456. [DOI] [PMC free article] [PubMed] [Google Scholar]
- 33.Li Y, Li X, Yu X, Lin M, Ouyang H, Xie L, Shang Y. Investigating the value of arterial spin labeling and intravoxel incoherent motion imaging on diagnosing nasopharyngeal carcinoma in T1 stage. Cancer Imaging. 2020;20(1):62. doi: 10.1186/s40644-020-00339-6. [DOI] [PMC free article] [PubMed] [Google Scholar]
- 34.Ai QY, King AD, Chan JSM, Chen W, Chan KCA, Woo JKS, Zee BCY, Chan ATC, Poon DMC, Ma BBY, et al. Distinguishing early-stage nasopharyngeal carcinoma from benign hyperplasia using intravoxel incoherent motion diffusion-weighted MRI. Eur Radiol. 2019;29(10):5627–5634. doi: 10.1007/s00330-019-06133-8. [DOI] [PubMed] [Google Scholar]
- 35.Chung WJ, Kim HS, Kim N, Choi CG, Kim SJ. Recurrent glioblastoma: optimum area under the curve method derived from dynamic contrast-enhanced T1-weighted perfusion MR imaging. Radiology. 2013;269(2):561–568. doi: 10.1148/radiol.13130016. [DOI] [PubMed] [Google Scholar]
- 36.Qamar S, King AD, Ai QH, Mo FKF, Chen W, Poon DMC, Tong M, Ma BB, Yeung DK, Wang YX, et al. Pre-treatment amide proton transfer imaging predicts treatment outcome in nasopharyngeal carcinoma. Eur Radiol. 2020;30(11):6339–6347. doi: 10.1007/s00330-020-06985-5. [DOI] [PubMed] [Google Scholar]
- 37.Li Q, Xiao Q, Yang M, Chai Q, Huang Y, Wu PY, Niu Q, Gu Y. Histogram analysis of quantitative parameters from synthetic MRI: correlations with prognostic factors and molecular subtypes in invasive ductal breast cancer. Eur J Radiol. 2021;139:109697. doi: 10.1016/j.ejrad.2021.109697. [DOI] [PubMed] [Google Scholar]
- 38.Wang M, Perucho JAU, Cao P, Vardhanabhuti V, Cui D, Wang Y, Khong PL, Hui ES, Lee EYP. Repeatability of MR fingerprinting in normal cervix and utility in cervical carcinoma. Quant Imaging Med Surg. 2021;11(9):3990–4003. doi: 10.21037/qims-20-1382. [DOI] [PMC free article] [PubMed] [Google Scholar]
- 39.Shi R, Yao Q, Wu L, Zhou Q, Lu Q, Gao R, Hu J, Kao L, Bains A, Yan Z, et al. T2* mapping at 3.0T MRI for differentiation of papillary thyroid carcinoma from benign thyroid nodules. J Magn Reson Imaging. 2016;43(4):956–961. doi: 10.1002/jmri.25041. [DOI] [PubMed] [Google Scholar]
- 40.Mezer A, Rokem A, Berman S, Hastie T, Wandell BA. Evaluating quantitative proton-density-mapping methods. Hum Brain Mapp. 2016;37(10):3623–3635. doi: 10.1002/hbm.23264. [DOI] [PMC free article] [PubMed] [Google Scholar]
- 41.Gao W, Zhang S, Guo J, Wei X, Li X, Diao Y, Huang W, Yao Y, Shang A, Zhang Y, et al. Investigation of synthetic relaxometry and diffusion measures in the differentiation of benign and malignant breast lesions as compared to BI-RADS. J Magn Reson Imaging. 2021;53(4):1118–1127. doi: 10.1002/jmri.27435. [DOI] [PubMed] [Google Scholar]
- 42.Choi MH, Lee SW, Kim HG, Kim JY, Oh SW, Han D, Kim DH. 3D MR fingerprinting (MRF) for simultaneous T1 and T2 quantification of the bone metastasis: initial validation in prostate cancer patients. Eur J Radiol. 2021;144:109990. doi: 10.1016/j.ejrad.2021.109990. [DOI] [PubMed] [Google Scholar]
- 43.Arita Y, Takahara T, Yoshida S, Kwee TC, Yajima S, Ishii C, Ishii R, Okuda S, Jinzaki M, Fujii Y. Quantitative assessment of bone metastasis in prostate cancer using synthetic magnetic resonance imaging. Invest Radiol. 2019;54(10):638–644. doi: 10.1097/RLI.0000000000000579. [DOI] [PubMed] [Google Scholar]
- 44.Maeder Y, Dunet V, Richard R, Becce F, Omoumi P. Bone marrow metastases: T2-weighted dixon spin-echo fat images can replace T1-weighted spin-echo images. Radiology. 2018;286(3):948–959. doi: 10.1148/radiol.2017170325. [DOI] [PubMed] [Google Scholar]
- 45.Zhang J, Yu X, Zhang X, Chen S, Song Y, Xie L, Chen Y, Ouyang H. Whole-lesion apparent diffusion coefficient (ADC) histogram as a quantitative biomarker to preoperatively differentiate stage IA endometrial carcinoma from benign endometrial lesions. BMC Med Imaging. 2022;22(1):139. doi: 10.1186/s12880-022-00864-9. [DOI] [PMC free article] [PubMed] [Google Scholar]
- 46.Ghosh A, Yekeler E, Dalal D, Holroyd A, States L. Whole-tumour apparent diffusion coefficient (ADC) histogram analysis to identify MYCN-amplification in neuroblastomas: preliminary results. Eur Radiol. 2022;32:8453–8462. doi: 10.1007/s00330-022-08750-2. [DOI] [PubMed] [Google Scholar]
- 47.Zhao L, Liang M, Shi Z, Xie L, Zhang H, Zhao X. Preoperative volumetric synthetic magnetic resonance imaging of the primary tumor for a more accurate prediction of lymph node metastasis in rectal cancer. Quant Imaging Med Surg. 2021;11(5):1805–1816. doi: 10.21037/qims-20-659. [DOI] [PMC free article] [PubMed] [Google Scholar]
Associated Data
This section collects any data citations, data availability statements, or supplementary materials included in this article.
Supplementary Materials
Additional file 1: Supplementary Table 1. Comparison of SyMRI histogram parameters between NPC and NPH. Supplementary Table 2. Comparison of SyMRI histogram parameters between OC invasion group and OC non-invasion group. Supplementary Table 3. AUC analysis and 5-folds Cross-Validation for models.
Data Availability Statement
The datasets used and analysed during the current study are available from the corresponding author on reasonable request.