

Abstract
Analysis of retina cell type-specific epigenetic and transcriptomic signatures is crucial to understanding the pathophysiology of retinal degenerations such as age-related macular degeneration (AMD) and delineating cell autonomous and cell-non-autonomous mechanisms. We have discovered that Aldh1l1 is specifically expressed in the major macroglia of the retina, Müller glia, and, unlike the brain, is not expressed in retinal astrocytes. This allows use of Aldh1l1 cre drivers and Nuclear Tagging and Translating Ribosome Affinity Purification (NuTRAP) constructs for temporally controlled labeling and paired analysis of Müller glia epigenomes and translatomes. As validated through a variety of approaches, the Aldh1l1cre/ERT2-NuTRAP model provides Müller glia specific translatomic and epigenomic profiles without the need to isolate whole cells. Application of this approach to models of acute injury (optic nerve crush) and chronic stress (aging) uncovered few common Müller glia-specific transcriptome changes in inflammatory pathways, and mostly differential signatures for each stimulus. The expression of members of the IL-6 and integrin-linked kinase signaling pathways was enhanced in Müller glia in response to optic nerve crush but not aging. Unique changes in neuroinflammation and fibrosis signaling pathways were observed in response to aging but not with optic nerve crush. The Aldh1l1cre/ERT2-NuTRAP model allows focused molecular analyses of a single, minority cell type within the retina, providing more substantial effect sizes than whole tissue analyses. The NuTRAP model, nucleic acid isolation, and validation approaches presented here can be applied to any retina cell type for which a cell type-specific cre is available.
Keywords: Müller glia, Retina, Transcriptome, Epigenome, Acute stress, Optic nerve crush, Chronic stress, Aging, Affinity purification, TRAP, INTACT, NuTRAP
1. Introduction
The retina is a complex light-sensitive tissue composed of a variety of cell types. Rod and cone photoreceptors convert visible light into electrical signals, which are then transmitted to the brain through second-order bipolar cells and third-order ganglion cells. Horizontal and amacrine cells, two types of interneurons, provide inhibitory signals to neurons in the retina. The retina also houses microglia and two major macroglia, Müller glial cells (MGC) and astrocytes. MGC, the most common retinal glial cell type, have processes that extend radially across all retinal layers, where they provide neuronal metabolic support, supply neurotrophic factors, and maintain tissue homeostasis (Bringmann et al., 2006; Goldman, 2014).
Apart from their role in maintaining the normal physiology of the retina, MGC have been hypothesized to play an early role in the onset of inflammatory processes responsible for retinal damage at later stages of diabetic retinopathy (DR) (Rubsam et al., 2018), during glaucomatous degeneration (Choi et al., 2020), as well as in age-related macular degeneration (AMD) (Jones et al., 2016), the leading cause of irreversible blindness in the elderly (Pennington and DeAngelis, 2016). A recent single-cell transcriptomic atlas of the human retina identified MGC as one of the retinal cell types with the highest association to AMD (Menon et al., 2019), providing a rationale to study MGC in the pathogenesis of AMD and potentially as a target for therapeutic intervention. Along with other studies (Araujo et al., 2018; Lin et al., 2019; Pauly et al., 2019), this supports the clinical relevance of understanding gene regulatory mechanisms in retinal MGC.
Epigenetic modifications such as methylcytosine (mC) and hydroxymethylcytosine (hmC), affect DNA accessibility, acting as regulators of genomic organization and gene expression (Du et al., 2017). Identification of epigenetic contributions to regulation of gene expression in the retina is key to understanding mechanisms of cell fate acquisition during development, normal cell physiology, as well as pathways underlying the onset and progression of retinal diseases (Corso-Diaz et al., 2018). Genome-wide methylation analyses of AMD blood and retinae provided initial evidence for aberrant methylation as a contributor to the development or progression to AMD (Hunter et al., 2012). Comparison of DNA methylation, together with mRNA levels of antioxidant genes, revealed significant differences between AMD and normal retinae, suggesting increased susceptibility to oxidative stress in AMD. IL17RC promoter methylation in AMD patients correlates to elevated protein and mRNA expression in peripheral blood, affected retina, and choroid, suggesting potential diagnosis biomarkers and a pathogenic mechanism of AMD (Wei et al., 2012). In addition, a widespread decrease of chromatin accessibility has been reported in retinae and retinal pigmented epithelium (RPE) of AMD subjects (Wang et al., 2018). However, these studies have examined whole retinal tissue samples containing multiple cell types and given that epigenomic patterns govern cell identity, cell type-specific analyses are greatly needed.
Transcriptional regulation through epigenetic mechanisms in the retina, including studies on the topology of DNA methylation in select retina-specific genes, the role of DNA methylation in retinal development and programmed retinal cell death (Mo et al., 2016; Wahlin et al., 2013), and the epigenomic differences between rod and cone photoreceptors (Mo et al., 2016) have been subjects of prior research interest. Furthermore, as MGC are a source of progenitors for retinal regeneration, the epigenetic profile of MGC has been compared with retinal progenitor cells (RPC) (Dvoriantchikova et al., 2019; Powell et al., 2013; VandenBosch et al., 2020). Zebrafish MGC genomic methylation levels are reported to change as they reprogram and generate progenitors (Powell et al., 2013). In wild type mice, the epigenomic plasticity of developing and adult MGC to be reprogrammed and differentiated into retinal neurons has been evaluated (Dvoriantchikova et al., 2019). MGC are epigenetically very close to late-born retinal neurons, but not early-born retinal neurons, and that regeneration blockade of the retina from MGC is regulated by repressive chromatin and highly methylated promoters of genes required for the development of early-born retinal neurons (Dvoriantchikova et al., 2019). In a study that used Rlbp1-GFP mice, genomic DNA methylome analysis showed that expression differences between MGC and RPC are highly correlated to DNA methylome differences suggesting epigenomic regulation of a subset of MGC–specific functional genes during development (Lin et al., 2019). More recently, ATAC-seq analysis of postnatal neurogenic RPC and developing and mature MGC showed that the epigenomic landscape of progenitors and mature MGC were very similar, with approximately 60% of progenitor accessible domains shared with mature MGC, consistent with similarities in gene expression between progenitors and MGC, and revealed transition states in the neurogenic potential of immature murine glia (VandenBosch et al., 2020). Despite the ongoing efforts, epigenomic control in the retina with health and disease is nearly completely uncharacterized and requires new tools for cell type-specific evaluation in mammalian models.
A number of studies have performed cell type-specific mRNA expression analysis of retinal MGC. Enrichment of cells from dissociated murine retinal tissue manually under the microscope (Roesch et al., 2008), by fluorescence-activated cell sorting (FACS) (Xue et al., 2011), or from single cell suspensions (Pauly et al., 2019; Heng et al., 2019; Hoang et al., 2020; Macosko et al., 2015), have been used to study glial transcriptomes in the retina. A caveat to these studies is that the cell preparation methods require tissue dissociation which distorts cell morphology, shears away cellular processes (Grosche et al., 2016), and can cause activational artifacts (Ocanas et al., 2022). Thus, cell isolation/FACS may not be ideally suited for cell type-specific studies of retinal glia. Single cell approaches may overcome some of the challenges of cell sorting but the scale of such studies needed to examine minority cell populations, incomplete genomic/transcriptomic coverage, restriction to only certain types of endpoints, and continued potential for retina dissociation artifacts are limitations. In this context, transgenic tagging animal models that allow cell-specific isolation of both DNA and RNA (Dougherty, 2017), avoiding tedious and perturbing protocols of cell dissociation and sorting, are a valuable tool for the paired comparison of cell-type specific genomics and transcriptomics of glial cells.
In this study, we validate a novel tamoxifen-inducible Aldh1l1-NuTRAP mouse model to specifically isolate and analyze both the epigenome and translatome from retinal MGC in normal conditions, as well as following acute retina injury and with retinal aging, an established major risk factor for both AMD and glaucoma (Guedes et al., 2011; Luu and Palczewski, 2018). This model, generated by crossing Aldh1l1-cre/ERT2 (Srinivasan et al., 2016) with NuTRAP (Roh et al., 2017) mice, was recently validated in the brain for the paired epigenomic and translatomic analysis of astrocytes (Chucair-Elliott et al., 2020). Here, we show that in the neuroretina the Aldh1l1-cre/ERT2 recombinase targets glutamine synthetase (GS)+ cells, consistent with MGC, but not retinal astrocytes. RNAseq data from TRAP-isolated RNA show significant enrichment of MGC specific-transcripts, consistent with the physiology of MGC, while overall depletion of other retina cell type marker genes. We demonstrate that INTACT-isolated DNA allows for the study of epigenetic marks in MGCs and for correlation with gene expression. We show that MGC translatomic changes occur in response to retinal aging and optic nerve crush (ONC), consistent with up-regulation of expression of components of inflammatory/stress pathways under chronic and acute types of stress, but with significant differences in the nature and extent of inflammation.
2. Materials and methods
2.1. Animals
All animal procedures were approved by the Institutional Animal Care and Use Committee at the Oklahoma Medical Research Foundation (OMRF). Breeder mice were purchased from the Jackson Laboratory (Bar Harbor, ME) and housed in the animal facility at OMRF, under SPF conditions in a HEPA barrier environment. Aldh1l1-Cre/ERT2+/wt males (stock number # 29655) (Srinivasan et al., 2016) were mated with NuTRAPflox/flox females (stock # 029899) (Roh et al., 2017) to generate the desired progeny, Aldh1l1-cre/ERT2+/wt; NuTRAPflox/wt (Aldh1l1-cre/ERT2+; NuTRAP+). DNA was extracted from mouse ear punch samples for genotyping. Mice (males and females) were between 4 and 24 months old at the time of performing experiments as detailed below. Euthanasia prior to tissue harvesting was carried out by cervical dislocation and decapitation. The primers used for genotyping (Integrated DNA Technologies, Coralville, IA) are included in Supplementary Table 1.
2.2. Tamoxifen (Tam) treatment
For all studies, at ~3–5 months of age, mice received a daily intraperitoneal (ip) injection of tamoxifen (Tam) solubilized in 100% sunflower seed oil by sonication (100 mg/kg body weight, 20 mg/ml stock solution, #T5648; Millipore Sigma, St. Louis, MO) for five consecutive days (Chucair-Elliott et al., 2020).
2.3. Optic nerve crush procedure (ONC)
Mice were anesthetized by intraperitoneal injection of 80–100 mg/kg ketamine and 5–10 mg/kg xylazine. For each mouse, one eye was subjected to ONC procedure while the fellow eye was left untreated as control, or was subjected to sham procedure. The optic nerve crush (ONC) procedure was performed as previously described, with minor modifications (Li et al., 1999; Mac Nair et al., 2016). Briefly, the bulbar conjunctiva was bundled and lifted with sterile forceps (World Precision Instruments, Cat# 555007FT) and temporally cut 90° to the anterior-posterior eye globe axis using sterile spring scissors (Fine Science Tools, Cat# 91501-09). Using a pair of self-closing forceps (Dumont Tweezer #7, 12 cm, 0.07 × 0.03 mm, curved; WPI; Cat# 501205), the orbital blood sinuses were retracted to expose the optic nerve. The self-closing forceps were opened, were placed over the optic nerve, and were released approximately 1 mm from the posterior pole to clamp the optic nerve for 3 s. After clamping, the forceps were carefully removed from the surgical window and the eye was treated with Bacitracin Antibiotic Ointment. Mice were then injected with 0.2 mg/kg buprenorphine subcutaneously for post-surgical analgesia. After recovery from anesthesia, mice were returned to cages and monitored for normal habits to detect any ill effects until time of collection, at 72 h post-procedure.
2.4. Immunochemistry and imaging
Retina frozen sections:
Eyeballs were removed, and the cornea and lens were dissected away. The resulting eyecups were fixed for 20 min with 4% paraformaldehyde (PFA). Eyecups were cryoprotected by sequential incubation in PBS containing 15% and 30% sucrose, and then frozen in Optimal Cutting Temperature medium (Tissue-Tek, #4583). Retinal cryosections (12 μm-thick; Cryostar NX70, ThermoFisher Scientific) were rinsed in PBS containing 1% Triton X-100, blocked with 10% normal donkey serum at room temperature for 1 h, and immunostained with primary antibodies (4 °C overnight), including: rabbit anti-mCherry (#ab167453, 1:500, Abcam, Cambridge, MA), chicken anti-mCherry (#ab205402, 1:500, Abcam), rabbit anti-glutamine synthetase (GS) (#ab228590, 1:200, Abcam), mouse anti-GS (#MAB302, 1:1000, Millipore Sigma), chicken anti-glial fibrillary acidic protein (GFAP) (#ab4674, 1:1000, Abcam), rat anti-CD11b (#C227, 1:200, Leinco Technologies, St. Louis, MO). After rinsing in PBS, samples were incubated with fluorescently labeled secondary antibodies (Jackson ImmunoResearch Labs, 1:150, West Grove, PA) at room temperature for 1 h, rinsed, and mounted onto microscope slides using 50% glycerol (in 1× PBS). Retina flatmounts: Eyeballs were fixed for 2 h at room temperature in 4% PFA (1× PBS) prior to retinal tissue dissection. Dissected retinae were permeabilized in 1% Triton X-100 at 4 °C overnight, incubated in blocking buffer (10% normal horse serum/0.1% Triton X-100/1× PBS) at room temperature for 1.5 h or at 4 °C overnight, followed by blocking buffer containing mouse anti-GS, chicken anti-GFAP, rabbit anti-mCherry, and goat polyclonal Brn3a (#sc-31,984 (C-20),1:100; Santa Cruz Biotechnology, Dallas, TX) primary antibodies at 4 °C overnight. Samples were washed four times at room temperature in 0.1% Triton X 100/1× PBS for 15 min per wash and then incubated in blocking buffer containing secondary antibodies (1:250; Jackson ImmunoResearch Labs) at 4 °C overnight. After four more washes (room temperature, 15 min per wash) in 0.1% Triton X-100, samples were flat mounted onto microscope slides using 50% glycerol (in 1× PBS). In both types of sample preparation, DAPI was used as nuclei counterstain. Imaging of nuclei suspensions: Unfixed, freshly isolated nuclei were mixed with DAPI solution. Sequential imaging of retina samples and freshly isolated nuclei was performed on an Olympus FluoView confocal laser-scanning microscope (FV1200; Olympus; Center Valley, PA) at the Dean McGee Eye Institute imaging core facility at OUHSC. Microscope and FLUOVIEW FV1000 Ver. 1.2.6.0 software (Olympus) settings were identical for samples within experiments at the same magnification. The experimental format files were in .oif (4-channel capture) or .oib (2 or 3-channel capture) formats. For frozen retina samples, imaging was performed in consistent posterior retinal areas across samples. The final Z-stack generated was achieved at 1.26 μm step size with a total of 8 optical slices at 20× magnification (2× or 2.5× zoom) and/or 0.58 μm step size with a total of 18 optical slices at 40 X magnifications (1.5× zoom). For retina flatmount imaging at GCL and INL locations, the final Z-stack generated was achieved at 1.6 μm step size with a total of 7–9 optical slices at the GCL layer and 13 optical slices at the INL location at 20× magnification (2× or 2.5× zoom). For retina flatmount quantification, four 20× images representing four different quadrants surrounding and proximal to the optic nerve head were captured. To capture RGC staining, z-stack images containing 16 optical slices with a step size of 1.25 μm/step size were obtained in order to observe the Brn3a-stained tissue in the inner retinal RGC layer. For quantification of Brn3a immunostaining ImageJ was used. First, the Brn3a channel was isolated, then the threshold command was imposed and a range of 75–255 was used to minimize background. Finally, particles greater than a size of 100 were counted and used for GraphPad Prism statistical analysis (GraphPad Prism version 9.0.0, San Diego, CA) and histographical representation. Data presented is mean ± SEM. For nuclei samples, the Z-stack was achieved at 1.16 μm step size with 10 optical slices at 40× magnification (2.5× zoom).
2.5. Translating Ribosome Affinity Purification (TRAP) and RNA extraction
The purification of cell-specific, ribosomally loaded RNA from retina tissue from Tam-induced Aldh1l1-cre/ERT2+; NuTRAP+ mice was achieved following an established protocol, with slight modifications (Heng et al., 2019; Roh et al., 2017; Chucair-Elliott et al., 2020). For each sample, two retinae were pooled and homogenized in 1.0 ml ice-cold homogenization buffer (50 mM Tris, pH 7.4; 12 mM MgCl2; 100 mM KCl; 1% NP-40; 1 mg/ml sodium heparin; 1 mM DTT) supplemented with 100 μg/ml cycloheximide (#C4859-1ML, Millipore Sigma), 0.5 mM spermidine (#05292-1ML-F, Millipore Sigma), 200 units/ml RNaseOUT Recombinant Ribonuclease Inhibitor (#10777019; Thermo Fisher), and 1× cOmplete, EDTA-free Protease Inhibitor Cocktail (#11836170001; Millipore Sigma) with a glass dounce tissue grinder set (#D8938; 10 times with pestle A only). The homogenate was transferred to a 2 ml round-bottom tube and centrifuged at 10,000 xg for 10 min at 4 °C. After centrifugation, 150 μl of the supernatant was saved as input. The remaining supernatant was transferred to a 2 ml round-bottom tube and incubated with 5 μg/μl of anti-GFP antibody (ab290; Abcam) at 4 °C with end-over-end rotation overnight. Dynabeads Protein G for Immunoprecipitation (#10003D; Thermo Fisher) were washed three times in 1 ml ice-cold low-salt wash buffer (50 mM Tris, pH 7.5; 12 mM MgCl2; 100 mM KCl; 1% NP-40; 100 μg/ml cycloheximide; 1 mM DTT). After removal of the last wash, the homogenate/antibody mixture was transferred to the 2 ml round-bottom tube containing the washed Protein-G Dynabeads and incubated at 4 °C overnight with end-over-end rotation. Magnetic beads were collected using a DynaMag-2 magnet. Beads were then washed three times with 1 ml of high-salt wash buffer (50 mM Tris, pH 7.5; 12 mM MgCl2; 300 mM KCl; 1% NP-40; 100 μg/ml cycloheximide; 1 mM DTT). Following the last wash, 350 μl of Buffer RLT (Qiagen) supplemented with 3.5 μl 2-β mercaptoethanol was added directly to the beads and incubated with mixing on a ThermoMixer (Eppendorf) for 10 min at room temperature. The beads were magnetically separated and the supernatant containing the target bead-bound ribosomes and associated RNA was transferred to a new tube. 350 μl of 100% ethanol was added to the tube (“positive” fraction: enriched in translatome associated to EGFP-tagged ribosomes) and then loaded onto a RNeasy MinElute column. RNA was isolated using RNeasy Mini Kit (#74104, Qiagen), according to manufacturer’s instructions. RNA was quantified with a Nanodrop One spectrophotometer (Thermo Fisher Scientific) and its quality assessed by HSRNA ScreenTape with a 4150 TapeStation analyzer (Agilent Technologies, Santa Clara, CA).
2.6. Library construction and RNA sequencing (RNAseq)
The NEBNext Ultra II Directional Library Prep Kit for Illumina (#NEBE7760L; New England Biolabs Inc., Ipswich, MA) was used with 25 ng of total RNA for the preparation of strand-specific sequencing libraries from TRAP-isolated RNA samples (input and positive fraction) according to manufacturer’s instructions (Chucair-Elliott et al., 2020). Briefly, polyA containing mRNA was purified using oligo-dT attached magnetic beads. mRNA was chemically fragmented and cDNA synthesized. For strand-specificity, the incorporation of dUTP instead of dTTP in the second strand cDNA synthesis does not allow amplification past this dUTP with the polymerase. Following cDNA synthesis, each product underwent end repair process, the addition of a single ‘A’ base, and finally ligation of adapters. The cDNA products were further purified and enriched using PCR to make the final library for sequencing. Library sizing was performed with HS RNA ScreenTape (#5067-5579; Agilent Technologies). The libraries for each sample were pooled at 2–4 nM concentration and sequenced using an Illumina NovaSeq 6000 system (PE150bp) at the OMRF Clinical Genomics Facility.
2.7. RNAseq data analysis
Following sequencing, reads were trimmed, aligned, differential expression statistics, and correlation analyses were performed using the Strand NGS software package (Version 3.1, Bangalore, India) (Chucair-Elliott et al., 2020; Chucair-Elliott et al., 2019). Reads were aligned against the Mm10 build of the mouse genome with RefSeq Genes and Transcripts (2013.04.01) annotation build. Alignment and filtering criteria included: adapter trimming, fixed 2 bp trim from 5′ and 6 bp from 3′ ends, a maximum number of one novel splice allowed per read, a minimum of 90% identity with the reference sequence, a maximum of 5% gap, trimming of 3′ end with Q < 30. Alignment was performed directionally with Read 1 aligned in reverse and Read 2 in forward orientation. Reads were filtered based on the mapping status and only those reads that aligned normally (in the appropriate direction) were retained. Normalization was performed with the DESeq algorithm. Transcripts with an average read count value ≥50 in at least 100% of the samples in at least one group were considered expressed at a level sufficient for quantitation and those transcripts below this level were considered not detected/not expressed and excluded, as these low levels of reads are close to background and are highly variable. For statistical analysis of differential expression, a moderated t-test with Benjamini-Hochberg Multiple Testing Correction was used. For those transcripts meeting this statistical criterion, a fold change >|1.25| cutoff was used to eliminate those genes which were statistically significant but unlikely to be biologically significant and orthogonally confirmable due to their very small magnitude of change. Visualizations of hierarchical clustering and principle components analysis were performed in Strand NGS (Version 3.1, Bangalore, India). The entirety of the sequencing data is available for download in FASTQ format from NCBI Sequence Read Archive (GSE197500, GSE197503, GSE197481, GSE197507). Cell type signature maker gene lists were generated by consolidating published lists from three different studies (Pauly et al., 2019; Heng et al., 2019; Hoang et al., 2020) following removal of any genes that appeared on lists for multiple cell types. For heatmap representation of cell-type signature genes, Morpheus, https://software.broadinstitute.org/morpheus was used. Lists of differentially expressed genes were imported into the IPA software Ingenuity Pathway Analysis (IPA) 01.12 (Qiagen Bioinformatics) to assess upstream regulator and canonical pathway analyses or uploaded in WEB-based Gene Set AnaLysis Toolkit (WebGestalt) (Liao et al., 2019) for over-representation analysis.
2.8. Quantitative PCR (qPCR)
Confirmation of gene expression levels was performed with qPCR (Chucair-Elliott et al., 2020; Chucair-Elliott et al., 2019). cDNA was synthesized with the ABI High-Capacity cDNA Reverse Transcription Kit (Applied Biosystems Inc., Foster City, CA) from 25 to 50 ng of purified RNA. qPCR was performed with gene-specific primer probe fluorogenic exonuclease assays (TaqMan, Life Technologies, Waltham, MA, Supplemental Table 2) and the QuantStudio™ 12 K Flex Real-Time PCR System (Applied Biosystems). Relative gene expression (RQ) was calculated with Expression Suite v 1.0.3 software using the 2−ΔΔCt analysis method with Hprt as an endogenous control.
2.9. Isolation of Nuclei from Tagged specific nuclei (INTACT) and gDNA extraction
The purification of viable, cell-specific nuclei from retina tissue from Tam-induced Aldh1l1-cre/ERT2+; NuTRAP+ mice was achieved by combining two previously published protocols, with modifications (Chucair-Elliott et al., 2020; Deal and Henikoff, 2011; Habib et al., 2017). For each sample, two retinae were homogenized in 1 ml ice-cold nuclei EZ lysis buffer (#NUC-101, Millipore Sigma) supplemented with 1× Halt protease inhibitor cocktail (Thermo Fisher Scientific) and 1 mM DTT using a glass dounce tissue grinder set (20 times with pestle A and 20 times with pestle B). Undissociated tissue, largely composed of blood vessels, was removed by centrifugation at 200 xg for 1.5 min at 4 °C, and the supernatant containing the nuclear material filtered through a 30 μm strainer and centrifuged at 500 xg for 5 min at 4 °C. The resulting nuclear pellet was resuspended in nuclei lysis EZ buffer, incubated on ice for 5 min, washed by centrifugation, and resuspended in 200 μl nuclei EZ storage buffer by gentle trituration with a micropipette. From the total resuspended pellet volume, 10% was reserved as input nuclei fraction and the rest was diluted with 1.6 ml nuclei purification buffer (NPB: 20 mM HEPES, 40 mM NaCl, 90 mM KCl, 2 mM EDTA, 0.5 mM EGTA, 1× Halt protease inhibitor cocktail, 1 mM DTT), and subjected to the INTACT protocol. Briefly, 30 μl of resuspended M-280 Streptavidin Dynabeads (#11205, Thermo Fisher Scientific) were added into a fresh 2 ml microcentrifuge tube and washed with 1 ml of NPB using a DynaMag-2 magnet (#12321; Thermo Fisher Scientific) for a total of three washes (1 min incubation/each). The washed beads were reconstituted to their initial volume (30 μl) with NPB and gently mixed with the nuclear suspension. The mixture of nuclei and magnetic beads was incubated at 4 °C for 40 min under gentle rotation settings to allow the affinity binding of streptavidin beads to the cell-specific, biotinylated nuclei. After incubation, the streptavidin-bound nuclei were magnetically separated with the DynaMag-2 magnet for a period of 3 min. The nuclei bound to the beads were washed in the magnet for three washes (1 min/each), resuspended in 30 μl of NPB, and reserved as the positive nuclei fraction. From the nuclear fraction [input and positive (enriched in biotinylated nuclei)], an aliquot was mixed with equal volume of DAPI counterstain and used for confocal microscopy visualization. The AllPrep DNA/RNA kit Micro (#80284, Qiagen, Germantown, MD) was used to extract gDNA and nuclear RNA from each sample. gDNA and nuclear RNA were quantified with a Nanodrop One spectrophotometer (Thermo Fisher Scientific) and its quality assessed by genomic DNA D1000 (#5067-5582) and HSRNA ScreenTape, respectively, with a 4150 TapeStation analyzer.
2.10. Library construction and whole genome oxidative bisulfite sequencing (WGoxBS-seq)
For each input and positive INTACT-isolated sample 400 ng of gDNA was brought up to 50 μl volume with 1× low-EDTA TE buffer and sheared with a Covaris E220 sonicator (Covaris, Inc., Woburn, MA) to an average 200 base pair size using the following settings: intensity of 5, duty cycle of 10%, 200 cycles per burst, 2 cycles of 60 s, at 7 °C. The size of sheared products was confirmed by capillary electrophoresis (DNA D1000, Agilent). gDNA fragments were cleaned by an Agencourt bead-based purification protocol, after which gDNA was quantified (Qubit dsDNA, Thermo Fisher Scientific). Two aliquots of 62.2 ng DNA fragments were prepared in a 12 μl volume to which 1 μl of spike-in control DNA (0.08 ng/ul) with known levels of specific mC, hmC, and fC at individual sites was added. End repair, ligation of methylated adaptors (#L2V11DR-1*96 BCE adaptor plate, NuGEN, Tecan Genomics, Inc., Redwood City, CA) and final repair were performed according to manufacturer’s instructions (Ovation Ultralow Methyl-Seq Library System, NuGEN) (Chucair-Elliott et al., 2020; Chucair-Elliott et al., 2019). Of the two DNA aliquots per sample, one was oxidized and then bisulfite- converted and the other only bisulfite-converted with the True Methyl oxBS module (NuGEN) with desulfonation and purification. 22 μl of libraries were eluted from the magnetic beads. qPCR was used to determine the number (N) of PCR cycles required for library amplification. Bisulfite-converted samples were amplified for 11 cycles while oxidative bisulfite- converted samples were amplified for 14 cycles [95°C- 2 min, N (95°C-15 s, 60°C-1 min, 72°C-30s)]. Amplified libraries were purified with Agencourt beads and eluted in low-EDTA TE buffer. TapeStation HD1000 was used to validate and quantify libraries. Amplified libraries were normalized to a concentration of 4 nM and pooled for sequencing on the Novaseq 6000 (Illumina) according to manufacturer’s guidelines with the exception of a custom sequencing primer (MetSeq Primer) that was spiked in with the Illumina Read 1 primer to a final concentration of 0.5 μM.
2.11. WGoxBS-seq data analysis
Global levels of mCG, hmCG, and mCH were analyzed as previously described (Chucair-Elliott et al., 2020; Chucair-Elliott et al., 2019). Prior to alignment, paired-end reads were adaptor-trimmed and filtered using Trimmomatic 0.35. End-trimming removed leading and trailing bases with Q-score < 25, cropped 6 bases from the start of the read and 5 bases from the 3′ end, dropped reads <30 bases long, and dropped reads with an average Q-score < 25. Alignment of trimmed bisulfite converted sequences was carried out using Bismark 0.22.3 with Bowtie 2.3.1 against the mouse reference genome (GRCm38/mm10). Bams were deduplicated using Bismark. Methylation call percentages for each CpG and non-CpG (CH) site within the genome were calculated by dividing the methylated counts over the total counts for that site in the oxidative bisulfite converted libraries (OXBS). Genome-wide CpG and CH methylation levels were calculated separately. Hydroxymethylation levels in CpG (hmCG) and CH (hmCH) contexts were calculated by subtracting methylation call levels from the oxidative bisulfite-converted (OXBS) libraries from the bisulfite converted (BS) libraries. Deduplicated bam files generated by Bismark were run through MethylKit in R to generate context-specific (CpG/CH) coverage text files. Bisulfite conversion efficiency for C, mC, and hmC was estimated using CEGX spike-in control sequences. Untrimmed fastq files were run through CEGX QC v0.2, which output a fastqc_data.txt file containing the conversion mean for C, mC, and hmC. Analysis of methylation levels in the proximity of the promoter region was performed on a list of all expressed genes as follows. The R package Enriched Heatmap (Gu et al., 2018) was used to intersect site-specific methylation call files with genomic coordinates of gene lists. Flanking regions of 4000 nucleotides were constructed upstream of the transcription start site (TSS) and downstream of the transcription end site (TES) and then split into 20 bins of 200 nucleotides each. The gene body was split into 27 equal bins, depending on the gene length. The average of each bin for all genes in the list was then plotted versus the bin number to give a visualization of the overall pattern of mCG within and around the genes contained in the gene lists. Average mCG and hmCG levels were calculated for the upstream region (−4 kb to TSS), gene body (TSS to TES), and downstream region (TES to +4 kb) for each gene list and biological replicate. Promoter, gene body, and downstream region methylation were correlated with gene expression levels (Pearson’s r, p < 0.05). (GEO repository under accession code GSE197509).
2.12. Data statement
Sequencing data that support the findings of this study have been deposited in GEO repository with the GSE197510 accession code. Specifically, for WGoxBS-seq data the accession code is GSE197509. The entirety of the RNA-sequencing data is available for download in FASTQ format from NCBI Sequence Read Archive (GSE197500, GSE197503, GSE197481, GSE197507). Other data that support the findings of the study are available from the corresponding authors upon request.
2.13. Statistics and reproducibility
Datasets with groups of n ≥ 3 were analyzed using GraphPad Prism version 9.0.0 (San Diego, CA) and represented as dot plots with underlying bar graphs or bar graphs with mean ± S.E.M (standard error of the mean).
3. Results
Recently, we validated the tamoxifen (Tam)- inducible Aldh1l1-cre/ERT2; NuTRAP (Aldh1l1-NuTRAP) model for brain studies, including protocols for the isolation of cell-specific transcriptomes (TRAP) and cell-specific DNA (INTACT) to study levels of methylation (mC) and hydroxymethylation (hmC) in CG and CH contexts at the single-nucleotide level, both genome–wide and at select gene promoter regions in brain astrocytes (Chucair-Elliott et al., 2020). Extending the use of this model to the retina we find that instead of targeting retinal astrocytes, Aldh1l1-cre/ERT2 recombinase specifically targets MGC. This observation allowed us to apply this mouse model as a novel tool for the analysis of epigenetic and transcriptomic profiles in MGC during normal conditions, as well as in response to acute and chronic retinal stress (Fig. 1).
Fig. 1.
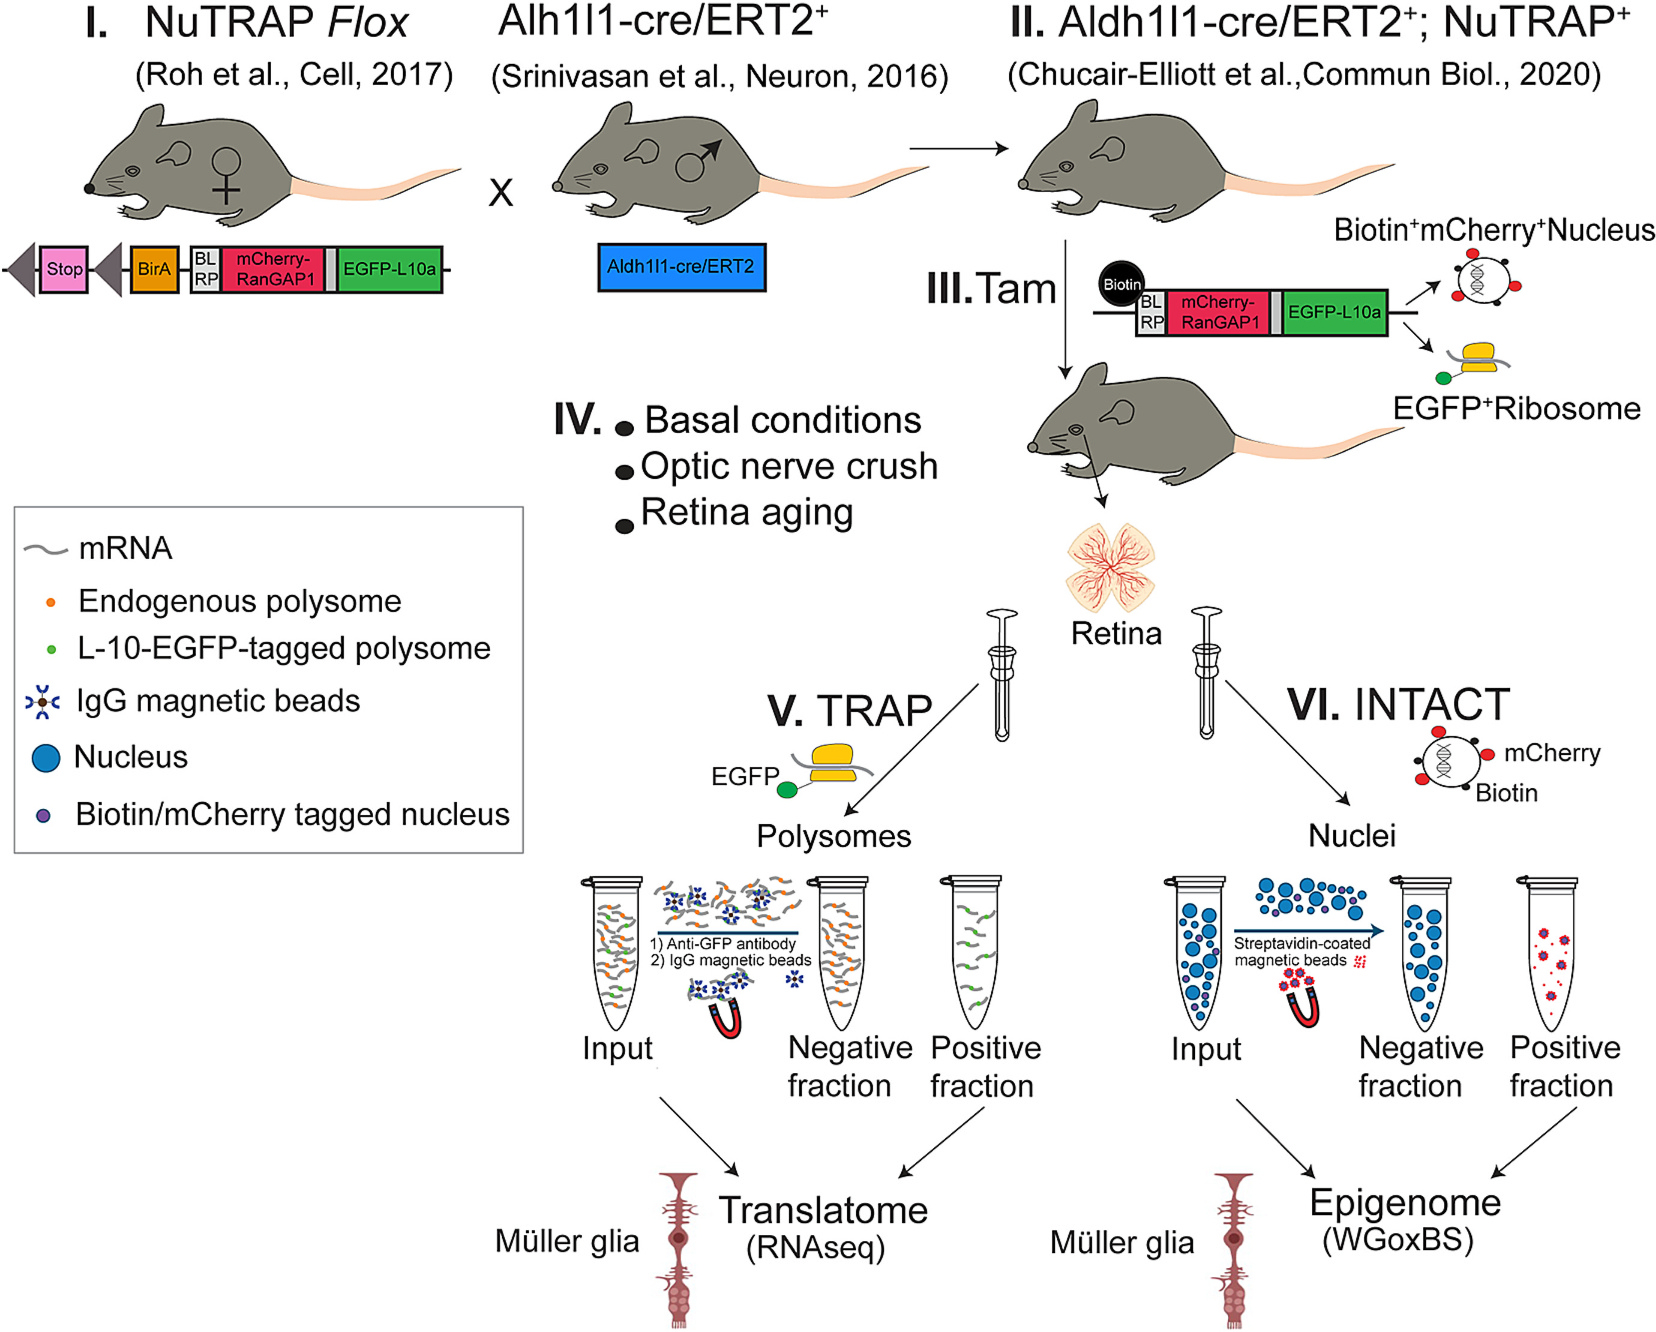
NuTRAP model system. Breeding of NuTRAPflox/flox females with Aldh1l1cre/ERT2 males (I) produces viable and phenotypically normal offspring (II) that when induced with tamoxifen (Tam) (III) express EGFP on the ribosomal protein L10a and Biotin and mCherry on the nuclear envelope protein RanGap1 of Müller glia. Translating Ribosome Affinity Purification (TRAP) isolates ribosome bound RNA in cell-type specific fashion while INTACT (Isolation of Nuclei Tagged in specific Cell Types) isolates nuclei, and thus gDNA, from only Aldh1l1+ cells. This enables translatome and/or epigenome analyses of Müller glia in a wide variety of experimental conditions using one mouse model and without the need for cell sorting.
3.1. Immunohistochemical validation of the Aldh1l1-cre/ERT2+; NuTRAP+ mouse retina
Aldh1l1-NuTRAP mice were systemically injected with Tam for 5 consecutive days to induce cre recombination. One month after induction eyecups were dissected for immunohistochemistry (IHC) analyses, as a first step of validation. To address cell-specificity of cre recombination in the neuroretina, sagittal frozen sections of Aldh1l1-cre/ERT2+; NuTRAP+, as well as Aldh1l1-cre/ERT2−; NuTRAP+ retinae were immunostained with antibodies against mCherry, glutamine synthetase (GS), and glial fibrillary acidic protein (GFAP) and analyzed by fluorescent confocal imaging. Following Tam-induction, and unlike their cre negative counterparts (Fig. 2a), Aldh1l1-cre/ERT2+; NuTRAP+ retinae expressed both products of recombination, EGFP and mCherry, specifically in GS+ MGC (Fig. 2c). The processes of MGC, extending from outer- to inner- limiting membranes, did not co-localize with the constitutive astrocytic marker, GFAP, in the ganglion cell layer (GCL) (Fig. 2b–d). Of interest, astrocytes outside of the neuroretina in the attached optic nerve were Aldh1l1 positive, as evidenced by co-localization with EGFP, mCherry, and GFAP (Fig. 2e–e’). In retinal flatmount preparations, EGFP and mCherry were co-localized to cell bodies residing in the INL, consistent with the findings in sagittal sections. Strong signal for mCherry and weak signal for EGFP were associated with MGC endfeet processes and not with GFAP expression associated to astrocytes at the GCL (Fig. 2 f–g). Further, the mCherry+ endfeet processes did not appear to co-localize with Brn3a expression, a signature marker of RGC (Fig. 2h–i). The specific pattern of recombination in MGC was used as criteria to select the Aldh1l1-NuTRAP as an appropriate model to interrogate transcriptomic and genomic signatures of MGC.
Fig. 2.
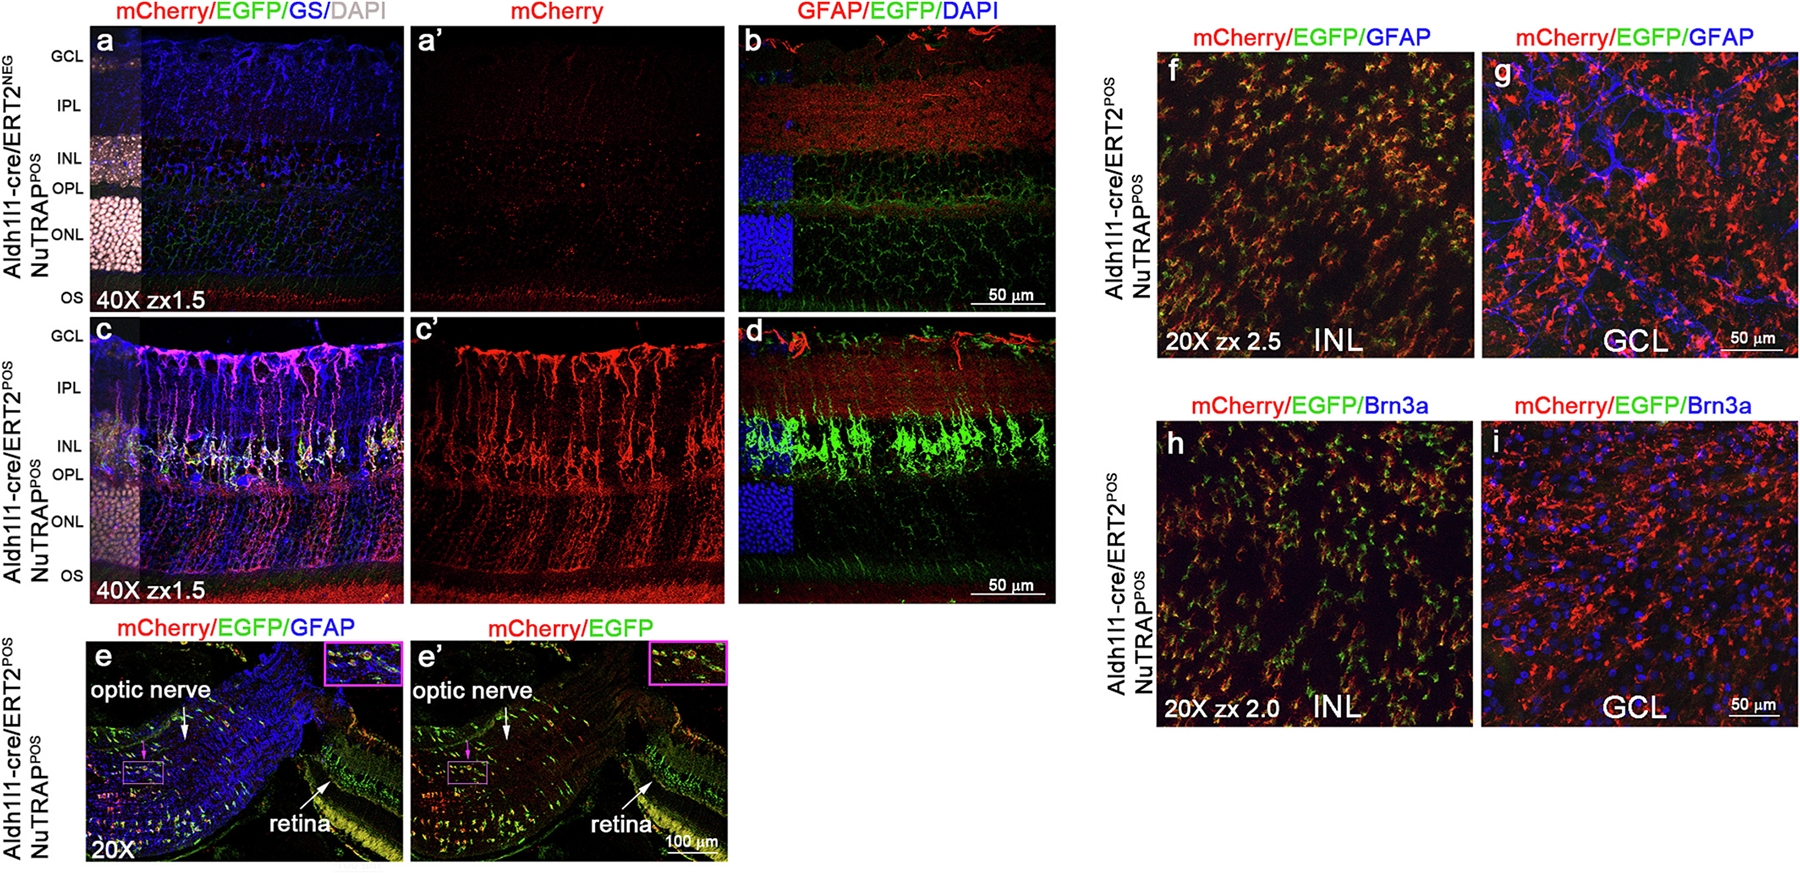
Immunohistochemical localization of retinal transgene expression in the Aldh1l1-cre/ERT2+; NuTRAP+ mouse. Representative confocal fluorescent microscopy images of sagittal retina sections show EGFP expression (green signal) was found in cells that co-expressed mCherry (red signal) and the Müller glia marker GS (blue signal) in Aldh1l1-cre/ERT2+; NuTRAP+ (c-c’) but not in Aldh1l1-cre/ERT2−; NuTRAP+ retinas (a-a’). EGFP expression did not colocalize with constitutively expressed GFAP (red signal in b-d). e-e’) Optic nerve but not retinal astrocytes co-expressed GFAP, mCherry, and EGFP (n = 3–4/group). DAPI: nuclear counterstain. Scale bars: 50 μm in a-d 100 μm in e-e’. Insets in e-e’ show 2× zoom display of a selected group of cells (depicted with pink arrow). Representative confocal fluorescent microscopy images of retina flatmounts show the EGFP (green signal) and mCherry (red signal) dual labeling at the INL f-g) did not co-localize with GFAP expression at the GCL level in Aldh1l1-cre/ERT2+; NuTRAP+ retina and h-i) did not co-localize with Brn3a expression at the GCL level in the Aldh1l1-cre/ERT2+; NuTRAP+ retina.
3.2. RNAseq validation of Müller glia transcriptome enrichment in the Aldh1l1-NuTRAP mouse retina by TRAP-RNAseq
Enrichment of EGFP-tagged polysomes was performed with the TRAP protocol. The resulting positive and input fractions were collected for RNA isolation, followed by library construction, and sequencing. RNAseq analysis of all expressed genes, as visualized by Principal Component Analysis (PCA), revealed separation of positive fraction from input samples in the first component (Fig. 3a, Supplemental data 1). This translatomic separation was further reflected by hierarchical clustering of enriched/depleted genes (Fig. 3b, Supplemental data 1). To assess the cell identity of the translatomes isolated in the TRAP positive fractions, expressed genes were intersected with cell type marker gene lists published by three different studies for the different retinal cell types (Pauly et al., 2019; Heng et al., 2019; Hoang et al., 2020). We found that the TRAP-positive fraction was enriched in all MGC signature genes interrogated while depleted of signature genes of other retina cell types, such as rods, cones, bipolar cells, amacrine cells, horizontal cells, RGCs, microglia, and vascular endothelial cells, relative to the input (all retinal genes) (Fig. 3c, Supplemental data 2). Validation of the TRAP-isolated RNA from input and positive fractions by qPCR showed enrichment of genes enriched in MGC (Aldh1l1, Cav1, Slc1a3, and Tlr4), but not of genes specifically expressed by microglia (Cx3cr1, Tmem119), rod photoreceptors (Rho), and vascular endothelial cells (Pecam1) (Fig. 3d, Supplemental data 3). Pioneering work by the Cepko group (Roesch et al., 2008) reported MGC enrichment of genes with potentially relevant functions for MGC physiology, such as growth factors, cell cycle components, and Notch pathway components. Intersecting those reported genes (Roesch et al., 2008) with our list of TRAP-enriched genes (Fig. 3e, Supplemental data 3), provides further confirmation of the MGC specificity of the model and TRAP protocol. MGC translatome enriched genes are over-represented for upstream regulators that are related to MGC physiology and function, for example Stat3, a critical transcription factor for retinal neuroprotection (Coorey et al., 2015; Ueki et al., 2008). We found underrepresentation of genes regulated by upstream regulators expressed in other cell types such as Crx, a transcription factor that enhances the expression of photoreceptor-specific genes and is important for terminal differentiation of rods and cones (Furukawa et al., 1999; Mitton et al., 2000). Such underrepresentation was consistent with Crx depletion in the positive fraction compared to input (Fig. 3f, Supplemental data 3). We contextualized the transcript enrichment in the TRAP-positive fraction with previously published genes reported by Hoang et al. (Hoang et al., 2020) to be enriched in mouse MGC by single cell-RNAseq (Supplementary Fig. 1, Supplemental data 3, refer to Table S2 in such study). We found high concurrence between the two studies, as the majority of genes enriched in MGC in the Hoang study (Supplementary Fig. 1a) were greatly enriched in our TRAP-positive fractions (Supplementary Fig. 1b). Lastly, a single-cell transcriptomic atlas of the human retina reported three subsets of macroglia with differential transcriptomes (Menon et al., 2019). The first subtype (FOS-expressing) was enriched with markers known to be expressed in astrocytes. The second subtype (COL4A3-expressing) and third subtype (FTL-expressing) were described as consistent with MGC identity, and relevant in AMD pathology and retina homeostasis (Menon et al., 2019). The intersection of differentially expressed genes in the TRAP-positive fraction (vs input) from our study with lists of enriched genes for the three human macroglia subsets (Menon et al., 2019) (mapped to the mouse genome, expression criteria: FC ≥ 5) revealed greater representation of genes of the COL4A3 subset in our datasets (Supplementary Fig. 1c–f, Supplemental data 3).
Fig. 3.
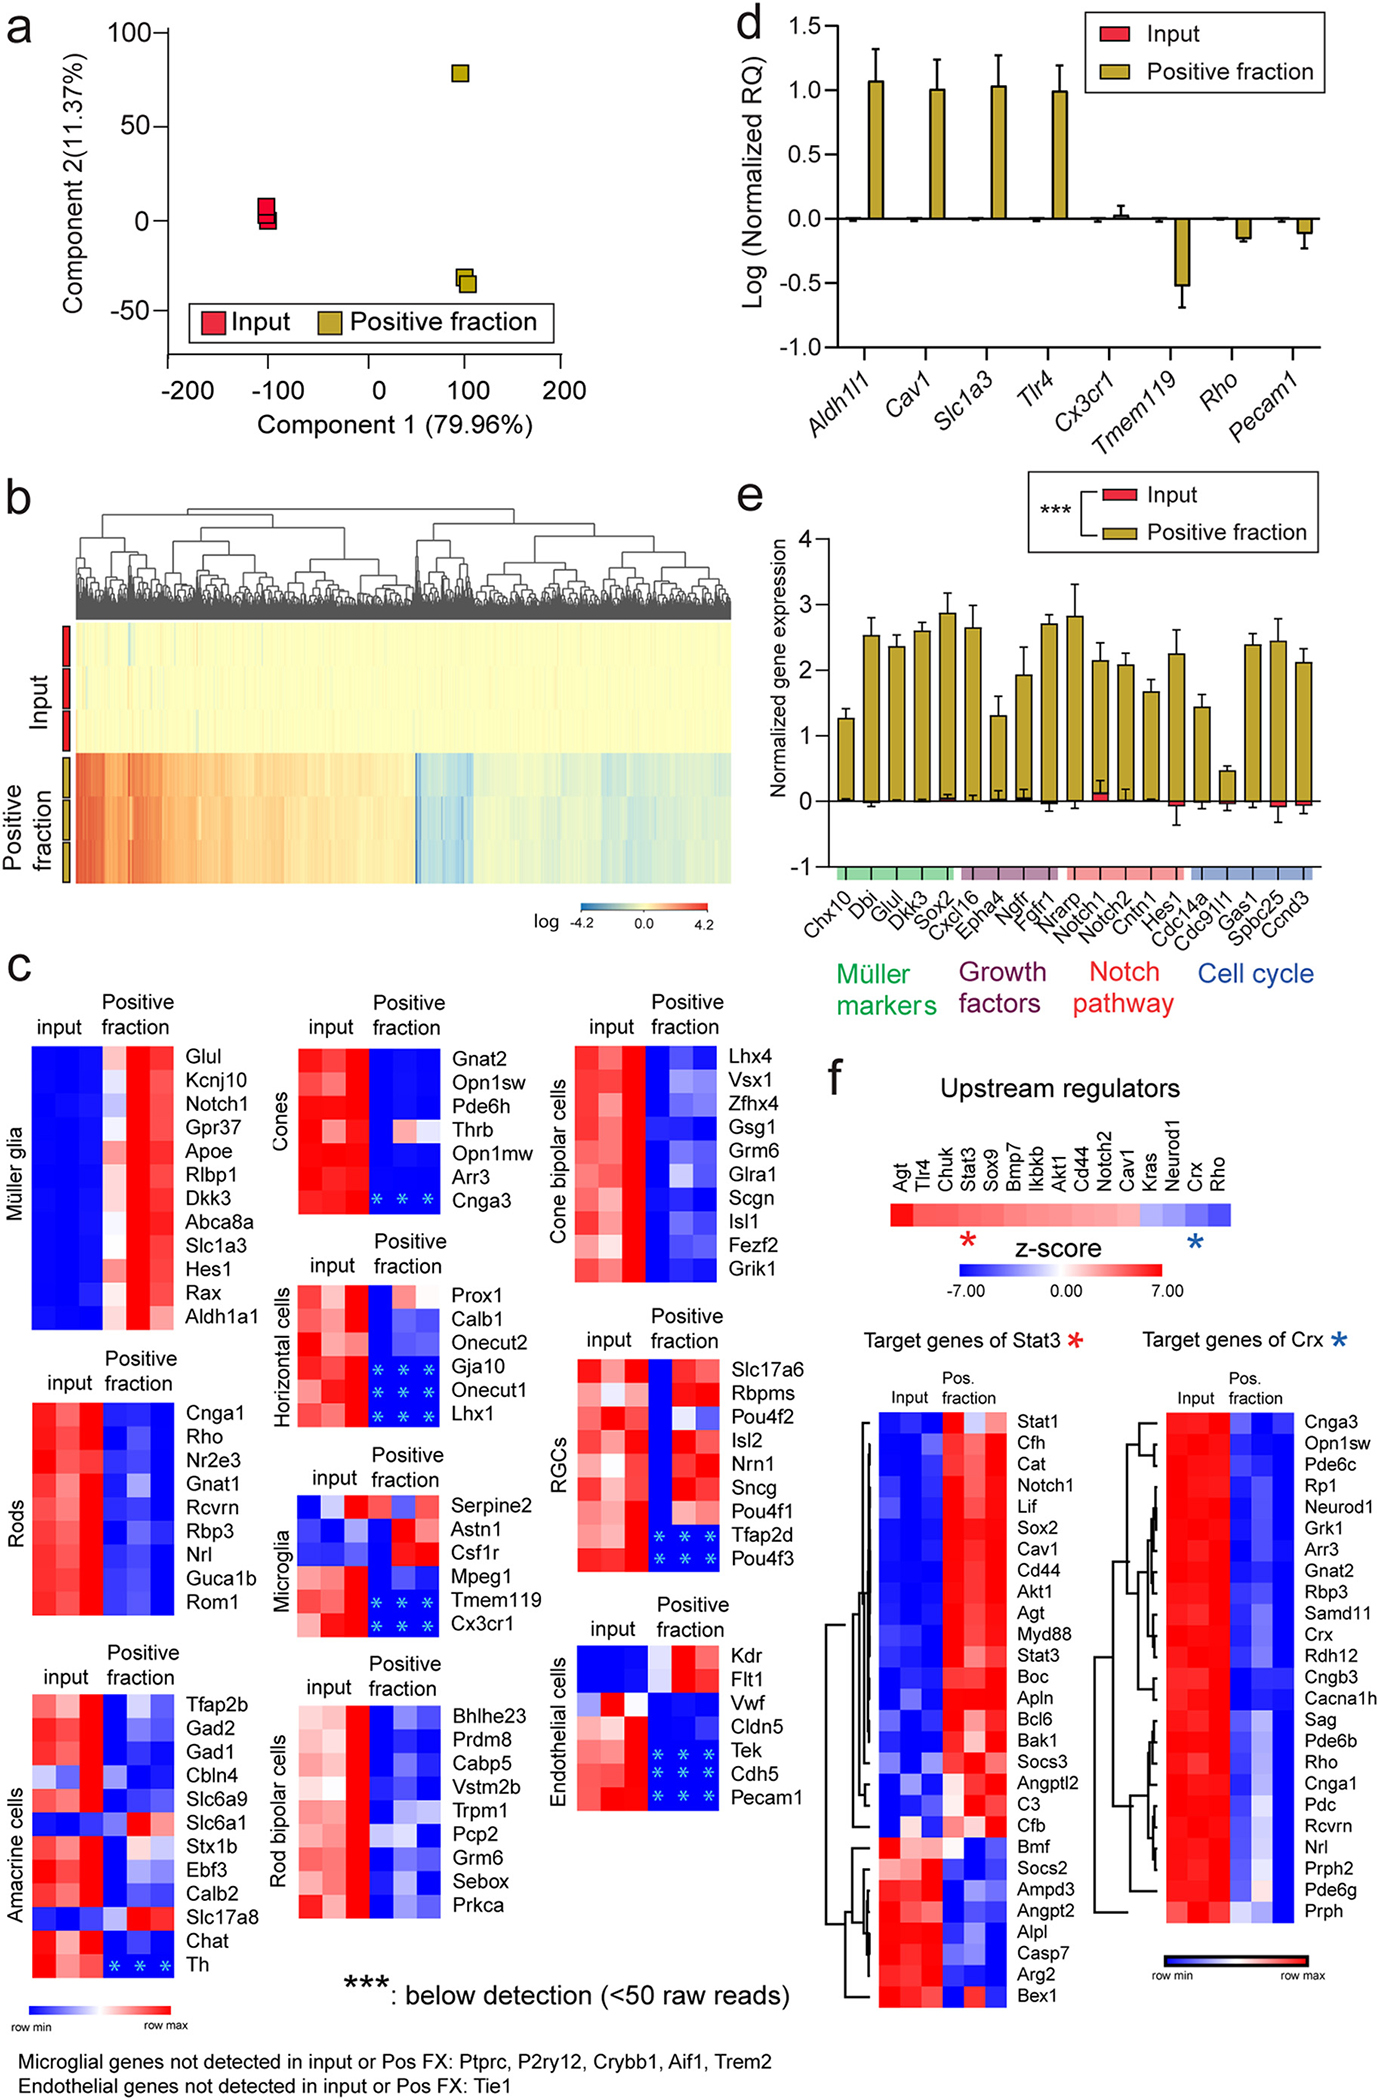
RNAseq validation of Müller glia translatome enrichment in the Aldh1l1-cre/ERT2+; NuTRAP+ mouse retina by TRAP-RNAseq. a) Principal component analysis of all expressed genes showed separation of positive fraction from input Aldh1l1cre+ NuTRAP+ samples. b) Hierarchical clustering of differentially expressed genes showed separation of transcriptome profiles of positive fraction and input samples (n = 3/group, Moderated t-test with Benjamini-Hochberg multiple testing correction). c) RNAseq heatmap graphs of cell type signature marker genes combined from three published sequencing studies (Hoang et al., Science, 2020; Heng et al., PNAS, 2019; Pauly et al., Cell Rep, 2019) show enrichment of Müller glia marker genes and depletion of other retina cell type genes, as compared to input. d) TRAP-isolated RNA from input and positive fractions was converted to cDNA for qPCR analysis of enrichment and depletion of selected genes enriched in Müller glia (Aldh1l1, Cav1, Slc1a3, Tlr4), microglia (Cx3cr1, Tmem119), photoreceptor neurons, (Rho), and endothelial cells (Pecam1) (n = 3/group, paired t-test comparison). e) Enrichment of relevant genes for Müller glia physiology (Roesch et al., The Journal of Comparative Neurology, 2008) was observed in the positive fraction relative to the input by RNAseq analysis (n = 3, paired t-test comparison, ***p < 0.001). f) Ingenuity Pathway Analysis (IPA). Left: Upstream regulator analysis of differentially expressed genes identified activated or inhibited upstream regulator genes in the TRAP-positive fraction relative to input. Heatmaps of genes targeted by two upstream regulators, Stat3 (predicted to be activated, left) and Crx (predicted to be inhibited, right), are shown.
Collectively, these data provide substantial support that the Aldh1l1-NuTRAP model is suitable for studying the MGC translatomic signatures of the retina. Contrasting the TRAP-isolated translatome with the MGC transcriptome characterized by other groups, in both mouse and human, offers external validation of our findings.
3.3. Levels of mCG methylation in the Aldh1l1-NuTRAP mouse retina by WGoxBS
The DNA modification landscape of the retina epigenome at a single-base resolution, and at the cell type-specific level, remains largely unknown. Nuclear preparations of Aldh1l1l-NuTRAP retinae were subjected to INTACT isolation with streptavidin magnetic beads for isolation of positive (biotinylated) nuclei, and nuclei visualized by confocal microscopy, as previously (Chucair-Elliott et al., 2020). Autofluorescence of the streptavidin beads in the red channel (Chucair-Elliott et al., 2020; Deal and Henikoff, 2011) was used for observation of biotinylated nuclei bound to beads in the positive fraction (Fig. 4a). Nuclear RNA extracted from INTACT-isolated nuclei was used for nucRNAseq library construction and sequencing to assess enrichment of MGC transcripts compared to input, as a measure of INTACT nuclear isolate purity. All interrogated signature transcripts of MGC were enriched in the positive fraction compared to input samples (Fig. 4b, Supplemental data 4) providing evidence of MGC nuclei enrichment.
Fig. 4.
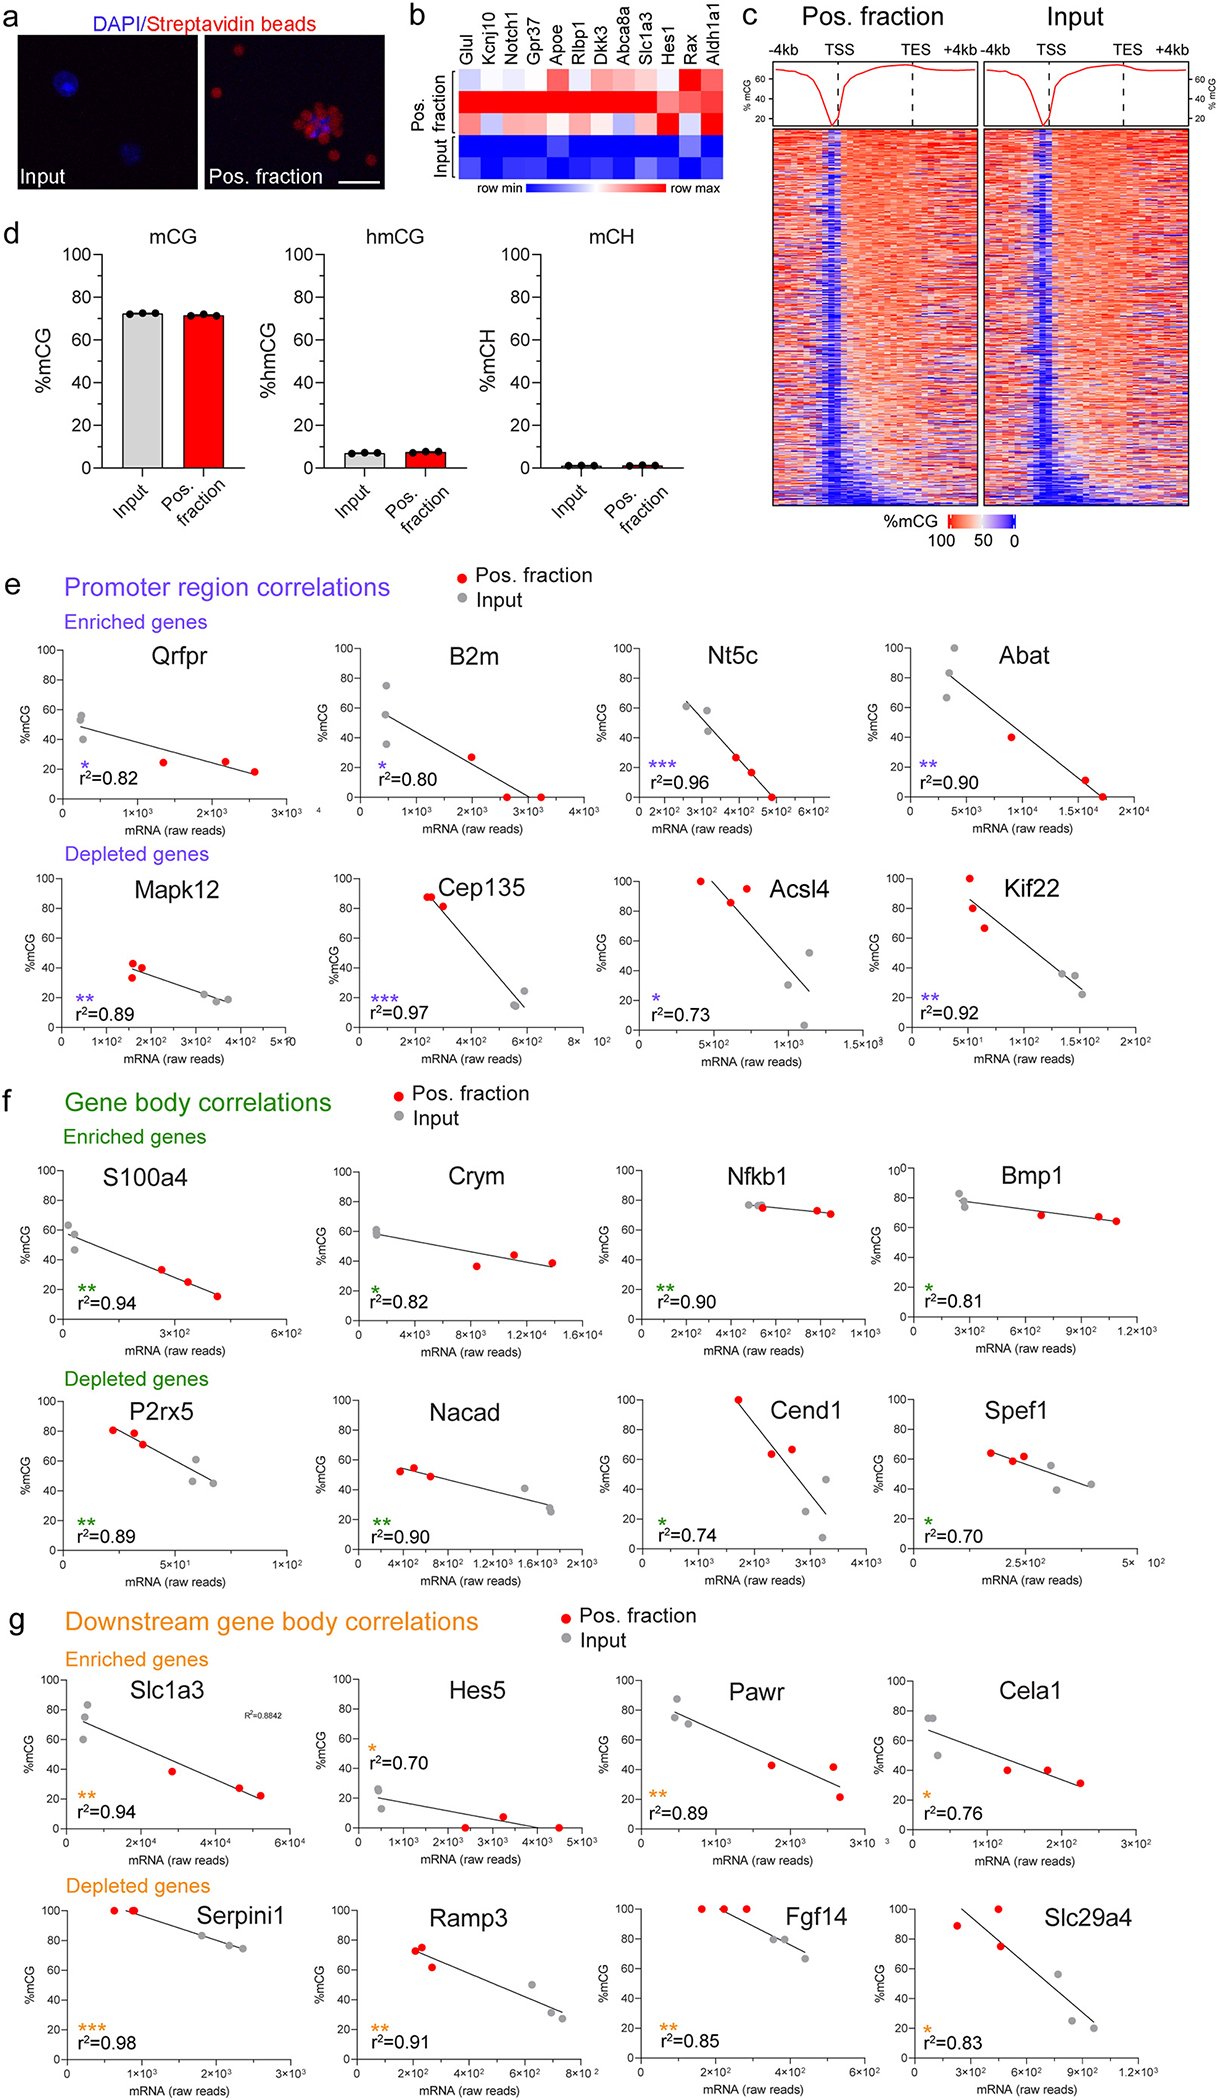
Levels of mCG and hmCG in the Aldh1l1-cre/ERT2+; NuTRAP+ mouse retina by oxWGBS. After Tam treatment, retinae were harvested from Aldh1l1-cre/ERT2+; NUTRAP+ mice and subjected to nuclei isolation and subsequent INTACT protocol for genomic DNA extraction for epigenome analyses. a) Representative confocal fluorescent microscopy images from input and positive INTACT nuclei fractions show a DAPI-stained nucleus (blue signal) collected in the positive fraction coated with streptavidin beads (red autofluorescence). b) Nuclear RNA was extracted from INTACT-isolated nuclei (input and positive fractions) and used for library construction and RNA sequencing. The heatmap shows expression of MGC signature markers in the nuclear transcriptome of the positive fraction compared to input (n = 2/input and 3/positive fraction groups). c) Averaged genome-wide DNA methylation profiles for all expressed genes detected in input and positive fractions across gene promoter (−4 kb to TSS), gene body (TSS to TES), and downstream gene body (TES to +4 kb) regions, visualized via composite density plots (top) and heatmaps (bottom). d) Total genomic levels of mCG, hmCG, and mCH, as measured by WGoxBS from INTACT-isolated DNA (n = 3/group, by paired t-test comparison). Pearson correlation plots of gene expression (raw counts) and methylation (% mCG) and fitted-simple linear regressions for select genes in (e) promoter, (f) gene body, and (g) downstream regions. n = 3/group, *, **, *** p values <0.05, 0.01, and 0.001, respectively.
Comparatively little is known about DNA modifications in specific retinal cell populations. Thus, WGoxBS sequencing libraries (Supplementary Fig. 2) were constructed from the DNA isolated from input and positive INTACT fractions. Genome-wide sequencing analysis of methylation was performed for all expressed genes (FC ≥ 1) in input and positive fractions across gene promoter (−4 kb to TSS), gene body (TSS to TES), and downstream gene body (TES to +4 kb) regions. As visualized via composite density plots and heatmaps, there was no difference in the average CG methylation patterns of input and positive fractions (Fig. 4c), suggesting a genome-wide commonality in DNA methylation patterns of expressed genes. Total genomic levels of mCG were observed at 72% as well as substantial levels of hmCG, at ~7%. mCG and hmCG levels in MGC did not significantly differ from total retinal levels (Input), which represent a cell abundance weighted average across all cell types (Fig. 4d, Supplemental data 4). Gene promoter mCG is generally anticorrelated with transcription. Intragenic regions, either in exons or introns are also an area of growing interest and play a role in gene expression regulation (Masser et al., 2018). To gain insight into the relationship between DNA methylation and gene expression, we generated lists of differentially enriched and depleted transcripts in the TRAP-positive fraction vs input that were anticorrelated with promoter, gene body, and downstream region methylation (Supplemental data 4). As represented in Fig. 4 e–g, focusing the analysis on specific transcripts (rather than analysis at genome-wide level) uncovered significant associations between gene expression and methylation for genes enriched in MGC, as well as for genes that were depleted in the TRAP-positive fractions (expressed more abundantly by other cell types). Promoter hypomethylation of Qrfpr, B2m, Nt5c, and Abat significantly correlated with their differential enriched levels in the TRAP-positive fraction vs input (Fig. 4e). Of interest, IPA analysis (not shown) displayed B2m as over-represented in the Ox40 signaling pathway, Nt5c in purine nucleotide degradation and NAD salvage, and Abat in degradation pathways of 4-aminobutyrate, valine, and β-alanine. These signaling pathways are consistent with metabolic function. On the other hand, hypermethylation of the promoter of Mapk12, Cep135, Acsl4, and Kif22 significantly correlated with their differentially depleted levels in the TRAP-positive fraction vs input (Fig. 4e). At the gene body region, hypomethylation of S100a4, Crym, Nfkb1, and Bmp1 significantly correlated with their enriched levels in the TRAP-positive fraction vs input (Fig. 4f). Bmp1 and Nfkb1 were over-represented in the Bmp1, NfkB, and death receptor signaling pathways, as per IPA canonical pathway assessment and have been shown to be up-regulated in MGC in response to NMDA and light damage stimuli by scRNA-seq (Hoang et al., 2020). Hypermethylation of the gene body of P2rx5, Nacad, Cend1, and Spef1, significantly correlated with their differentially depleted levels in the TRAP-positive fraction vs input (Fig. 4f). Two genes abundantly expressed in MGC, Slc1a3 and Hes5, as well as Pawr, and Cela1 were hypomethylated in the downstream region, in significant correlation with their differential enrichment levels in the TRAP-positive fraction vs input (Fig. 4g). Other genes, such as Serpini1, Ramp3, Fgf14, and Slc29a4, showed hypermethylation in the downstream region, that significantly anti-correlated with gene expression levels in the TRAP-positive fraction vs input (Fig. 4g). Collectively, these data provide substantial support that the Aldh1l1-NuTRAP model is suitable for studying the MGC epigenome and identify candidate genes for future studies on epigenomic regulation of gene expression.
3.4. Müller glia transcriptomic response to retina aging in the Aldh1l1-NuTRAP model
Age is a major risk factor in the development of age-related retinal neurodegenerations, such as AMD and glaucoma (Luu and Palczewski, 2018). An outstanding question that remains unanswered is how aging impacts the molecular phenotype of MGC at the cell-specific level. To study this question, and upon confirmation of MGC-specific, Tam-dependent recombination in retinae of 4 month- and 24 month- old mice (Fig. 5a), we performed TRAP-RNA isolation. The resulting positive fractions were collected for RNA isolation, followed by library construction, and sequencing. RNAseq analysis of all expressed genes, as visualized by PCA, revealed young samples exhibited higher variability than those of old animals causing the separation of positive fraction from young and old samples in the first component not to be obvious (Fig. 5b, Supplemental data 5). The separation of sample transcriptomes was more clearly reflected by hierarchical clustering of differentially expressed genes with aging in the TRAP-positive fractions (Fig. 5c, Supplemental data 5), which showed 35 genes down-regulated with age and 50 genes up-regulated with age (Fig. 5d, Supplemental data 5).
Fig. 5.
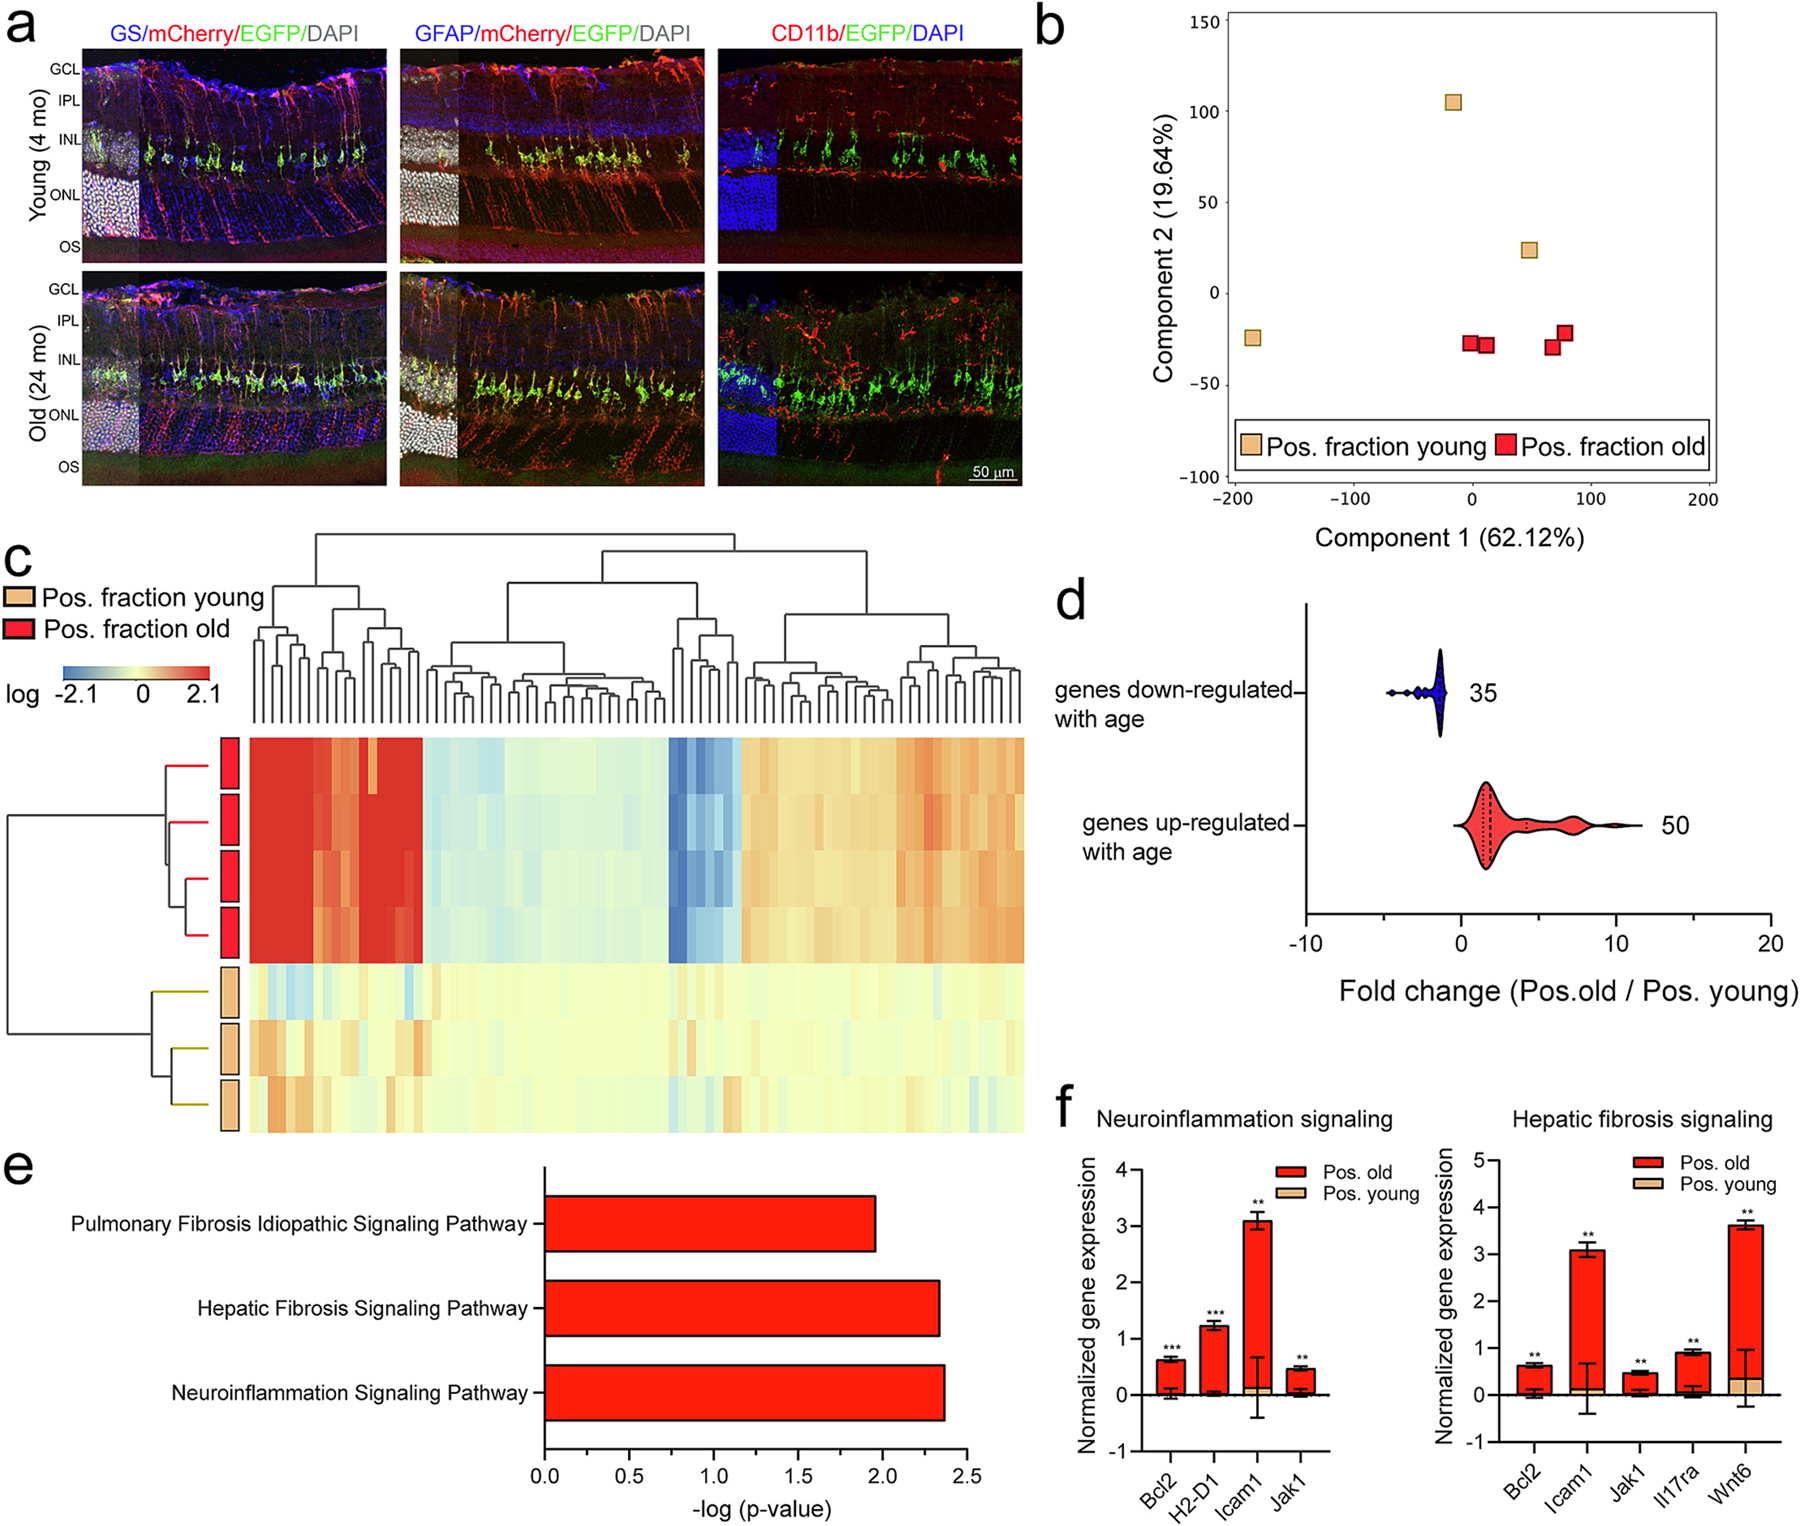
Translatomic profile of Müller glia in response to aging. a) Representative confocal fluorescent microscopy images of sagittal retina sections show EGFP (green signal) and/or mCherry (red signal) expressions in Müller glia of young and old mice, in relationship with: GS (blue signal, left), GFAP (blue signal, middle), and CD11b (red signal, right). DAPI: nuclear counterstain. Scale bar: 50 μm. b) Principal component analysis of all expressed genes showed separation of TRAP positive fraction of retinae from young and old retinae. c) Hierarchical clustering of differentially expressed genes showed separation of transcriptome profiles of positive fractions with age (n = 3–4/group, Moderated t-test with Benjamini-Hochberg multiple testing correction). d) Violin plots show normalized fold change expression for differentially down- and up- regulated genes with age in the TRAP-positive fractions. e) Differentially expressed genes in the old vs young group were subjected to canonical pathway analysis (IPA). The normalized expression for the genes in neuroinflammation and fibrosis signaling pathways is shown in (f) (n = 3–4/group, ***p < 0.001, **p < 0.01, by unpaired t-test comparison).
MGC have been shown to adopt a pro-inflammatory phenotype releasing several inflammatory factors and cytokines, complement components, as well as proteins associated with antigen processing and presentation (Eastlake et al., 2016; Schmalen et al., 2021). Canonical pathway analysis of the up-regulated genes with aging by IPA revealed over-representation of neuroinflammation and fibrosis signaling pathways (Fig. 5e, Supplemental data 5). The genes comprised under the neuroinflammation signaling pathway and up-regulated with age included Bcl2, H2-D1, Icam1, and Jak1. Genes comprised under fibrosis pathways, such as Bcl2, Icam1, Il17ra, Jak1, and Wnt6, were up-regulated in the TRAP-old positive fraction as compared to young (Fig. 5f).
The principal rationale for the NuTRAP model is to reveal cell-type specific changes that are ‘lost’ in tissue level analyses, especially for minority cell populations like MGC. To assess whether TRAP translatomic analysis revealed novel or more marked changes than whole retina analysis we compared age-regulated gene expression changes in positive and input fractions. Intersecting the lists of genes with differentially elevated or decreased expression when comparing positive fraction old vs positive fraction young and input old vs input young (Fig. 6a) showed uniquely regulated genes in the positive fraction. These likely represent MGC-specific changes ‘drowned out’ in whole retina analysis while the unique changes in the input fraction are likely occurring in other, non-MGC cell populations. Examining the differentially expressed genes with aging (Supplemental data 5), we found the magnitude of the fold change with age was greater in the positive fraction than in the input (Fig. 6a–b, Supplemental data 5), indicative of enrichment for this response. Genes of interest up-regulated and down-regulated with age are shown in Fig. 6c–d. From the differentially expressed genes with aging uniquely found in the positive fraction (29 up-regulated and 45 down-regulated) (Fig. 6e). The normalized expression values for select transcripts differentially up- (Hgf, Icam1, Ubc) and down- (Degs2, Adcy7, Cacna2d1, Dnahc1) regulated in the positive fraction but not in the input with aging are shown for both young and old positive fractions and inputs (Fig. 6f, Supplemental data 5). These data reflected increased sensitivity of detection of translatome changes in response to aging and greater effect sizes when focusing specifically in a single cell type (MGCs) rather than the combination of all retinal cells (input).
Fig. 6.
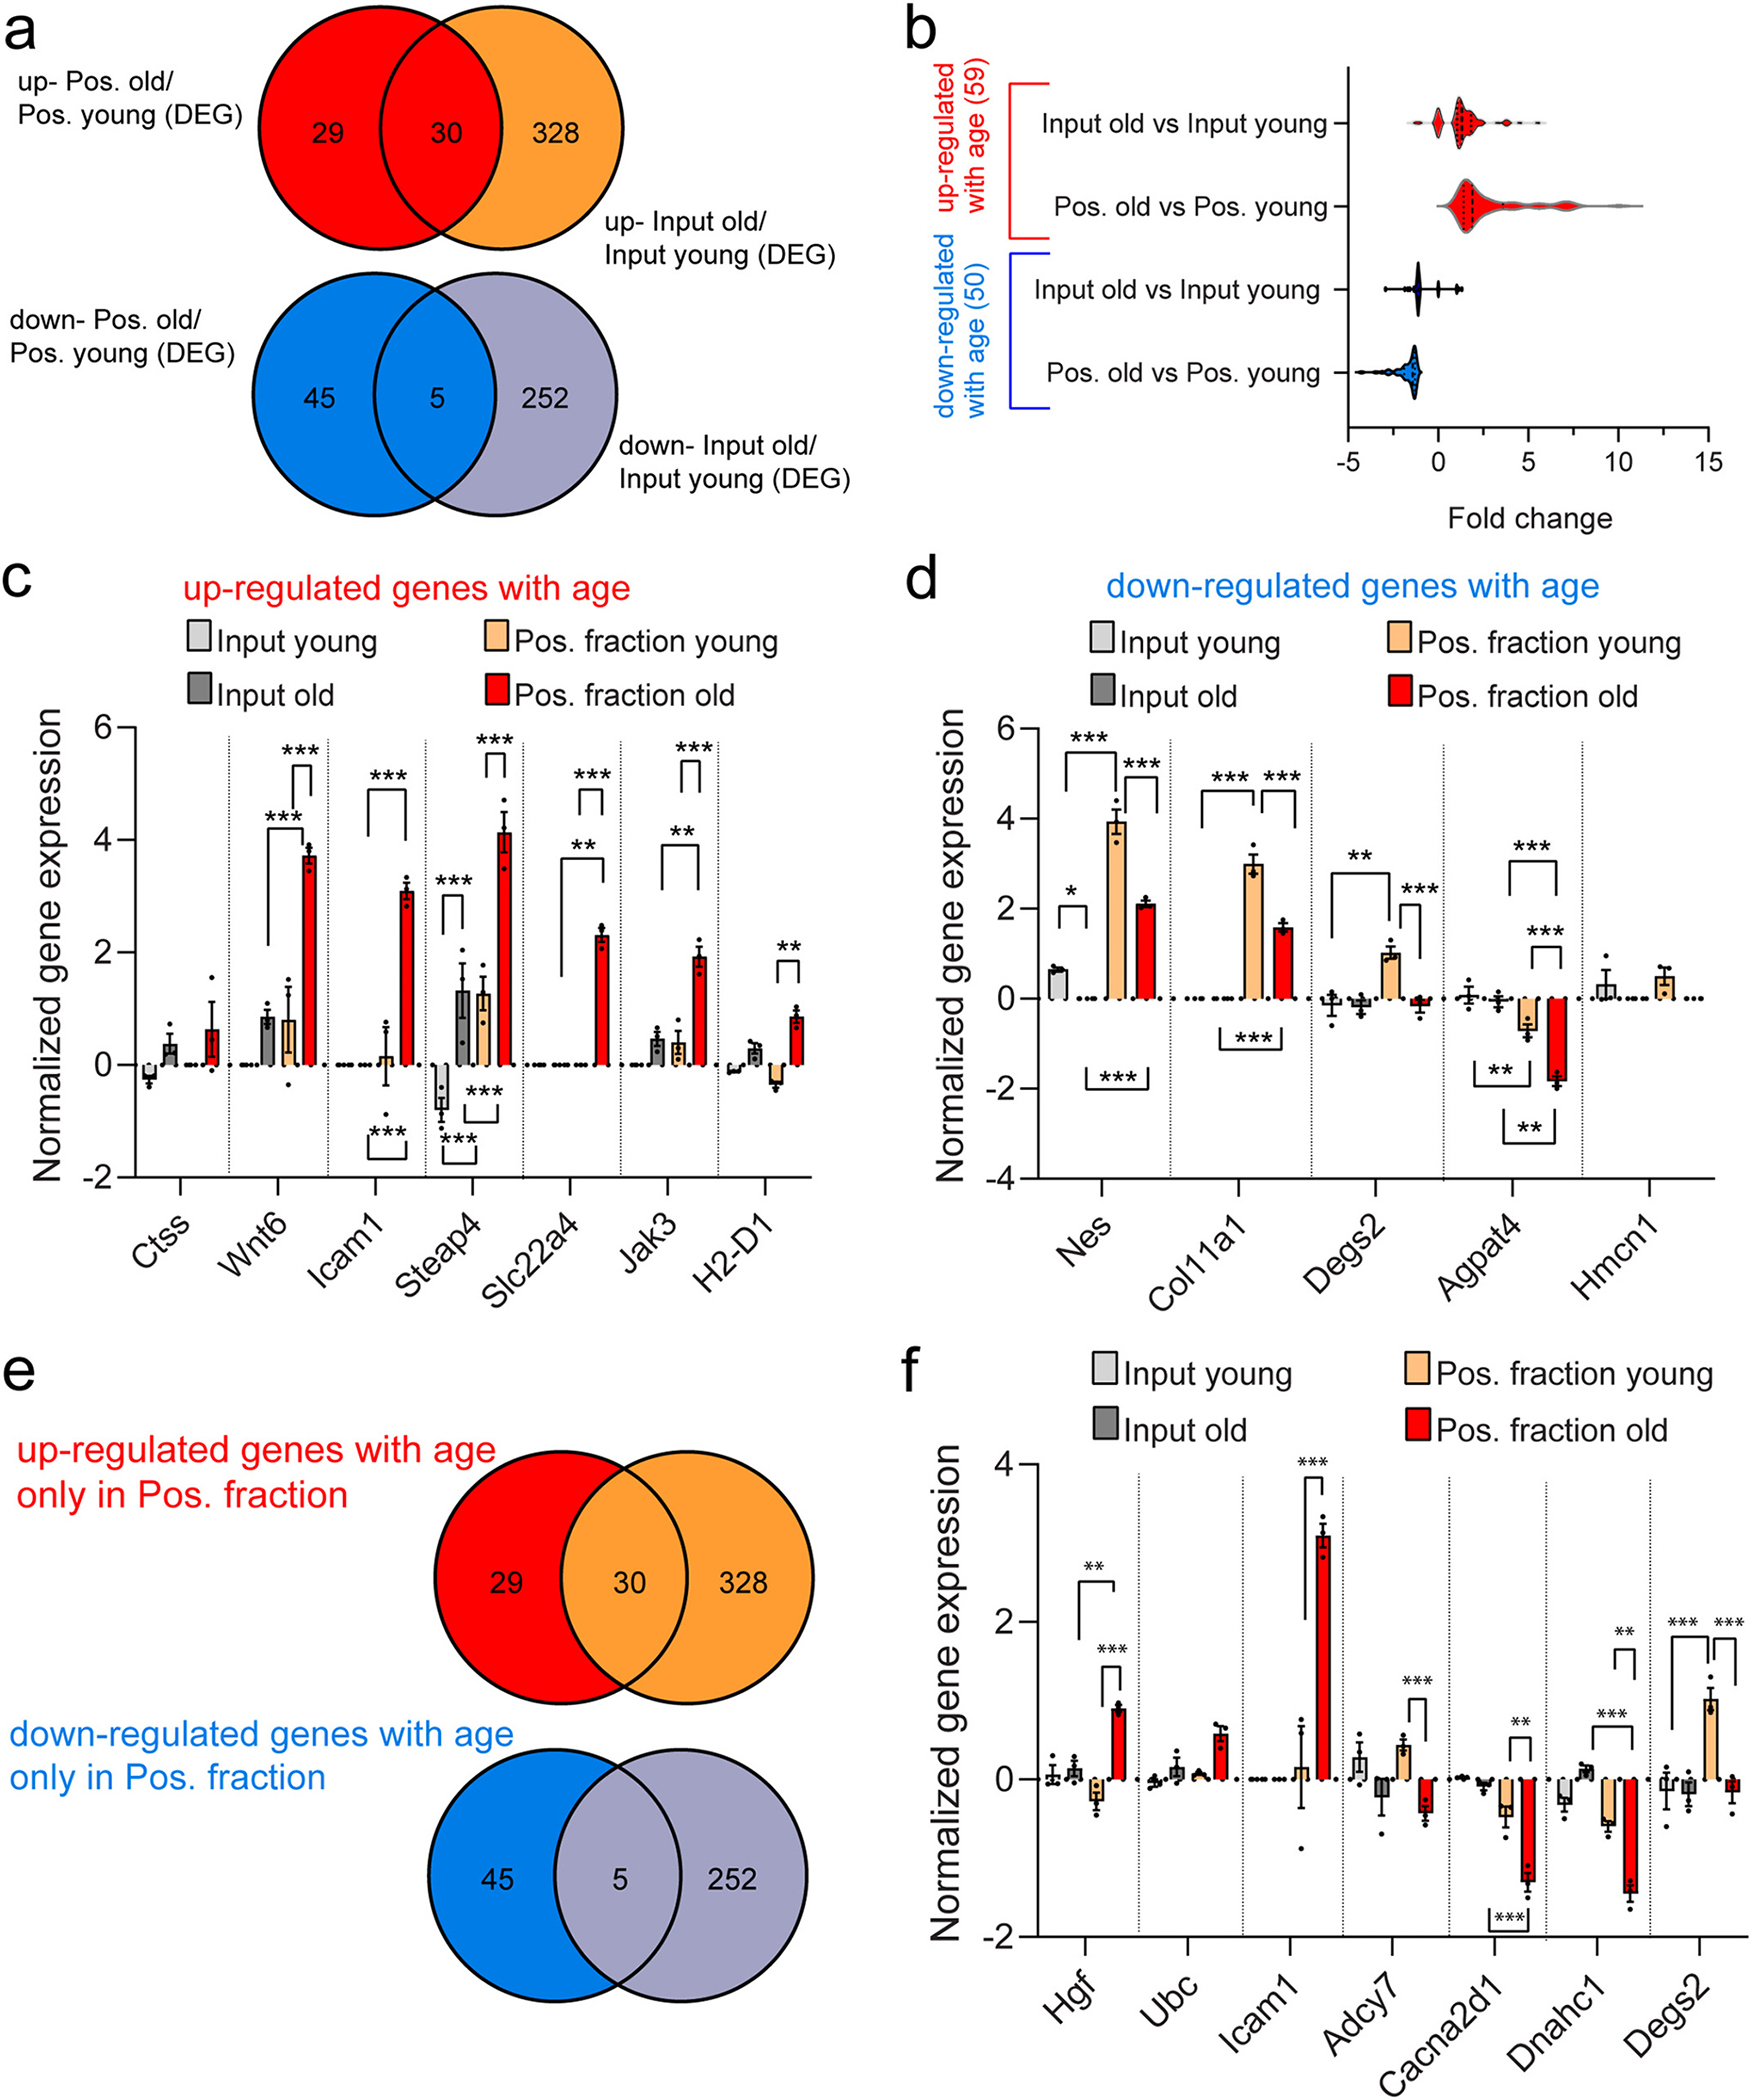
Comparison of retinal transcriptome and Müller glia translatome in response to aging. a) Venn diagrams illustrate the intersection of lists of differential gene expression elevated (top) and decreased (bottom) when comparing positive fraction old vs positive fraction young and input old vs input young. b) Genes up-regulated (59 genes) and down-regulated (50 genes) with age in the positive fraction, respectively, are further represented with violin plots. The normalized expression for example genes differentially c) up-regulated and d) down-regulated with age are shown for young and old input and positive fractions (n = 3–4/group, ***p < 0.001, **p < 0.01, *p < 0.05 by two-way ANOVA with Tukey’s multiple comparison test). e) Venn diagrams from (a) depict genes uniquely detected as differentially up-regulated (29 genes) and down-regulated (45 genes) with age in the positive fraction. f) The normalized expression of selected transcripts differentially up- or down-regulated in (e) are shown for young and old input and positive fractions (n = 3–4/group, ***p < 0.001 and **p < 0.01 by two-way ANOVA with Tukey’s multiple comparison test).
3.5. The Müller glia transcriptomic response to acute retina stress in the Aldh1l1-NuTRAP model
To test the ability of the Aldh1l1-NuTRAP model to uncover MGC specific responses potentially not observable in whole retina preparations, we used the optic nerve crush (ONC) model that provides an acute, traumatic insult to the axons of the RGCs outside of the eye, leaving the retina in the eye globe intact (Li et al., 1999). Although the ONC and glaucomatous injuries are not the same, the ONC insult results in a number of transcriptional similarities to glaucoma (Wang et al., 2021). ONC causes profound retinal ganglion cell (RGC) death by 30 days after the insult (Templeton and Geisert, 2012) that is preceded by early morphological and molecular changes in retinal glial cells in response to the injury (Mac Nair et al., 2016; Tang et al., 2020). For instance, microglia become “ameboid” and display proliferative potential, retracted processes and enlarged somas, while upregulating factors such as allograft inflammatory factor1 (Aif1/Iba1) and CD68 (Inman and Horner, 2007; Qu and Jakobs, 2013; Tonari et al., 2012). MGC and astrocytes, while non-proliferative, upregulate GFAP and nestin (Nes), and become hypertrophic (Mac Nair et al., 2016; Xue et al., 2006). After determining the robustness of ONC to induce RGC death by 10 days post-procedure in Aldh1l1-cre/ERT2−; NuTRAP+ retinae (Supplementary Fig. 3), we chose this model to study the early translatomic response of MGC to acute retinal injury, at 3 days post-procedure in Aldh1l1-NuTRAP mice. Immunohistochemical analysis of the Aldh1l1-NuTRAP retina post-ONC procedure revealed, as expected, co-localization of EGFP and mCherry with GS in MGC in the INL of the retina in both CTL and ONC- retinae (Fig. 7a–b). Consistent with the development of a gliotic response after injury, GFAP expression was increased in processes of EGFP+ MGC, which spanned the inner plexiform layer (IPL), compared to controls, where GFAP detection was minimal in MGC processes (Fig. 7c–d–c’–d’) and concentrated in astrocytes, which constitutively express GFAP. In agreement with the description of retinal microglial activation following ONC (Tang et al., 2020), staining of microglial cells with CD11b antibody showed increased presence of hypertrophic CD11b+ cells in the IPL and ganglion cell layer (GCL), which did not co-localize with EGFP (Fig. 7e–f). An observation from IHC analysis was the apparent increase of EGFP and mCherry signal in MGC after the ONC procedure. To investigate whether ONC retinal injury alone could cause Tam-independent recombination in MGC, Aldh1l1-NuTRAP mice that had not been treated with Tam were subjected ONC for immunostaining analysis of EGFP, mCherry, and GS, and comparison to fellow control retinae, as well as retinae of mice treated with Tam and subjected to both conditions. Confocal imaging analysis showed that in the absence of Tam treatment, ONC was not able to induce recombination in any retinal cell type. The same observation was made in fellow control retinae from the same mice (Supplementary Fig. 4). These results demonstrate that in the Aldh1l1-NuTRAP model the MGC recombination is exclusively dependent on Tam.
Fig. 7.
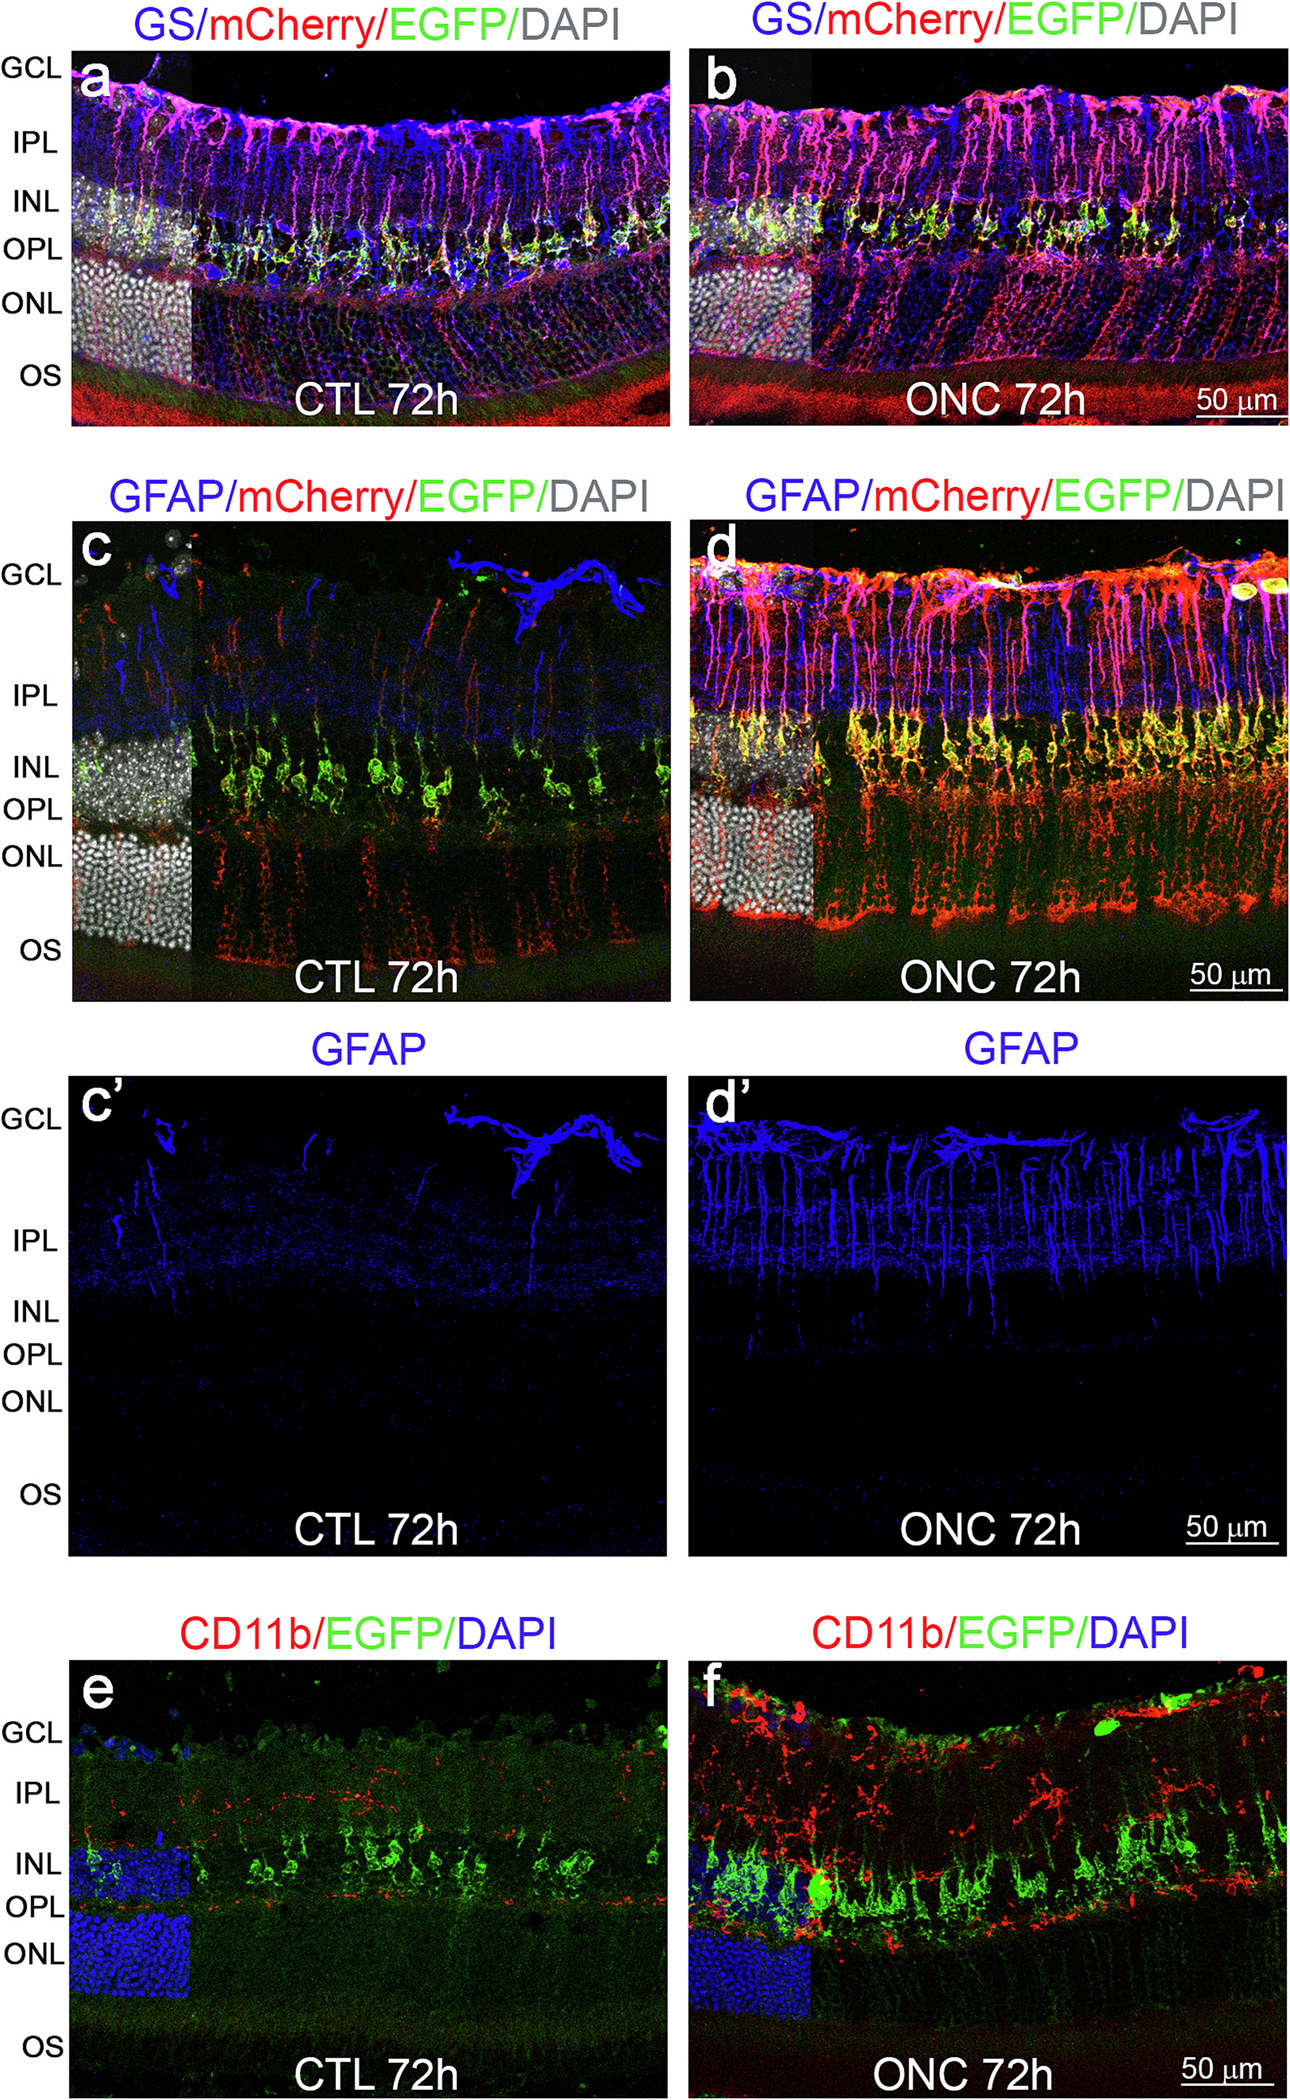
Immunohistochemical analysis of the Aldh1l1-cre/ERT2+; NuTRAP+ retina post ONC procedure. Representative confocal fluorescent microscopy images of sagittal retina sections show EGFP (green signal) and mCherry (red signal) expressions in Müller glia in CTL and ONC conditions, in relationship with: GS (a-b: blue signal) and GFAP (c-c’-d-d’: blue signal). e-f) EGFP (green signal) expression in Müller glia and CD11b (red signal) in microglia cells. DAPI: nuclear counterstain. Scale bar: 50 μm.
Enrichment of EGFP-tagged polysomes from ONC and control retinae was performed with the TRAP protocol. The resulting positive fractions were collected for RNA isolation, followed by library construction, and sequencing. RNAseq analysis of all expressed genes, as visualized by PCA, revealed separation of positive fractions from ONC and CTL samples (Fig. 8a, Supplemental data 6). This separation of sample transcriptomes was further reflected by hierarchical clustering of differentially expressed genes (285 genes up-regulated and 473 genes down-regulated) (Fig. 8b, Supplemental data 6). To contextualize the changes in gene expression with probable MGC functions, over-representation analysis of differentially expressed genes was conducted using the WebGestalt. The analysis revealed 10 top biological processes significantly enriched in ONC-positive fractions compared to CTL counterparts, which included regulation of DNA-templated transcription in response to stress, response to starvation, response to wounding, positive regulation of cytokine production, neuron death, and response to molecule of bacterial origin (Fig. 8c–d, Supplemental data 6), consistent with acute stress response in the ONC model. Upstream regulator analysis (IPA) of differentially expressed genes in the TRAP-positive fraction of the ONC group relative to the TRAP-positive fraction of the CTL group predicted the activation of: Atf3, Atf4, Tp53, Klf6, Ddit3, Stat3, and Egr1 (transcription factors), Cntf and Edn1 (cytokines), and Kitlg (growth factor), as upstream regulators of several sets of target genes involved in inflammation/stress responses. The analysis also predicted inhibition of Nfil3 (transcription factor), as well as Lonp1, Fasn, and Tfrc (enzymes) (Fig. 8e, Supplemental data 6). The upstream regulator predicted with highest z-score, Cntf, targeted the STAT3 signaling-related genes Cntf, Osmr, Stat3, as well the STAT3 antagonist, Socs3, which showed up-regulated expression in the positive fraction after ONC (Fig. 8e, Supplemental data 6). The prediction of activation of the STAT3 signaling axis in MGC under the ONC model is consistent with scRNA-seq findings in which Cntf, Lif, Osmr, Stat3, and Socs3 were found to be expressed in activated MGC following acute stress by light damage and NMDA insult (Hoang et al., 2020).
Fig. 8.
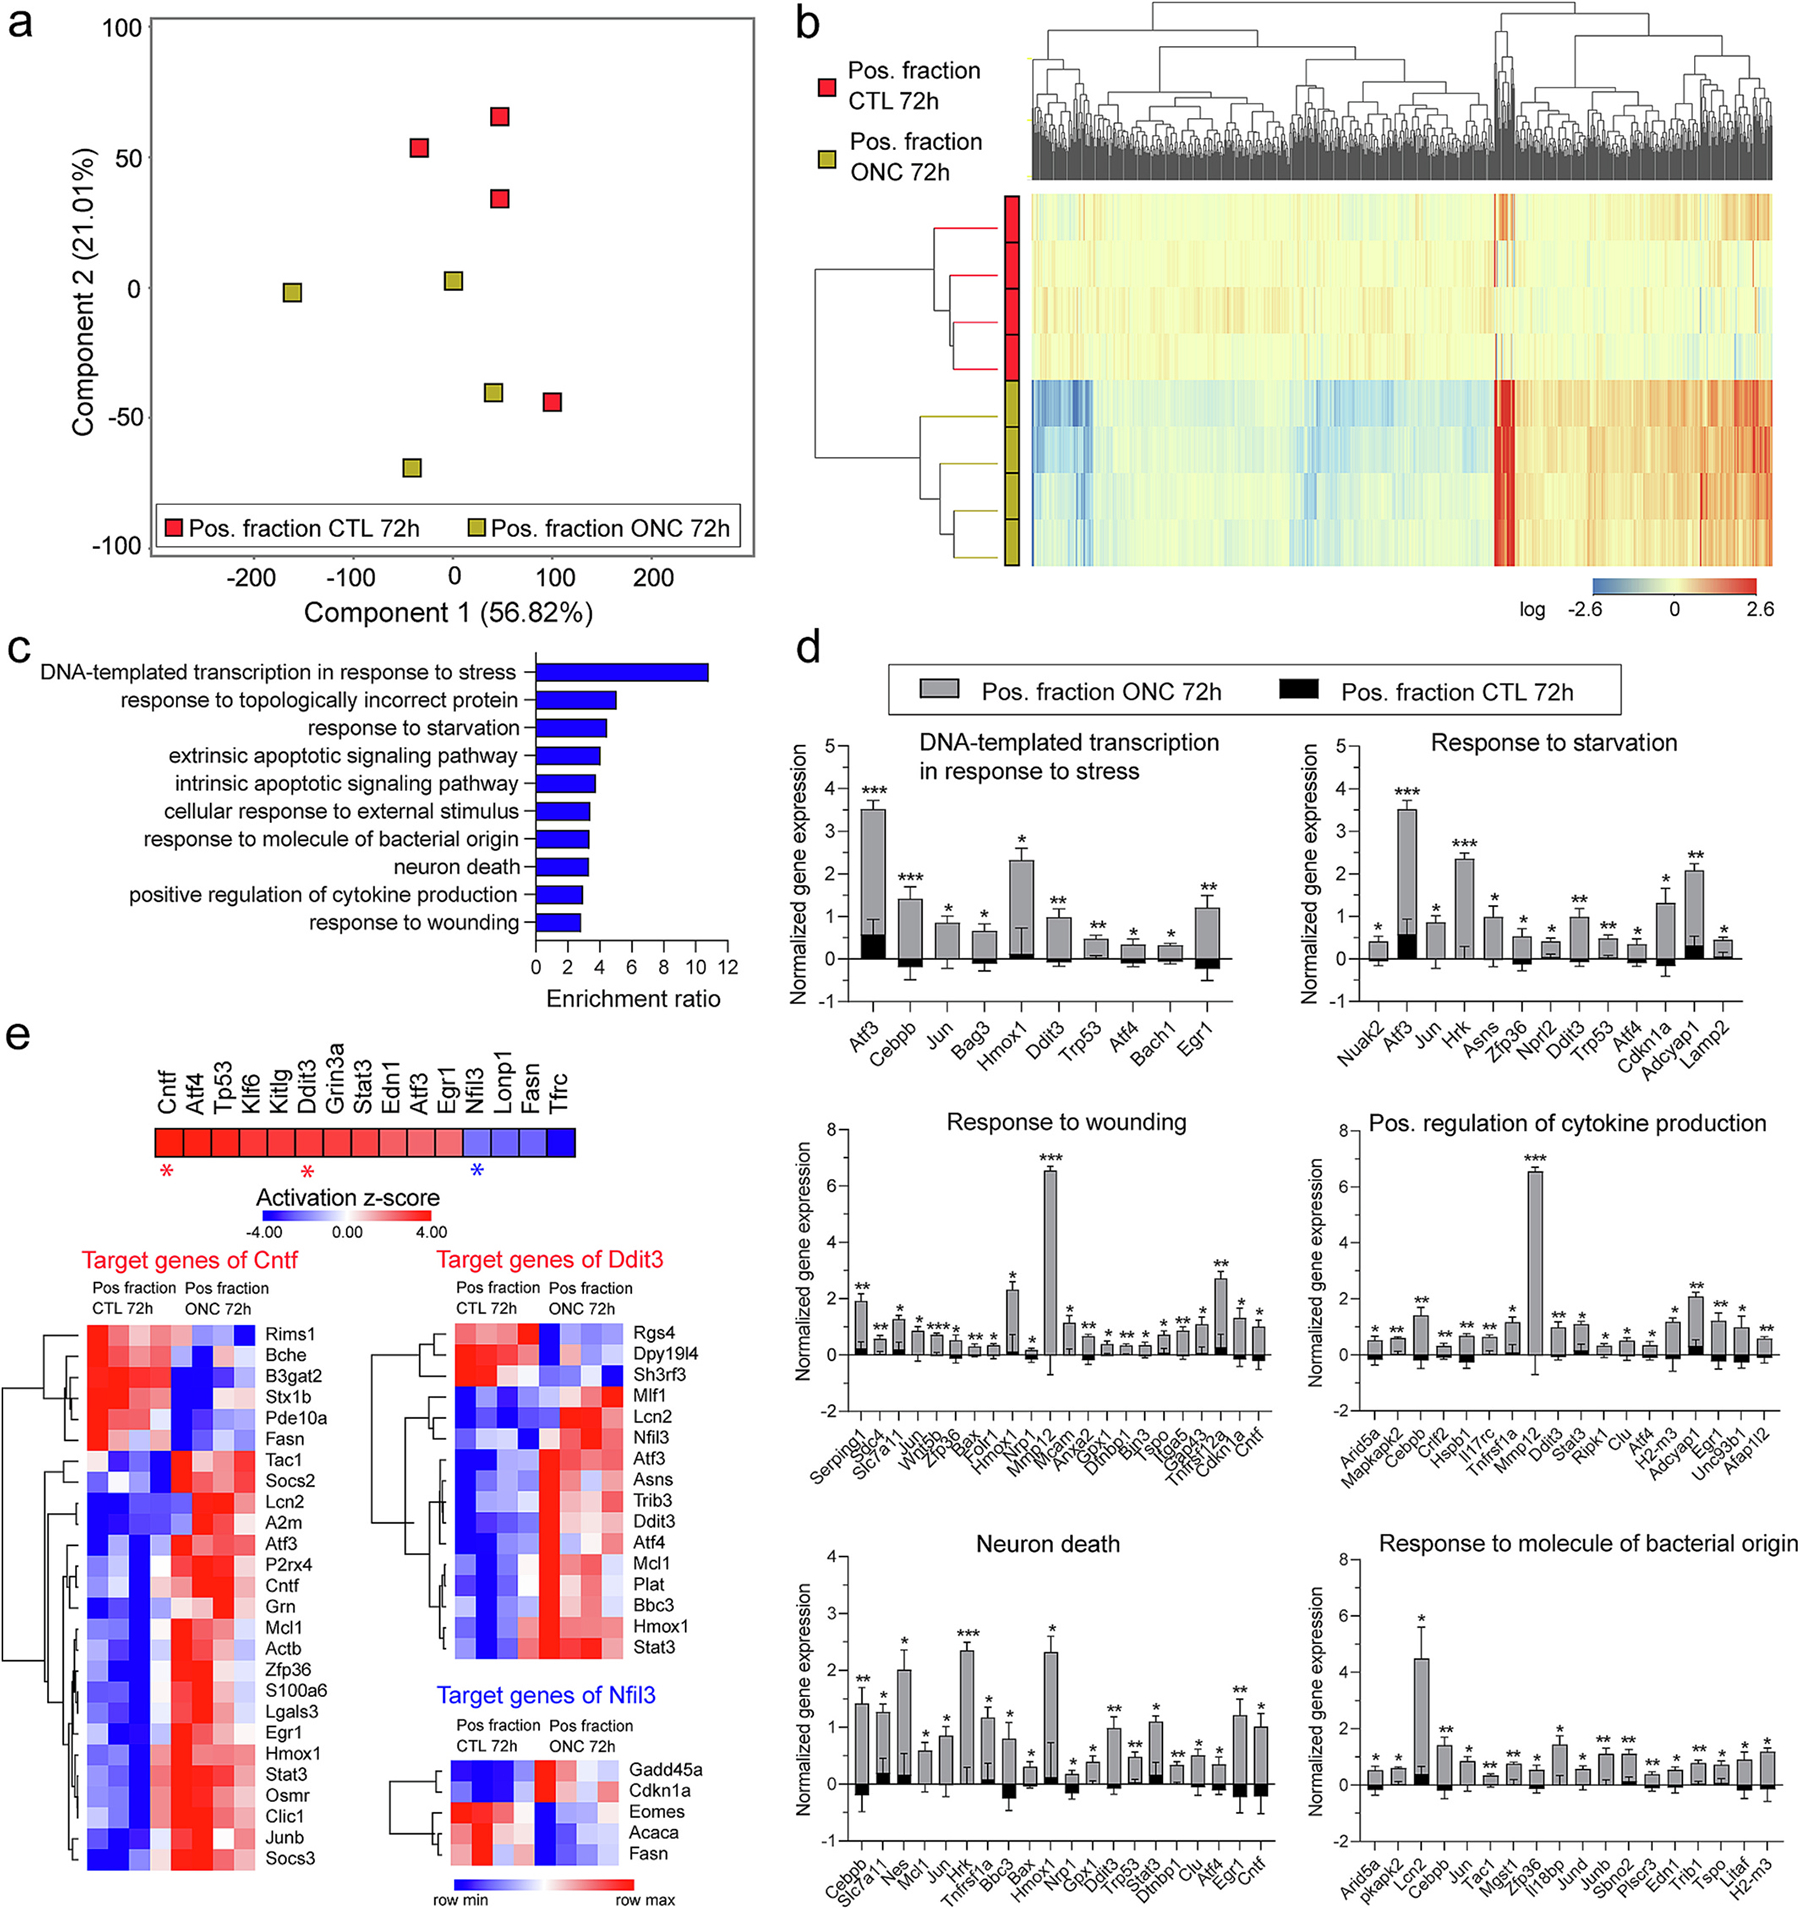
Müller glia translatomic response to optic nerve crush retina stress in the Aldh1l1-cre/ERT2+; NuTRAP+ model. a) Principal component analysis of all expressed genes showed separation of TRAP positive fraction of ONC-treated retinae from TRAP positive fraction of CTL- retinae. b) Hierarchical clustering of differentially expressed genes showed separation of transcriptome profiles of positive fractions based on treatment (n = 4–5/group, Moderated t-test with Benjamini-Hochberg multiple testing correction). c) Differentially expressed genes in the ONC vs CTL group were subjected to over-representation analysis (WebGestalt), identifying 10 top processes with significant enrichment ratio. The normalized expressions for the genes under 6 of those categories are graphed in (d) (n = 4/group, ***p < 0.001, **p < 0.01, *p < 0.05 by Multiple unpaired t-test comparison with False Discovery Rate (FDR). e) Upstream regulator analysis of differentially expressed genes in the TRAP-positive fraction of the ONC group relative to the TRAP-positive fraction of the CTL group (IPA).
3.6. Comparison of Müller glia transcriptomic response to acute and chronic stress
Acute stress responses are early defense mechanisms that are activated by cell damage. These responses serve as essential components of innate immunity intended to clear potential pathogens and initiate inflammatory processes for maintenance of cell homeostasis (Cray et al., 2009). Chronic stress typically manifests itself in a low-grade manner for a prolonged period and is causally associated with changes in the cellular redox state and cell death signaling pathways (Chung et al., 2006). To compare and contrast MGC differentially expressed genes in response to acute stress (through ONC) and chronic stress (due to aging), we intersected our lists of differentially expressed genes generated by TRAP-RNAseq analyses following both retinal stimuli. We found 7 genes with differential expression levels were shared between the two comparisons (Fig. 9a, Supplemental data 7). To associate these changes in gene expression with probable MGC functions, over-representation analysis was conducted. Analysis revealed 5 non-redundant biological processes, including neuron death, cellular component disassembly, homotypic cell-cell adhesion, response to ischemia, and response to pH (Fig. 9b–c, Supplemental data 7). Transcripts with higher enrichment in the old vs young comparison were cathepsin S (Ctss), zinc finger protein 703 (Zfp703), and the major histocompatibility complex 1 (MHC I) component H2-D1. Of interest, increased expression of H2-D1 with aging has been reported across different aged CNS regions, including retina (Mangold et al., 2017), as well as observed in activated retinal MGC following acute (Hoang et al., 2020) and genetic stress (Heng et al., 2019). STEAP family member 4 (Steap4) had higher enrichment in the ONC vs CTL comparison and this up-regulatory response by stressed MGC is consistent with published scRNAseq findings (Heng et al., 2019). Nes and Smarca5-ps showed opposite directionality of expression, with Nes enriched in ONC vs CTL and depleted in old vs young comparisons and Smarca5-ps depleted in ONC vs CTL and enriched in old vs young comparisons (Fig. 9c, Supplemental data 7). The expression fold change of H2-D1 was higher in the old vs young comparison (Fig. 9c, Supplemental data 7). To gain insight into transcriptome changes in MGC specifically driven by retinal aging and ONC, transcripts with differential expression unique to ONC vs CTL (752 genes, Fig. 9f–g) and old vs young (78 genes, Fig. 9d–e) comparisons were subjected to canonical pathway analysis. The analysis, with a score cutoff consisting of −log p value >1.3 and absolute z-score value >1.5 for each set of genes, identified activation of two canonical pathways for old vs young and 7 pathways for ONC vs CTL MGC (Supplemental data 7). The prediction of activation of neuroinflammation (z-score: 2) and hepatic fibrosis signaling (z-score: 2.236) pathways was associated with unique changes in the old vs young MGC comparison. Genes common to these two canonical pathways were Icam1, Bcl2, and Jak1 (Fig. 9d–e, Supplemental data 7). Consistent with the capacity of MGC to up-regulate the expression of Icam1 as part of inflammatory/fibrotic responses (Fig. 9e), a recent proteomic study using cultured human MGC (MIO-M1) reported increased secretion of ICAM1 by MGC in response to cytokine stimulation (Schmalen et al., 2021) and retina scRNA-seq data showed activated (and not resting) MGC expressed Icam1 (Hoang et al., 2020). Among the stress-related pathways represented by genes differentially expressed only in the ONC vs CTL MGC comparison were IL-6 signaling (z-score: 1.508) and integrin-linked kinase (ILK) signaling (z-score: 2.5) (Fig. 9f–g, Supplemental data 7). Consistent with reported involvement of gp130-associated signaling in MGC activation following optic nerve lesion (Kirsch et al., 2010), Stat3 and Socs3 (along with Jak3) were up-regulated in MGC following ONC and were represented by the IL-6 canonical pathway (Fig. 9g). α2-Macroglobulin (α2M) is up-regulated in retinopathies and glaucoma (Barcelona et al., 2011). In line with our observed up-regulation of A2m in MGC with ONC, this transcript was found to be up-regulated in MGC from Aire KO mice compared to WT by scRNAseq (Heng et al., 2019), and its protein, α2M, was found to be part of the secretome of cultured MIO-M1 cells in response to IL-6 treatment (Schmalen et al., 2021). Also, a study using the same MGC line suggested the activated form of α2M induces STAT3 phosphorylation to regulate GFAP expression by MGC (Barcelona et al., 2011).
Fig. 9.
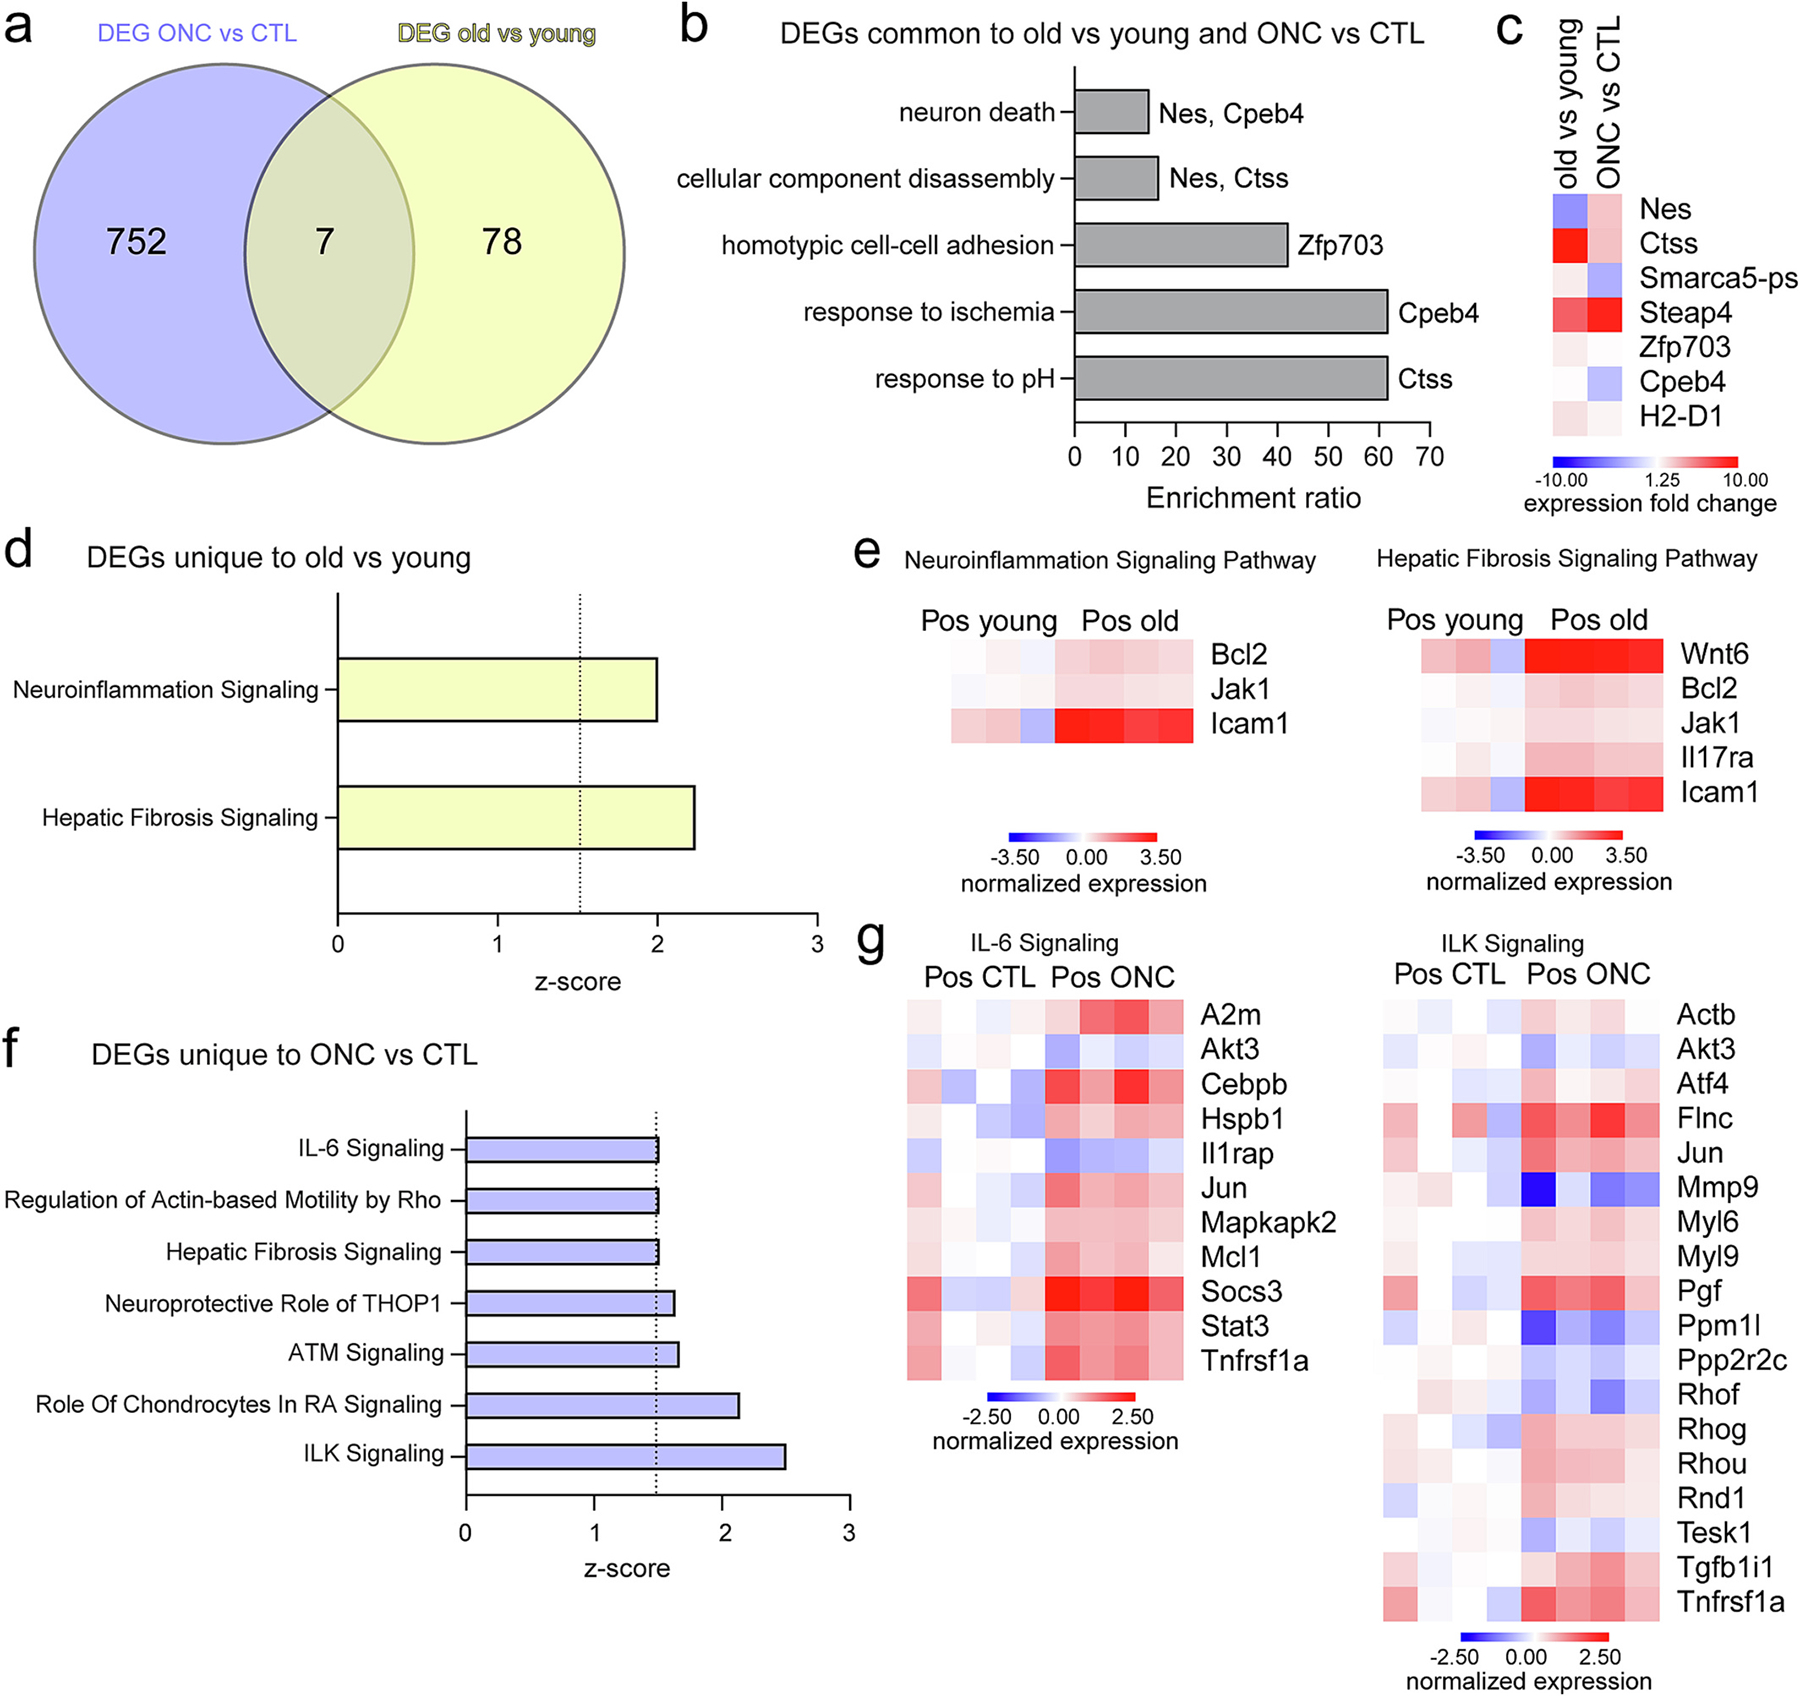
Comparison of Müller glia translatomic response to acute and chronic stress. a) Venn diagram illustrates the intersection of differentially expressed genes (DEG) in Positive fractions of old vs young (TRAP-RNAseq experiment in Fig. 5) and ONC vs CTL (TRAP-RNAseq experiment in Fig. 8) samples. The identified 7 genes differentially up-regulated in both models of retinal stress were subjected to (b) over-representation analysis (Webgestalt), identifying 5 main non-redundant biological processes. c) RNAseq heatmap represent the expression fold change for genes comprised under the biological processes enriched in (b). d) The list of DEG unique to old vs young comparison (78 genes) was subjected to IPA canonical pathway analysis, identifying two pathways that satisfied score cutoff (−log p-value >1.3 and z-score >1.5). e) Normalized expression for transcripts under pathways in (d) is shown in heatmap representation comparing young and old positive fractions. f) The list of DEG unique to the ONC vs CTL comparisons (752 genes) was subjected to IPA canonical pathway analysis. Bar graph indicates selected canonical pathways that satisfied score cutoff. g) Normalized expression for transcripts under pathways in (f) is shown in heatmap representation comparing CTL and ONC positive fractions.
NMDA- and light damage-induced stress are examples of acute retinal stress, and in the scRNA-seq study by Hoang and collaborators were shown to cause rapid changes in MGC gene expression (Hoang et al., 2020). In the search for markers of activated MGC in response to different types of stress, we contrasted the lists of differentially expressed genes in the ONC vs CTL- and old vs young- positive fraction comparisons with differential expression changes listed as unique to MGC under NMDA and/or light damage conditions from this study (28 genes, refer to Table S5 in such study). We found the up-regulation of 5 genes was common to MGC subjected to ONC in our study and activated MGC by NMDA/light damage, consistent with enhancement of acute stress response (Supplementary Fig. 5a and 5c, Supplemental data 7). No genes were shared between aged MGC and activated MGC by NMDA/light damage (Supplementary Fig. 5b). From a list of resting MGC genes identified by Hoang (26 genes, refer to Table S5 in such study), no overlap was found with the old vs young MGC and ONC vs CTL comparisons (Supplementary Fig. 5a–b). In addition to this meta-analysis, we interrogated whether any of the expression changes in activated MGC in response to aging or ONC overlapped with known markers of microglia, as part of a phenotype switch in response to stress. We intersected DEGs in the old Positive fraction vs young positive fraction and DEGs in the ONC positive fraction vs CTL positive fraction comparisons with a list of microglial genes from Macosko et al. (Macosko et al., 2015) (filtered to only include genes expressed by MGC and not in other cell clusters from that study) (Supplementary Fig. 7d–e, Supplemental data 8). We identified a minority of microglial genes from the Macosko study had increased expression in the TRAP positive fraction of aging and ONC retinae. Such enrichments, at varying levels, were also observed in Aire KO MGC by scRNA-seq, in work by the Nathans group (Heng et al., 2019) and argue either transcript contamination or that microglia and MGC share responses upon stress challenge.
Collectively, the data presented in this study support the Aldh1l1-NuTRAP mouse model as a valuable tool to interrogate the epigenome and translatome of retina MGC in response to normal aging and acute stress. The isolation of the MGC translatome under basal conditions, as well as following normal aging and ONC, allows for the identification of genes and signaling pathways responsive to different types of insults at the cell-specific level that could be missed in tissue-level RNAseq studies of the retina.
4. Discussion
The retina is comprised of 11 major cell types, represented by nearly 40 different subpopulations, that collectively capture, process, and transmit electrical signals to the brain (Pauly et al., 2019; Macosko et al., 2015). The retinal cell population is heavily dominated by photoreceptor neurons (~80%), while MGC are a comparatively less abundant cell type (~2%) (Pauly et al., 2019) with crucial roles in maintenance of tissue homeostasis, as well as during disease. Molecular studies of MGCs isolated from in vivo models often confront methodological caveats including: low cell yield, morphological and molecular distortions due to loss of cell processes and integrity (Grosche et al., 2016), and the potential for ex vivo activational artifacts. The data in this study support the validation of the Aldh1l1-NuTRAP model for rapid isolation of MGC-specific DNA and RNA, while avoiding tedious and perturbing protocols of cell dissociation and sorting, and as a valuable tool for the paired comparison of cell-type specific epi−/genome and translatome of glial cells. As discussed below, our validations and demonstrations across basal conditions, as well as acute and chronic retinal stress models, offer insight into the molecular cell biology of activated MGC.
The Tam-inducible nature of the Aldh1l1-cre/ERT2; NuTRAP system allows for temporal control of labeling of MGC-specific nuclei and polyribosomes, avoiding the deleterious effects of constitutive DNA recombination during development and potential confounds from having developmental expression of the cre recombinase when studying adult/aged stages of the lifespan. The reported observation that Tam induction of cre does not cause long-lasting or sexually divergent responses in the retinal epigenome and transcriptome (Chucair-Elliott et al., 2019) further advocates the suitability of this type of system for our study. Of interest, the cre/ERT2 mouse line applied to our model has served as a robust model in studies of the brain astrocytic transcriptome (Srinivasan et al., 2016; Chucair-Elliott et al., 2020), but has not been reported for the identification of retinal glia. Here, we demonstrate that in the neuroretina, and exclusively upon Tam treatment, the Aldh1l1-cre/ERT2 recombinase targets specifically MGC, and report the observation of recombination in adjacent optic nerve astrocytes but not in retinal astrocytes. In a recent single-cell RNAseq study by Hoang et al. (Hoang et al., 2020), both resting and activated MGC but not retina astrocytes expressed Aldh1l1, which supports the MGC-specific tagging of our demonstrated model (Supplementary Fig. 6) (Hoang et al., 2020). On the other hand, the detection of Aldh1l1 through an EGFP reporter mouse line has been utilized to identify optic nerve head astrocytes in a glaucomatous degeneration study (Ju et al., 2015), without description of its expression by retina MGC. Of note, another aldehyde dehydrogenase one family member, Aldh1a1, is one of the gene markers used by Hoang et al. (Hoang et al., 2020) to annotate the MGC-cluster in their single cell RNAseq study. Aldh1a1 protein was confirmed to be expressed by MGC in adult retina by IHC (Goto et al., 2018), and we observed it as enriched in MGC by TRAP-RNAseq in the present study. Given the crucial role of MGC as metabolic support for the retina, it makes sense to speculate that in addition to its role in retinoic acid synthesis through Aldh1a1, MGC have another cell-specific function in the synthesis of retinal folic acid via Aldh1l1. Consistent with this potential role, the expression of folate transport proteins has been characterized in retinal MGC (Bozard et al., 2010).
The pattern of MGC recombination observed by fluorescent confocal imaging spanned posterior to anterior aspects of the retina and was Tam-dependent. Moreover, by IHC inspection following ONC injury, it appeared that the expression of the products of DNA recombination (EGFP and mCherry) was higher and present in a larger number of MGC than in control retinae. This observation suggested that in basal conditions a subset of MGC are frankly positive for EGFP/mCherry while a subset expresses those tags in levels that escape the sensitivity of IHC detection. We speculate it is possible after a cell is recombined, the removal of the stop cassette from the NuTRAP construct (Roh et al., 2017) allows processes to take place in the vicinity of the endogenous Gt (ROSA)26Sor promoter/enhancer regions to enhance promoter activity in response to injury. Such enhancement of promoter activation could result in increased detection of mCherry and EGFP exclusively in cells recombined upon Tam treatment. For the purpose of cell specificity and methodological sensitivity, we propose the Aldh1l1-NuTRAP model and the demonstrated protocols as powerful tools for parallel interrogation of epigenetic and transcriptomic signatures of MGC. In particular, for TRAP-RNAseq, we show reproducibility of the protocol from independent experiments (Supplementary Fig. 7 a–b).
The validation of inducible cell type-specific NuTRAP models requires multiple steps to confirm the specificity of both the NuTRAP induction and the TRAP and INTACT isolations (Roh et al., 2017; Chucair-Elliott et al., 2020). The imaging validation experiments demonstrated Tam-dependent cell type-specific induction of the NuTRAP construct in MGC in both basal and experimental conditions. Transcriptomic studies demonstrated TRAP isolation of highly enriched MGC RNA in the Aldh1l1-NuTRAP positive fractions isolated by TRAP procedures. Further, the application of chronic stress through aging, and acute injury via ONC, showed the relevance of this model to analyze differential transcriptomic responses associated to disease states, specifically in MGC. On the other hand, we demonstrate the INTACT-nuclei isolation as a valuable tool for MGC-specific epigenetic analyses.
In regard to retina aging studies, this is the first one, to our knowledge, using ribosomal affinity purification to specifically isolate and address the transcriptome of MGC. In a prior transcriptome analysis of whole retina with aging, we observed over-representation of pathways and processes related to inflammation (Du et al., 2017). Only a few genes up-regulated with age were in common between this (Du et al., 2017) and the present study, including Tmem116, Icam1, Tec, Bcl2, and Moxd1 (refer to Supplemental data 5 in this study and Appendix 1 in Du et al. (Du et al., 2017)). The increased expression of those transcripts in the TRAP-positive fraction old vs TRAP-positive fraction young allows us to propose these up-regulations with aging, at least partly, occur in MGC. In comparison to a recent RNAseq study using FACS of GFP+ cells from retina cells of Rlbp1-GFP mice for MGC RNA isolation (Lin et al., 2019), the TRAP-positive fraction old vs TRAP-positive fraction young RNAseq analysis showed a lower number of genes differentially regulated with age (85 vs 522 genes) (refer to Supplemental data 5 in this study and Supplementary Table S3 in Lin et al. (Lin et al., 2019)). This differential detection of transcript expression changes in response to aging could be the result of different animal models and ages of study (2 months vs 6 months for young group and 18 months vs 24 months for old group), differences in protocols to isolate MGC transcriptome, and differences in the RNAseq processing/analysis. Only 8 genes differentially regulated with aging intersected these two studies: Wnt6, Tmem116, Steap4, Grik3, and Bcar3 up-regulated, Pcdh20 down-regulated, and Reln and Zdbf2 with opposite directionality of expression in both studies.
Prior studies in the field of glaucomatous neurodegeneration have used whole retina tissue RNA to examine post-ONC molecular changes (Mac Nair et al., 2016; Sharma et al., 2014; Yasuda et al., 2014). Our TRAP-RNAseq experiment following the ONC paradigm is the first one to show the differential MGC translatome response to the injury, allowing the expression analysis of ~11,800 transcripts per sample. This depth of analysis is far greater than that achieved in most scRNAseq approaches (~1–3000), a further advantage of the TRAP approach. This distinction is critical as some ‘cell unique’ transcripts by scRNA-seq may be detectable in multiple cell types by other methods, like TRAP-seq, which have greater sensitivity. Conversely, TRAP-seq and other methods like RiboTag-seq will have some low levels of contamination from other cell types and investigators will need to carefully set background/non-specific gene expression levels. While scRNA-seq is a powerful tool, some limitations include: poor coverage of distal process enriched transcripts (which are sheared off in preparing single cell suspension), coverage of only the 3′ end of transcripts (as opposed to whole gene coverage), and potential ex vivo activation artifacts of making single cell suspensions. The top three differentially enriched genes after ONC, in both our TRAP-RNAseq analysis and bulk RNAseq data by Yasuda and collaborators (Yasuda et al., 2014) were Mmp12, Sprr1a, and Ecel1. The fold change expression for these genes in response to ONC was greater in our TRAP analysis as compared to the whole tissue analysis (95.08 vs 17.82 for Mmp12, 91.93 vs 23.81 for Sprr1a, and 22.42 vs 15.96 for Ecel1), demonstrating that the TRAP approach gives a greater effect size. Other gene examples with greater extent of enrichment in TRAP- vs bulk- RNAseq were Sox11, Atf3, and Tnfrsf12a (refer to Supplemental data 6 in this study and Table S3 of Yasuda el al., 2014 (Yasuda et al., 2014)). These greater effect sizes, when MGCs are examined specifically as compared to the whole range of retinal cell types, support the idea that these responses are solely or principally occurring in the MGC. This type of conclusion cannot be reached from bulk retina RNAseq studies, since bulk tissue samples “dilute” or “mask” the transcriptome of minority cell types, such as retina glial cells.
The interrogation of commonalities between MGC following both ONC and advanced age revealed only seven genes with differential expression in both stress settings. Of interest, Nes, an established marker of gliotic response in MGC early after ONC (Mac Nair et al., 2016; Xue et al., 2006) and activated in MGC following light damage and NMDA toxicity (Hoang et al., 2020), was up-regulated in MGC after ONC, consistent with increased expression of GFAP by MGC, as shown by IHC. The down-regulation of Nes in aged MGC vs young MGC was associated with no changes in GFAP expression by MGC, as observed via IHC. This difference in directionality of gene expression reflects the existence of differential mechanisms intrinsic to MGC that orchestrate in response to acute and chronic stress, an important aspect to be considered by researchers in the selection of experimental models of chronic retinal disease. The MHC I processing and antigen presentation pathway has been extensively characterized in the immune system and is normally expressed in the CNS, including the neuroretina, where increased gene expression of its components (including H2-D1) and receptors with aging has been reported (Mangold et al., 2017). While histochemically the age-related induction of H2-D1 was suggested to occur in microglial cells and neurons (Mangold et al., 2017), the cell-specificity of the present study allows us to suggest that retinal MGC are, at least in part, a source of this transcript up-regulation and might participate in antigen presentation and processing in response to stress (Heng et al., 2019; Schmalen et al., 2021). This MGC function is further supported by the RNAseq findings of differentially enriched B2m, H2-K1, Tap1, Tap2, Psmb8, and Psmb9 genes in the TRAP-positive fraction compared to input from naïve retinae (refer to Supplemental data 1), and expression in TRAP-positive fraction of young and old (Supplemental data 5), as well as of CTL and ONC (Supplemental data 6) groups. The intersection of differential transcriptome responses of MGC to aging and ONC revealed gene expression signatures unique to MGC under each type of stress. The hepatic fibrosis signaling pathway was predicted to be activated with both aging and ONC but was represented by a different set of transcripts in each model. With aging, the top-2 genes in this pathway were Wnt6 and Icam1. This increase in Icam1 transcript in old MGC was consistent with its enrichment in old vs young retina (Du et al., 2017), as well as elevated protein level in intraocular fluids of neovascular AMD patients (Knickelbein et al., 2015). Genes differentially expressed in MGC subjected to ONC represented pathways associated with acute inflammation, such as IL-6 signaling. The differential enrichment of genes for the STAT3 signaling axis in MGC was a unique response to ONC and not aging. Also, unique to ONC was the prediction of activation of ILK and role of chondrocytes in rheumatoid arthritis signaling pathways, suggestive of a role of MGC in extracellular matrix remodeling (Schmalen et al., 2021) following ONC injury.
Work of Lin and collaborators (Lin et al., 2019) analyzed the methylome of gDNA from sorted MGC under normal, injury, and aging conditions. Their findings suggested that CpG methylation might regulate the expression of a subset of MGC specific genes during development, and MGC methylome changes with injury and aging (Lin et al., 2019). The WGoxBS method used in validating the INTACT protocol showed no global genomic difference in mCG, hmCG, and mCH between positive fraction and input Aldh1l1-NuTRAP samples. Rather, single-gene level analysis at promoter, gene body, and downstream gene-body regions revealed specific and statistically significant anticorrelations between CpG methylation and expression changes. We interpret these correlations to further support the cell identity of the DNA isolated in the INTACT-positive fraction as that of MGC while offering insight into potential gene expression regulation mechanism in MGC by the epigenome. While the experimental demonstrations with the aging and ONC settings did not extend to the comparison of MGC epigenome under different conditions, the validation protocols and analyses shared here can be applied to interrogate differentially methylated loci of MGC genome in response to stimuli.
5. Conclusions
In conclusion, our validation and experimental demonstration data amply support the Aldh1l1-NuTRAP model as a versatile tool, suitable for the paired interrogation of the epigenome and translatome, specifically in MGC. The advantages of this approach are:
By focusing molecular analyses to a single cell type within the retina not only are previously missed changes observed and effect sizes more substantial, but also the interpretation of the findings can be placed within a single cell type.
As evidenced by the comparison of acute (ONC) and chronic (aging) damage in the retina, MGC responsiveness reveals core commonalities but mostly stimuli-dependent specific molecular changes.
Epigenomic and gene expression analyses can be performed with one transgenic line, that can also be used for other approaches such as FACS when needed for specific study objectives, such as protein analysis.
Supplementary Material
Acknowledgments
The authors acknowledge the Cellular Imaging Core, at the Dean McGee Institute, OUHSC, for providing access to confocal imaging equipment, and the Oklahoma Medical Research Foundation Clinical Genomics Center, which provided sequencing services. The authors also acknowledge Adeline Machalinski (mouse colony management and genotyping), Robyn Berent (administrative support and lab management), as well as Hunter Porter, Victor Ansere, and Kyla Tooley for critical scientific discussions during the preparation of this manuscript.
This work was supported by grants from the Brightfocus Foundation (Macular Degeneration Research Standard Award, M2020207), National Institutes of Health (NIH) P30AG050911, R01AG059430, R01EY019494, R01EY028608, T32AG052363, F31AG064861, P30EY021725, Oklahoma Center for Adult Stem Cell Research (OCASCR), a program of the Oklahoma Tobacco Settlement Endowment Trust, Research to Prevent Blindness, Inc., and Presbyterian Health Foundation. This work was also supported in part by the MERIT award I01BX003906 from the United States (U.S.) Department of Veterans Affairs, Biomedical Laboratory Research and Development Service.
Abbreviations:
- MCG
Müller glial cell
- AMD
Age-related macular degeneration
- DR
Diabetic retinopathy
- mC
Methylcytosine
- hmC
Hydroxymethylcytosine
- RPC
Retinal progenitor cells
- FACS
Fluorescence-activated cell sorting
- RNAseq
RNA sequencing
- GS
Glutamine synthetase
- GFAP
Glial fibrillary acidic protein
- ONC
Optic nerve crush
- TRAP
Translating Ribosome Affinity Purification
- INTACT
Isolation of Nuclei from Tagged specific nuclei
- WGoxBS-seq
Whole genome oxidative bisulfite sequencing
Footnotes
Declaration of Competing Interest
Ana J. Chucair-Elliott: none, Sarah R. Ocañas: none, 1 Kevin Pham: none, Michael Van Der Veldt: none, Ashley Cheyney: none, David Stanford: none, Jami Gurley: none, Michael H. Elliott: none, Willard M. Freeman: none.
CRediT authorship contribution statement
Ana J. Chucair-Elliott: Conceptualization, Methodology, Validation, Formal analysis, Investigation, Writing – original draft, Writing – review & editing, Visualization, Supervision, Project administration, Funding acquisition. Sarah R. Ocañas: Formal analysis, Investigation, Software, Writing – review & editing, Visualization. Michael Van Der Veldt: Formal analysis, Investigation, Writing – review & editing. Ashley Cheyney: Formal analysis, Investigation, Writing – review & editing. David Stanford: Formal analysis, Software, Data curation, Writing – review & editing. Jami Gurley: Formal analysis, Investigation, Writing – review & editing, Visualization. Michael H. Elliott: Conceptualization, Writing – review & editing, Resources, Funding acquisition. Willard M. Freeman: Conceptualization, Methodology, Validation, Formal analysis, Resources, Data curation, Software, Writing – original draft, Writing – review & editing, Visualization, Supervision, Project administration, Funding acquisition.
Supplementary data to this article can be found online at https://doi.org/10.1016/j.nbd.2022.105931.
Data availability
Sequencing data that support the findings of this study have been deposited in GEO. Other data that support the findings of the study are available from the corresponding authors upon request.
References
- Araujo RS, Santos DF, Silva GA, 2018. The role of the retinal pigment epithelium and Muller cells secretome in neovascular retinal pathologies. Biochimie 155, 104–108. [DOI] [PubMed] [Google Scholar]
- Barcelona PF, Ortiz SG, Chiabrando GA, Sanchez MC, 2011. alpha2-macroglobulin induces glial fibrillary acidic protein expression mediated by low-density lipoprotein receptor-related protein 1 in Muller cells. Invest. Ophthalmol. Vis. Sci. 52, 778–786. [DOI] [PubMed] [Google Scholar]
- Bozard BR, et al. , 2010. Molecular and biochemical characterization of folate transport proteins in retinal Muller cells. Invest. Ophthalmol. Vis. Sci. 51, 3226–3235. [DOI] [PMC free article] [PubMed] [Google Scholar]
- Bringmann A, et al. , 2006. Muller cells in the healthy and diseased retina. Prog. Retin. Eye Res. 25, 397–424. [DOI] [PubMed] [Google Scholar]
- Choi SH, et al. , 2020. AIBP protects retinal ganglion cells against neuroinflammation and mitochondrial dysfunction in glaucomatous neurodegeneration. Redox Biol. 37, 101703. [DOI] [PMC free article] [PubMed] [Google Scholar]
- Chucair-Elliott AJ, et al. , 2019. Tamoxifen induction of Cre recombinase does not cause long-lasting or sexually divergent responses in the CNS epigenome or transcriptome: implications for the design of aging studies. Geroscience 41 (5), 691–708. [DOI] [PMC free article] [PubMed] [Google Scholar]
- Chucair-Elliott AJ, et al. , 2020. Inducible cell-specific mouse models for paired epigenetic and transcriptomic studies of microglia and astroglia. Commun. Biol. 3, 693. [DOI] [PMC free article] [PubMed] [Google Scholar]
- Chung HY, Sung B, Jung KJ, Zou Y, Yu BP, 2006. The molecular inflammatory process in aging. Antioxid. Redox Signal. 8, 572–581. [DOI] [PubMed] [Google Scholar]
- Coorey NJ, Shen W, Zhu L, Gillies MC, 2015. Differential expression of IL-6/gp130 cytokines, Jak-STAT signaling and neuroprotection after Muller cell ablation in a transgenic mouse model. Invest. Ophthalmol. Vis. Sci. 56, 2151–2161. [DOI] [PubMed] [Google Scholar]
- Corso-Diaz X, Jaeger C, Chaitankar V, Swaroop A, 2018. Epigenetic control of gene regulation during development and disease: a view from the retina. Prog. Retin. Eye Res. 65, 1–27. [DOI] [PMC free article] [PubMed] [Google Scholar]
- Cray C, Zaias J, Altman NH, 2009. Acute phase response in animals: a review. Comp. Med. 59, 517–526. [PMC free article] [PubMed] [Google Scholar]
- Deal RB, Henikoff S, 2011. The INTACT method for cell type-specific gene expression and chromatin profiling in Arabidopsis thaliana. Nat. Protoc. 6, 56–68. [DOI] [PMC free article] [PubMed] [Google Scholar]
- Dougherty JD, 2017. The expanding toolkit of translating ribosome affinity purification. J. Neurosci. 37, 12079–12087. [DOI] [PMC free article] [PubMed] [Google Scholar]
- Du M, et al. , 2017. Retinal gene expression responses to aging are sexually divergent. Mol. Vis. 23, 707–717. [PMC free article] [PubMed] [Google Scholar]
- Dvoriantchikova G, Seemungal RJ, Ivanov D, 2019. Development and epigenetic plasticity of murine Muller glia. Biochim. Biophys. Acta, Mol. Cell Res. 1866, 1584–1594. [DOI] [PMC free article] [PubMed] [Google Scholar]
- Eastlake K, et al. , 2016. Muller glia as an important source of cytokines and inflammatory factors present in the gliotic retina during proliferative vitreoretinopathy. Glia 64, 495–506. [DOI] [PMC free article] [PubMed] [Google Scholar]
- Furukawa T, Morrow EM, Li T, Davis FC, Cepko CL, 1999. Retinopathy and attenuated circadian entrainment in Crx-deficient mice. Nat. Genet. 23, 466–470. [DOI] [PubMed] [Google Scholar]
- Goldman D, 2014. Muller glial cell reprogramming and retina regeneration. Nat. Rev. Neurosci. 15, 431–442. [DOI] [PMC free article] [PubMed] [Google Scholar]
- Goto S, et al. , 2018. Neural retina-specific Aldh1a1 controls dorsal choroidal vascular development via Sox9 expression in retinal pigment epithelial cells. Elife 7. [DOI] [PMC free article] [PubMed] [Google Scholar]
- Grosche A, et al. , 2016. The proteome of native adult Muller glial cells from murine retina. Mol. Cell. Proteomics 15, 462–480. [DOI] [PMC free article] [PubMed] [Google Scholar]
- Gu Z, Eils R, Schlesner M, Ishaque N, 2018. EnrichedHeatmap: an R/Bioconductor package for comprehensive visualization of genomic signal associations. BMC Genomics 19, 234. [DOI] [PMC free article] [PubMed] [Google Scholar]
- Guedes G, Tsai JC, Loewen NA, 2011. Glaucoma and aging. Curr. Aging Sci. 4, 110–117. [DOI] [PubMed] [Google Scholar]
- Habib N, et al. , 2017. Massively parallel single-nucleus RNA-seq with DroNc-seq. Nat. Methods 14, 955–958. [DOI] [PMC free article] [PubMed] [Google Scholar]
- Heng JS, et al. , 2019. Hypoxia tolerance in the Norrin-deficient retina and the chronically hypoxic brain studied at single-cell resolution. Proc. Natl. Acad. Sci. U. S. A. 116, 9103–9114. [DOI] [PMC free article] [PubMed] [Google Scholar]
- Hoang T, et al. , 2020. Gene regulatory networks controlling vertebrate retinal regeneration. Science 370. [DOI] [PMC free article] [PubMed] [Google Scholar]
- Hunter A, et al. , 2012. DNA methylation is associated with altered gene expression in AMD. Invest. Ophthalmol. Vis. Sci. 53, 2089–2105. [DOI] [PMC free article] [PubMed] [Google Scholar]
- Inman DM, Horner PJ, 2007. Reactive nonproliferative gliosis predominates in a chronic mouse model of glaucoma. Glia 55, 942–953. [DOI] [PubMed] [Google Scholar]
- Jones BW, et al. , 2016. Retinal remodeling and metabolic alterations in human AMD. Front. Cell. Neurosci. 10, 103. [DOI] [PMC free article] [PubMed] [Google Scholar]
- Ju WK, et al. , 2015. Increased mitochondrial fission and volume density by blocking glutamate excitotoxicity protect glaucomatous optic nerve head astrocytes. Glia 63, 736–753. [DOI] [PMC free article] [PubMed] [Google Scholar]
- Kirsch M, Trautmann N, Ernst M, Hofmann HD, 2010. Involvement of gp130-associated cytokine signaling in Muller cell activation following optic nerve lesion. Glia 58, 768–779. [DOI] [PubMed] [Google Scholar]
- Knickelbein JE, Chan CC, Sen HN, Ferris FL, Nussenblatt RB, 2015. Inflammatory mechanisms of age-related macular degeneration. Int. Ophthalmol. Clin. 55, 63–78. [DOI] [PMC free article] [PubMed] [Google Scholar]
- Li Y, Schlamp CL, Nickells RW, 1999. Experimental induction of retinal ganglion cell death in adult mice. Invest. Ophthalmol. Vis. Sci. 40, 1004–1008. [PubMed] [Google Scholar]
- Liao Y, Wang J, Jaehnig EJ, Shi Z, Zhang B, 2019. WebGestalt 2019: gene set analysis toolkit with revamped UIs and APIs. Nucleic Acids Res. 47, W199–W205. [DOI] [PMC free article] [PubMed] [Google Scholar]
- Lin S, Guo J, Chen S, 2019. Transcriptome and DNA Methylome signatures associated with retinal Muller glia development, injury response, and aging. Invest. Ophthalmol. Vis. Sci. 60, 4436–4450. [DOI] [PubMed] [Google Scholar]
- Luu J, Palczewski K, 2018. Human aging and disease: lessons from age-related macular degeneration. Proc. Natl. Acad. Sci. U. S. A. 115, 2866–2872. [DOI] [PMC free article] [PubMed] [Google Scholar]
- Mac Nair CE, Schlamp CL, Montgomery AD, Shestopalov VI, Nickells RW, 2016. Retinal glial responses to optic nerve crush are attenuated in Bax-deficient mice and modulated by purinergic signaling pathways. J. Neuroinflammation 13, 93. [DOI] [PMC free article] [PubMed] [Google Scholar]
- Macosko EZ, et al. , 2015. Highly parallel genome-wide expression profiling of individual cells using nanoliter droplets. Cell 161, 1202–1214. [DOI] [PMC free article] [PubMed] [Google Scholar]
- Mangold CA, et al. , 2017. CNS-wide sexually dimorphic induction of the major histocompatibility complex 1 pathway with aging. J. Gerontol. A Biol. Sci. Med. Sci. 72, 16–29. [DOI] [PMC free article] [PubMed] [Google Scholar]
- Masser DR, et al. , 2018. Analysis of DNA modifications in aging research. Geroscience 40, 11–29. [DOI] [PMC free article] [PubMed] [Google Scholar]
- Menon M, et al. , 2019. Single-cell transcriptomic atlas of the human retina identifies cell types associated with age-related macular degeneration. Nat. Commun. 10, 4902. [DOI] [PMC free article] [PubMed] [Google Scholar]
- Mitton KP, et al. , 2000. The leucine zipper of NRL interacts with the CRX homeodomain. A possible mechanism of transcriptional synergy in rhodopsin regulation. J. Biol. Chem. 275, 29794–29799. [DOI] [PubMed] [Google Scholar]
- Mo A, et al. , 2016. Epigenomic landscapes of retinal rods and cones. Elife 5, e11613. [DOI] [PMC free article] [PubMed] [Google Scholar]
- Ocanas SR, et al. , 2022. Minimizing the ex vivo confounds of cell-isolation techniques on transcriptomic and translatomic profiles of purified microglia. eNeuro 9. [DOI] [PMC free article] [PubMed] [Google Scholar]
- Pauly D, et al. , 2019. Cell-type-specific complement expression in the healthy and diseased retina. Cell Rep. 29, 2835–2848 e2834. [DOI] [PMC free article] [PubMed] [Google Scholar]
- Pennington KL, DeAngelis MM, 2016. Epidemiology of age-related macular degeneration (AMD): associations with cardiovascular disease phenotypes and lipid factors. Eye Vis. (Lond) 3, 34. [DOI] [PMC free article] [PubMed] [Google Scholar]
- Powell C, Grant AR, Cornblath E, Goldman D, 2013. Analysis of DNA methylation reveals a partial reprogramming of the Muller glia genome during retina regeneration. Proc. Natl. Acad. Sci. U. S. A. 110, 19814–19819. [DOI] [PMC free article] [PubMed] [Google Scholar]
- Qu J, Jakobs TC, 2013. The time course of gene expression during reactive gliosis in the optic nerve. PLoS One 8, e67094. [DOI] [PMC free article] [PubMed] [Google Scholar]
- Roesch K, et al. , 2008. The transcriptome of retinal Muller glial cells. J. Comp. Neurol. 509, 225–238. [DOI] [PMC free article] [PubMed] [Google Scholar]
- Roh HC, et al. , 2017. Simultaneous transcriptional and Epigenomic profiling from specific cell types within heterogeneous tissues in vivo. Cell Rep. 18, 1048–1061. [DOI] [PMC free article] [PubMed] [Google Scholar]
- Rubsam A, Parikh S, Fort PE, 2018. Role of inflammation in diabetic retinopathy. Int. J. Mol. Sci. 19. [DOI] [PMC free article] [PubMed] [Google Scholar]
- Schmalen A, et al. , 2021. Proteomic phenotyping of stimulated Muller cells uncovers profound pro-inflammatory signaling and antigen-presenting capacity. Front. Pharmacol. 12, 771571. [DOI] [PMC free article] [PubMed] [Google Scholar]
- Sharma TP, et al. , 2014. Optic nerve crush induces spatial and temporal gene expression patterns in retina and optic nerve of BALB/cJ mice. Mol. Neurodegener. 9, 14. [DOI] [PMC free article] [PubMed] [Google Scholar]
- Srinivasan R, et al. , 2016. New transgenic mouse lines for selectively targeting astrocytes and studying calcium signals in astrocyte processes in situ and in vivo. Neuron 92, 1181–1195. [DOI] [PMC free article] [PubMed] [Google Scholar]
- Tang F, et al. , 2020. The expression and role of PIDD in retina after optic nerve crush. J. Mol. Histol. 51, 89–97. [DOI] [PubMed] [Google Scholar]
- Templeton JP, Geisert EE, 2012. A practical approach to optic nerve crush in the mouse. Mol. Vis. 18, 2147–2152. [PMC free article] [PubMed] [Google Scholar]
- Tonari M, et al. , 2012. Blocking endothelin-B receptors rescues retinal ganglion cells from optic nerve injury through suppression of neuroinflammation. Invest. Ophthalmol. Vis. Sci. 53, 3490–3500. [DOI] [PubMed] [Google Scholar]
- Ueki Y, Wang J, Chollangi S, Ash JD, 2008. STAT3 activation in photoreceptors by leukemia inhibitory factor is associated with protection from light damage. J. Neurochem. 105, 784–796. [DOI] [PubMed] [Google Scholar]
- VandenBosch LS, et al. , 2020. Developmental changes in the accessible chromatin, transcriptome and Ascl1-binding correlate with the loss in Muller glial regenerative potential. Sci. Rep. 10, 13615. [DOI] [PMC free article] [PubMed] [Google Scholar]
- Wahlin KJ, et al. , 2013. Epigenetics and cell death: DNA hypermethylation in programmed retinal cell death. PLoS One 8, e79140. [DOI] [PMC free article] [PubMed] [Google Scholar]
- Wang J, et al. , 2018. ATAC-Seq analysis reveals a widespread decrease of chromatin accessibility in age-related macular degeneration. Nat. Commun. 9, 1364. [DOI] [PMC free article] [PubMed] [Google Scholar]
- Wang J, Struebing FL, Geisert EE, 2021. Commonalities of optic nerve injury and glaucoma-induced neurodegeneration: insights from transcriptome-wide studies. Exp. Eye Res. 207, 108571. [DOI] [PMC free article] [PubMed] [Google Scholar]
- Wei L, et al. , 2012. Hypomethylation of the IL17RC promoter associates with age-related macular degeneration. Cell Rep. 2, 1151–1158. [DOI] [PMC free article] [PubMed] [Google Scholar]
- Xue LP, Lu J, Cao Q, Kaur C, Ling EA, 2006. Nestin expression in Muller glial cells in postnatal rat retina and its upregulation following optic nerve transection. Neuroscience 143, 117–127. [DOI] [PubMed] [Google Scholar]
- Xue W, et al. , 2011. Ciliary neurotrophic factor induces genes associated with inflammation and gliosis in the retina: a gene profiling study of flow-sorted, Muller cells. PLoS One 6, e20326. [DOI] [PMC free article] [PubMed] [Google Scholar]
- Yasuda M, Tanaka Y, Ryu M, Tsuda S, Nakazawa T, 2014. RNA sequence reveals mouse retinal transcriptome changes early after axonal injury. PLoS One 9, e93258. [DOI] [PMC free article] [PubMed] [Google Scholar]
Associated Data
This section collects any data citations, data availability statements, or supplementary materials included in this article.
Supplementary Materials
Data Availability Statement
Sequencing data that support the findings of this study have been deposited in GEO. Other data that support the findings of the study are available from the corresponding authors upon request.