Abstract
Purpose:
This study evaluated the presence and roles of cholesteryl esters (CEs) and wax esters (WEs) from human tear film and meibum in meibomian gland dysfunction (MGD).
Methods:
Out of 195 enrolled subjects, 164 and 179 subjects provided tear and meibum samples, respectively. Subjects were classified into normal, asymptomatic MGD, MGD, and mixed (MGD & aqueous deficient). The precorneal tear film (PCTF) thinning rate (evaporation) was measured using optical coherence tomography. Lipids extracted from tear and meibum samples were infused into a SCIEX 5600 TripleTOF mass spectrometer. CE and WE intensities quantified with Analyst 1.7 TF and LipidView 1.3 were compared across disease groups in MetaboAnalyst 5.0 and correlated with PCTF thinning rates.
Results:
The numbers of unique CEs and WEs identified in the samples were 125 and 86, respectively. Unsupervised Principal Component (PC) analysis and supervised Partial Least Square Discriminant analysis exhibited little separation among groups for both CEs and WEs in tears and meibum. Spearman’s correlation analyses showed no association between either the first or second PC scores with PCTF thinning rates.
Conclusion:
The abundances of human PCTF and meibum-derived CEs and WEs were independent of MGD disease status and PCTF thinning (evaporation). CEs and WEs alterations do not contribute to alterations in tear film dynamics in MGD, such as has been demonstrated by the (O-acyl) ω-hydroxy fatty acids (OAHFAs).
Keywords: Meibomian gland dysfunction, Dry eye disease, Evaporative dry eye, Tear film, Meibum, Cholesteryl ester, Wax ester, Lipids
1. Introduction
In the anterior eye, a thin (2–5.5 μm) film of biological tear fluid acts as the interface between the ocular surface and external environment and plays a critical role in maintaining ocular surface homeostasis [1,2]. Changes in the structure, function, and dynamics of the precorneal tear film (PCTF) can upset this homeostatic balance and lead to ocular surface diseases [3,4]. For example, excess evaporation of tears due to rapid PCTF thinning can cause hyperosmolarity, initiating a cascade of events leading to ocular surface inflammation and dry eye disease (DED) [5–7].
The tear film lipid layer (TFLL) overlies the mucoaqueous phase and serves as the barrier against evaporation, thus helping to stabilize PCTF [8–10]. The most common type of dry eye, evaporative dry eye, is caused by a compromise in the structure or function of the meibomian glands (MGs) and their secretions, which compose the TFLL [11–13]. These modified sebaceous glands are located on the tarsal plates of the upper and lower eyelids and secrete lipid-enriched meibum on the lid margins via a holocrine mechanism [14,15]. Dysfunction of the MGs, either through deficiencies in meibum biosynthesis and expression or through quantitative and qualitative changes in meibum composition can compromise the PCTF structure and function, increasing the rate of tear evaporation and producing PCTF instability [4,16–21].
The TFLL is a complex mixture of lipids arranged in a duplex structural organization with a superficial region of non-polar lipids at the air/tear interface and an inner region of polar lipids adjacent to the mucoaqueous phase [8,22]. The major components of the non-polar lipid layer are cholesteryl esters (CEs, ~39%) and wax esters (WEs, ~43%), which account for approximately 82% of the total lipids [23–26]. The remaining lipid fraction (~18%) is made up of amphiphilic polar lipids, including phospholipids and (O-acyl)-omega-hydroxy fatty acids (OAHFAs), which primarily compose the polar lipid region of the TFLL [23]. Both polar and non-polar regions in TFLL likely contribute to TF stability in some mutually inclusive ways, serving to slow evaporation of the aqueous tears and protecting against microbes and organic matters [27,28], and the polar lipids acting as surfactant molecules to reduce surface tension to enhance TFLL spreading over the mucoaqueous phase or serve as a barrier to evaporation themselves [29–33].
However, the exact mechanism by which the TFLL retards tear evaporation and promotes PCTF stability remains poorly understood. Previous investigations of the relation between TFLL thickness and tear evaporation showed mixed findings. Some studies found that a thicker lipid layer protected against excess tear evaporation [27,34,35], while others demonstrated that TFLL thickness was an unreliable predictor of tear evaporation or PCTF stability [34,36–38], suggesting likely involvement of factors other than TFLL thickness. Recent evidence suggests that the physical properties of the PCTF could be intricately coupled to the biochemical composition of the TFLL, pointing to a critical role of the lipid layer constituents [39,40]. In animal models, changes in biochemical composition of the TF brought about by the mutation of genes involved in meibum synthesis (Elovl1, Elovl3, or Cyp4f39) led to the development of DED [29,41,42]. In humans, the relative amount of OAHFAs decreased as DED increased in severity [43] but increased after MGD patients underwent eyelid warming treatment [44]. Besides, several studies have now shown compositional alterations in a variety of lipid classes in MGD and DED [4,43,45–48].
Recently, we found associations between several polar lipid species and MGD [47] as well as the rate of tear evaporation [4]. There is also some preliminary evidence that non-polar lipids (CEs and WEs) play a role in the anti-evaporative function of the TFLL, and that changes in the composition of these lipids could underlie alterations of TFLL function and PCTF stability [49–53]. In this study, we investigate the potential linkage between non-polar lipids (CEs and WEs) and PCTF dynamics in MGD.
2. Materials and methods
This study was approved by the University of Alabama at Birmingham (UAB) Institutional Review Board (IRB). All subjects were treated and procedures were performed following the tenets of the Declaration of Helsinki.
2.1. Nomenclature
The nomenclature for CEs and WEs used in this report is based on previous descriptions [54,55]. CEs consist of cholesterol esterified with long-chain fatty acids and are denoted as CE A:B; C, where A, B, and C denote the number of carbons, double bonds (degree of unsaturation), and hydroxyl groups (hydroxylation), respectively (Fig. 1A). WEs consist of fatty acids esterified to fatty alcohols are denoted as A:B, where A denotes the number of carbons and B denotes the number of double bonds (Fig. 1B). If the stoichiometry of fatty acid and fatty alcohol is known, the nomenclature for WE is A1:B1/A2:B2. In this representation, A1 denotes the number of carbons and B1 denotes the number of double bonds (degree of unsaturation) in the fatty acid. Similarly, A2 denotes the number of carbons and B2 denotes the number of double bonds (degree of unsaturation) in the fatty alcohol.
Fig. 1.

Schematic illustrations of the structure of A) Cholesterol ester (CE) 24:1; 1 and B) Wax ester (WE) 42:1 (18:1/24:1). CE 24:1; 1 contains 24 carbons, one double bond, and one hydroxyl group. WE 42:1 (18:1/24:0) contains 18 carbons and one double bond in the fatty acid chain and 24 carbons without any double bond in the fatty alcohol chain.
2.2. Human subjects and classification
Potential subjects were prescreened for eligibility prior to participation and included if they were at least 18 years of age. The exclusion criteria were: 1) ongoing active care for eye diseases except for MGD or dry eye; 2) current usage of ophthalmic medication(s); 3) concurrent enrolment in other clinical ophthalmic research; 4) contact lens wear; and 5) any systemic or ocular condition that could affect tear film measures.
All subjects attended a single visit at the UAB Clinical Eye Research Facility. After a detailed ocular and medical history, each subject completed the Ocular Surface Disease Index (OSDI) questionnaire [56] and underwent a battery of clinical tests for anterior eye health examination, including expressibility and quality of meibum, which has been described extensively elsewhere [4,18,47]. The clinical meibum grade score was calculated as the sum of grades from the central eight glands in the lower eyelid [57]. Based on the OSDI and clinical meibum grades scores, subjects were then stratified into four groups: three comparator groups (normal, MGD, asymptomatic MGD) and a fourth group (mixed). The comparator groups are similar to the TFOS International Workshop on Meibomian Gland Dysfunction recommendations as follows: Normal (OSDI <13 and meibum grade <10), Asymptomatic MGD (OSDI <13 and meibum grade ≥10), MGD (OSDI ≥13 and meibum grade ≥10) and Mixed (OSDI ≥13 and meibum grade <10) [58].
2.3. Optical coherence tomography (OCT) imaging
Prior to the clinical examination, the PCTF was imaged in vivo using a combined ultra-high-resolution OCT and thickness-dependent fringes (TDF) interferometer system. A detailed description of the optical design of this system and tear film imaging technique is available elsewhere [18,19]. Measures of PCTF thickness and thinning rates were obtained from the OCT images using methods described previously [18,19].
2.4. Sample collection and mass spectrometry
Following a rest period, tear and meibum samples were collected from the right eye of each subject using polytetrafluoroethylene and glass microcapillary tubes, respectively [59]. Details of the procedures, including sample collection, storage, extraction, and mass spectrometry analyses, have been described extensively in our previous reports [24,59–64]. In brief, samples were infused into the TripleTOF mass spectrometer (SCIEX 5600, Framingham, MA, USA) and a semi-targeted direct infusion electrospray MS and MS/MSALL was performed in the positive ion mode to determine the abundance of CEs (Fig. 2) and WEs (Fig. 3) in the tear and meibum samples [47]. Lipid intensities were identified with Analyst1.7 TF and LipidView1.3 (SCIEX, Framingham, MA, USA).
Fig. 2.
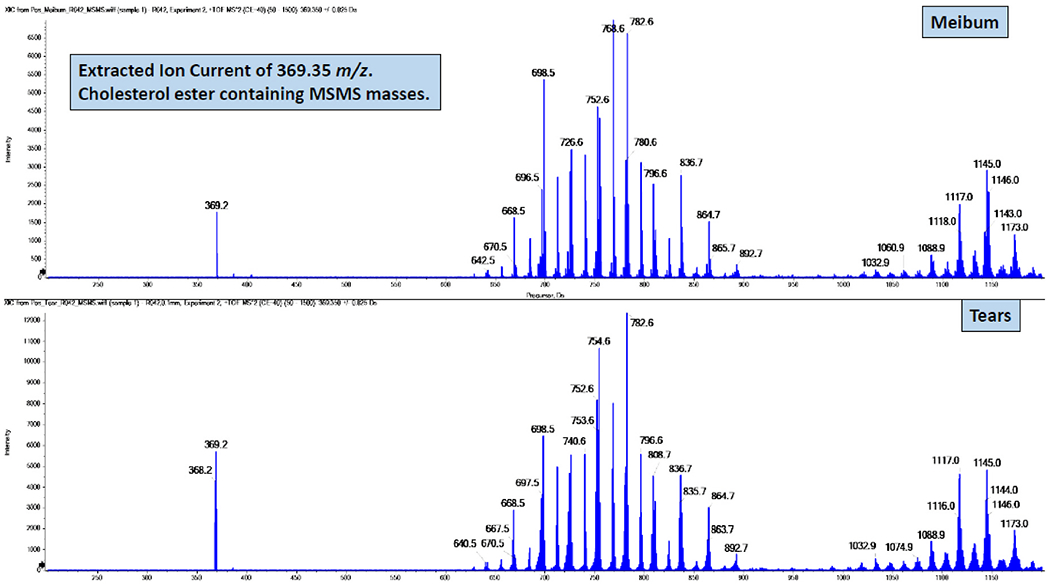
Illustration of masses that contain the cholesterol + NH4 ion of 369.352 m/z from MS/MS spectra of cholesteryl ester derived from a meibum (top) and tear (bottom) sample.
Fig. 3.
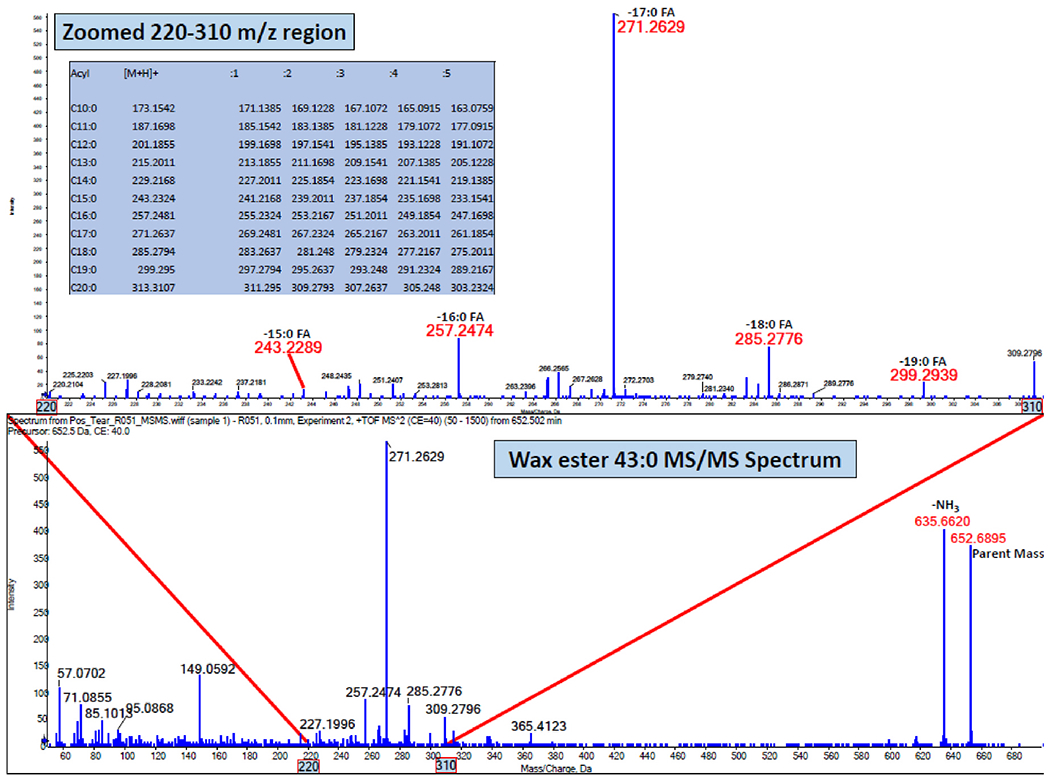
Illustration of a MS/MS of 652.69 m/z spectrum of wax ester 43:0 demonstrating the composition of varying acyl lengths.
2.5. Data analyses
As described previously [18,19], the PCTF thinning rate was calculated as the slope of a linear regression fit on a series of OCT thickness measures over time. Comparisons of these PCTF thinning rates across the four classification groups are available in another recent report [18]. Following lipid identification and MS data quantification, the peak intensities of CEs and WEs were normalized by the intensity of the internal standard (WE 28:1, m/z = 440.3). Lipid peak lists and internal standard-corrected intensities were then uploaded to MetaboAnalyst 5.0 (www.metaboanalyst.ca [65]). The intensity values of samples below the level of detection (“zeros”) were replaced with a small imputed value (one-fifth of the minimum peak intensity of a sample) and lipids not identified in at least 20% of samples in any of the four classification groups were excluded to avoid downstream issues in multivariate analyses. Data were transformed to approximate a Gaussian distribution by normalizing by the total ion current and then mean-centering and scaling (Pareto method). Lipid intensities were visualized with graphical illustrations and compared across the four groups using univariate (one-way ANOVA with a false discovery rate of 0.05 and Fisher LSD post-hoc tests) and multivariate unsupervised (Principal Component or PC Analysis) and supervised (Partial Least Square Discriminant Analysis or PLS-DA) methods. Spearman’s correlations (ρ) were used to evaluate the association between PCs (first and second) and PCTF thinning rates. Statistical analyses were performed in GraphPad Prism (v8.3.0, GraphPad software, San Diego, CA) and p-values less than 0.05 were considered statistically significant.
3. Results
Out of 222 subjects enrolled in the study, 195 fulfilled the clinical criteria for classification into one of the four groups. The majority of these subjects were female (62.6%) and of Black or African American (50.8%) and White or Caucasian (35.9%) ethnicity. The mean age of subjects was 39.3 ± 14.3 (range, 18–84) years. Demographics and clinical characteristics for this study cohort are described extensively elsewhere [4,18,47].
3.1. Descriptors of CEs and WEs
Although samples were collected from all 195 eligible subjects, CEs and WEs were identified in tears of 183 subjects and meibum of 179 subjects. Out of 183 tear samples, 19 samples were excluded from further analyses because the MS spectra showed unacceptable signal intensity loss. In total, 126 unique CEs and 86 unique WEs were identified from 164 tear and 179 meibum samples (Table 1). While all 86 WEs were detected in both tear and meibum samples, CE16:4 was detected only in tear samples.
Table 1.
Distribution of cholesteryl and wax esters in tears and meibum.
| Tears (n = 164) | Meibum (n = 179) | |
|---|---|---|
| Cholesteryl esters (CEs) | ||
| Total no. of CEs | 126 | 125 |
| No. of CEs in >50% subjects | 101 | 93 |
| Most frequent CEs | 16:0, 16:1; 1,18:1, 18:0, 18:1;1, 20:1, 20:0, 20:1; 1, 22:2, 22:1, 22:0, 22:1; 1, 24:2, 24:1, 24:0, 25:1, 24:1; 1, 24:0; 1, 26:1, 26:0, 26:1; 1, 28:1, 28:0, 28:1; 1, 30:1, 30:0, 31:0, 32:2, 32:1 | 20:0, 16:1; 1, 18:1, 18:1; 1, 20:2, 20:1, 20:1; 1, 22:1, 22:0, 22:1; 1, 24:1, 24:0, 24:1; 1, 24:1, 24:0; 1, 26:1, 28:1, 28:0, 28:1; 1, 30:1, 32:1 |
| Least frequent CEs | 20:0; 2, 16:4, 13:0; 2, 17:4, 2:0 | 20:0; 2, 13:0; 2, 2:0, 14:0; 1, 15:0; 2 |
| Most abundant CEs | 26:0, 24:0, 24:1; 1, 24:1, 20:0 | 24:0, 24:1; 1, 26:0, 24:1, 20:0 |
| Least abundant CEs | 12:0; 2, 16:4, 13:0; 2, 17:4, 2:0 | 12:0; 2, 13:0; 2, 2:0, 14:0; 1, 15:0; 2 |
| Wax esters (WEs) | ||
| Total WEs | 86 | 86 |
| No. of WEs in >50% subjects | 98 | 79 |
| Most frequent WEs | 16:1/24:0, 17:0/23:0, 15:0/26:0, 16:0/25:0, 17:0/24:0, 18:1/24:0, 16:0/26:0, 17:0/25:0, 17:0/26:1, 18:1/25:0, 17:0/26:0, 18:1/26:0, 17:0/27:0, 18:1/28:1, 18:1/30:1 | 17:0/24:0, 18:1/25:0, 17:0/26:0, 18:1/26:0, 15:0/26:0, 16:0/25:0, 18:1/24:1, 16:1/26:0, 18:1/24:0, 16:0/26:0, 17:0/25:0, 18:1/26:1, 17:0/27:0, 18:0/26:0, 18:1/27:0 |
| Least frequent WEs | 19:0/23:0, 18:2/32:0, 17:1/21:0, 16:2/24:0, 20:1/20:0 | 20:1/20:0, 19:0/23:0, 17:1/21:0, 19:0/20:0, 18:2/32:0 |
| Most abundant WEs | 18:1/24:0, 17:0/26:0, 18:1/26:0, 17:0/25:0, 17:0/24:0 | 18:1/26:0, 18:1/24:0, 17:0/26:0, 18:1/25:0, 17:0/24:0 |
| Least abundant WEs | 18:2/32:0, 17:1/21:0, 19:0/20:0, 20:1/20:0, 16:2/24:0 | 20:1/20:0, 19:0/23:0, 19:0/20:0, 17:1/21:0, 16:2/24:0 |
Note: Abundance is based on the sum of intensities corrected for the internal standard.
Most tear and meibum samples showed a high frequency of lipids, with at least 50 meibum samples containing 107 CEs and 84 WEs and at least 50 tear samples containing 109 CEs and 86 WEs. However, a greater number of tear samples had a relatively higher frequency of CEs and WEs than meibum samples (Fig. 4). For example, 101 and 93 CEs were present in more than half of the tear and meibum samples, respectively. Similarly, 98 and 79 WEs were detected in greater than 50% of tear and meibum samples, respectively. Despite a relatively large frequency of CEs and WEs in tear samples, meibum-derived CEs and Wes had higher mean intensities than tear film-derived CEs (Fig. 5) and WEs (Fig. 6). When the total lipid amount was compared between tear and meibum samples that had both lipids, CEs and WEs were relatively more abundant in meibum than in tears (CE: p < 0.001, WE: p < 0.001, Fig. 7).
Fig. 4.
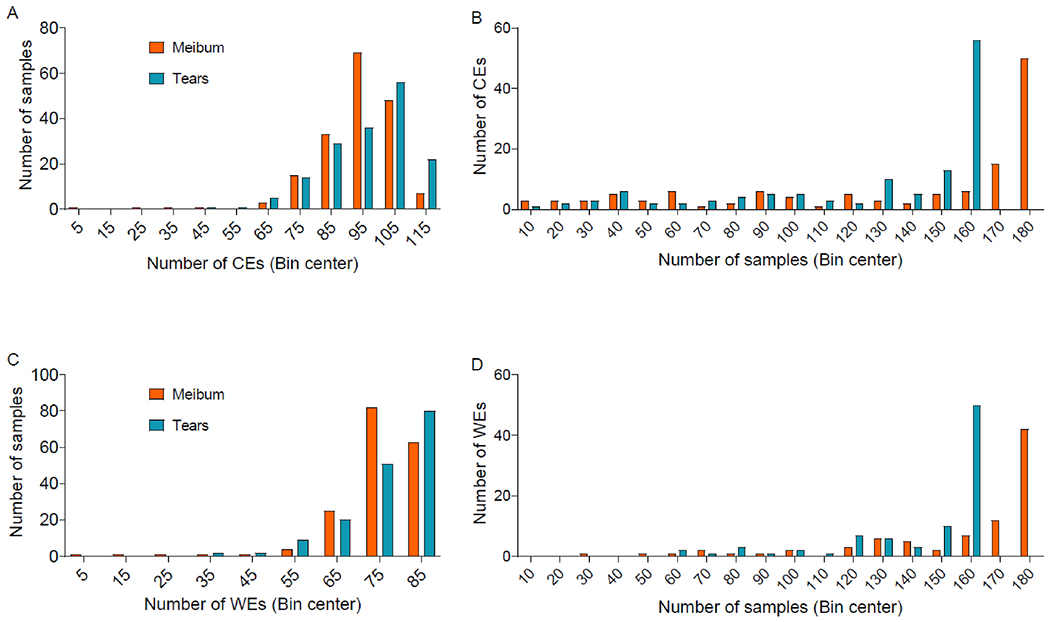
Distributions of A) the number of cholesteryl esters (CEs) in tear and meibum samples, B) the number of tear and meibum samples containing CEs, C) the number of wax esters (WEs) in tear and meibum samples, and D) the number of tear and meibum samples containing WEs. Although most samples had a relatively large proportion of lipids (Fig. 4B and D), the total number of CEs and WEs detected was higher in a relatively large proportion of tear samples than meibum samples (Fig. 4A and C).
Fig. 5.
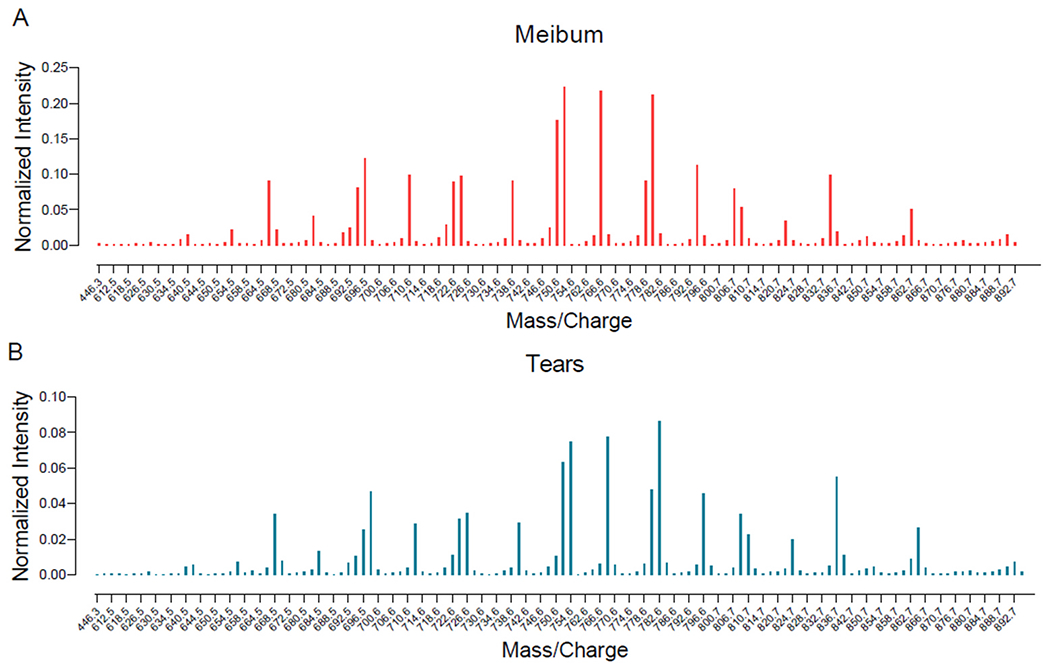
Mean intensity profile of mass spectrometry peaks of cholesteryl esters (CEs) identified in meibum and tears samples. The intensity of each peak is normalized to the internal standard. Although the intensity profiles of tear and meibum CEs were similar, meibum-derived CEs had approximately three times higher intensity than tear film-derived CEs (see y-axis scales in A and B).
Fig. 6.
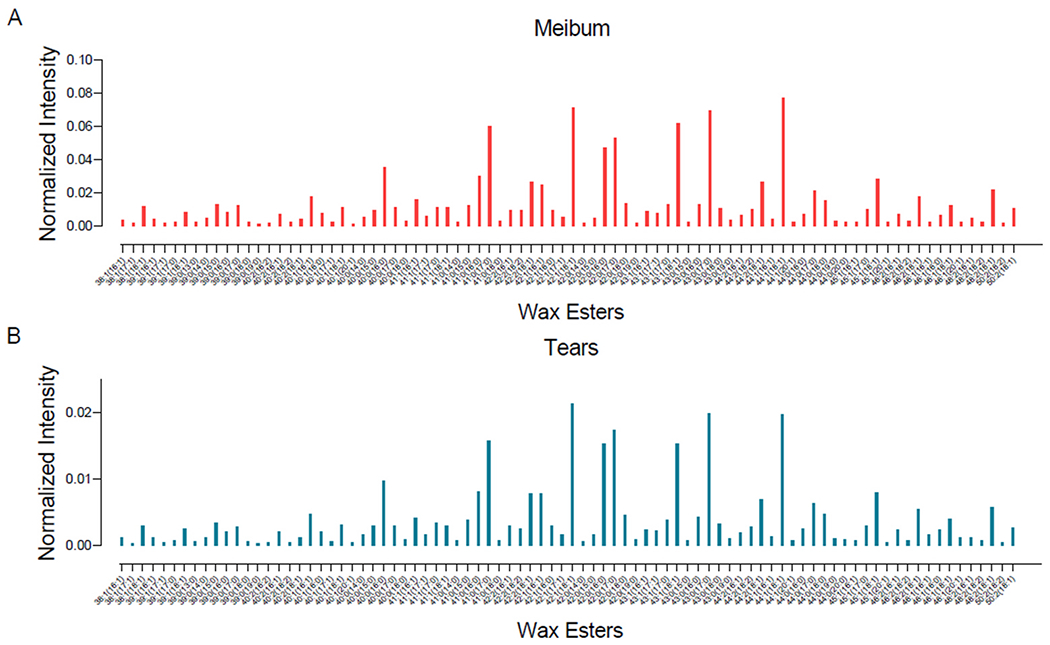
Mean intensity profile of mass spectrometry peaks of wax esters (WEs) identified in meibum and tears samples. The intensity of each peak is normalized to the internal standard. Although the intensity profiles of tear and meibum WEs were similar, meibum-derived WEs had approximately five times higher intensity than tear film-derived WEs (see y-axis scales in A and B).
Fig. 7.
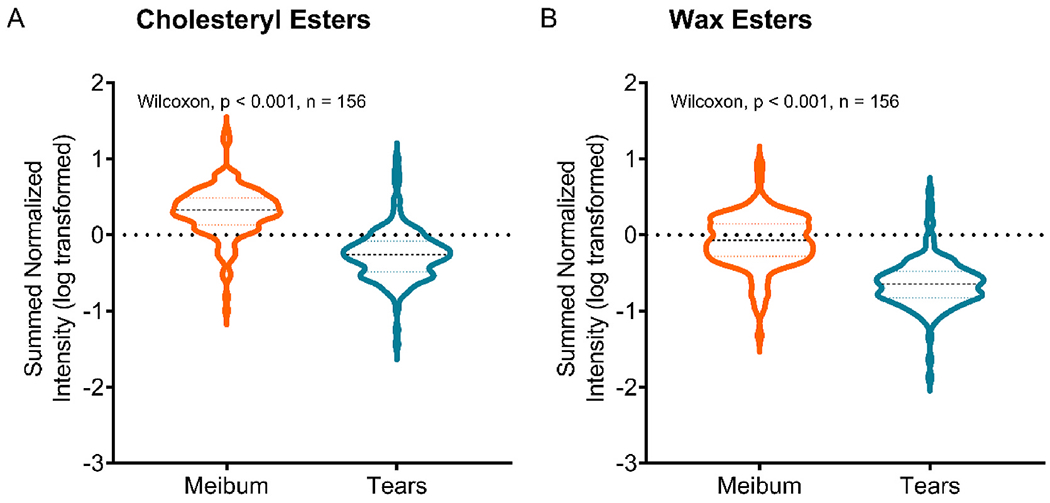
Comparison of abundances of A) CEs and B) WEs in tears and meibum samples (n = 156). Abundance is calculated as the sum of all individual lipid intensities corrected by the internal standard. The y-axis shows log-transformed data. Comparison of data between tear and meibum samples with Wilcoxon matched-pairs signed-rank test showed significantly reduced abundances of both CEs and WEs in tears than in meibum.
3.2. Comparison of CEs and WEs among the four classification groups
Lipids were filtered using a 20% cut-off criterion: CEs and WEs absent in at least 20% of samples in any of the four groups were considered to have relatively little contribution to subsequent analytical models and therefore excluded. After applying this filtering criterion, 120 CEs and 86 WEs were present in tears, and 116 CEs and 85 WEs were present in meibum. The abundances of these lipids were then compared across the four classification groups using univariate and multivariate analysis.
3.2.1. Cholesteryl esters (CEs)
Initial exploratory univariate ANOVA analyses identified no CEs in tears or meibum that were significant discriminators of the four classification groups. In the unsupervised PC analysis, the first two PCs explained approximately 24% of the variation in the data for both tear-derived (PC1, 12.5%; PC2, 11.1%, Fig. 8A) and meibum-derived CEs (PC1, 12.5%; PC2, 11.4%, Fig. 9A). When PC scores (weighted averages of the CEs) of tear samples and loadings (weighting profiles) were plotted together, samples aggregated into a small region forming a herd and most CEs had relatively short vector length (Fig. 8B). In the supervised PLS-DA, the 3D score plot showed a relatively large region of overlap among the samples with no distinct cluster (Fig. 8C), confirming the outcome of PC analysis that the CEs contributed little to the separation across the four groups. Although meibum samples showed a relatively larger region of overlap compared with the tear samples, there was little separation across the four groups (Fig. 9B and C).
Fig. 8.
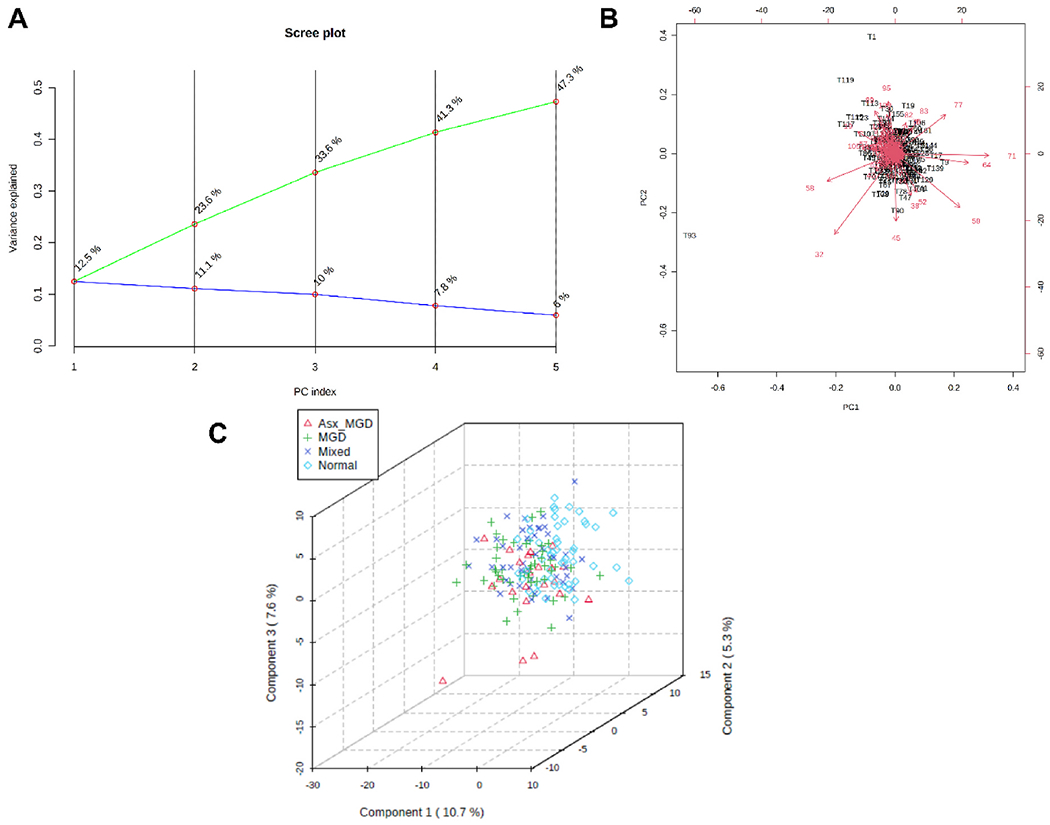
Principal component (PC) analysis and partial least squares discriminant analysis (PLS-DA) of tear film-derived CEs. A) PC scree plot showing the proportion of variance (blue line) and cumulative proportion of variance of the first five components. B) PC biplot showing sample scores (black labels) and vector trajectories of feature loadings (red labels). C) Three-dimensional plot of PLS-DA scores for the first three components in the four classification groups. The numbers inside parentheses show the proportion of variance explained by the components.
Fig. 9.
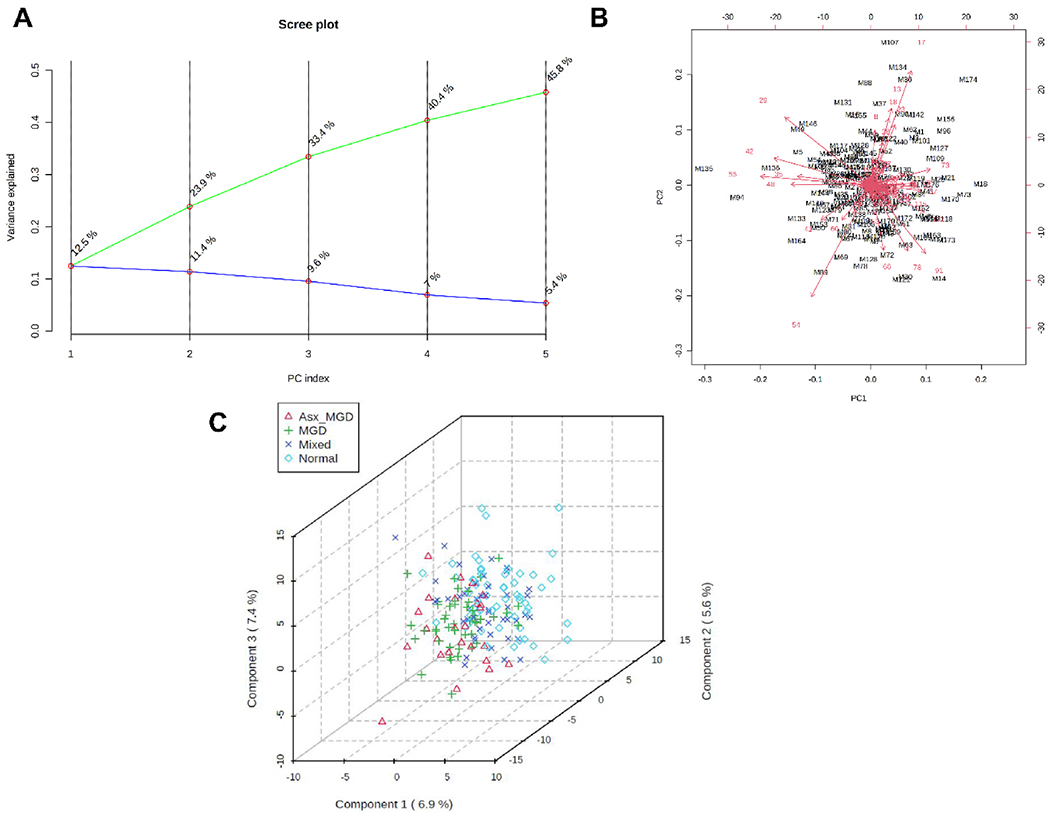
Principal component (PC) analysis and partial least squares discriminant analysis (PLS-DA) of meibum-derived CEs. A) PC scree plot showing the proportion of variance (blue line) and cumulative proportion of variance of the first five components (green line). B) PC biplot showing sample scores (black labels) and vector trajectories of feature loadings (red labels). C) Three-dimensional plot of PLS-DA scores for the first three components in the four classification groups. The numbers inside parentheses show the proportion of variance explained by the components.
3.2.2. Wax esters (WEs)
Initial exploratory univariate ANOVA analyses of meibum data identified no significant WEs predictive of classification group. However, three WEs in tear samples were identified as potentially significant features in discriminating the four classification groups (WE 46:1 (18:1/28:0), WE 39:0 (15:0/24:0) and WE 40:0 (17:0/23:0)). Among these lipids, the former had decreased abundance, while the latter two had increased abundance in the MGD group compared with the other three groups (Fig. 10).
Fig. 10.
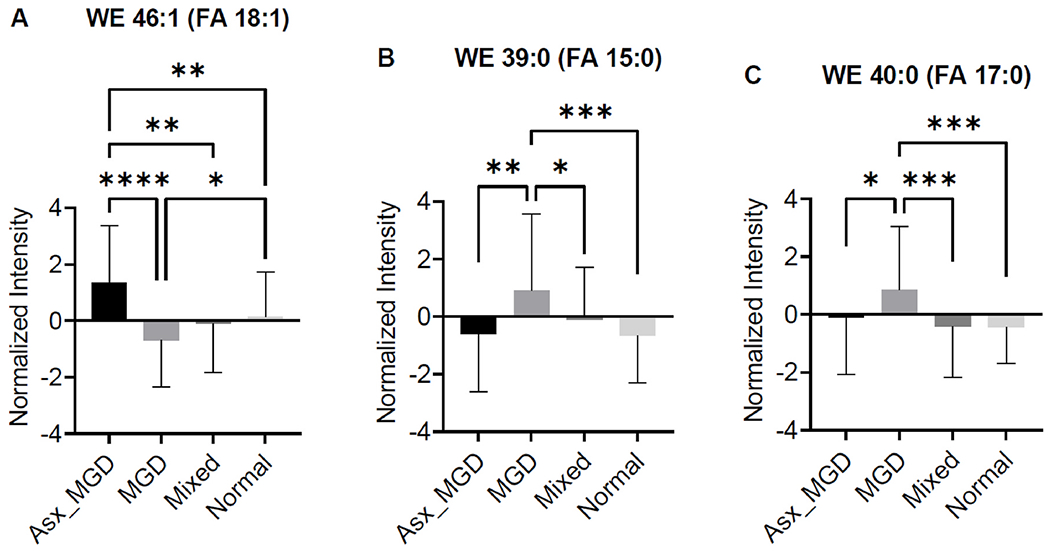
Comparison of abundance of three WEs identified as potentially significant in discriminating the four classification groups. A) WE 46:1 (18:1/28:0), B) WE 39:0 (15:0/24:0) and C) WE 40:0 (17:0/23:0). p < 0.05*, p < 0.01**, p < 0.001***, p < 0.0001****.
Contrary to the univariate analyses, both unsupervised and supervised multivariate analyses of WEs showed little evidence of separation of tear and meibum samples across the four classification groups. The first two PCs explained approximately 24% and 27% of the variation in the data for tear-derived (PC1, 13.2%; PC2, 10.4%, Fig. 11A) and meibum-derived WEs (PC1, 15.8%; PC2, 10.8%, Fig. 12A). As shown in the biplot in Fig. 11B, tear samples projected into a small region forming a herd and most WEs had relatively small vector lengths. The PLS-DA analysis also confirmed little separation among the groups. The 3D score plot showed a high degree of overlap among the samples with no distinct clusters (Fig. 11C). A similar pattern of results was observed for the meibum-derived WE samples, which showed considerable overlap in both PC biplot (Fig. 12B) and PLS-DA 3D score plot (Fig. 12C).
Fig. 11.
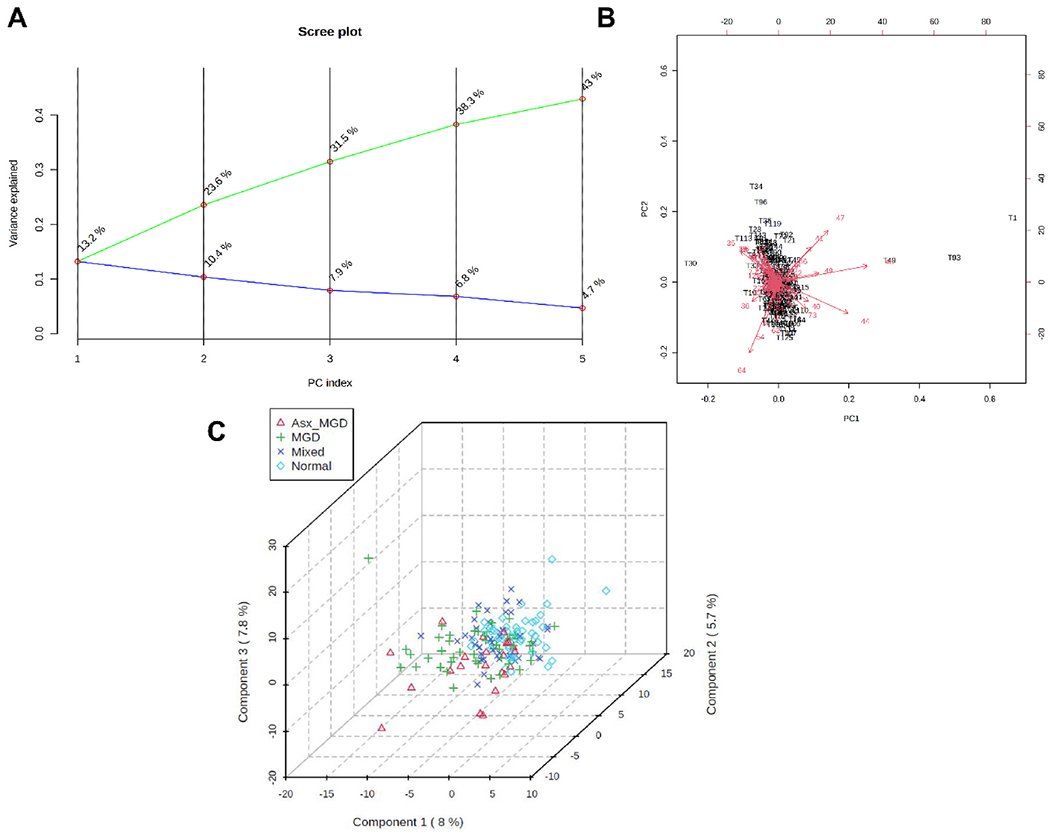
Principal component (PC) analysis and partial least squares discriminant analysis (PLS-DA) of tear film-derived WEs. A) PC scree plot showing the proportion of variance (blue line) and cumulative proportion of variance of the first five components (green line). B) PC biplot showing sample scores (black labels) and vector trajectories of feature loadings (red labels). C) Three-dimensional plot of PLS-DA scores for the first three components in the four classification groups. The numbers inside parentheses show the proportion of variance explained by the components.
Fig. 12.
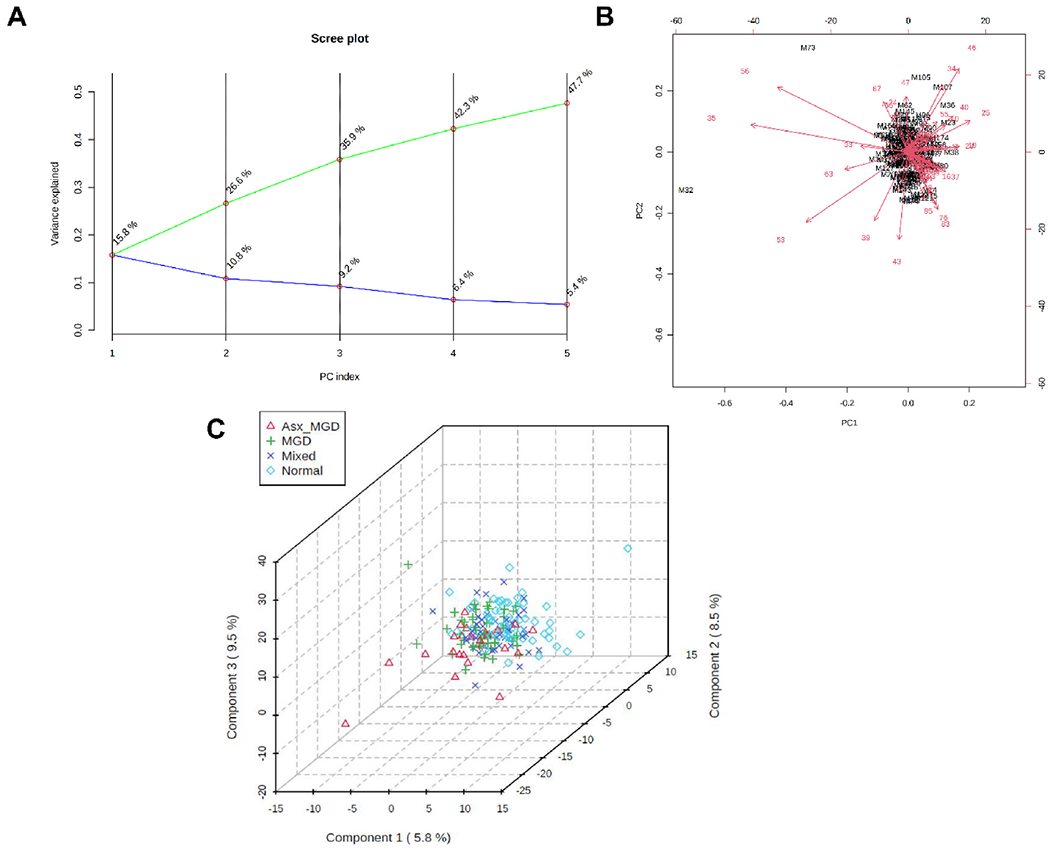
Principal component (PC) analysis and partial least squares discriminant analysis (PLS-DA) of meibum-derived WEs. A) PC scree plot showing the proportion of variance (blue line) and cumulative proportion of variance of the first five components (green line). B) PC biplot showing sample scores (black labels) and vector trajectories of feature loadings (red labels). C) Three-dimensional plot of PLS-DA scores for the first three components in the four classification groups. The numbers inside parentheses show the proportion of variance explained by the components.
3.3. Association of CEs and WEs with tear film thinning
To evaluate the association of CEs and WEs with PCTF thinning, Spearman correlation analyses were performed between the PC scores and the rate of thinning of the PCTF. No significant association was found between either the first or the second PC score and PCTF thinning rate for both CEs and WEs in tear (n = 160) and meibum samples (n = 174) (all p > 0.05) (Fig. 13).
Fig. 13.
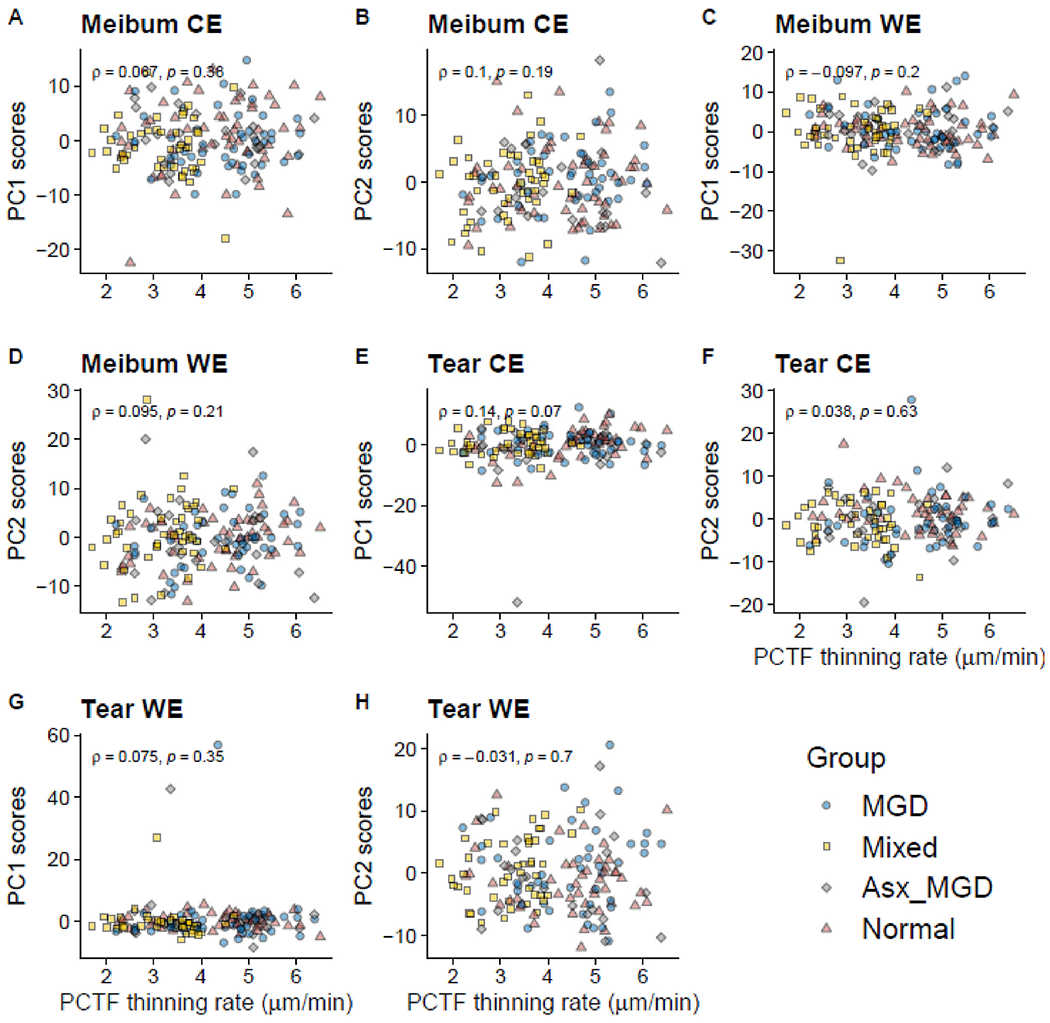
Association between the first or second PC scores and the rate of thinning of the precorneal tear film. There was no significant association between either the first or second PC scores of tear and meibum-derived CEs and WEs with the PCTF thinning rate.
4. Discussion
To determine the role of the major non-polar lipids in TFLL structure and function and PCTF stability, this study identified CEs and WEs in tears and meibum of subjects with and without MGD and quantified their frequencies and abundances, in addition to investigating the association between these lipids with PCTF thinning, which is due primarily to tear evaporation [66]. The study found that 1) CEs and WEs were independent of meibomian gland health and dysfunction, and 2) the amount of CEs and WEs had no association with the rate of PCTF thinning (evaporation).
Consistent with several previous studies [23,24,26,43,60,62,67,68], this study found a large number of CEs and WEs in human tears and meibum. In addition, most samples had a high proportion of total CEs and WEs identified (Fig. 4). Despite the presence of a high frequency and quantity of CEs (~125) and WEs (~86) in meibum and tears, meibum-derived CEs and WEs were present in significantly greater quantities relative to tear film-derived CEs and WEs (Figs. 5 and 6). Among the CEs detected, the most abundant CEs in tears and meibum were those based on C20:0, C24:1, and C26:0-fatty acids. The most abundant WEs in tears and meibum were C17:0- and C18:1-fatty esters of saturated C24:0, C25:0, and C26:0-fatty alcohols. These findings are in agreement with previous mass spectrometry studies of non-polar lipids in human meibum and tears [23,24,26,43,60,67,69].
The TFLL, formed by the lipid-rich meibomian gland secretions (meibum), prevents excess evaporation of tears from the ocular surface and contributes to PCTF stability. This property of the TFLL could be related to its physical characteristics, such as elasticity and the rate of spreading or recovery in between blinks. Recent studies, however, indicate that the TFLL maintains PCTF stability through the biochemical composition of its lipid constituents [9,70,71]. Changes in the biochemical composition of tear film lipids presumably affect PCTF stability either directly or by mutually complementing the intrinsic physical properties essential for the spreading and recovery of the TFLL, such as evaporation, elasticity, or meniscus induced thinning. However, results from this study suggest that the CEs and WEs are unlikely to be involved in this process, as both CEs and WEs were neither associated with MGD nor related to the rate of PCTF thinning or evaporation. These results are consistent with the findings from another study investigating the physical properties of artificial tear film lipids mixtures containing WEs and their effects on the rate of evaporation [72]. Although these mixtures showed duplex lipid organization resembling human TFLL with an inner layer of amphiphilic polar lipids separating the outer layer of hydrophobic non-polar lipids from the underlying aqueous phase, all mixtures (irrespective of the type of lipids combined with WEs) showed similar biophysical properties and none reduced the rate of evaporation [72]. Our findings are, however, in contradiction with an earlier study by Lam et al. which showed reduction of specific wax esters (those with low molecular masses and those containing saturated factty acyl moieties) in DED and their associations with both symptoms and signs of the disease [52]. The reasons for the discrepancy in findings could be related to inherent biological variability across study samples or differences in sample size (n = 93 in Lam et al.’s study vs n = 164–179 in this study) and analytical approaches (liquid chromatography in Lam et al. vs direct infusion in this study). However, wax esters in a complex lipid organization such as that of the PCTF appear unlikely to be involved in the mechanism underlying PCTF thinning or evaporation, as in-vitro studies using representative WEs have showed reduced evaporation of water when in a solid monolayer at melting temperature, but much less so when multiple lipids are present [53,73]. In other in-vitro studies, degrees of WE unsaturation rather than quantities of lipid present, in addition the presence of a surfactant layer, were critical to forming a multilayered bulk lipid film [74,75]. Yet, another ex-vivo study showed that human meibum did not inhibit evaporation measured gravimetrically [76].
It is possible that the anti-evaporative resistance of the TFLL is a biophysical property specific to amphiphilic lipids, such as phospholipids [31] and OAHFAs [4], although results have been equivocal and somewhat dependent on in-vitro vs in-vivo approaches [31,77,78]. These polar lipids have a perpendicular orientation in the PCTF with their hydrophobic tails in the non-polar lipid region and hydrophilic heads in the mucoaqueous phase [6]. This organization facilitates stabilization of the non-polar lipids, which are water-insoluble, thermodynamically unstable, and can easily collapse into oil-droplet configuration when exposed to hydrophilic aqueous tears [79]. In mice, deficiency of OAHFA-producing fatty acid ω-hydroxylase Cyp4f39 showed not only the reduction of OAHFAs and their derivatives but also the development of DED and MGD and accumulation of tears on the lower eyelid surface, indicating an increase in surface tension of tears [29]. Studies in humans have provided further evidence that polar lipids may be involved in the PCTF stabilization function of the TFLL. Our previous studies have shown that dysfunction of meibomian glands differentially regulates the abundance of OAHFAs and that several OAHFAs have an association with the rate of PCTF thinning. These results directly complement previous findings by others that show a negative correlation between several meibum-derived OAHFAs and severity of DED [43] and an increase in the amount of OAHFAs after treatment of MGD with eyelid warming [44]. Taken together, these findings suggest that the polarity and surfactant properties of the polar lipids are crucial for the stabilization of TFLL and maintenance of PCTF stability in health and disease.
The evidence from this study raises an important question: If CEs and WEs do not mediate alterations in the biochemical profile of TFLL leading to PCTF deficiencies, then what function do these non-polar lipids serve? One possibility is that although non-polar lipids directly contribute little to tear evaporation and PCTF stabilization, they may interact with the underlying polar lipids with or without the involvement of intercalated proteins in the mucoaqueous phase to accomplish these functions. In an in-vitro study, Paananen et al. found that, while the inclusion of polar lipid produced a stable multilamellar CE film, this film had similar effectiveness at retarding water evaporation than the polar lipid monolayer [80]. Kulovesi et al. showed that a stable TFLL depended upon the presence and location of non-polar lipids on top of polar lipids [81]. Decreasing the ratio of polar to non-polar lipids diminished TFLL stability leading to a reorganization from a two-layered structure to an oil-droplet-like structure [81]. Herok et al. showed that the anti-evaporation property of the TFLL was due not to lipids alone but possibly to an interaction between the lipid and aqueous constituents [32]. Georgiev et al. found that the loss of TF homeostasis and TF collapse occurred due to the depletion of C-terminal lacritin proteoforms that interacted with and stabilized meibomian gland secretions [33]. In mice, absence or reduction of CEs due to Soat1 ablation produced disturbances in lipid homeostasis and signs of MGD [49].
Another possibility is that the non-polar lipids confer anti-evaporative properties to the TFLL but only at relatively precise physiological or physiochemical conditions. In an in-vitro study, Paananen et al. showed that, although WEs retard evaporation, they do so only at a temperature close to their bulk melting temperature when they assume a solid monolayer configuration [53]. Another in-vitro study of Langmuir monolayers with varying amounts of cholesterol and cholesteryl stearate found that the molar ratio of the mixture and lipid-interactions were critical properties that governed the physical properties of the monolayers [51]. An alternative, but a likely, possibility is that the polar lipids contribute to PCTF stability primarily by reducing surface tension to enhance lipid layer spreading over the aqueous tears, while the non-polar lipids contribute to PCTF stability primarily by acting as a defense mechanism against microbes and organic matters (e.g., dust, pollen) [17].
In conclusion, this study used a semi-targeted electrospray ionization mass spectrometry method to obtain a comprehensive profile of CEs and WEs derived from meibum and tears in a large number of human subjects with and without MGD. The findings of this study provide evidence that non-polar lipids, namely CEs and WEs, may not be related to changes in TFLL structure and function and PCTF dynamics associated with MGD. Further investigations of the interactions between non-polar and polar lipids and the relationship between lipids and protein constituents of the PCTF may provide additional insights into the physiological mechanisms underlying PCTF stability in meibomian gland health and disease.
Acknowledgments
The authors acknowledge all individuals involved for their contribution in participant recruitment, data collection, and data management for this study in addition to the participants who provided their time to participate in the clinical visit.
Funding support
This work was funded by NIH/NEI R01EY026947, partially supported by NIH/NCATs UL1 TR003096. The mass spectrometer was purchased from funding by a NIH Shared Instrumentation Grant S10 RR027822 to SB.
Financial disclosures
Safal Khanal: None.
William Ngo: William Ngo is an employee of the Centre for Research & Education (CORE). Over the past three years, members of CORE have received funding from the following companies: Alcon, Allergan, Allied Innovations, BHVI, CooperVision, GL Chemtec, I-Med Pharma, Johnson & Johnson Vision, Lubris, Menicon, Nature’s Way, Novartis, Oté Pharma, PS Therapy, Santen, Shire, SightGlass, and Visioneering. He has received consulting fees from Alcon.
Kelly K. Nichols: In the past 12 months, Dr. Kelly K. Nichols has consulted for and received honorarium from: Bruder, Dompe, Kala, Novartis/Shire (Medical Exchange International), Osmotica, Oyster Point, Sight Sciences, Tear Film Innovations/Alcon/Acquiom, Thea, Tarsus, and TopiVert. Research funding has been received from: Allergan, Kala, and Tear Science, Also, Dr. Jason Nichols is the spouse of Dr. Kelly Nichols, extending her declarations to him.
Landon Wilson: None.
Stephen Barnes: None.
Jason J. Nichols: In 2019 and 2020, Dr. Jason J. Nichols has received honoraria from Paragon Vision Sciences and Coopervision. He has also received research funding from Alcon, Bruder, Johnson and Johnson Vision, and Mallinckrodt over the last 3 years. Also, Dr. Kelly Nichols is the spouse of Dr. Jason Nichols, extending her declarations to him.
References
- [1].King-Smith PE, Fink BA, Nichols JJ, Nichols KK, Hill RM. Interferometric imaging of the full thickness of the precorneal tear film. J Opt Soc Am Opt Image Sci Vis 2006;23:2097–104. [DOI] [PubMed] [Google Scholar]
- [2].Nichols JJ, Mitchell GL, King-Smith PE. Thinning rate of the precorneal and prelens tear films. Invest Ophthalmol Vis Sci 2005;46:2353–61. [DOI] [PubMed] [Google Scholar]
- [3].Craig JP, Nelson JD, Azar DT, Belmonte C, Bron AJ, Chauhan SK, et al. TFOS DEWS II report executive summary. Ocul Surf 2017;15:802–12. [DOI] [PubMed] [Google Scholar]
- [4].Khanal S, Bai Y, Ngo W, Nichols KK, Wilson L, Barnes S, et al. Human meibum and tear film derived (O-Acyl)-Omega-Hydroxy fatty acids as biomarkers of tear film dynamics in meibomian gland dysfunction and dry eye disease. Invest Ophthalmol Vis Sci 2021;62:13. [DOI] [PMC free article] [PubMed] [Google Scholar]
- [5].Bron AJ, de Paiva CS, Chauhan SK, Bonini S, Gabison EE, Jain S, et al. TFOS DEWS II pathophysiology report. Ocul Surf 2017;15:438–510. [DOI] [PubMed] [Google Scholar]
- [6].Green-Church KB, Butovich I, Willcox M, Borchman D, Paulsen F, Barabino S, et al. The international workshop on meibomian gland dysfunction: report of the subcommittee on tear film lipids and lipid-protein interactions in health and disease. Invest Ophthalmol Vis Sci 2011;52:1979–93. [DOI] [PMC free article] [PubMed] [Google Scholar]
- [7].Nichols JJ, Sinnott LT. Tear film, contact lens, and patient factors associated with corneal staining. Invest Ophthalmol Vis Sci 2011;52:1127–37. [DOI] [PMC free article] [PubMed] [Google Scholar]
- [8].Cwiklik L Tear film lipid layer: a molecular level view. Biochim Biophys Acta 2016;1858:2421–30. [DOI] [PubMed] [Google Scholar]
- [9].Mishima S, Maurice DM. The oily layer of the tear film and evaporation from the corneal surface. Exp Eye Res 1961;1:39–45. [DOI] [PubMed] [Google Scholar]
- [10].Georgiev GA, Eftimov P, Yokoi N. Structure-function relationship of tear film lipid layer: a contemporary perspective. Exp Eye Res 2017;163:17–28. [DOI] [PubMed] [Google Scholar]
- [11].Bron AJ, Tiffany JM. The contribution of meibomian disease to dry eye. Ocul Surf 2004;2:149–65. [DOI] [PubMed] [Google Scholar]
- [12].Schaumberg DA, Nichols JJ, Papas EB, Tong L, Uchino M, Nichols KK. The international workshop on meibomian gland dysfunction: report of the subcommittee on the epidemiology of, and associated risk factors for, MGD. Invest Ophthalmol Vis Sci 2011;52:1994–2005. [DOI] [PMC free article] [PubMed] [Google Scholar]
- [13].Lemp MA, Nichols KK. Blepharitis in the United States 2009: a survey-based perspective on prevalence and treatment. Ocul Surf 2009;7:S1–14. [DOI] [PubMed] [Google Scholar]
- [14].Butovich IA. Tear film lipids. Exp Eye Res 2013;117:4–27. [DOI] [PMC free article] [PubMed] [Google Scholar]
- [15].Butovich IA, McMahon A, Wojtowicz JC, Bhat N, Wilkerson A. Effects of sex (or lack thereof) on meibogenesis in mice (Mus muscuius): comparative evaluation of lipidomes and transcriptomes of male and female tarsal plates. Ocul Surf 2019;17:793–808. [DOI] [PMC free article] [PubMed] [Google Scholar]
- [16].McCulley JP, Shine WE. The lipid layer of tears: dependent on meibomian gland function. Exp Eye Res 2004;78:361–5. [DOI] [PubMed] [Google Scholar]
- [17].Nichols KK, Foulks GN, Bron AJ, Glasgow BJ, Dogru M, Tsubota K, et al. The international workshop on meibomian gland dysfunction: executive summary. Invest Ophthalmol Vis Sci 2011;52:1922–9. [DOI] [PMC free article] [PubMed] [Google Scholar]
- [18].Bai Y, Ngo W, Khanal S, Nichols KK, Nichols JJ. Human precorneal tear film and lipid layer dynamics in meibomian gland dysfunction. Ocul Surf 2021;21:250–6. [DOI] [PMC free article] [PubMed] [Google Scholar]
- [19].Bai Y, Ngo W, Gu B, Zhang Y, Nichols JJ. An imaging system integrating optical coherence tomography and interferometry for in vivo measurement of the thickness and dynamics of the tear film. Biomed Eng Online 2018;17. [DOI] [PMC free article] [PubMed] [Google Scholar]
- [20].Bu J, Wu Y, Cai X, Jiang N, Jeyalatha MV, Yu J, et al. Hyperlipidemia induces meibomian gland dysfunction. Ocul Surf 2019;17:777–86. [DOI] [PubMed] [Google Scholar]
- [21].Borchman D, Ramasubramanian A. Human meibum chain branching variability with age, gender and meibomian gland dysfunction. Ocul Surf 2019;17:327–35. [DOI] [PMC free article] [PubMed] [Google Scholar]
- [22].Wizert A, Iskander DR, Cwiklik L. Organization of lipids in the tear film: a molecular-level view. PLoS One 2014;9.e92461–e. [DOI] [PMC free article] [PubMed] [Google Scholar]
- [23].Brown SHJ, Kunnen CME, Duchoslav E, Dolla NK, Kelso MJ, Papas EB, et al. A comparison of patient matched meibum and tear lipidomes. Invest Ophthalmol Vis Sci 2013;54:7417–23. [DOI] [PubMed] [Google Scholar]
- [24].Chen J, Green KB, Nichols KK Quantitative profiling of major neutral lipid classes in human meibum by direct infusion electrospray ionization mass spectrometry. Invest Ophthalmol Vis Sci 2013;54:5730–53. [DOI] [PMC free article] [PubMed] [Google Scholar]
- [25].Lam SM, Tong L, Duan X, Petznick A, Wenk MR, Shui G. Extensive characterization of human tear fluid collected using different techniques unravels the presence of novel lipid amphiphiles. J Lipid Res 2014;55:289–98. [DOI] [PMC free article] [PubMed] [Google Scholar]
- [26].Butovich IA, Arciniega JC, Lu H, Molai M. Evaluation and quantitation of intact wax esters of human meibum by gas-liquid chromatography-ion trap mass spectrometry. Invest Ophthalmol Vis Sci 2012;53:3766–81. [DOI] [PMC free article] [PubMed] [Google Scholar]
- [27].Craig JP, Tomlinson A. Importance of the lipid layer in human tear film stability and evaporation. Optom Vis Sci 1997;74:8–13. [DOI] [PubMed] [Google Scholar]
- [28].Paananen RO, Javanainen M, Holopainen JM, Vattulainen I. Crystalline wax esters regulate the evaporation resistance of tear film lipid layers associated with dry eye syndrome. J Phys Chem Lett 2019;10:3893–8. [DOI] [PMC free article] [PubMed] [Google Scholar]
- [29].Miyamoto M, Sassa T, Sawai M, Kihara A, Radhakrishnan A. Lipid polarity gradient formed by ω- hydroxy lipids in tear film prevents dry eye disease. eLife 2020;9. [DOI] [PMC free article] [PubMed] [Google Scholar]
- [30].Bland HC, Moilanen JA, Ekholm FS, Paananen RO. Investigating the role of specific tear film lipids connected to dry eye syndrome: a study on O-Acyl-ω-hydroxy fatty acids and diesters. Langmuir 2019;35:3545–52. [DOI] [PubMed] [Google Scholar]
- [31].Rantamaki AH, Holopainen JM. The effect of phospholipids on tear film lipid layer surface activity. Invest Ophthalmol Vis Sci 2017;58:149–54. [DOI] [PubMed] [Google Scholar]
- [32].Herok GH, Mudgil P, Millar TJ. The effect of Meibomian lipids and tear proteins on evaporation rate under controlled in vitro conditions. Curr Eye Res 2009;34:589–97. [DOI] [PubMed] [Google Scholar]
- [33].Georgiev GA, Sharifian Gh M, Romano J, Dias Teixeira KL, Struble C, Ryan DS, et al. Lacritin proteoforms prevent tear film collapse and maintain epithelial homeostasis. J Biol Chem 2021,296:100070. [DOI] [PMC free article] [PubMed] [Google Scholar]
- [34].King-Smith PE, Hinel EA, Nichols JJ. Application of a novel interferometric method to investigate the relation between lipid layer thickness and tear film thinning. Invest Ophthalmol Vis Sci 2010;51:2418–23. [DOI] [PMC free article] [PubMed] [Google Scholar]
- [35].Iwata S, Lemp MA, Holly FJ, Dohlman CH. Evaporation rate of water from the precorneal tear film and cornea in the rabbit. Invest Ophthalmol 1969;8:613–9. [PubMed] [Google Scholar]
- [36].Yokoi N, Takehisa Y, Kinoshita S. Correlation of tear lipid layer interference patterns with the diagnosis and severity of dry eye. Am J Ophthalmol 1996;122:818–24. [DOI] [PubMed] [Google Scholar]
- [37].Tsubota K, Yamada M. Tear evaporation from the ocular surface. Invest Ophthalmol Vis Sci 1992;33:2942–50. [PubMed] [Google Scholar]
- [38].Rolando M, Refojo MF, Kenyon KR. Increased tear evaporation in eyes with keratoconjunctivitis sicca. Arch Ophthalmol 1983;101:557–8. [DOI] [PubMed] [Google Scholar]
- [39].Fenner BJ, Tong L. More to stable tears than thickness of the tear film lipid layer. Invest Ophthalmol Vis Sci 2015;56:1601. [DOI] [PubMed] [Google Scholar]
- [40].King-Smith PE, Braun RJ. Author response: more to stable tears than thickness of the lipid layer. Invest Ophthalmol Vis Sci 2015;56:1602. [DOI] [PubMed] [Google Scholar]
- [41].Butovich IA, Wilkerson A, Bhat N, McMahon A, Yuksel S. On the pivotal role of Elovl3/ELOVL3 in meibogenesis and ocular physiology of mice. Faseb J 2019;33:10034–48. [DOI] [PMC free article] [PubMed] [Google Scholar]
- [42].Sassa T, Tadaki M, Kiyonari H, Kihara A. Very long-chain tear film lipids produced by fatty acid elongase ELOVL1 prevent dry eye disease in mice. Faseb J 2018;32:2966–78. [DOI] [PubMed] [Google Scholar]
- [43].Lam SM, Tong L, Yong SS, Li B, Chaurasia SS, Shui G, et al. Meibum lipid composition in Asians with dry eye disease. PLoS One 2011;6:e24339. [DOI] [PMC free article] [PubMed] [Google Scholar]
- [44].Lam SM, Tong L, Duan X, Acharya UR, Tan JH, Petznick A, et al. Longitudinal changes in tear fluid lipidome brought about by eyelid-warming treatment in a cohort of meibomian gland dysfunction. J Lipid Res 2014;55:1959–69. [DOI] [PMC free article] [PubMed] [Google Scholar]
- [45].Borchman D, Ramasubramanian A, Foulks GN. Human meibum cholesteryl and wax ester variability with age, sex, and meibomian gland dysfunction. Invest Ophthalmol Vis Sci 2019;60:2286–93. [DOI] [PMC free article] [PubMed] [Google Scholar]
- [46].Walter SD, Gronert K, McClellan AL, Levitt RC, Sarantopoulos KD, Galor A. ω-3 tear film lipids correlate with clinical measures of dry eye. Invest Ophthalmol Vis Sci 2016;57:2472–8. [DOI] [PMC free article] [PubMed] [Google Scholar]
- [47].Khanal S, Ngo W, Nichols KK, Wilson L, Barnes S, Nichols JJ. Human meibum and tear film derived (O-acyl)-omega-hydroxy fatty acids in meibomian gland dysfunction. Ocul Surf 2021;21:118–28. [DOI] [PMC free article] [PubMed] [Google Scholar]
- [48].Suzuki T, Kitazawa K, Cho Y, Yoshida M, Okumura T, Sato A, et al. Alteration in meibum lipid composition and subjective symptoms due to aging and meibomian gland dysfunction. Ocul Surf 2021. In press. [DOI] [PubMed] [Google Scholar]
- [49].Butovich IA, Wilkerson A, Yuksel S. Depletion of cholesteryl esters causes meibomian gland dysfunction-like symptoms in a soatl-Null Mouse model. Int J Mol Sci 2021;22:1583. [DOI] [PMC free article] [PubMed] [Google Scholar]
- [50].Hetman ZA, Borchman D. Concentration dependent cholesteryl-ester and wax-ester structural relationships and meibomian gland dysfunction. Biochem Biophys Rep 2020;21:100732. [DOI] [PMC free article] [PubMed] [Google Scholar]
- [51].Rubio RG, Guzman E, Ortega F, Liggieri L. Monolayers of cholesterol and cholesteryl stearate at the water/Vapor interface: a physico-chemical study of components of the meibum layer. Colloids and Interfaces 2021;5:30. [Google Scholar]
- [52].Lam SM, Tong L, Reux B, Duan X, Petznick A, Yong SS, et al. Lipidomic analysis of human tear fluid reveals structure-specific lipid alterations in dry eye syndrome. J Lipid Res 2014;55:299–306. [DOI] [PMC free article] [PubMed] [Google Scholar]
- [53].Paananen RO, Rantamaki AH, Holopainen JM. Antievaporative mechanism of wax esters: implications for the function of tear fluid. Langmuir 2014;30:5897–902. [DOI] [PubMed] [Google Scholar]
- [54].Liebisch G, Vizcaino JA, Kofeler H, Trotzmiiller M, Griffiths WJ, Schmitz G, et al. Shorthand notation for lipid structures derived from mass spectrometry. J Lipid Res 2013;54:1523–30. [DOI] [PMC free article] [PubMed] [Google Scholar]
- [55].Marshall DL, Saville JT, Maccarone AT, Ailuri R, Kelso MJ, Mitchell TW, et al. Determination of ester position in isomeric (O-acyl)-hydroxy fatty acids by ion trap mass spectrometry. Rapid Commun Mass Spectrom 2016;30:2351–9. [DOI] [PubMed] [Google Scholar]
- [56].Schiffman RM, Christianson MD, Jacobsen G, Hirsch JD, Reis BL. Reliability and validity of the ocular surface disease index. Arch Ophthalmol 2000;118:615–21. [DOI] [PubMed] [Google Scholar]
- [57].Bron AJ, Benjamin L, Snibson GR. Meibomian gland disease. Classification and grading of lid changes. Eye 1991;5:395–411. [DOI] [PubMed] [Google Scholar]
- [58].Tomlinson A, Bron AJ, Korb DR, Amano S, Paugh JR, Ian Pearce E, et al. The international workshop on meibomian gland dysfunction: report of the diagnosis subcommittee. Invest Ophthalmol Vis Sci 2011;52:2006–49. [DOI] [PMC free article] [PubMed] [Google Scholar]
- [59].Ngo W, Chen J, Panthi S, Nichols KK, Nichols JJ. Comparison of collection methods for the measure of human meibum and tear film-derived lipids using mass spectrometry. Curr Eye Res 2018;43:1244–52. [DOI] [PMC free article] [PubMed] [Google Scholar]
- [60].Chen J, Green-Church KB, Nichols KK. Shotgun lipi domic analysis of human meibomian gland secretions with electrospray ionization tandem mass spectrometry. Invest Ophthalmol Vis Sci 2010;51:6220–31. [DOI] [PMC free article] [PubMed] [Google Scholar]
- [61].Chen J, Keirsey JK, Green KB, Nichols KK. Expression profiling of Nonpolar lipids in meibum from patients with dry eye: a pilot study. Invest Ophthalmol Vis Sci 2017;58:2266–74. [DOI] [PMC free article] [PubMed] [Google Scholar]
- [62].Chen J, Nichols KK. Comprehensive shotgun lipidomics of human meibomian gland secretions using MS/MSall with successive switching between acquisition polarity modes. J Lipid Res 2018;59:2223–36. [DOI] [PMC free article] [PubMed] [Google Scholar]
- [63].Chen J, Nichols KK, Wilson L, Barnes S, Nichols JJ. Untargeted lipidomic analysis of human tears: a new approach for quantification of O-aeyl-omega hydroxy fatty acids. Ocul Surf 2019;17:347–55. [DOI] [PMC free article] [PubMed] [Google Scholar]
- [64].Haworth KM, Nichols JJ, Thangavelu M, Sinnott LT, Nichols KK. Examination of human meibum collection and extraction techniques. Optom Vis Sci 2011;88:525–33. [DOI] [PMC free article] [PubMed] [Google Scholar]
- [65].Pang Z, Chong J, Zhou G, de Lima Morais DA, Chang L, Barrette M, et al. MetaboAnalyst 5.0: narrowing the gap between raw spectra and functional insights. Nucleic Acids Res 2021;49(W1):W388–96. [DOI] [PMC free article] [PubMed] [Google Scholar]
- [66].Kimball SH, King-Smith PE, Nichols JJ. Evidence for the major contribution of evaporation to tear film thinning between blinks. Invest Ophthalmol Vis Sci 2010; 51:6294–7. [DOI] [PMC free article] [PubMed] [Google Scholar]
- [67].Butovich IA. Fatty acid composition of cholesteryl esters of human meibomian gland secretions. Steroids 2010;75:726–33. [DOI] [PMC free article] [PubMed] [Google Scholar]
- [68].Ziemanski JF, Wilson L, Barnes S, Nichols KK. Saturation of cholesteryl esters produced by human meibomian gland epithelial cells after treatment with rosiglitazone. Ocul Surf 2021;20:39–47. [DOI] [PMC free article] [PubMed] [Google Scholar]
- [69].Butovich IA, Wojtowicz JC, Molai M. Human tear film and meibum. Very long chain wax esters and (O-acyl)-omega-hydroxy fatty acids of meibum. J Lipid Res 2009;50:2471–85. [DOI] [PMC free article] [PubMed] [Google Scholar]
- [70].Arciniega JC, Wojtowicz JC, Mohamed EM, McCulley JP. Changes in the evaporation rate of tear film after digital expression of meibomian glands in patients with and without dry eye. Cornea 2011;30:843–7. [DOI] [PubMed] [Google Scholar]
- [71].Borchman D, Foulks GN, Yappert MC, Mathews J, Leake K, Bell J. Factors affecting evaporation rates of tear film components measured in vitro. Eye Contact Lens 2009;35:32–7. [DOI] [PubMed] [Google Scholar]
- [72].Kulovesi P, Rantamaki AH, Holopainen JM. Surface properties of artificial tear film lipid layers: effects of wax esters. Invest Ophthalmol Vis Sci 2014;55:4448–54. [DOI] [PubMed] [Google Scholar]
- [73].Rantamaki AH, Wiedmer SK, Holopainen JM. Melting points-the key to the anti-evaporative effect of the tear film wax esters. Invest Ophthalmol Vis Sci 2013;54:5211–7. [DOI] [PubMed] [Google Scholar]
- [74].Borchman D, Foulks GN, Yappert MC, Bell J, Wells E, Neravetla S, et al. Human meibum lipid conformation and thermodynamic changes with meibomian-gland dysfunction. Invest Ophthalmol Vis Sci 2011;52:3805–17. [DOI] [PMC free article] [PubMed] [Google Scholar]
- [75].Schuett BS, Millar TJ. Lipid component contributions to the surface activity of meibomian lipids. Invest Ophthalmol Vis Sci 2012;53:7208–19. [DOI] [PubMed] [Google Scholar]
- [76].Sledge SM, Khimji H, Borchman D, Oliver AL, Michael H, Dennis EK, et al. Evaporation and hydrocarbon chain conformation of surface lipid films. Ocul Surf 2016;14:447–59. [DOI] [PMC free article] [PubMed] [Google Scholar]
- [77].Rantamaki AH, Javanainen M, Vattulainen I, Holopainen JM. Do lipids retard the evaporation of the tear fluid? Invest Ophthalmol Vis Sci 2012;53:6442–7. [DOI] [PubMed] [Google Scholar]
- [78].Schuett BS, Millar TJ. An investigation of the likely role of (O-acyl) ω-hydroxy fatty acids in meibomian lipid films using (O-oleyl) ω-hydroxy palmitic acid as a model. Exp Eye Res 2013;115:57–64. [DOI] [PubMed] [Google Scholar]
- [79].Shine WE, McCulley JP. Polar lipids in human meibomian gland secretions. Curr Eye Res 2003;26:89–94. [DOI] [PubMed] [Google Scholar]
- [80].Paananen RO, Viitaja T, Olzynska A, Ekholm FS, Moilanen J, Cwiklik L. Interactions of polar lipids with cholesteryl ester multilayers elucidate tear film lipid layer structure. Ocul Surf 2020;18:545–53. [DOI] [PubMed] [Google Scholar]
- [81].Kulovesi P, Telenius J, Koivuniemi A, Brezesinski G, Vattulainen I, Holopainen JM. The impact of lipid composition on the stability of the tear fluid lipid layer. Soft Matter 2012;8:5826–34. [Google Scholar]


