

Abstract
Background:
Social determinants of health are implicated in the geographic variation in cardiovascular diseases (CVDs). The social vulnerability index (SVI) is an estimate of a neighborhood’s potential for deleterious outcomes when faced with natural disasters or disease outbreaks. We sought to investigate the association of the SVI with cardiovascular risk factors and the prevalence of coronary heart disease (CHD) in the United States at the census tract level.
Methods:
We linked census tract SVI with prevalence of census tract CVD risk factors (smoking, high cholesterol, diabetes, high blood pressure, low physical activity and obesity), and prevalence of CHD obtained from the behavioral risk factor surveillance system. We evaluated the association between SVI, its sub-scales, CVD risk factors and CHD prevalence using linear regression.
Results:
Among 72,173 census tracts, prevalence of all cardiovascular risk factors increased linearly with SVI. A higher SVI was associated with a higher CHD prevalence (R2=0.17, P<0.0001). The relationship between SVI and CHD was stronger when accounting for census-tract median age (R2=0.57, P<0.0001). A multivariable linear regression model including 4 SVI themes separately explained considerably more variation in CHD prevalence than the composite SVI alone (50.0% vs 17.3%). Socioeconomic status and household composition and disability were the SVI themes most closely associated with cardiovascular risk factors and CHD prevalence.
Conclusions:
In the United States, social vulnerability can explain significant portion of geographic variation in CHD and its risk factors. Neighborhoods with high social vulnerability are at disproportionately increased risk of CHD and its risk factors.
Keywords: social vulnerability, disparities, cardiovascular risk factors, coronary heart disease
CONDENSED ABSTRACT
Social determinants of health are implicated in the geographic variation in cardiovascular diseases (CVDs). We investigated the association of social vulnerability index (SVI) with cardiovascular risk factors and the prevalence of coronary heart disease (CHD) in the United States at the census tract level. We show that cardiovascular risk factors and CHD were more common with higher SVI. A multivariable linear regression model including 4 SVI themes separately explained considerably more variation in CHD prevalence than the composite SVI alone (50.0% vs 17.3%). Socioeconomic status and household composition/disability were the SVI themes most closely associated with cardiovascular risk factors and CHD prevalence.
INTRODUCTION
Coronary heart disease (CHD) is a significant source of morbidity and mortality in the United States. Roughly, 6.7% of US adults above the age of 65 have CHD, which resulted in the deaths of 365,914 people in 2017(1). There is substantial geographic variation in CHD across the United States. This geographic variation is only partly accounted for by the prevalence of traditional risk factors such as physical inactivity and smoking(2). The important role of socioeconomic status in explaining cardiovascular disease mortality patterns across US counties has been implicated in prior studies(3-5). Socioeconomic status is a complex construct referring to an individual or communities’ financial status, educational attainment level, employment, and neighborhood environment, and is strongly associated with CHD(6).
There is increasing interest in environmental factors beyond socioeconomic status that may play a role in influencing community-level vulnerability to poor health outcomes. The Center for Disease Control (CDC) defines social vulnerability as the characteristics of a community that increase the potential for deleterious outcomes when faced with natural disasters or disease outbreaks. The CDC’s Social Vulnerability Index (SVI) is an integrated metric characterized by four themes: socioeconomic status, household composition and disability, minority status and language, and housing type and transportation(7). Importantly, the SVI can be measured at multiple levels of geography, including the census tract level. While US counties contain large and diverse populations with potentially heterogenous environments, census tracts can provide a higher resolution of neighborhoods and communities with potentially more homogenous risk factor profile and outcomes. We sought to explore the degree to which SVI, and its individual themes, explains the variability of CHD prevalence across communities in the United States.
METHODS
CHD and Risk Factor Estimates:
The census tract was the unit of analysis for this study. Census tract-level crude CHD prevalence estimates from 2018 were obtained from CDC utilizing behavioral risk factor surveillance system data (BRFSS), which employs recurrent telephone surveys to collect data on health-related risk behaviors, chronic health conditions, and use of preventive services among US adults. The BRFSS is designed to be representative at the state level. Similarly, risk factor prevalence of high blood pressure, current smoking, high cholesterol, physical inactivity, diabetes, and obesity were obtained from BRFSS. Prevalence is estimated based on self-reported survey data of adults at least 18 years of age. Age-adjusted rates are not available at the census tract level since some census tracts are missing age ranges.
Social Vulnerability Index:
The CDC Social vulnerability Index (SVI) was originally developed to identify vulnerability in the context of disaster management, but has been applied across multiple healthcare contexts including COVID-19 and surgical outcomes(8,9). The SVI is available at the census tract level and is derived from Census indicators. Percentiles for each of the Census indicators within a theme are summed and the sum of these variables is ranked to determine an overall census tract percentile for each theme. To generate an overall theme ranking, theme percentiles are summed and ranked to determine a census tract percentile for the overall SVI.
The following dimensions are used in calculating the SVI: socioeconomic status (SES), household composition and disability, minority status and language, and housing type and transportation. The SES theme is derived from the percentage of persons living below the poverty line, percentage unemployment, per capita income, and percentage of persons aged 25 and above without a high school diploma. The household composition and disability dimension is derived from the percentages of: persons aged 65 years and older, persons aged 17 years and younger, civilian non-institutionalized populations with a disability older 5 years of age, and single parent households with a child younger than 18 years. The minority status and language dimension is derived from the percentage of all persons except non-Hispanic white and the percentage of persons aged 5+ years who speak English “less than well.” Finally, the housing type and transportation dimension is derived from percentages of: housing structures with 10 or more units, mobile home estimates, occupied housing units with more people than rooms (crowding), households with no vehicle available, individuals living in group quartiers.
Urban-rural Classification
An urban-rural analysis was included to determine whether the relationship between SVI and CHD is dependent on urbanicity. The Urban-rural classification was obtained from 2010 American Community Survey data. An urban population within a census tract is defined as either composing an urban cluster (2,500 to 50,000 people total) or an urbanized area (greater than 50,000 people). A rural population is the population not residing in either an urbanized area or an urban cluster. Rural census tracts were those in which greater than 50% of the census tract population was rural.
Statistical Analysis:
Census tracts were divided into SVI quartiles: 1-25, 25-50, 50-75, and 75-100. Census tract demographics by quartile of SVI obtained from American Community Survey were compared using means (standard deviation) and analysis of variance (ANOVA) statistical testing. Linear regression analyses were utilized to evaluate the association between CHD and SVI as well as between CHD and each SVI dimension: SES, household composition and disability, minority status and language, and housing type and transportation. Census tract median age was included in regression analyses to account for differences in census tract age that may influence CHD prevalence. Cardiovascular risk factors were included in analyses to understand the independent effect of SVI and each of its dimensions. Data were screened for missing or out of range values and distributions of continuous variables were inspected for normality. All analyses were performed in R (R project, Austria).
RESULTS
A total of 72,173 census tracts were analyzed with a population of 308,243,060 people. There was substantial variation in CHD and SVI across all census tracts (Figure 1). Table 1 shows characteristics of census tracts by SVI.
Figure 1:

Geographic distribution of social vulnerability index and prevalence of coronary heart disease.
Table 1:
Characteristics of census tracts by quartile of Social Vulnerability Index (SVI).
| Social Vulnerability Index (SVI) | |||||
|---|---|---|---|---|---|
| Quartile 1: 1-25 (n=18,025) |
Quartile 2: 25-50 (n=18,038 |
Quartile 3: 50-75 (n=18,045) |
Quartile 4: 75-100 (n=18,035) |
||
| Demographics | Population | 4294 (2035) | 4360 (2040) | 4272 (1872) | 4166 (1807) |
| Age (years) | 42 (7.6) | 40.4 (7.7) | 38.5 (7.1) | 34.4 (6.3) | |
| Sex (%) | 50.6 (3.8) | 50.7 (3.9) | 50.8 (4.5) | 51.2 (4.7) | |
| White (%) | 85.6 (14) | 80.4 (18.9) | 71.6 (24.6) | 53.3 (28.2) | |
| Black or African American (%) | 4.8 (8.8) | 8.3 (13.9) | 14.9 (21.7) | 27.9 (29.9) | |
| Asian (%) | 5.3 (8.3) | 5.2 (9.7) | 4.9 (10) | 3.9 (8.8) | |
| Hispanic or Latino (%) | 3.7 (5.6) | 6.2 (9.6) | 10.9 (16.4) | 23.5 (27.7) | |
| Socioeconomic Status | Poverty (%) | 5.6 (4.4) | 10.6 (7.2) | 16.6 (8.8) | 28.1 (11.3) |
| Unemployment (%) | 3.6 (2.2) | 4.9 (2.7) | 6.6 (3.8) | 10.3 (5.7) | |
| Per Capita Income ($) | 48751.9 (19872.2) | 34975 (12638.9) | 26688.9 (7640.8) | 18927.1 (5250.7) | |
| No High School Diploma (%) | 4.4 (3.1) | 8.5 (4.7) | 14.1 (7.1) | 24.9 (11.1) | |
| Household Composition & Disability | Age ≥ 65 (%) | 17.3 (9.3) | 17.4 (8.3) | 16.1 (7.2) | 13.2 (5.9) |
| Age ≤ 17 (%) | 21 (6.4) | 20.3 (5.9) | 21.4 (6) | 25.9 (6.4) | |
| Disability (%) | 9.5 (3.8) | 12.7 (4.6) | 15 (5.6) | 16.2 (6.2) | |
| Single Parent (%) | 4.9 (3.3) | 6.9 (3.8) | 9.6 (4.9) | 15.6 (7.1) | |
| Minority Status & Language | Minority (%) | 19.4 (16) | 26.7 (21.8) | 39.3 (28) | 67.8 (26.8) |
| No English Language (%) | 1.1 (1.5) | 2.1 (3) | 4.1 (5.8) | 9.3 (10) | |
| Housing & Transportation | Multiple Housing Units (%) | 8.4 (16.1) | 11.7 (18.1) | 12.7 (18.5) | 16.6 (20.3) |
| Mobile Home (%) | 2.1 (5.1) | 6 (9.8) | 8.7 (12.7) | 7.3 (12.3) | |
| Crowding (%) | 0.9 (1.3) | 2 (2.3) | 3.7 (4.1) | 7.7 (7.5) | |
| No Vehicle (%) | 3.6 (7) | 6.3 (8.6) | 9.7 (10.7) | 18 (15.7) | |
| Group Quarters (%) | 1.3 (7.5) | 2.3 (8.3) | 3 (9.4) | 3.1 (7.4) | |
All data is displayed as means (standard deviation). All means compared by analysis of variance (ANOVA) and found to have p-value <0.0001.
Cardiovascular risk factors were more common in higher SVI census tracts. Specifically, mean (standard deviation) prevalence across SVI quartiles was substantially higher for diabetes [Quartile 1: 8.5 (2.1), Quartile 2: 9.9 (2.4), Quartile 3: 11.7 (2.9), Quartile 4: 14.9 (3.8); P-value <0.0001], current smoking [Quartile 1: 13.7 (3.8), Quartile 2: 16.9 (4.5), Quartile 3: 19.6 (5.0), Quartile 4: 22.9 (5.6); P-value <0.0001], and low physical activity [Quartile 1: 18.6 (4.2), Quartile 2: 9.9 (22.7), Quartile 3: 27.0 (5.4), Quartile 4: 33.5 (6.4); P-value <0.0001]. Differences in mean (standard deviation) prevalence across SVI quartiles of obesity [Quartile 1: 27.5 (4.9), Quartile 2: 30.2 (5.5), Quartile 3: 33.1 (5.8), Quartile 4: 37.7 (6.5); P-value <0.0001] and high blood pressure [Quartile 1: 28.8 (5.8), Quartile 2: 31.1 (6.3), Quartile 3: 33.4 (6.9), Quartile 4: 36.2 (7.7); P-value <0.0001] were also greater but less so than diabetes, current smoking and low physical activity. The prevalence of high cholesterol across SVI quartiles was similar in magnitude [Quartile 1: 32.6 (4.8), Quartile 2: 33.2 (5.1), Quartile 3: 33.9 (5.0), Quartile 4: 34.0 (4.0); P-value <0.0001] (Figure 2). Similar differences were observed for cardiovascular risk factors across SVI themes (Supplementary Figure 1).
Figure 2:

Social vulnerability index quartiles and cardiovascular risk factors.
High blood pressure: β=2.46 (0.02), R2= 0.14. Diabetes: β=2.10 (0.01), R2=0.39. Current smoking: β=3.04 (0.016), R2= 0.34. High cholesterol: β=0.47 (0.02), R2 = 0.01. Low Physical Activity: β=4.93 (0.02), R2= 0.52. Obesity: β=3.36 (0.019), R2= 0.30.
The mean (standard deviation) prevalence (%) of CHD was higher across the SVI quartiles [Quartile 1: 5.4 (1.7), Quartile 2: 6.3 (2.0), Quartile 3: 7.1 (2.1), Quartile 4: 7.8 (2.2); P-value <0.0001]. To assess the relationship between SVI and CHD prevalence, we performed a bivariate linear regression analysis. SVI was associated with CHD prevalence (β = 0.0317, SE = 0.0003, P-value<0.0001; Figure 2) accounting for 17.34% of the variance. The relationship between SVI and CHD remained significant when accounting for census tract median age (β = 0.0520, SE = 0.0008, P-value<0.0001) accounting for 57.45% of the variance. Census tract median age alone was significantly associated with CHD prevalence (β = 0.1263, SE = 0.0011, P-value<0.0001) accounting for 19.04% of the variance. When examining only rural census tracts (n=11,668), SVI was associated with CHD prevalence (β = 0.0403, SE = 0.0005, P-value<0.0001) accounting for 32.09% of the variance and remained significant when adjusting for census tract median age (β = 0.0503, SE = 0.0005, P-value<0.0001) accounting for 49.13% of the variance (Supplementary Figure 2).
Examination of associations of each dimension with CHD showed differences in CHD prevalence across SVI themes. The mean (standard deviation) prevalence (%) of CHD was significantly different across quartiles of SVI themes: Socioeconomic Status [Quartile 1: 5.4 (1.6), Quartile 2: 6.3 (1.9), Quartile 3: 7.1 (2.1), Quartile 4: 7.9 (2.3); P-value <0.0001], Household Composition and Disability [Quartile 1: 4.8 (1.4), Quartile 2: 6.2 (1.4), Quartile 3: 7.2 (1.9), Quartile 4: 8.4 (1.8); P-value <0.0001], Minority Status and Language [Quartile 1: 7.4 (2.0), Quartile 2: 6.7 (2.3), Quartile 3: 6.3 (2.3), Quartile 4: 6.3 (2.0); P-value <0.0001], and Housing and Transportation [Quartile 1: 5.9 (1.9), Quartile 2: 6.6 (2.1), Quartile 3: 6.9 (2.2), Quartile 4: 7.2 (2.4); P-value <0.0001] (Supplementary Figure 3).
Bivariate regression analyses were used to assess the relationship between individual themes of SVI and CHD prevalence. There was a significant association between SES and CHD as well as between household composition and disability and CHD, explaining 20.4% and 40.8% of the census tract variability in CHD prevalence, respectively. The relationships were not significant between minority status and language with CHD and between housing and transportation with CHD (Table 3; Supplementary Figure 4). A multivariable linear regression model including all SVI themes explained considerably more census tract variation in CHD prevalence than SVI alone (50.0% vs 17.3%). SES adjusted for median census tract age explained roughly 65% of the variability in census tract CHD prevalence. Though household composition and disability include age related variables, the SVI theme remained significant when adjusting for median age. The weak association between housing and transportation improved when adjusting for census tract median age. Minority status and language had no meaningful improvement in R2 above median age alone (Table 2).
Table 2:
Linear Regression analyses of social vulnerability index (SVI) themes and coronary heart disease (CHD) prevalence (%).
| Unadjusted for Median Age | |||||
|---|---|---|---|---|---|
| Theme | Beta | SE | R2 | P-value | |
| Univariate | Socioeconomic Status | 0.0343 | 0.0003 | 0.20 | <0.0001 |
| Household Composition & Disability | 0.0486 | 0.0002 | 0.41 | <0.0001 | |
| Minority Status & Language | −0.0145 | 0.0003 | 0.04 | <0.0001 | |
| Housing & Transportation | 0.0163 | 0.0003 | 0.05 | <0.0001 | |
| Multivariate | Socioeconomic Status | 0.0236 | 0.0003 | 0.50 | <0.0001 |
| Household Composition & Disability | 0.0343 | 0.0003 | <0.0001 | ||
| Minority Status & Language | −0.0252 | 0.0002 | <0.0001 | ||
| Housing & Transportation | 0.0030 | 0.0002 | <0.0001 | ||
| Adjusted for Median Age | |||||
| Theme | Beta | SE | R2 | P-value | |
| Bivariate | Socioeconomic Status | 0.0571 | 0.0002 | 0.65 | <0.0001 |
| Household Composition & Disability | 0.0489 | 0.0002 | 0.59 | <0.0001 | |
| Minority Status & Language | −0.0014 | 0.0003 | 0.19 | <0.0001 | |
| Housing & Transportation | 0.1541 | 0.0010 | 0.31 | <0.0001 | |
| Multivariate | Socioeconomic Status | 0.0427 | 0.0003 | 0.74 | <0.0001 |
| Household Composition & Disability | 0.0232 | 0.0002 | <0.0001 | ||
| Minority Status & Language | −0.0139 | 0.0002 | <0.0001 | ||
| Housing & Transportation | 0.0050 | 0.0002 | <0.0001 | ||
Univariate linear regression models unadjusted for median age contain only the SVI theme as the independent variable. The multivariate linear regression unadjusted for age contains all SVI themes. The bivariate linear regressions are the individual SVI themes adjusted for age with census tract median age. The Multivariate linear regression adjusted for age includes all SVI themes and median age. The R2 displayed are for the whole model.
To evaluate the independent association of SVI with census tract CHD prevalence, a multiple linear regression was generated with SVI and cardiovascular risk factors (obesity, low physical activity, smoking, high cholesterol, hypertension, and diabetes). SVI was significantly associated with CHD prevalence (β = 0.0050, SE = 0.0002, P-value<0.0001) with the model explaining 87.7% of the census tract variation in CHD. The relationship between SVI and CHD prevalence remained statistically significant when adjusting for census tract median age (β = 0.0075, SE = 0.0002, R2=0.8905, P-value<0.0001). Cardiovascular risk factors alone explained approximately 88.7% and 87.6% with and without census tract median age, respectively (Supplemental Table 1).
DISCUSSION
In this investigation of SVI, 4 dimensions which predispose communities to adverse outcomes in the face of disaster or disease, we find that SVI and its dimensions are (1) associated with cardiovascular risk factors by census tract and (2) associated with CHD prevalence by census tract—even when adjusting for census tract median age, and (3) variation in themes of SVI explain 50% of the variability in census-tract CHD prevalence.
There is a robust body of literature where a number of factors related to economic well-being, employment status, neighborhood environment, and educational attainment associated with cardiovascular disease prevalence and outcomes at the individual level have been identified(10-19) and the community level(4,20,21). Integrated metrics of community distress and socioeconomic status have also been linked to cardiovascular disease(4,18-20). However, in prior studies where the relationship between measures of community vulnerability and prevalence of cardiovascular disease have been examined are based on considerably larger geographic regions such as counties which limits the degree of precision when estimating the impact of these non-traditional risk factors. This work demonstrates that integrated metrics of social vulnerability can be used to model the variation in prevalence of CHD across the United States regardless of urbanization. Furthermore, we show that SVI is significantly correlated with the prevalence of specific cardiovascular risk factors such as low physical activity, diabetes, and smoking but less associated with other risk factors such as high cholesterol. This finding exemplifies the difference between susceptibility and vulnerability: living in high SVI communities may not alter someone’s inherent physical risk to CHD (susceptibility) but may foster high risk behaviors that potentiate the development of CHD such as smoking. Indeed, a body of evidence exists linking unhealthy behaviors with residency in communities of low socioeconomic status (22).
The use of census tract data greatly enhances the precision of community vulnerability estimates. Prior researchers have used county level data to understand the relationship between socioeconomics and cardiovascular disease. However, counties represent large geographic areas with substantial heterogeneity in community composition. Thus, misappropriation of vulnerability characteristics is a major limitation with analyses of large geographic areas. This study is novel in that newly available census tract data are used to provide an improved assessment of community vulnerability to cardiovascular disease. The use of community socioeconomic status metrics may modify the individual cardiovascular risk estimate. Indeed, it has been demonstrated in prior studies that there is a modification in cardiovascular risk prediction by neighborhood socioeconomic status(23). As such, precision in estimating community vulnerability characteristics is essential to improve the understanding of how socioeconomic context may modify individual cardiovascular risk.
A number of individual factors and integrated metrics have been utilized to understand community vulnerability. The SVI, which is used by the CDC to allocate resources in natural disaster or health crisis, is unique in that it is composed of multiple dimensions which we independently tested. We demonstrate that independent weighting of these dimensions through a multivariable linear regression explains more variability in CHD prevalence than SVI alone. Additionally, we show that amongst these dimensions, socioeconomic status and household composition and disability have the greatest association to CHD prevalence. Socioeconomic status explains most of the effect of SVI, particularly when adjusted for median age. Though household composition and disability contain age related factors, this dimension is also enhanced by adjustment for census tract median age implying that some of its effect may be related to single parent households and disability.
There are a number of limitations with this work including use of survey data to estimate prevalence, inability to adjust CHD prevalence by age, and incomplete adjustment for all cardiovascular risk factors. Nevertheless, the rigorous survey methods and use of small population census tract data are relative strengths.
Despite the limitations of this study, these findings have important implications for policy, resource allocation and patient care. First, SVI provides an integrated metric of neighborhood vulnerability, and thus it is important to focus public health initiatives in neighborhoods with high SVI. These may include targeted health assessments, community-health worker screening and treatments, improving access to care, reducing environmental exposures, all of which have been shown to reduce CV risk(24-27). The association between SVI and CHD prevalence and risk factors at the census-tract level suggests that incorporating SVI into cardiovascular risk assessment tools should be investigated to predict risk at the individual level. If SVI modifies the predictability of traditional risk scores (e.g., pooled cohort equation) to predict atherosclerosis risk, electronic medical record systems can be utilized to geocode patient addresses and map them onto census tract data which can be used for risk prediction. In fact, the pooled cohort equation had lower predictive power in patients living in deprived neighborhoods based on a recent study(28). Additionally, it is important to understand whether traditional cardiovascular interventions (e.g., cholesterol lowering, blood pressure lowering, etc) are modified by SVI. Some interventions may have limited efficacy in socioeconomically disadvantaged patients(27). While other therapies may have an exaggerated effectiveness in patients with lower SVI. For example, we have recently shown that the cardiovascular benefit of intensive blood pressure lowering is modified by environmental exposures, which are known to disproportionately impact socioeconomically disadvantaged neighborhoods(29). It is thus important to understand effectiveness of traditional CV risk factor control in these communities, and to understand the social/cultural factors, healthcare access and other related factors to address cardiovascular health equity.
In conclusion, SVI and its 4 dimensions are significantly associated with cardiovascular risk factors and CHD prevalence by census tract, even when adjusting for census tract median age. Future researchers should explore the utility of SVI for multilevel CVD risk prediction.
Supplementary Material
Figure 3:
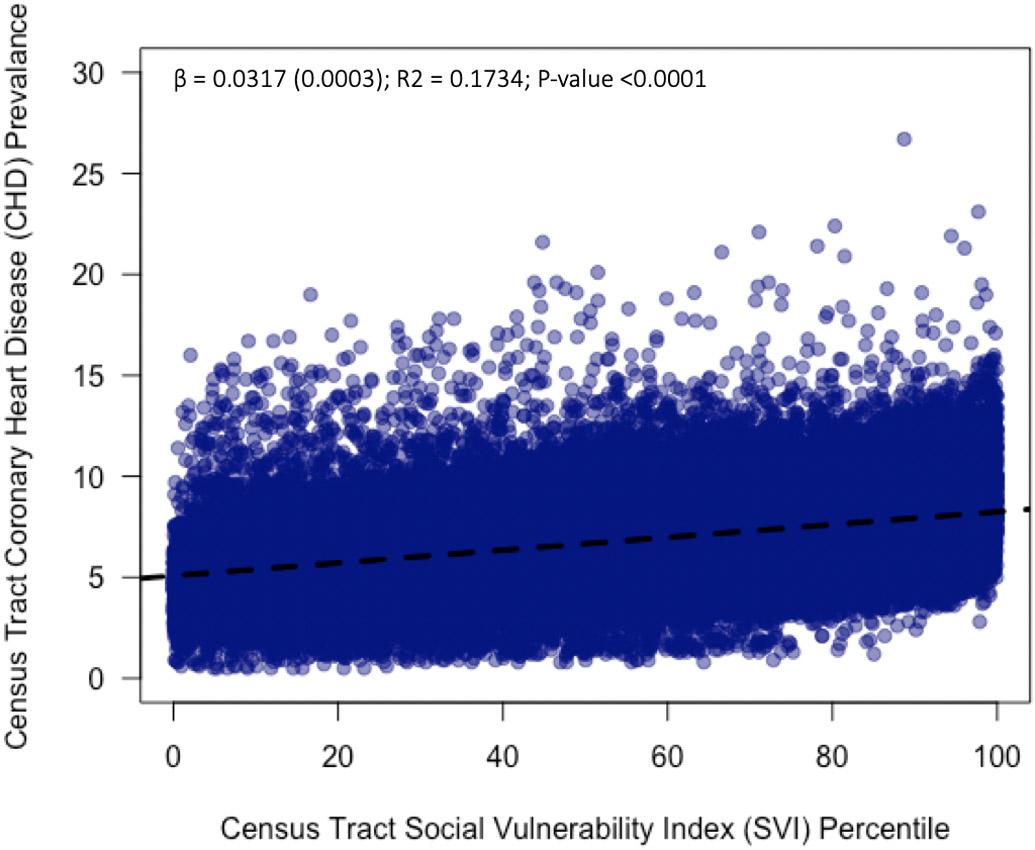
Scatter plot of census tract Social Vulnerability Index (SVI) percentile and census tract prevalence of coronary heart disease (CHD). A univariate linear regression was fitted to the data.
Funding:
This study was partly funded by NIHMD Grant P50MD017351
Footnotes
Disclosures: None of the authors have conflicts of interest pertinent to the contents of this manuscript.
REFERENCES
- 1.Benjamin EJ, Muntner P, Alonso A et al. Heart Disease and Stroke Statistics-2019 Update: A Report From the American Heart Association. Circulation 2019;139:e56–e528. [DOI] [PubMed] [Google Scholar]
- 2.Casper M, Kramer MR, Quick H, Schieb LJ, Vaughan AS, Greer S. Changes in the Geographic Patterns of Heart Disease Mortality in the United States. Circulation 2016;133:1171–1180. [DOI] [PMC free article] [PubMed] [Google Scholar]
- 3.Bevan GH, Freedman DA, Lee EK, Rajagopalan S, Al-Kindi SG. Association between Ambient Air Pollution and County-Level Cardiovascular Mortality in the United States by Social Deprivation Index. American heart journal 2021. [DOI] [PubMed] [Google Scholar]
- 4.Bevan GH, Josephson R, Al-Kindi SG. Socioeconomic Deprivation and Heart Failure Mortality in the United States. J Card Fail 2020. [DOI] [PubMed] [Google Scholar]
- 5.Hamad R, Penko J, Kazi DS et al. Association of low socioeconomic status with premature coronary heart disease in US adults. JAMA cardiology 2020;5:899–908. [DOI] [PMC free article] [PubMed] [Google Scholar]
- 6.Schultz WM, Kelli HM, Lisko JC et al. Socioeconomic Status and Cardiovascular Outcomes. Circulation 2018;137:2166–2178. [DOI] [PMC free article] [PubMed] [Google Scholar]
- 7.Flanagan BE, Hallisey EJ, Adams E, Lavery A. Measuring Community Vulnerability to Natural and Anthropogenic Hazards: The Centers for Disease Control and Prevention's Social Vulnerability Index. J Environ Health 2018;80:34–36. [PMC free article] [PubMed] [Google Scholar]
- 8.Bilal U, Tabb LP, Barber S, Diez Roux AV. Spatial Inequities in COVID-19 Testing, Positivity, Confirmed Cases, and Mortality in 3 U.S. Cities : An Ecological Study. Ann Intern Med 2021. [DOI] [PMC free article] [PubMed] [Google Scholar]
- 9.Hyer JM, Tsilimigras DI, Diaz A et al. High Social Vulnerability and "Textbook Outcomes" after Cancer Operation. J Am Coll Surg 2021;232:351–359. [DOI] [PubMed] [Google Scholar]
- 10.Kucharska-Newton AM, Harald K, Rosamond WD, Rose KM, Rea TD, Salomaa V. Socioeconomic indicators and the risk of acute coronary heart disease events: comparison of population-based data from the United States and Finland. Ann Epidemiol 2011;21:572–9. [DOI] [PMC free article] [PubMed] [Google Scholar]
- 11.Yong CM, Abnousi F, Asch SM, Heidenreich PA. Socioeconomic inequalities in quality of care and outcomes among patients with acute coronary syndrome in the modern era of drug eluting stents. Journal of the American Heart Association 2014;3:e001029. [DOI] [PMC free article] [PubMed] [Google Scholar]
- 12.Elfassy T, Swift SL, Glymour MM et al. Associations of Income Volatility With Incident Cardiovascular Disease and All-Cause Mortality in a US Cohort. Circulation 2019;139:850–859. [DOI] [PMC free article] [PubMed] [Google Scholar]
- 13.Kelli HM, Hammadah M, Ahmed H et al. Association Between Living in Food Deserts and Cardiovascular Risk. Circ Cardiovasc Qual Outcomes 2017;10. [DOI] [PMC free article] [PubMed] [Google Scholar]
- 14.Kelli HM, Mehta A, Tahhan AS et al. Low Educational Attainment is a Predictor of Adverse Outcomes in Patients With Coronary Artery Disease. Journal of the American Heart Association 2019;8:e013165. [DOI] [PMC free article] [PubMed] [Google Scholar]
- 15.Kubota Y, Heiss G, MacLehose RF, Roetker NS, Folsom AR. Association of Educational Attainment With Lifetime Risk of Cardiovascular Disease: The Atherosclerosis Risk in Communities Study. JAMA Intern Med 2017;177:1165–1172. [DOI] [PMC free article] [PubMed] [Google Scholar]
- 16.Mehta RH, O'Shea JC, Stebbins AL et al. Association of mortality with years of education in patients with ST-segment elevation myocardial infarction treated with fibrinolysis. Journal of the American College of Cardiology 2011;57:138–46. [DOI] [PubMed] [Google Scholar]
- 17.Carson AP, Rose KM, Catellier DJ, Diez-Roux AV, Muntaner C, Wyatt SB. Employment status, coronary heart disease, and stroke among women. Ann Epidemiol 2009;19:630–6. [DOI] [PMC free article] [PubMed] [Google Scholar]
- 18.Topel ML, Kim JH, Mujahid MS et al. Neighborhood Socioeconomic Status and Adverse Outcomes in Patients With Cardiovascular Disease. The American journal of cardiology 2019;123:284–290. [DOI] [PMC free article] [PubMed] [Google Scholar]
- 19.Kim D, Diez Roux AV, Kiefe CI, Kawachi I, Liu K. Do neighborhood socioeconomic deprivation and low social cohesion predict coronary calcification?: the CARDIA study. Am J Epidemiol 2010;172:288–98. [DOI] [PMC free article] [PubMed] [Google Scholar]
- 20.Khatana SAM, Venkataramani AS, Nathan AS et al. Association Between County-Level Change in Economic Prosperity and Change in Cardiovascular Mortality Among Middle-aged US Adults. JAMA : the journal of the American Medical Association 2021;325:445–453. [DOI] [PMC free article] [PubMed] [Google Scholar]
- 21.Bashinskaya B, Nahed BV, Walcott BP, Coumans JV, Onuma OK. Socioeconomic status correlates with the prevalence of advanced coronary artery disease in the United States. PLoS One 2012;7:e46314. [DOI] [PMC free article] [PubMed] [Google Scholar]
- 22.Pampel FC, Krueger PM, Denney JT. Socioeconomic Disparities in Health Behaviors. Annu Rev Sociol 2010;36:349–370. [DOI] [PMC free article] [PubMed] [Google Scholar]
- 23.Dalton JE, Perzynski AT, Zidar DA et al. Accuracy of Cardiovascular Risk Prediction Varies by Neighborhood Socioeconomic Position: A Retrospective Cohort Study. Ann Intern Med 2017;167:456–464. [DOI] [PMC free article] [PubMed] [Google Scholar]
- 24.Walton-Moss B, Samuel L, Nguyen TH, Commodore-Mensah Y, Hayat MJ, Szanton SL. Community based cardiovascular health interventions in vulnerable populations: a systematic review. The Journal of cardiovascular nursing 2014;29:293. [DOI] [PMC free article] [PubMed] [Google Scholar]
- 25.Rajagopalan S, Al-Kindi SG, Brook RD. Air Pollution and Cardiovascular Disease: JACC State-of-the-Art Review. J Am Coll Cardiol 2018;72:2054–2070. [DOI] [PubMed] [Google Scholar]
- 26.Yeager RA, Smith TR, Bhatnagar A. Green environments and cardiovascular health. Trends in cardiovascular medicine 2020;30:241–246. [DOI] [PMC free article] [PubMed] [Google Scholar]
- 27.Schultz WM, Kelli HM, Lisko JC et al. Socioeconomic status and cardiovascular outcomes: challenges and interventions. Circulation 2018;137:2166–2178. [DOI] [PMC free article] [PubMed] [Google Scholar]
- 28.Dalton JE, Perzynski AT, Zidar DA et al. Accuracy of cardiovascular risk prediction varies by neighborhood socioeconomic position: a retrospective cohort study. Annals of internal medicine 2017;167:456–464. [DOI] [PMC free article] [PubMed] [Google Scholar]
- 29.Al-Kindi SG, Brook RD, Bhatt U et al. The Benefits of Intensive Versus Standard Blood Pressure Treatment According to Fine Particulate Matter Air Pollution Exposure: A Post Hoc Analysis of SPRINT. Hypertension 2021;77:813–822. [DOI] [PMC free article] [PubMed] [Google Scholar]
Associated Data
This section collects any data citations, data availability statements, or supplementary materials included in this article.